Abstract
Indoor air quality typically encompasses the ambient conditions inside buildings and public facilities that may affect both the mental and respiratory health of an individual. Until the COVID-19 outbreak, indoor air quality monitoring was not a focus area for public facilities such as shopping complexes, hospitals, banks, restaurants, educational institutes, and so forth. However, the rapid spread of this virus and its consequent detrimental impacts have brought indoor air quality into the spotlight. In contrast to outdoor air, indoor air is recycled constantly causing it to trap and build up pollutants, which may facilitate the transmission of virus. There are several monitoring solutions which are available commercially, a typical system monitors the air quality using gas and particle sensors. These sensor readings are compared against well known thresholds, subsequently generating alarms when thresholds are violated. However, these systems do not predict the quality of air for future instances, which holds paramount importance for taking timely preemptive actions, especially for COVID-19 actual and potential patients as well as people suffering from acute pulmonary disorders and other health problems. In this regard, we have proposed an indoor air quality monitoring and prediction solution based on the latest Internet of Things (IoT) sensors and machine learning capabilities, providing a platform to measure numerous indoor contaminants. For this purpose, an IoT node consisting of several sensors for 8 pollutants including NH3, CO, NO2, CH4, CO2, PM 2.5 along with the ambient temperature & air humidity is developed. For proof of concept and research purposes, the IoT node is deployed inside a research lab to acquire indoor air data. The proposed system has the capability of reporting the air conditions in real-time to a web portal and mobile app through GSM/WiFi technology and generates alerts after detecting anomalies in the air quality. In order to classify the indoor air quality, several machine learning algorithms have been applied to the recorded data, where the Neural Network (NN) model outperformed all others with an accuracy of 99.1%. For predicting the concentration of each air pollutant and thereafter predicting the overall quality of an indoor environment, Long and Short Term Memory (LSTM) model is applied. This model has shown promising results for predicting the air pollutants’ concentration as well as the overall air quality with an accuracy of 99.37%, precision of 99%, recall of 98%, and F1-score of 99%. The proposed solution offers several advantages including remote monitoring, ease of scalability, real-time status of ambient conditions, and portable hardware, and so forth.
1. Introduction
In the wake of the COVID-19 pandemic, it is crucial to maintain the norms of social distancing and keeping oneself indoors to minimize the odds of catching the virus. The work from home culture has been increasingly adopted leading to increased number of people utilizing the household buildings for longer durations. Such practices can ensure the compliance of COVID-19 standard operating procedures (SOPs) but at the same time they can adversely affect the indoor air quality. Due to the enforcement of lock down, people are now spending 90% of their time indoor, causing the pollutant levels to be as high as 100 times the levels encountered outside [1].
As of today, people’s major concern is to lower the rampant spread of COVID-19 and implementing precautionary measures to ensure that chances of encountering virus are minimised [1]. Scientists around the world are engaged in developing a vaccine for COVID-19 and some successful stories have been published but until now the availability of the vaccines in bulk and its outreach world-wide is not certain. The general recommendations on alleviating the risk of catching COVID-19 mainly emphasizes on hand sanitation, applying disinfectants, wearing masks, and avoiding symptomatic people. However, it is important to assimilate this fact that the virus transmission can occur both through air and from physical contact [1]. In order to minimize the chances of being infected with this disease, it is important to understand and monitor the air quality of enclosed environment (such as home, hospitals, offices, shopping malls, meeting rooms etc.) which are centrally controlled by Heating, Ventilation, and Air Conditioning (HVAC) systems. It is not only the COVID-19 that can be spread through poor indoor conditions, there are other viruses, allergens, and diseases which generally spread through a central HVAC system.
Recently, several research studies have been done to explore the impact of air pollution on raising the susceptibility of COVID-19, which may increase the death ratio [2]. The patients of COVID-19 are more likely to be affected if they inhale the air which contain high concentration of pollutants such as NO, CO, PM 2.5 and so forth. In Reference [3], researchers from the Harvard University, USA, performed an analysis on the environmental data of 3080 countries in USA, which demonstrated the association of air pollutant, PM 2.5, with the COVID-19 vulnerability. Similarly, another study presented in Reference [4] revealed that the contaminated areas with an increased concentration of PM 2.5 particles & NO resulted in the highest number of COVID-19 cases with double mortality rate. The main reason of COVID-19 to be more lethal in the exposure of air pollution is that both are linked with the respiratory system as discussed in Reference [5]. Another study presented in Reference [6] described the facts that if the concentration of PM 2.5 in a country is 15 g/m3, its death ratio caused by COVID-19 will be 4.5 times higher as compared to the country where the concentration of PM 2.5 in 5 g/m3. Hence, it has become more crucial to control the air pollution to minimize the effect of COVID-19 on human life.
High relative humidity can significantly cause an increase in other toxic pollutants and suspend the dust in the air which can lead to respiratory diseases such as Chronic Obstructive Pulmonary Disease (COPD). In order to reduce the air pollution and curb the transmission of this virus through air, it is recommended to maintain relative humidity (RH) upto 40% to 60%. People with these respiratory conditions are at increased risk of catching corona and for these highly vulnerable groups increased monitoring is required [1,7,8]. In order to create a safe indoor air quality conditions, it is important to install the humidification system to complement the optimized ventilation. This would greatly help to lessen the transmission of seasonal flu and reduce economic burden on the government [1].
In addition to maintaining the right levels of humidity, it is vital to observe the CO concentration as well in the closed environment. Due to the adoption of work from home model, people are staying more at home, which eventually increases the emissions of CO indoors. Humans, being the major source of indoor CO, continuously exhale it, and typically remain oblivious of its harmful effects especially in walled environment [8]. The amount of CO breathe out by an individual is trivial, however, its level tends to rise with the increase in number of occupants in a particular setting. Such instances can negatively affect the environment if the supply of fresh air is not well maintained. This can also adversely impact the human health especially those already suffering from respiratory disorders.
Indoor setups such as healthcare units, where the increased number of people in wards and also waiting rooms contribute to raise the levels of CO in these establishments. The number of corona cases are on the rise and maintaining social distancing and acceptable air quality is usually difficult in hospitals and is compromised at the cost of providing medical treatment on high priority to the emergency cases of this pandemic.
The monitoring of CO concentration is crucial owing to the fact that it is a colorless and odorless gas and is invisible to naked eye. Undetected and unmaintained levels of this gas can lead to critical health risks. It is important to optimize the ventilation and allow a continuous flow of fresh air while reducing the indoor air pollutants.
In addition to monitoring CO levels, it is important to observe the levels of Nitrogen dioxide (NO) as well. The interior NO is mainly attributed to the infiltration of ambient NO and the potential indoor combustion sources. The common ambient sources of NO are mainly the vehicle exhausts, and industrial emissions. In most of the public buildings such as hospitals, offices, educational institutes, shopping complexes, hotels and so forth, the common indoor sources of NO are the central HVAC systems, space and water heaters, furnaces and so forth. The NO emissions from these systems are nominal if they are properly vented. However, the NO saturation may reach to alarming levels if the exhausts from these appliances are not effectively vented out of the building [9]. The level of ambient NO varies considerably between buildings as it primarily depends on the factors such as outside air flow or wind direction, the number and frequency of opening of the doors and windows throughout the day, the location and proximity of the building close to highways, commercial roads, residential roads or industrial areas.
Although the lock down has been eased by the governments across various countries, the workplaces such as private offices, educational institutes, software houses are still remotely functional, making the monitoring and management of indoor air quality more important than it was ever before. Additionally places such as shopping malls which were entirely closed during the lock down, are not safe to visit immediately after the lock down release. Due to the closed malls for longer periods with no alternative ventilation mechanism effective other than HVAC systems (which were also powered off), has increased the humidity beyond safe levels, thus creating a favorable environment for the fungus to grow. This has caused the mold to appear on leather goods and fungus in Air Conditioner (AC) ducts. With the openings of these malls and resumption of HVAC systems, the fungus in the ducts of these systems will float in air due to enclosed surrounding and may enter into the visitors’ respiratory tract, irritating their air ways and causing infection.
All of the above health risks are dominating in the current indoor environments largely owing to the absence of indoor air quality monitors in public facilities, where the individuals remain unaware of the quality of air they are consuming. The challenge is to monitor and improve indoor air quality during the pandemic especially with the current restrictions and partial lock down that the COVID-19 has on the citizens. Therefore, it is essential to have an indoor air quality monitoring and analyses system that has a supervisory role for the facility managers, staff members and tenants of the building [7].
For this purpose, we have proposed an indoor air quality monitoring and predictive analytic system by integrating the latest technologies such as IoT and machine learning. The system has a capability of monitoring and reporting the air conditions in real time to a web portal and mobile app. The color coded info graphics help the user to easily understand the status quo of the air quality. The predictive analysis is based on the trend of the pollutants’ data collected over time and predicting their values in near future to promptly take remedial measures. The main contributions & novelties of the proposed system are highlighted below:
- The existing air quality monitoring systems generally monitor PM 2.5 along with temperature and humidity but the proposed system focuses on the multiple air pollutants including Carbon Dioxide (CO), Particulate Matter (PM) 2.5, Nitrogen Dioxide (NO), Carbon Monoxide (CO), Methane (CH), temperature and humidity. The predictive analysis of air quality based on these pollutants make the proposed system more attractive and reliable as compared to the existing systems.
- The web portal is developed which provide real time data of air quality which further helps to compute Air Quality Index (AQI), since time series data of 24 h is required to compute AQI.
- The proposed system provides predictions of air quality in next time stamps which helps to take preemptive actions timely. The existing air quality monitoring systems typically provide status of the air quality & generate alerts accordingly but generally do not provide prediction of air quality for next time instances.
The limitations of this work include the assessment of the indoor air quality in a ubiquitous fashion which entails several IoT nodes to be placed at distance relative to each other. The long term monitoring of air quality is a demand of the indoor workplace as grab sampling or data captured in specific windows would not provide the true indoor ambient assessment of a workplace. This long term data acquisition poses challenges owing to the sensor life time, and calibrations issues.
2. Related Work
In recent times, particularly the developing countries have witnessed tremendous growth in the problem caused by poor air quality. Unfortunately, the awareness regarding this issue is still very low among the citizens. This is mainly attributed to the lack of suitable products available in the local market that can help people to understand the air they are breathing in both (indoor and outdoor) environments. Traditionally, the air quality is measured manually, where a sample of the air is collected from the environment and analyzed in laboratories using specialized equipment such as mass spectrometers, electron mobility spectrometers and X-Ray fluorescence Spectrometers as discussed in References [10,11]. This method has the benefit of being accurate and reliable but it does not provide data in real time. The reporting of data in real time is crucial in events where the air quality decreases substantially and emergency alerts integrated with remedial measures have to be put in place.
Several research have reported that poor indoor air is relatively more lethal than poor outdoor air quality [12,13]. As of today, majority of the rural population residing in developing states are using cheap methods of producing energy for cooking and heating purposes including raw biomass and unmaintained hobs or stoves. These low cost methods are the factors for worsening the indoor air and exposing the occupants of the house to low quality environment leading to poor health conditions [12,13]. However, due to the advancement in technology, these poor and cheap methods of heating are now rapidly being replaced by electric powered heating devices. Considering the significance of indoor air quality there are several studies and platform developed by researchers to combat the poor indoor air quality and a review of several such systems including their architectures is described in References [13,14,15]. In Reference [16], a review of the several factors responsible for NO emission and it’s negative impacts on human respiration have been discussed. The review study investigates how NO levels influence the enclosed environment such as schools and offices and found that NO concentrations in schools and office settings did not comply with World Health Organization (WHO) standards [17].
It was concluded from the review of existing literature that the ambient NO should not be considered the only factor while evaluating the individual exposure to NO. There are other factors as well which significantly contribute to raise NO exposure and adversely affect the human respiratory system. These include opening of building windows during peak hours, or use of appliances which release NO such as central heating systems. In the end, the effective ventilation strategies have been discussed to reduce the levels of indoor NO below WHO guidelines.
In Reference [18], the monitoring of various indoor pollutants which are critical to human health and may become the cause of sick building syndrome has been discussed. This syndrome may affect the skin, eyes and vital body functions including nervous and respiratory systems. The currently available off-the-shelf systems for environment monitoring are very costly and not feasible to deploy in numbers. In addition to this, these systems generally collect random samples for analysis purposes. Nexus to the above, this paper proposed a relatively inexpensive indoor air quality monitoring system for the well-being of the building occupants. The system was developed using Arduino platform for programming, XBee components for communication, sensors (air temperature, humidity, carbon monoxide, carbon dioxide and luminosity) for sensing air quality and a web portal for data management and visualization. The results obtained from the system have shown that the prototype made was effective for indoor air assessment and would be useful for public health units for mitigating the growth and risks of maladies related to poor indoor environmental conditions. Likewise in Reference [19], an IoT based indoor air monitoring system is described which records the air quality data and send it to the web server for visualization and classification purposes. In Reference [20], the infrared sensors have been used to record the temperature of the laboratory which was used for class activities. The infrared sensors provide a contact less approach to measure the temperature of the laboratory to assess the comfort level of the indoor environment. The thermal comfort of a building is mainly dependent on the number of occupants and the concern regarding this comfort may become significant if the number of individuals inside a building increases. This system was based on IoT for real time temperature data transmission to a web portal, where all the temperature readings were archived and retrieved for the purposes of trend analysis. Similarly in Reference [21] a real time indoor air quality system for monitoring laboratory environmental conditions has been proposed, where, the data collection system is based on IoT architecture named iAQ Plus (iAQ+). The proposed system consists of a web portal for data management as well as a mobile app for displaying data and historical analysis of the laboratory air quality. In Reference [22], a smart data transmission strategy has been discussed by applying it on the air quality data set. The optimal use of physical resources is central to IoT based systems, particularly in those settings where data is produced and ingested in voluminous amounts. The large volumes of data surge the requirement for data storage and processing resources. Additionally, the transmission of huge amount of data may clog the network bandwidth which may become critical for applications such as air quality monitoring, where the delayed transmission or loss of important data may lead to critical consequences. The results achieved from the proposed data compression and prioritization technique have shown to reduce latency and minimize loss of critical data.
In Reference [19], an IoT based platform for air quality monitoring is presented along with a web portal and a mobile application to facilitate the user to check the air quality. A device named as ’Smart-Air’ is developed which is comprised of several sensors to collect air quality data including dust, smoke, CO, CO, and temperature-humidity. The collected data is transmitted to the web server using Long term Transmission (LTE) modem for further processing. Similarly, another system to monitor air quality is presented in Reference [23], in which 4 air pollutants are recorded including PM2.5, O, CO & NO. A firebase web application along with the mobile application is developed to visualize the status of air quality. In Reference [24], a proposal to develop IoT based system for air quality monitoring is presented in which three sensors are suggested such as PMSA003, MQ-131 and MICS-6814 which record air pollutants including PM 2.5 & PM 10, Ozone, Carbon Monoxide, NO and Ammonia. The systems presented in References [19,23,24] provide the hardware structure to monitor the air quality but no data processing and analysis is presented.
In developing countries like Pakistan, the environment monitoring units are responsible for observing and tracking the air quality and the spread of pollution data. During 2006–2009, the Japanese International Cooperation Agency (JICA) supported the government of Pakistan to install air quality monitoring systems in five major cities including Islamabad, Lahore, Karachi, Peshawar and Quetta. But due to lack of budget and inadequate maintenance the system network was not managed properly and had to be suspended in 2014. The data collection was infrequent and unreliable and was not analyzed. Additionally, the placement of system in the provincial capitals was criticized as they were not placed in the critical zones of the cities, where the pollution was maximum and the systems were constantly interrupted because of power cut offs [25]. The population of Pakistan is increasing at a staggering rate which also naturally increases the number of vehicles on the road, number of products produced in the industry, the amount of energy generated and so forth. Owing to this, there is a dire need to deploy accurate and reliable automatic air monitoring systems to assess the level and spread of air pollutants in the surrounding and across the country. The motivation of building such a system came from the air quality problems currently faced by the country for the last few years. The metropolitan cities in Pakistan like Lahore, Karachi, and Faisalabad [26,27,28] suffer terribly from low air quality as shown in Figure 1.
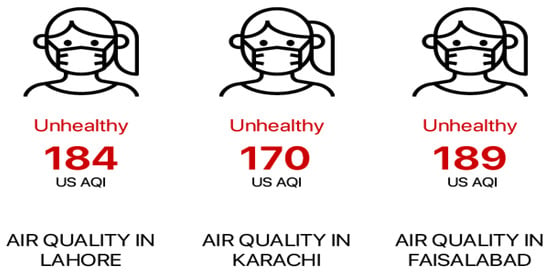
Figure 1.
Air Quality Comparisons in different cities of Pakistan [29].
This poor air quality ultimately gets indoor and impact the ambient conditions inside the buildings such as shopping complexes, hospitals, classrooms, offices and so forth, and may affect human health, and work performance. The monitoring of indoor air quality is important mainly because humans spend most of their time breathing indoor air and in the wake of COVID-19 pandemic its monitoring has become even more significant. As of today, there is no local and indigenous solution available in the local market that could serve the purpose.
Towards such end, we have proposed a solution that can measure a variety of indoor air quality parameters and provide useful information to the individuals to better understand the air they are consuming. The system not only classify the data as health or unhealthy but also forecast the indoor air quality to provide actionable insights. Additionally, it can trigger alerts in response to critical event to take remedial measures. The system can be deployed in the hospitals, shopping malls, gyms, offices, and homes and so forth. In order to realize the proposed system, the internet of things (IoT) nodes based on air quality were developed, which are capable of sensing the presence and concentration of air pollutants and subsequently transmitting the collected data to the web and mobile app through GSM or WiFi technology for data visualizations and further analysis. The proposed system affords several advantages including remote monitoring, ease of scalability, provides real time status of ambient conditions, and a portable hardware and so forth. This allows the system to be deployed in numbers in various parts of the building to acquire the data of the inner premises and classify the air quality within different segments of a building and predict it temporally for mitigating poor air.
3. Proposed System
The major building blocks of the proposed systems are IoT node comprising of air quality sensors, communication module for data transmission, and the local server for archiving data and managing the content of web portal and mobile app. The overall block diagram of the entire system is shown in Figure 2.
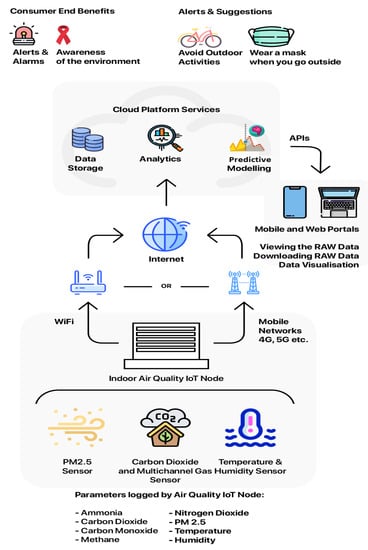
Figure 2.
Architecture of the Proposed System.
The details of the above mentioned building blocks are described below.
3.1. Selection of Indoor Air Quality Parameters
The air pollutants are chosen considering the indoor environment to be monitored by the proposed system. Additionally, the selected air pollutants have more contribution to the air pollution as compared to other such as VOCs, formaldehyde and others. The detail of the selected air pollutants for the proposed indoor air quality monitoring are described below:
- Carbon Dioxide (CO) is considered an air pollutant because of its emissions from increasing number of vehicles on the road. It is a common greenhouse gas which can trap heat in the atmosphere and lead to increased temperatures. CO contributed by other sources can make its way indoors. In addition to this, the building occupants are the main source of exhaling this gas and can be detected with the help of the proposed system [27].
- Particulate Matter (PM) 2.5 is a term used for any particle the width of which is less than 2.5 microns. They are seemingly invisible to the naked eye but can travel further down into the lungs. The short term exposure can cause irritation to eyes and nose and the long term exposure can result in cardiovascular and respiratory diseases. During COVID-19 pandemic, it is important to detect PM 2.5 owing to its negative impact on pulmonary functions [28].
- Nitrogen Dioxide (NO): The long term exposure to NO levels can contribute to a decrease in lung function over time and can increase the risk of respiratory diseases. It has also been known to affect children more and can increase allergic response to the inhaled pollen. Due to the above mentioned reasons it is crucial to measure NO concentration especially during this pandemic [26].
- Carbon Monoxide (CO) is generated primarily when there is a combustible process and the oxygen is in limited amounts. This scenario is very common in households during winters when gas heaters are used. CO is a highly poisonous gas that can be fatal. Therefore, the monitoring of CO in real time can help to avoid unfortunate circumstances [30].
- Methane (CH) is a common constituent of natural gas and widely used for domestic purposes. Sometimes, due to lack of proper management, the gas pipes can leak and create dangerous circumstances which could lead to fire. The sensor used in the proposed system can provide real time data about the concentration of CH indoors.
- Humidity refers to the amount of water vapors in air. In indoor situations humidity can contribute to poor air quality. It supports the growth of microorganisms such as mold and different bacteria can thrive more in humid environment. As of today it is presumed that humidity levels beyond WHO recommendations may facilitate the transmission of COVID-19. For these reasons, it is important to monitor the air humidity indoors [31].
- Temperature: The higher air temperatures can influence the air quality in the sense that it can speed up different reactions that actually contribute to the already polluted air. The proposed system is using a temperature sensor to measure the air temperature in real time with fairly competitive accuracy [31].
3.2. Development of Indoor Ambient Sensing Node
The development of an indoor air quality sensing nodes involves the selection and mounting of sensors on PCB board along with the micro-controller and communication module. The details of the selected sensors and other components are described below:
3.2.1. Sensors
- Grove—Multichannel Gas Sensor: This is a multiple gas sensor that can sense several gases including Carbon Monoxide, Ammonia, Nitrogen Dioxide, and Methane. The concentration of gases is provided in parts per million [32]. This sensor is calibrated using the code provide by the manufacturer (SeeedStudio.com) where sensor is placed in fresh air for almost 30 min as per the given instructions.
- MH-Z19: This sensor is developed by Winsen Sensors and can detects the concentration of Carbon Dioxide in parts per million [33]. This sensor is calibrated by placing it in the open air (CO approx.: 400 ppm) for 20 min and sending commands given in the sensor’s datasheet.
- DHT11: This is a sensor commonly available based on a thermistor and a humidity sensing resistive element. It is used to monitor ambient temperature and humidity [34]. To calibrate this sensor, the temperature & humidity values are measured in an environment with known temperature and humidity and then the offset are computed by comparing the observed values with the true values.
- HM3301 Laser PM 2.5 Sensor: This is an optical sensor that uses the diffraction of laser light in order to calculate the concentration of PM 2.5 in the environment around it [35]. This sensor does not require calibration due to its built-in compensation for temperature and humidity as discussed in Reference [36]
3.2.2. Micro-Controller and Communication Module
- ATmega328P: This micro-controller is selected owing to its low cost, easy availability, and popularity of Arduino development boards. It is a 28-pin micro-controller that runs on 16 MHz external clock which is amply sufficient for our application [37].
- NodeMCU WiFi Chip: NodeMCU is selected as the WiFi chip of choice for the communication of the device with the internet. The micro-controller gathers data from all the sensors and relays it over the WiFi chip which then uploads it to the web portal.
A prototype for indoor air quality monitoring using the above mentioned components is developed where power is externally applied with no battery power. However, the power consumption of the developed indoor air quality node is around 0.75 Watts. An external battery can also be used to supply power for instances a 3000 mAH battery can run the indoor air quality node for 20 h with a single recharge.
3.2.3. PCB Designing and Development
The PCB of the proposed system is designed and developed in-house. It is the base that houses the micro-controller, WiFi chip and the connectors for different sensors. The hardware architecture diagram and the developed IoT node are shown in Figure 3 and Figure 4, however, the PCB schematics is shown in the Appendix A (Figure A1).

Figure 3.
Hardware Architecture of Indoor air quality monitoring node.

Figure 4.
Indoor air quality monitoring node.
3.3. Development of Web Portal and Mobile App for Data Visualization
The web portal developed is the fundamental software infrastructure running on the local server that managed all the incoming data from the hardware nodes. The back-end system continuously listen for the data and archive it into a structured database. The main purpose of web portal development is the data management and visualization where it depicts the incoming data from the network with the help of various info graphics. Additionally, it is useful in accessing the raw values in order to get a detailed view of the all the parameters being reported by the system. Further, a mobile application is developed for the Android platform that displays the data in real time with some supportive info graphics. The screen shots of the web portal and mobile app are shown in the Figure 5, and Figure 6. The color coded values displayed on the web portal and mobile app are indicative of the varying levels of air quality, ranging from safe to unsafe zones. In Figure 6, the number indicates the concentration level of a particular pollutant, whereas its color indicates if it lies in the safe range or unsafe range.
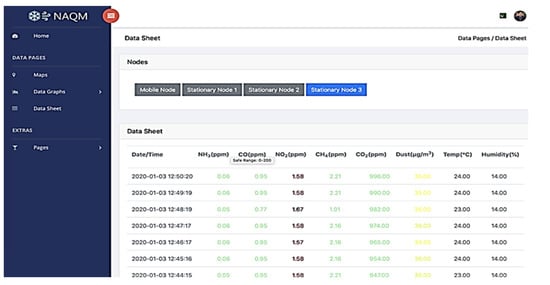
Figure 5.
Web portal showing the data collected from indoor air quality IoT node.
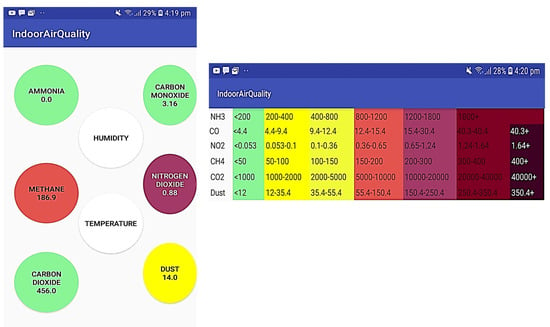
Figure 6.
Screenshots of Mobile app showing color coded data and ranges defining different level of air pollutants (green color represents good air quality whereas dark red color indicate highly dangerous air quality).
4. Methodology
In our proposed system, the air quality data is obtained from IoT node installed inside the IoT lab to monitor indoor environmental conditions. Since several people visit the IoT lab to see a number of IoT projects installed there, hence it is considered suitable to acquire the indoor air quality data. The data from various sensors is generated at a high temporal resolution, which provided rich data for processing and analysis. Subsequently, various machine learning and deep learning algorithms are applied on the acquired data for indoor air quality classification and generating alerts. In order to predict the air quality data for future instances, LSTM learning algorithm is applied and model is validated through test data and comparing it with actual values to determine its reliability. The model performance is tested using the performance measures such as Mean Square Error (MSE), Mean Absolute Error (MAE) and Root Mean Square Error (RMSE). The details of various modules of the proposed system and details of each processing step is described in the following sub sections.
4.1. Data Acquisition
The micro-controller housed inside the IoT node gathers all the data from the sensors, arranges it in the form of a predefined data structures and subsequently transmits the datagram to the WiFi Chip where it is provided with an internet connection either using the pre-existing WiFi infrastructure or GSM WiFi dongles. The WiFi module is connected with the web service deployed in the local server and transferred the data to it, where, it is stored it in a database. It also provides the service to retrieve the data using APIs. Using these services, the web portal displays the incoming data in real time and provides various info graphics to effectively comprehend the data.
The data collection interval is set to 5 min with sensors sampling rate 0.0034/s owing to the fact that the pollutants spread through a process called diffusion, which is very slow in case of indoor environment. By reducing the frequency of samples taken, we can conserve a large amount of energy which could especially be helpful in case of battery powered systems.
4.2. Data Visualization and Analysis
Several scenarios are recorded to show the variation in data, for instance, data collected during cleaning activities in lab, during lab visits and so on. The data acquired using the developed prototype is shown below in terms of charts and thereafter briefly explained.
- Carbon Dioxide (CO): It is known that CO is exhaled by humans and since the lab is a closed environment, the concentration of CO varied greatly depending on the time of the day and the number of people in the room. Figure 7 shows the variation in the concentration of CO in the lab over the period of 24 h.
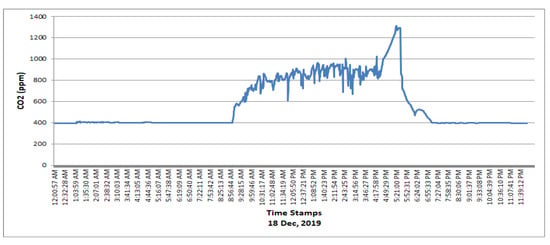 Figure 7. Variation in Concentration of CO over a period of 24 h.Typically, the lab remains open from 8 AM to 8 PM and closed afterwards. The concentration of CO changed with the presence of one or more occupants, which raised the concentration of CO from 9 AM to 7 PM as shown in Figure 7. However, the lab is occasionally opened for visitors to see the projects demos of the active projects. In one such event, there were more than 8 people in the lab, which triggered the concentration of CO into unsafe range as shown in Figure 7 from 4 PM to 5 PM. In contrast to this, the concentration of CO remains constant from the 8 PM to 9 AM which lies in the safe range due to absence of the occupants.
 - Carbon Monoxide (CO): The concentration of CO is close to 0.9 ppm at all times, which attributed to the safe range of air quality spectrum. The variation in concentration overtime shown is in the Figure 8.
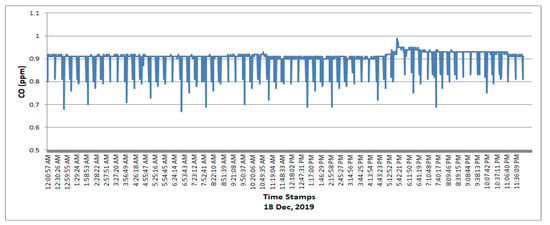 Figure 8. Variation in Concentration of CO over a period of 24 h.
 - Nitrogen Dioxide (NO): From the data acquired, it is observed that the values of NO are consistently above 2 ppm. It is pertinent to mention that the indoor presence of NO is the result of both infiltration of ambient NO and NO produced by combustion sources within the building. The major potential indoor source of NO in the lab is building central heating system or HVAC systems. The NO emissions are minimal from the heating systems if it is properly vented and emitted gases are exhausted effectively outside. However, these emissions may become prominent if the ventilation is poor, which is the case in the lab as well. Additionally, the heating systems are not regularly maintained and cleaned, which leads to increased NO emissions.The NO profile (as shown in Figure 9) does not correspond to the safe range of the air quality spectrum owing to its presence in the lab. The majority values reported are between 2.50 ppm to 3.25 ppm and are shown in Figure 9.
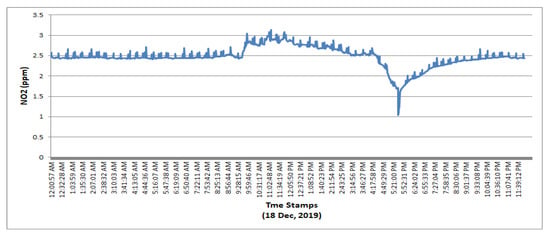 Figure 9. Variation in Concentration of NO over a period of 24 h.
 - Methane (CH): Since there is no source of CH nearby the lab, the values for CH are consistently below 2.0 ppm with ranges from 1.11 ppm to 2.5 ppm as shown in Figure 10. These values are considered safe for human consumption. Typically, the indoor sources of CH are water heaters, stoves, and clothes dryers which are combustible by natural gas.
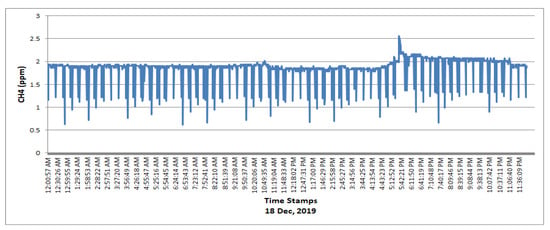 Figure 10. Variation in Concentration of Methane over a period of 24 h.
 - Particulate Matter (PM2.5): PM 2.5 is a crucial parameter for monitoring the air quality and its value typically depends on the anthropogenic activities and weather conditions. The Figure 11 shows the high concentration of PM 2.5 from 8 AM to 12 PM when the lab cleaning activities are performed. It is observable that such an activity has set the micro particles afloat and has increased the concentration of PM 2.5. After a while, as the lab became a closed environment again and there is no such activity, the concentration of PM 2.5 lowered as shown in Figure 11 from 12 PM to 6 PM.
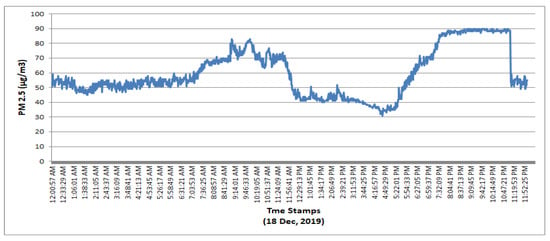 Figure 11. Variation in Concentration of PM2.5 over a period of 24 h.
In order to exhaustively test the system and to make it mature, more data collection and advanced analytic is required. Until now, we have performed the basic analysis, however the following section describes the advanced analytic which is essential to provide vital information regarding the classification of data based on air quality levels using machine or deep learning models and subsequently prediction of indoor air quality based on the historical data collected over a substantial period of time.
4.3. Classification of Indoor Air Quality
4.3.1. Data Pre-Processing
The air quality monitoring node is placed in the lab where the data is collected from December 2019 to March 2020. The collected data consisted of 36,388 records where each record consisted of eight parameters including NH3, CO, NO2, CH4, CO2, PM 2.5, air temperature and air humidity. Each of these air pollutants has a specific range relative its quality class as described in Figure 12, where the information related to the range of every air pollutant along with its taxonomy that is, ‘Good’, ‘Moderate’, ‘Un-healthy for sensitive’, ‘Un-healthy’, ‘Very Un-healthy’, ‘Hazardous’ and ‘Highly Dangerous’ is obtained from References [38,39,40] and is given below for reference.

Figure 12.
Air pollutants and their quality spectrum [38,39,40].
The collected data is pre-processed to compensate for the missing values. The main reason of the missing values is the internet connectivity, for that reason, the data could not be sent to the server. The bi-linear interpolation is performed to fill the missing values which are around 1500. Each record is labeled and tagged by a class based on the concentration and corresponding quality of the individual pollutants. The class is assigned based on the lowest quality of any pollutant existing in the given record. For instance, if CO is representing ‘Very Unhealthy’ class and rest all the pollutants in that record are belonging to either ‘Moderate or Unhealthy’ category, then considering the lowest quality of CO, the record will be labeled as ‘Very Unhealthy’. Based on this strategy, the data was labelled into 5 classes instead of seven classes, because there are no records which belong to the classes ‘Good’ and ‘Moderate’ due to higher concentration of the observed pollutants. These classes include (i) ‘US: Un-healthy for Sensitives’, (ii) ‘UH: Un-healthy’, (iii) ‘VU: Very Un-healthy’, (iv) ‘HZ: Hazardous’, and (v) ‘HD: Highly Dangerous’. Figure 13 shows the glimpse of the data-set with eight features. There are 32,033 records of class ‘HD’, 535 records of class ‘HZ’, 3628 records of class ‘VU’, 178 records of class ‘UH’ and 14 records of class ‘US’ in the collected data-set. After labeling, the data-set is split into training and testing in ratio of 70:30 respectively with 25,471 records in the training data-set and 10,917 records in the test data-set.
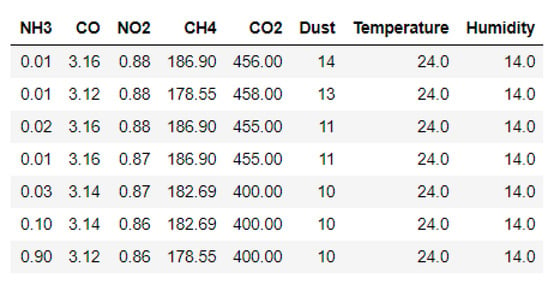
Figure 13.
Fragment of Collected Data-set.
4.3.2. Classification
In order to perform classification, four supervised machine learning algorithms are selected which are suitable for the data-set. These classification algorithms are briefly discussed below:
- Support Vector Machine (SVM): SVM is large margin classifier which uses some kernel function to classify the data. In the current scenario, the kernel function ‘Radial basis function’ is selected for classification.
- K-Nearest Neighbour (KNN): KNN is another classification algorithm which uses some similarity measure to find distance between records belonging to different classes. In KNN, ‘K’ is hyper-parameter that is selected on hit and trial method. For the data-set used in this research work, K is set to 4 for optimal results and euclidean distance is used as a similarity measure.
- Naive Bayes (NB): The NB is a supervised classification algorithm which classify the records using ‘Bayes Theorem’ based on probabilities.
- Neural Network (NN): NN is a very popular machine learning algorithms which is used for prediction and classification. NN with one hidden layer containing 10 hidden nodes is applied on the labeled data. The activation function on hidden layer is ‘Tanh’ and activation function on output layer is ‘softmax’ with loss function selected as ‘cross entropy’; which are computed by Equations (1)–(3) respectively [41,42].where N: total number of records
- : Actual label (ground truth) of record
- : Predicted value of record computed by a classifier.
4.4. Prediction of Indoor Air Quality
In order to predict the indoor air quality, Long and Short Term Memory (LSTM) network is used which is an advanced form of Recurrent Neural network (RNN) [43]. The developed IoT node for indoor air quality monitoring is placed inside the experimental lab to record readings of different air pollutants as shown in Figure 13. The captured readings are time series which are further used to perform predictive analysis. The LSTM is applied on individual air pollutant to predict its values for next time instances. For this purpose, LSTM with one hidden layer containing 10 hidden nodes is applied. The ‘mean squared error’ is used as a loss function with ‘adam’ as optimizer to handle the sparse gradient to improve the performance of LSTM. For the purpose of prediction, next 50 air quality readings are predicted. The reason for selecting a short interval for air quality prediction is attributed to the fact that changes in indoor air pollution of the immediate future instances are of significant importance for decision making regarding remedial measures especially in case of COVID-19 pandemic. The prediction results for next 50 air quality instances are discussed in subsequent sections
In order to apply LSTM to predict the concentration of pollutant gases, feature scaling is applied to minimize the effect of exploding gradients. In exploding gradient, larger values of input or weights suppress the model to learn from the data, which results in the large deviation of predicted values from the actual values. To scale the features, min-max normalization is applied which maps the feature values into a range of [0–1] using the Equation (4) as described in Reference [44].
where
X: Original value of a given feature
: Scaled value of a given feature
: Minimum value of a given feature in the dataset values
: Maximum value of a given feature in the dataset
: Maximum value of the range i.e., 1
: Minimum value of the range i.e., 0
The scaling is performed on all features with large values including CO, CH, PM 2.5, air temperature, and humidity. After feature scaling, LSTM model is applied to predict the future values of all pollutant gases. While feature scaling resolves the problem of exploding gradient, at the same time it makes the data to lose its true representation and meaning owing to data normalization in the range of 0 to 1. To address this, inverse scale transformation is applied on the normalized features to map them to the original values. The mathematical expression for inverse scaling is derived from Equation (4), and expressed as Equation (5) as follows,
5. Results and Discussion
5.1. Classification Results of Indoor Air Quality
In order to measure the performance of the classifier, various evaluation metrics have been used. These include precision, score, and recall along with accuracy which are computed by Equations (6)–(9) respectively [43,45].
where TP denotes True positives, TN denotes True Negatives, FP denotes False Positives and FN denotes False Negatives. Table 1 shows the precision, F1 score, accuracy and recall of each classification algorithms which is applied on the data-set.

Table 1.
Performance Evaluation of the Classifiers.
The classification algorithms (mentioned in Section 4.3.2) are applied on the indoor air quality data-set obtained from the IoT node. The performance evaluation of these classification models is listed in Table 1. It is observed that SVM classifier has demonstrated the lowest performance as compared to other classifiers. Typically, SVM classifier performs better on the large data set with significant variation and multiple features. The NB model outperformed both SVM and KNN, owing to its characteristic of being suitable for the multi-class problem, as presented in this research work. Hence, it performed well on the labeled data-set and provided probabilistic predictions with high accuracy. The NN classifier achieved the highest accuracy, precision, recall and F1 Score among all other classifiers that is, SVM, NB and KNN as shown in Table 1, which is highlighted in bold text. There are 69 records which are misclassified as other classes whereas 10,848 records are correctly classified by NN classifier. It achieved this performance with the model configuration of one hidden layer containing 10 hidden nodes.
From the above, it can be concluded that indoor ambient conditions can be classified by applying the machine learning models, where, the relative performance evaluation of the classifiers has shown that NN is the most optimal model among all the selected classifiers.
5.2. Predictive Analytic of Indoor Air Quality
In order to compare the performance of LSTM on the collected gasses, several performance metrics are used including MSE, MAE and RMSE which are computed by Equations (10)–(12) as discussed in Reference [46].
where is the true or actual value, is the predicted or estimated value, and N is the total number of true values. MSE is computed by taking the average of square of the differences between the actual values and the predicted values. RMSE is computed by applying the square root averaged square error between actual values and predicted values. However, MAE is the average of the absolute differences between actual values and predicted values. Among these evaluation metrics, RMSE imposes high penalty on the large errors which make it suitable for the application where large error is not acceptable. However, MSE imposes high penalty on the small error which some time provide over estimation of error. In contrast of MSE and RMSE, MAE treats the small and large errors equally.
In order to comprehend the significance of predicting indoor air quality, the key results have been discussed in the following subsections.
5.2.1. Prediction of CO
CO is considered as a toxic gas which is generally produced by fuel combustion, industrial processes, and human breathing and so forth. The developed air quality monitoring IoT node was placed inside the lab which is a closed environment, where 5 to 6 individuals typically work from 9:30 am to 5 pm. There is no source of combustion process in the lab, therefore, the lab occupants are the major source of CO. The amount of CO exhaled by an individual is trivial but if more than 5 people are in a closed room with poor ventilation, then the levels may exceed the safe limits. The maximum value of CO observed in the recorded data-set is 1506 ppm which corresponds to ‘Moderate’ class based on the ranges defined in Figure 12. In order to predict CO for future instances, LSTM model is applied. For this purpose, two type of predictions are performed including time series forecasting of CO after every 5 min and hourly forecasting which are shown in Figure 14 and Figure 15 respectively. Prior to LSTM training, feature scaling is performed and after training the model, the original values are restored through inverse mapping. The performance of LSTM model using all performance measures including MAE, RMSE and MSE are listed in Table 2 and Table 3.
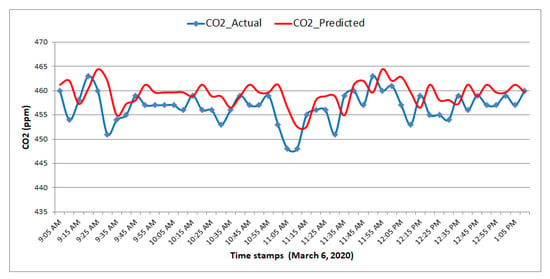
Figure 14.
Predicted values of CO after every 5 min vs Actual values.
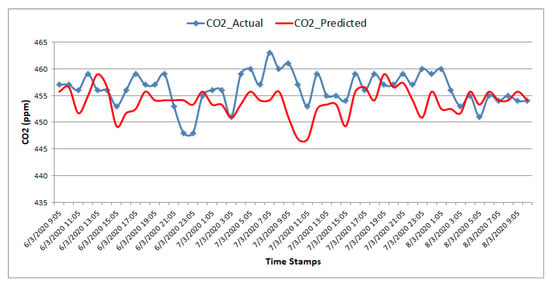
Figure 15.
Hourly Predicted values of CO vs. Actual values.

Table 2.
Performance Evaluation of the Long and Short Term Memory (LSTM) for every 5 min.

Table 3.
Hourly Performance Evaluation of the LSTM.
It can be observed from Figure 14 and Figure 15 that the behavior of the predicted values is very close to the actual trend of CO, which indicate the high performance of LSTM in forecasting the values. The prediction of CO is critical as inhalation of higher concentration of this gas suppresses the respiratory rate, which may affect the cognitive abilities leading to lower productivity of an individual.
5.2.2. Prediction of CO
CO is a colorless, odourless, tasteless and a poisonous gas and exposures to it may have harmful effects on the human health conditions. If CO is inhaled, it perforates the lungs and reach the bloodstream, where it affix to the hemoglobin molecules, and debilitate them to carry oxygen. The continued inhalation of CO leads to the choking of red blood cells and reduces the ability of blood to supply oxygen to vital organs [47]. The natural concentration of CO in air is around 0.2 ppm, and that amount is not harmful to humans [48].
Owing to colorless and odorless properties of CO, if the gas remains undetected, it may become fatal for a COVID-19 patient, as its inhalation hampers the oxygen supply to vital organs such as brain, lungs, and heart. The lungs get inflamed or infected in COVID-19 and a compromised oxygen supply may lead to the demise of the patient. For this purpose, the monitoring and prediction of this gas has become obligatory in the prevalence of corona virus.
The CO data recorded in the lab for this research work represents low concentration of CO and generally belongs to the good class according to the ranges defined in the Figure 12. The LSTM model is trained for predicting CO concentration for future 50 instances with the interval of 5 min and one hour. The predicted and actual values of CO are shown in Figure 16 and Figure 17 respectively. The performance of LSTM for 5 min and hourly predictions is listed in Table 2 and Table 3 respectively.
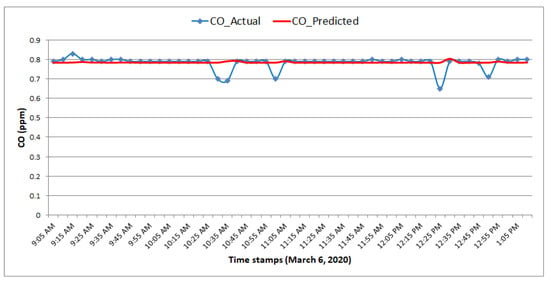
Figure 16.
Predicted values of CO after every 5 min vs. Actual values.
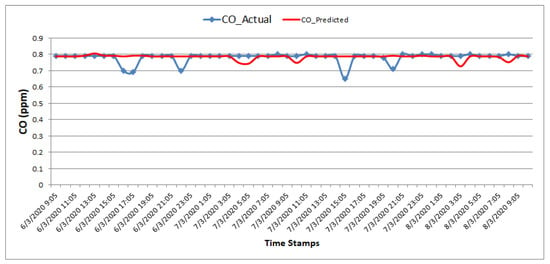
Figure 17.
Hourly Predicted values of CO vs. Actual values.
5.2.3. Prediction of NO
NO is a poisonous gas and long term exposure to this gas can adversely affect the human respiratory system. According to the data recorded in the lab for this research work, the highest value recorded for NO is 4.7 ppm, which belongs to the highly hazardous class according to Figure 12. The natural sources of NO is fossil fuel combustion, however, there is no such source in the lab and the only potential source of NO there is the mechanical ventilation system integrated in HVAC system, which is not often serviced and maintained. The natural ventilation system is poor and generally the lab windows and door remain closed all the time. In the wake of COVID-19 pandemic, the significance of measuring NO levels has increased owing to the strong association between NO emissions and mortality rate of COVID-19 [49]. This association is mainly attributed to the increased risk of lungs infection due to surged levels of NO in a facility. The inhalation of NO by a COVID-19 patient may exacerbate the health conditions due to inflamed lungs. On the other hand, its inhalation makes a non-COVID-19 patient more susceptible and vulnerable to this virus by weakening his immunity to lung infections.
Figure 18 and Figure 19 show the deviation between actual and predicted NO values after every 5 minutes and one hour respectively, where, the performance of LSTM is shown in Table 2 and Table 3. The predicted and actual values lie in the hazardous zone according to Figure 12. These observations indicate that the ambient conditions of the lab with ineffective ventilation are highly detrimental and inimical for inhalation especially for those who are already suffering from pulmonary disorders. Additionally, if a COVID-19 patient is exposed to similar indoor ambient conditions, it may aggravate his already irritated respiratory tract or lead to the fatality of that individual.
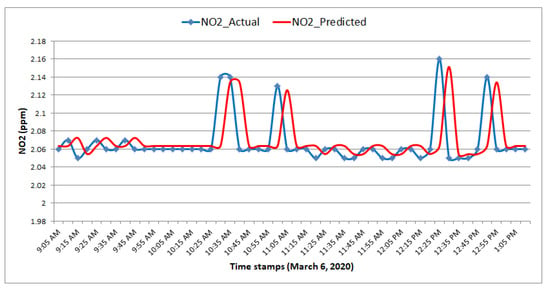
Figure 18.
Predicted values of NO vs. Actual values.
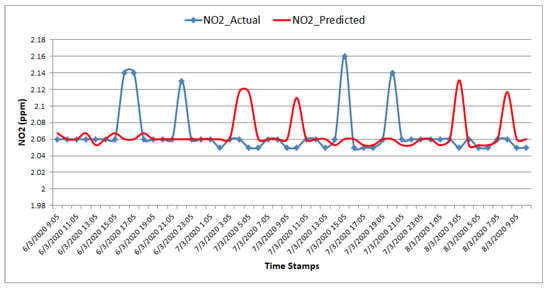
Figure 19.
Hourly Predicted values of NO vs. Actual values.
5.2.4. Prediction of PM 2.5
The long term exposure to PM 2.5 is associated with the increased fatality rate of COVID-19 [50]. The fine dust particles such as PM 2.5 if suspended in air can enter the bronchi and in the worse case may infiltrate the lungs and impair the tissue by transmitting harmful substances like bacteria, and viruses [51]. The recorded values of PM 2.5 in lab are scaled into range of [0–1], before applying LSTM. These normalized values are mapped to original values for meaningful visualization of results. The performance of the LSTM is shown in the Table 3 and Table 2 for the forecasting of time series concentration of PM 2.5 after every 5 min and one hour. The predicted and actual values of PM 2.5 are shown in Figure 20 and Figure 21 for both types of predictions.
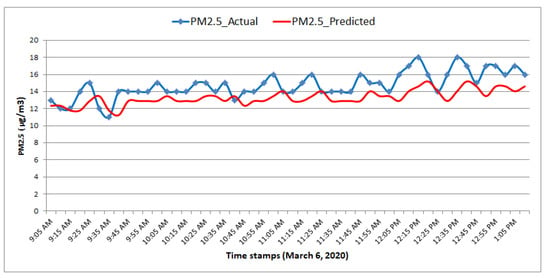
Figure 20.
Predicted values of PM 2.5 after every 5 min vs. Actual values.
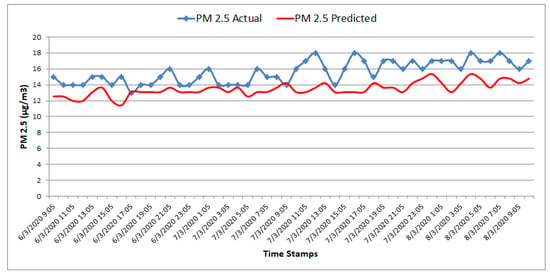
Figure 21.
Hourly Predicted values of PM 2.5 vs. Actual values.
The PM 2.5 observations are in the moderate class based on the range limits defined in Figure 12. The prediction of PM 2.5 is of utmost importance particularly in the present circumstances, when people have adopted the model of work from home and have become more exposed to this pollutant due to enclosed environment with poor ventilation, anthropogenic activities owing to more occupants at one place, thus leading to large amount of these fine grained particles to be accumulated and suspended in air and thereafter inhaled.
5.2.5. Prediction of Air Temperature and Relative Humidity
It is presumed that air droplets facilitate the spread of COVID-19. There are several studies which have investigated the mutation and sustenance of this virus at different temperature and humidity levels. These studies have revealed that the virus retained itself for around a week at a temperature range of 22–25 C, with the humidity level between 40–50%. Whereas, at higher temperature and humidity levels, the ambient becomes hostile for virus transmission [52,53].
In view of the above, it is essential to monitor the temperature and humidity levels of indoor environments and generate alerts if the recommended range of temperature and humidity for virus suppression is not maintained. During lockdown, when major indoor public facilities such as shopping complexes, restaurants, hotels, educational institutes are closed and no natural or mechanical ventilation system is operational, the humidity level raises inside the building causing the fungus and mold to grow rapidly. In such an event, the remote monitoring of interior ambience and generation of alerts in case of any anomaly detection is of great importance and this would help to take timely curative actions, which could minimize the monetary loss.
The observed air temperature recorded in lab is in the range of 18–31 C with humidity levels between 11–18%. The scale transformation is applied before applying the LSTM to enhance its performance. The deviation between predicted and actual values of air temperature and humidity are shown in Figure 22, Figure 23, Figure 24 and Figure 25 where the prediction performance of LSTM for both type of predictions is listed in Table 2 and Table 3.
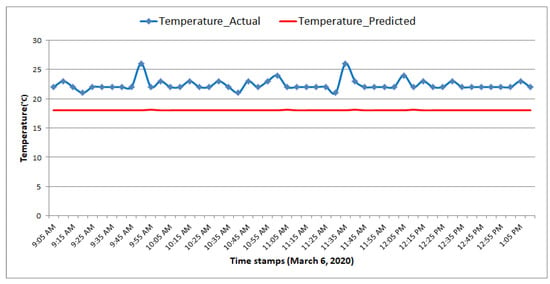
Figure 22.
Predicted values of Air Temperature after every 5 min vs. Actual values.
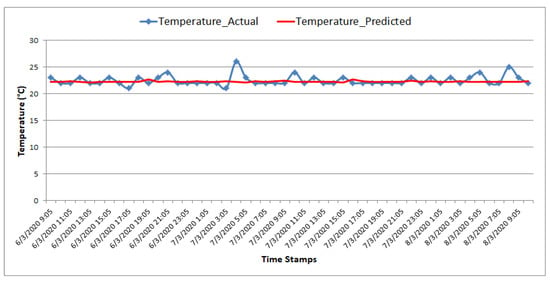
Figure 23.
Hourly Predicted values of Air Temperature vs. Actual values.
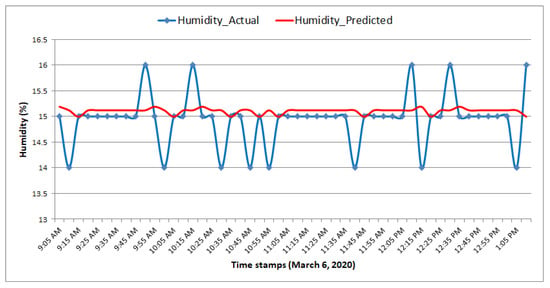
Figure 24.
Predicted values of Humidity after every 5 min vs. Actual values.
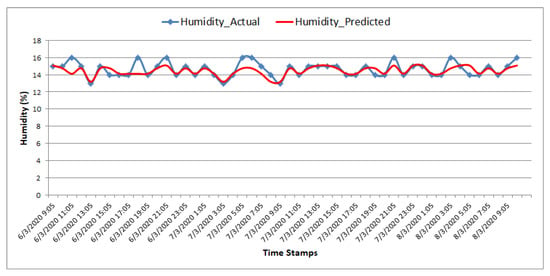
Figure 25.
Hourly Predicted values of Humidity vs. Actual values
The LSTM showed promising results for the features considered for indoor air quality, where, the predicted values of these features would be useful for providing actionable insights and taking remedial measures.
5.2.6. Prediction of Indoor Ambient Quality Based on the Collective Effect of Air Pollutants
In Section 5.2.1, Section 5.2.2, Section 5.2.3, Section 5.2.4 and Section 5.2.5, the effect of individual gases on indoor air quality is discussed, where, LSTM is applied to predict the numerical concentration of the each pollutant for the next 50 time instances. To evaluate the performance of LSTM, multiple performance metrics are applied including MSE, MAE and RMSE which are based on the differences between the actual and the predicted values.
However, in this section, we discussed the results of the LSTM on the labelled dataset with all features to predict the indoor air quality over time. Since the dataset is labelled into five categorical classes (US, UH, HZ, VU and HD), the evaluation metrics used for assessing the performance of LSTM include accuracy, precision, recall, and F1-Score, and are based on the number of correctly classified & misclassified records.
In order to predict the over all indoor air quality over time, the applied LSTM model has 8 input nodes (8 features), 10 hidden nodes and 5 nodes (for 5 classes). The activation function used in hidden layer and output layers are ‘Tanh’ and ‘Softmax’ which are computed using Equations (1) and Equation (2) [54]. The cross entropy is used as a loss function which is computed by Equation (3). The observed accuracy of LSTM on the combined features is 99.37% with precision of 99%, recall of 98% and F1-score of 99%.
6. Conclusions and Future Work
The monitoring and prediction of indoor environment has become more significant in the wake of COVID-19 pandemic. The enforcement of lockdown has compelled the adoption of work from home model to protect oneself from this disease. While these preemptive measures have tended to contain the virus to a certain extent, they have also raised serious concerns regarding indoor air quality monitoring when public facilities will plan to fully resume safely and minimize the instances of infection. There are several air quality monitoring solutions available in the market which offer competitive accuracy but they generally offer the monitoring feature and do not predict the quality of air for future instances, which holds utmost importance especially for COVID-19 patients and people suffering from acute pulmonary disorders. In this regard, we have developed an indoor air quality monitoring and prediction solution based on internet of things and machine learning, where NN provided the classification accuracy of 99.1% and LSTM achieved the prediction accuracy of 99.3% with precision of 99%, recall of 98% and F1-score of 99%. The web portal and mobile app developed for the proposed system generate alerts for poor air quality and provide a convenient way to keep oneself aware of and understand the air being inhaled.
The limitations of this work include the assessment of the indoor air quality in a ubiquitous fashion which entails several IoT nodes to be placed at distance relative to each other. The long term monitoring of air quality is a demand of the indoor workplace as grab sampling or data captured in specific windows would not provide the true indoor ambient assessment of a workplace. This long term data acquisition poses challenges owing to the sensor life time, and calibrations issues. For future work, the developed system can be further enhanced to add more sensors such as radon, formaldehyde and so forth. In addition to this, the solution can be made fully autonomous by augmenting the air quality control part. This can be facilitated by ambient computing and including air filters for screening fine dust particles, automating ventilation exhausts, and controlling air conditioning based on the sensed and predicted air quality by the system. In addition, the impact of poor air quality on health and well-being of general public can be studied and verified using cell toxicology studies and clinical trials.
Author Contributions
R.M.: Conceptualization, Methodology, Validation, Investigation, Writing - Original Draft, Writing—Review & Editing, Visualization, Supervision; S.M.H.Z.: Conceptualization, Methodology, Investigation, Writing—Review & Editing; M.Z.S.: Conceptualization, Validation, Data Curation, Investigation, Writing—Review & Editing; U.S.: Software, Validation, Data Curation, Writing—Original Draft, Writing—Review & Editing, Visualization; M.M.M.: Methodology, Software, Validation, Investigation, Writing—Original Draft; A.H.: Investigation, Writing—Review & Editing, Visualization; S.M.: Investigation, Writing—Review & Editing, Visualization; S.A.R.Z.: Validation, Writing–Review & Editing, Visualization. All authors have read and agreed to the published version of the manuscript.
Funding
There is no funding to report the findings of this research.
Data Availability Statement
The data may be requested by reaching out to authors through email.
Conflicts of Interest
The authors declare no conflict of interest.
Appendix A
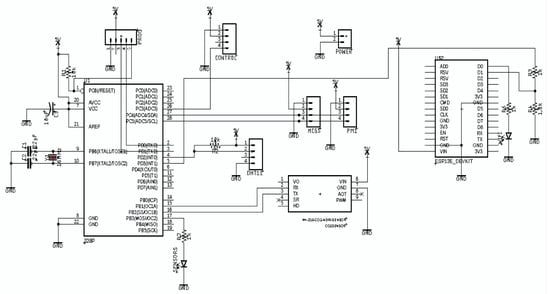
Figure A1.
PCB Schematics of Indoor air quality monitoring node.
References
- AVtec Smart Solutions, Indoor Air Is not Coronavirus-Ready. 2020. Available online: https://www.avtec.co.za/covid-19 (accessed on 11 May 2020).
- Gardiner, B. Pollution Made COVID-19 Worse. Now, Lockdowns Are Clearing the Air. Available online: https://www.nationalgeographic.com/science/2020/04/pollution-made-the-pandemic-worse-but-lockdowns-clean-the-sky (accessed on 8 April 2020).
- Friedman, L. New Research Links Air Pollution to Higher Coronavirus Death Rates. Available online: https://www.nytimes.com/2020/04/07/climate/air-pollution-coronavirus-covid.html (accessed on 17 April 2020).
- Frontera, A.; Cianfanelli, L.; Vlachos, K.; Landoni, G.; Cremona, G. Severe air pollution links to higher mortality in COVID-19 patients: The “double-hit” hypothesis. J. Infect. 2020, 81, 255–259. [Google Scholar] [CrossRef] [PubMed]
- Air Pollution Likely to Make Coronavirus Worse, Say UK Government Advisers. Available online: https://www.theguardian.com/environment/2020/jul/01/air-pollution-likely-to-make-coronavirus-worse-say-uk-experts (accessed on 1 July 2020).
- Hornyak, T. Air Pollution Can Worsen the Death Rate from COVID-19. Available online: https://eos.org/articles/air-pollution-can-worsen-the-death-rate-from-covid-19 (accessed on 10 April 2020).
- AirQNexus, IQNexus, Indoor Air Quality. 2020. Available online: https://iqnexus.com/solutions/indoor-air-quality (accessed on 11 May 2020).
- Indoor Air Quality COVID-19 Facts, 6 April 2020. Available online: https://www.co2meter.com/blogs/news/indoor-air-quality-covid-19-facts (accessed on 11 May 2020).
- Residential Indoor Air Quality Guideline: Nitrogen Dioxide, 26 November 2015. Available online: https://www.canada.ca/en/health-canada/services/publications/healthy-living/residential-indoor-air-quality-guideline-nitrogen-dioxide.html (accessed on 11 May 2020).
- Hamdan, N.M.; Alawadhi, H.; Jisrawi, N.; Shameer, M. Size-resolved analysis of fine and ultrafine fractions of indoor particulate matter using energy dispersive X-ray fluorescence and electron microscopy. X-ray Spectrom. 2018, 47, 72–78. [Google Scholar] [CrossRef]
- Council, N.R. Monitoring and Modeling of Indoor Air Pollution. In Indoor Pollutants; National Academies Press (US): Washington, WA, USA, 1981. [Google Scholar]
- Cincinelli, A.; Martellini, T. Indoor air quality and health. Int. J. Environ. Res. Public Health 2017, 14, 1286. [Google Scholar] [CrossRef] [PubMed]
- Saini, J.; Dutta, M.; Marques, G. A comprehensive review on indoor air quality monitoring systems for enhanced public health. Sustain. Environ. Res. 2020, 30, 1–12. [Google Scholar] [CrossRef]
- Marques, G.; Pitarma., R. Indoor Air Quality Monitoring for Enhanced Healthy Buildings. In Indoor Environmental Quality; IntechOpen: London, UK, 2018; pp. 1–18. [Google Scholar] [CrossRef]
- Mokrani, H.; Lounas, R.; Bennai, M.T.; Salhi, D.E.; Djerbi, R. Air Quality Monitoring Using IoT: A Survey. In Proceedings of the IEEE International Conference on Smart Internet of Things (SmartIoT), Tianjin, China, 9–11 August 2019; pp. 127–134. [Google Scholar]
- Salonen, H.; Salthammer, T.; Morawska, L. Human exposure to NO2 in school and office indoor environments. Environ. Int. 2019, 130, 1–12. [Google Scholar] [CrossRef] [PubMed]
- Air Quality Guidelines—Global Update. 2005. Available online: https://www.who.int/airpollution/publications/aqg2005/en/ (accessed on 12 December 2020).
- Pitarma, R. Monitoring Indoor Air Quality for Enhanced Occupational Health. J. Med. Syst. 2017, 41, 1–17. [Google Scholar] [CrossRef] [PubMed]
- Jo, J.H.; Jo, B.W.; Kim, J.H.; Kim, S.J.; Han, W.Y. Development of an IoT-Based Indoor Air Quality Monitoring Platform. J. Sens. Hindawi 2020, 1–14. [Google Scholar] [CrossRef]
- Marques, G.; Pitarma, R. Non-contact Infrared Temperature Acquisition System based on Internet of Things for Laboratory Activities Monitoring. Procedia Comput. Sci. 2019, 155, 487–494. [Google Scholar] [CrossRef]
- Marques, G.; Pitarma, R. An Internet of Things-Based Environmental Quality Management System to Supervise the Indoor Laboratory Conditions. Appl. Sci. 2019, 9, 438. [Google Scholar] [CrossRef]
- Lounas, R.; Salhi, D.E.; Mokrani, H.; Djerbi, R.; Bennai, M.T. Towards a Smart Data Transmission Strategy for IoT Monitoring Systems: Application to Air Quality Monitoring. In Proceedings of the International Conference on Theoretical and Applicative Aspects of Computer Science (ICTAACS), Skikda, Algeria, 15–16 December 2019; pp. 1–7. [Google Scholar] [CrossRef]
- Mc Grath, S.; Flanagan, C.; Zeng, L.; O’Leary, C. IoT Personal Air Quality Monitor. In Proceedings of the 31st Irish Signals and Systems Conference (ISSC), Letterkenny, Ireland, 11–12 June 2020; pp. 1–4. [Google Scholar]
- De Medeiros, H.P.L.; Girão, G. An IoT-based Air Quality Monitoring Platform. In Proceedings of the IEEE International Smart Cities Conference (ISC2), Piscataway, NJ, USA, 28 September–1 October 2020; pp. 1–6. [Google Scholar]
- Jason Plautz, Ammonia, A Poorly Understood Smog Ingredient, Could Be Key to Limiting Deadly Pollution. 2020. Available online: https://bit.ly/2B6rmBa (accessed on 11 March 2020).
- Green Facts, Air Pollution Nitrogen Dioxide. 2005. Available online: https://www.greenfacts.org/en/nitrogen-dioxide-no2/index.htm (accessed on 11 March 2020).
- Nunez, C. Climate 101: Air Pollution. 2020. Available online: https://www.nationalgeographic.com/environment/global-warming/pollution/ (accessed on 11 March 2020).
- NY Department of Health, Fine Particles (PM 2.5) Questions and Answers. 2020. Available online: https://www.health.ny.gov/environmental/indoors/air/pmq_a.htm (accessed on 11 March 2020).
- AirVisual Pro|IQAir. 2020. Available online: https://www.iqair.com/air-quality-monitors/airvisual-pro/features (accessed on 15 May 2020).
- Newyork State Government, Carbon Monoxide—The Silent Killer. 2020. Available online: https://www.health.ny.gov/publications/2826.pdf (accessed on 11 March 2020).
- Scott Sutherland, Humid Summer Days Are Compounding Our Smog Problems. 2018. Available online: https://bit.ly/2Vf0G8d (accessed on 11 March 2020).
- Grove Wiki, Grove—Multichannel Gas Sensor. 2020. Available online: http://wiki.seeedstudio.com/Grove-Multichannel_Gas_Sensor/ (accessed on 11 March 2020).
- Winsen Sensors, Intelligent Infrared CO2 Module. 2020. Available online: https://www.winsen-sensor.com/d/files/PDF/Infrared%20Gas%20Sensor/NDIR%20CO2%20SENSOR/MH-Z19%20CO2%20Ver1.0.pdf (accessed on 11 March 2020).
- Random Nerd Tutorials, DHT11 & DHT22 Sensors Temperature and Humidity Tutorial Using Arduino. 2020. Available online: https://randomnerdtutorials.com/complete-guide-for-dht11dht22-humidity-and-temperature-sensor-with-arduino// (accessed on 11 March 2020).
- Seeed Wiki, Laser PM2.5 Sensor (HM3301). 2020. Available online: http://wiki.seeedstudio.com/Grove-Laser_PM2.5_Sensor-HM3301/ (accessed on 11 March 2020).
- Trilles, S.; Vicente, A.B.; Juan, P.; Ramos, F.; Meseguer, S.; Serra, L. Reliability Validation of a Low-Cost Particulate Matter IoT Sensor in Indoor and Outdoor Environments Using a Reference Sampler. Sustainability 2019, 11, 7220. [Google Scholar] [CrossRef]
- Microchip, ATMega328P. 2020. Available online: https://www.microchip.com/wwwproducts/en/ATmega328P (accessed on 11 March 2020).
- Carbon Dioxide. 2014. Available online: https://www.dhs.wisconsin.gov/chemical/carbondioxide.htm (accessed on 20 December 2019).
- Rahul, M. National Air Quality Index. Available online: http://www.arthapedia.in/index.php?title=National_Air_Quality_Index (accessed on 17 October 2014).
- AQI Calculator. Available online: https://www.airnow.gov/aqi/aqi-calculator-concentration (accessed on 1 August 2020).
- Alon, G.; Kroese, D.P.; Raviv, T.; Rubinstein, R.Y. Application of the cross-entropy method to the buffer allocation problem in a simulation-based environment. Ann. Oper. Res. 2005, 134, 137–151. [Google Scholar] [CrossRef]
- Raschka, S.; Mirjalili, V. Python Machine Learning: Machine Learning and Deep Learning with Python, Scikit-Learn, and TensorFlow 2; Packt Publishing Ltd.: Birmingham, UK, 2019. [Google Scholar]
- Goodfellow, I.; Bengio, Y.; Courville, A. Deep Learning; MIT Press: Cambridge, MA, USA, 2016. [Google Scholar]
- sklearn MinMax Scaler. 2019. Available online: https://scikit-learn.org/stable/modules/generated/sklearn.preprocessing.MinMaxScaler.html (accessed on 11 March 2020).
- Raschka, S. Python Machine Learning; Packt Publishing Ltd.: Birmingham, UK, 2015. [Google Scholar]
- Willmott, C.J.; Robeson, S.M.; Matsuura, K. A refined index of model performance. Int. J. Climatol. 2012, 32, 2088–2094. [Google Scholar] [CrossRef]
- Carbon Monoxide Poisoning. 2019. Available online: https://www.health.harvard.edu/a_to_z/carbon-monoxide-poisoning-a-to-z (accessed on 11 June 2020).
- Carbon Monoxide (CO). 2020. Available online: https://www.environment.gov.au/protection/publications/factsheet-carbon-monoxide-co (accessed on 11 June 2020).
- Ogen, Y. Assessing nitrogen dioxide (NO2) levels as a contributing factor to coronavirus (COVID-19) fatality. Sci. Total Environ. 2020, 726, 1–5. [Google Scholar] [CrossRef] [PubMed]
- COVID-19 PM2.5 A National Study on Long-Term Exposure to Air Pollution and COVID-19 Mortality in the United States. 2020. Available online: https://projects.iq.harvard.edu/covid-pm/home (accessed on 9 June 2020).
- Sanità di Toppi, L.; Sanità di Toppi, L.; Bellini, E. Novel Coronavirus, How Atmospheric Particulate Affects Our Environment and Health. Challenges 2020, 11, 6. [Google Scholar] [CrossRef]
- Prata, D.N.; Rodrigues, W.; Bermejo, P.H. Temperature significantly changes COVID-19 transmission in (sub)tropical cities of Brazil. Sci. Total Environ. 2020, 729, 1–7. [Google Scholar] [CrossRef] [PubMed]
- Chan, K.H.; Peiris, J.M.; Lam, S.; Poon, L.; Yuen, K.; Seto, W.H. The Effects of Temperature and Relative Humidity on the Viability of the SARS Coronavirus. Adv. Virol. 2011, 2011, 1–8. [Google Scholar] [CrossRef] [PubMed]
- Pellegrini, T. Comparing SVM, Softmax, and shallow neural networks for eating condition classification. In Proceedings of the Sixteenth Annual Conference of the International Speech Communication Association, Dresden, Germany, 6–10 September 2015. [Google Scholar]
Publisher’s Note: MDPI stays neutral with regard to jurisdictional claims in published maps and institutional affiliations. |
© 2021 by the authors. Licensee MDPI, Basel, Switzerland. This article is an open access article distributed under the terms and conditions of the Creative Commons Attribution (CC BY) license (http://creativecommons.org/licenses/by/4.0/).