Article

Leveraging a Genetic Algorithm for the Optimal Placement of Distributed Generation and the Need for Energy Management Strategies Using a Fuzzy Inference System

1
Department of Electrical Engineering, Sukkur IBA University, Sukkur 65200, Pakistan
2
Department of Electrical Power Engineering, Wroclaw University of Science and Technology, 50-370 Wroclaw, Poland
*
Authors to whom correspondence should be addressed.
These authors contributed equally to this work.
Electronics 2021, 10(2), 172; https://doi.org/10.3390/electronics10020172
Submission received: 14 December 2020 / Revised: 8 January 2021 / Accepted: 11 January 2021 / Published: 14 January 2021
(This article belongs to the Special Issue Grid-Connected Renewable Energy Sources)

Abstract

:
With the rising load demand and power losses, the equipment in the utility network often operates close to its marginal limits, creating a dire need for the installation of new Distributed Generators (DGs). Their proper placement is one of the prerequisites for fully achieving the benefits; otherwise, this may result in the worsening of their performance. This could even lead to further deterioration if an effective Energy Management System (EMS) is not installed. Firstly, addressing these issues, this research exploits a Genetic Algorithm (GA) for the proper placement of new DGs in a distribution system. This approach is based on the system losses, voltage profiles, and phase angle jump variations. Secondly, the energy management models are designed using a fuzzy inference system. The models are then analyzed under heavy loading and fault conditions. This research is conducted on a six bus radial test system in a simulated environment together with a real-time Power Hardware-In-the-Loop (PHIL) setup. It is concluded that the optimal placement of a 3.33 MVA synchronous DG is near the load center, and the robustness of the proposed EMS is proven by mitigating the distinct contingencies within the approximately 2.5 cycles of the operating period.

1. Introduction

Notwithstanding the modernization of the existing power system, its operation, control, monitoring, protection, and communication are still challenging aspects to address. Further, the improper placement of the equipment responsible for the performance, safety, and security improvement (i.e., capacitor banks, Distributed Generators (DGs), protective relays, etc.) may result in increased power losses, power quality worsening, and ineffective coordination of the protection devices [1,2]. Amongst all the factors, the level of threat varies, but surely, the non-optimal location and sizing of DGs pose some of the most serious threats, not only to the utility, but also to the end-users. Apart from the fact that the DGs mostly rely on non-conventional energy sources and are environmentally friendly, their exponential growth may still lead to voltage instability, false tripping, power losses, short-circuit level increase, reverse power flow, and faster equipment degradation [3,4].
Prior to the installation of new DGs, many technical data, as well as the environmental and regulatory characteristics of the distribution system need to be analyzed. Amongst the many parameters, the key ones deciding the effectiveness of the DGs placed in the already existing networks are the voltage profiles, system losses, and power flows [5]. However, investigations into the behavior of the power system under normal and fault conditions require thorough load flow studies and contingency analysis. These affect the power system operation differently, and if the installed protection schemes do not function in a timely manner, the fault situation may result in either islanding or even complete blackout [6,7]. Therefore, to alleviate the adverse effects of different contingencies with the existence of DGs in the network, designing a proper Energy Management System (EMS) is highly required.
The EMS is an optimal control strategy, designed to regulate the energy flow in the network based on the network characteristics, as shown in Figure 1, where in the sources are the group of existing energy providers in the network, storage represents the energy preserved during the off-load periods, loads are scheduled as pre-defined from the load curves and also dynamically integrated on run-time, and optimal control indicates the series of actions taken to ensure the optimal energy flow and regulation. The EMS provides promising functionalities to regulate the power system instabilities and contingencies within the previously defined constraints [8,9]. Furthermore, the EMS can manage the load profile of the power system following the available energy sources and thus minimizes unnecessary energy usage, extra operational costs, and the prevailing safety issues. An effective EMS makes a significant difference in the power system operation and efficiency, after the proper placement of DGs, by mitigating the undesirable situations, i.e., network unbalance conditions, system faults, islanding, etc. [10,11].
Proper placement of DGs and the use of different energy management strategies in the distribution system have been well studied in the literature [12,13,14,15], but the close relationship between the two optimization problems, i.e., optimal DG placement and energy management, has not been investigated under different network conditions. In this regard, an analytical approach was proposed in [16] for the proper placement of DGs in a radial network with the aim of minimizing the total power loss without exploiting admittance matrices. The method is computationally promising and robust for a single DG, but its accuracy and performance are compromised for multiple DGs in more complex utility networks. Similarly, a loss sensitivity factor together with the meta-heuristic technique was discussed in [17] for optimal sizing and siting of new DGs sequentially. This suggested approach, however, uses a multi-dimensional cost function for the search algorithm, but is slow and computationally expensive for a large network. Therefore, an efficient and modular algorithm for large power systems was discussed in [18]. The suggested idea exploits quadratic programming to identify and select the optimal position and size of the DG based on the active loss minimization, power balance compensation, and voltage limits’ satisfaction. The algorithm uses a passive optimization and controller, which limit its application to networks with the least penetration of DGs and a lack of an effective EMS. To address the issue of energy management in micro-grids with environmental uncertainties related to properly installed DGs, a framework was presented in [19] that uses a fuzzy prediction model as an inference to predict the dynamic characteristics and uncertainties of available energy sources. The method, however, exploits the notion of fuzzy logic to deal with the probabilistic nature of network uncertainties, but still lacks an active controller to make decisions in the transient conditions. Hence, active controller schemes were presented in [20,21] that make use of a fuzzy inference system for battery management and fault classification. However, their application is limited to contingency detection and regulation, and this motivates us to extend the benefits of the fuzzy controller for power system energy management as well.
To the best of our knowledge, there is no single framework available that initially applies a path search algorithm to optimally place the new DGs using the key parameters of the network highlighted earlier and then under different network conditions, exploiting the supervised learning approach to realize the energy management strategies to lessen the adverse effects during distinct contingency scenarios. Overall, the key contributions of this work are (1) using a GA for the proper placement of new DGs using three critical system parameters, i.e., power loss, voltage profile, and phase angle jump, (2) designing the energy management system using a fuzzy controller with 12 inference rules, (3) testing the proposed framework on a system against its performance at different load and fault conditions, and finally, (4) validating the effectiveness and robustness of the proposed approach) it is compared with three other state-of-the-art techniques, i.e., Tabu Search (TS), Artificial Bee Colony (ABC), and ACO.
The subsequent sections of this work are organized as follows: Section 2 presents the proposed methodology and problem formulation for distinct network conditions. Section 3 examines the results achieved with the application of the proposed framework under different case scenarios. Finally, Section 4 gives the final conclusions and remarks on possible extensions of the presented work.

2. Research Methodology

The test system used to experimentally evaluate the performance of the proposed framework is shown in Figure 2. It consists of 132 kV grid stations supplying a 11 kV distribution feeder through a 26 MVA, 132/11 kV transformer. The feeder energizes different loads, i.e., industrial, commercial, and residential, rated at 1.1 MVA, 2.0 MVA, and 2.5 MVA with power factors of 0.94, 0.9, and 0.86, respectively. The residential load is connected through a 10 MVA, 11/0.4 kV step-down transformer. A synchronous generator (DG) of 3.33 MVA at a power factor of 0.953 is installed in the distribution network using a transformer of 8 MVA, 0.4/11 kV at distinct locations, determined by the search algorithm, as marked by the respective buses in Figure 2.
However, in this research, a radial system is considered to analyze the performance of the proposed framework owing to the nature and characteristics of existing feeders in distribution networks. However, the proposed framework can also be applied to mesh networks, having the benefits of ensuring the reliability and continuity of supply under the contingency condition in contrast to radial systems with minor modifications. The network characteristics determined and the load flow analysis carried out in subsequent sections for the radial system in Figure 2 need to be changed according to [22].

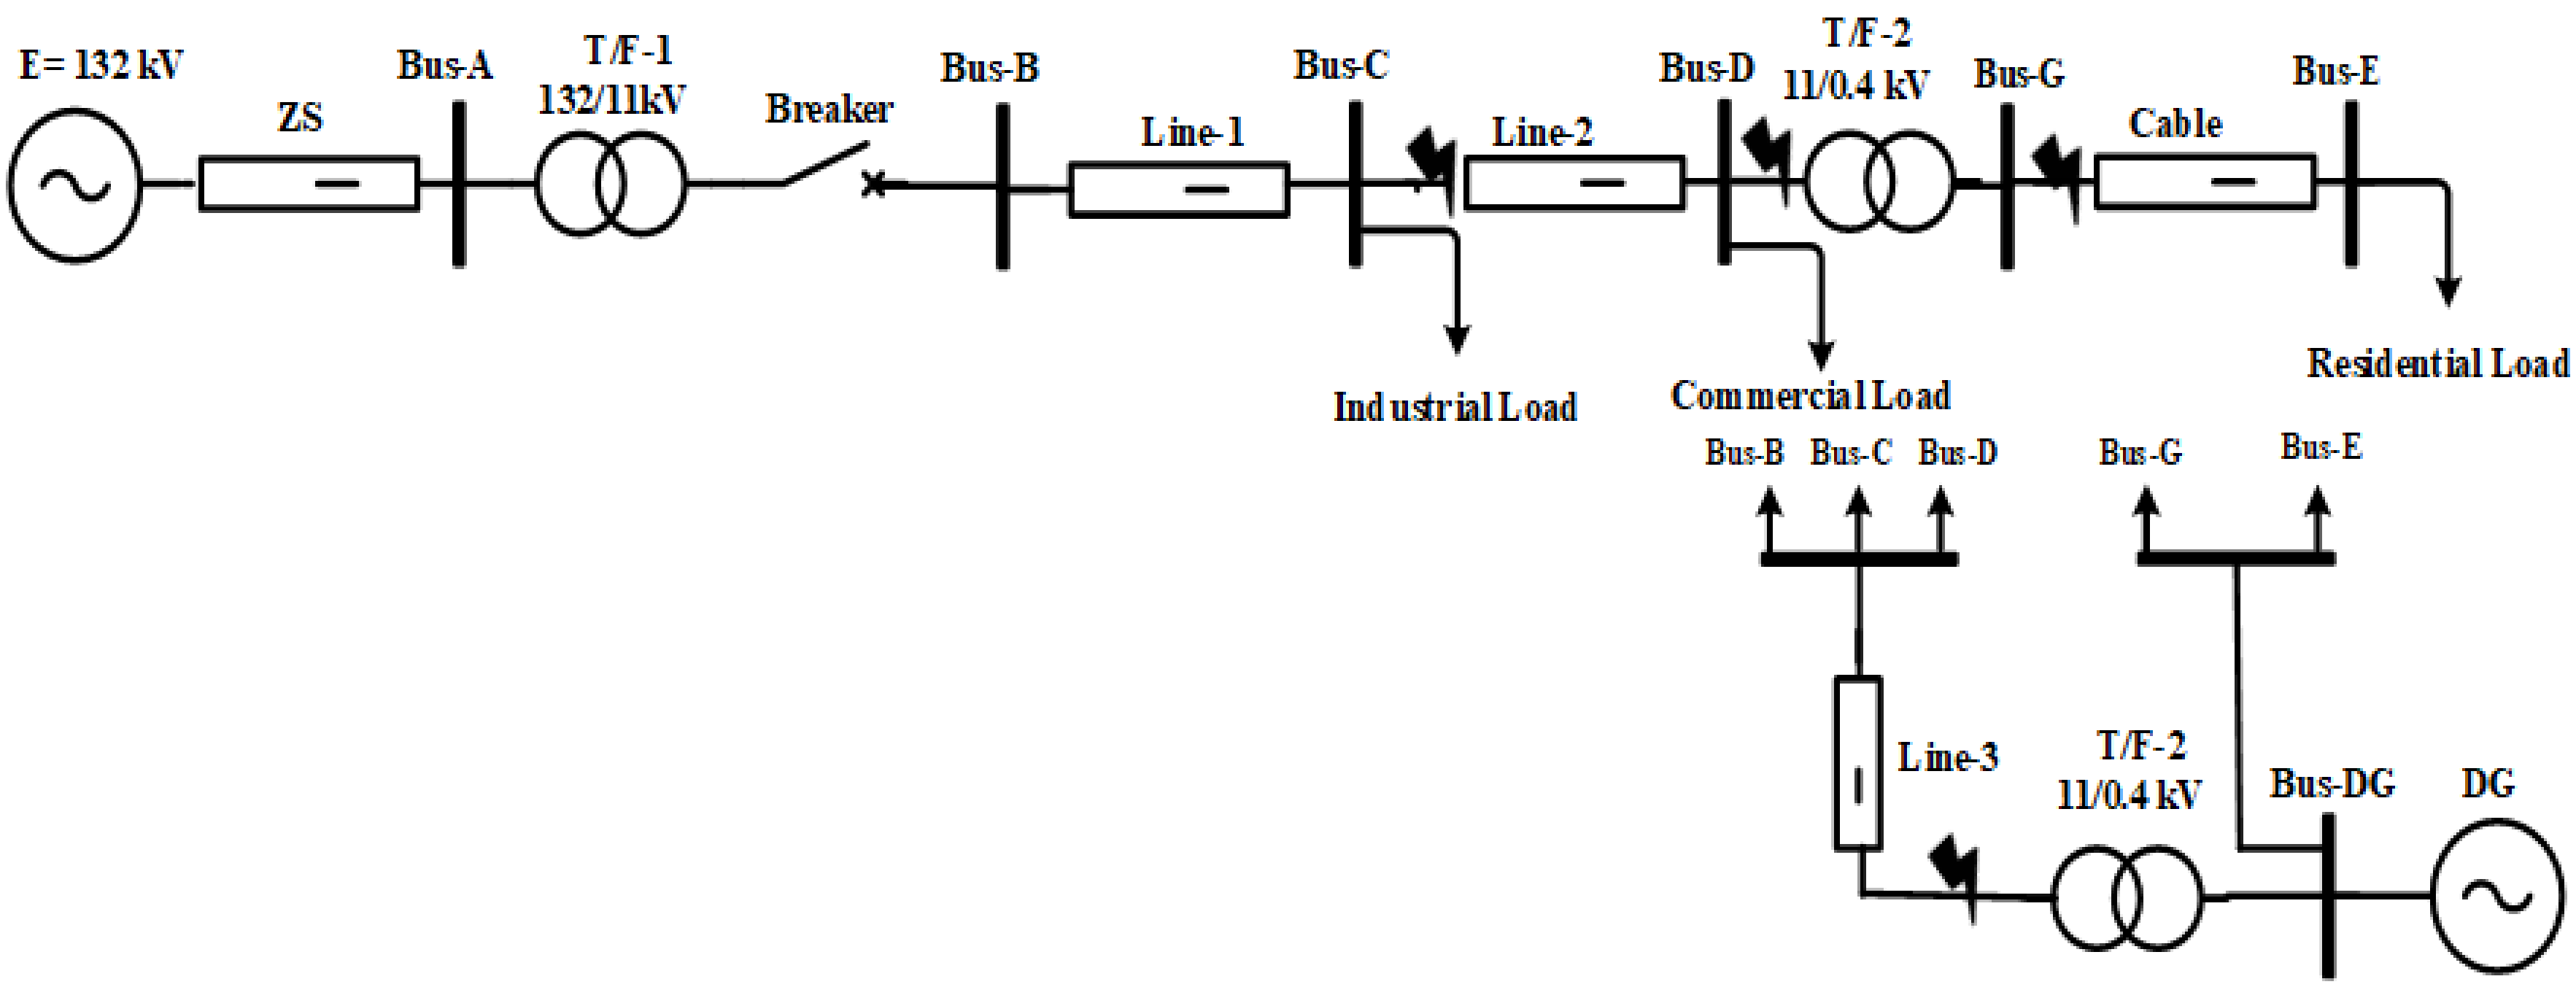
2.1. Network Characteristics

Based on the same voltage regulation of the utility network and the new DG, the magnitude of the voltage sag at the point of connection in Figure 2 can be calculated using Equation (1) [23].
V s a g = V N ( Z N Z D G ) × I F
where V s a g is the voltage sag due to system contingencies as reported in Figure 3, V N and Z N are the voltage and impedance of the utility network, respectively, Z D G is the impedance of the installed DG system, and I F is the magnitude of the fault current. The voltage sag eventually results in a phase angle jump and that is determined by Equation (2), with X N , R N , X D G , and R D G representing the reactances and resistances of the utility network and installed DG, respectively.
Δ θ = tan 1 ( X N R N ) tan 1 ( X N + X D G R N + R D G )
If X N R N = X D G R D G , it is a so-called zero phase angle jump condition. The jump in angle occurs when the X/R ratio of the utility network and DG system are mismatched during the system operation. Thus, it is desirable to have the least phase angle jump in the voltage to ensure the maximum contribution of the DG system in the network. With the maximum contribution of the DG system, the total system losses occurring are governed by Equation (3) [24], with P L and Q L representing active and reactive line losses, respectively, i the respective bus number, and I N and I D G the network and DG currents, respectively.
P L + j Q l = ( I N + I D G ) 2 × [ ( R N + R D G ) + j ( X N + X D G ) ]

2.2. Distributed Load Flow Algorithm

A high R/X ratio, unbalanced loading, and the distributed nature of utility networks make some load flow techniques such as Gauss–Seidel, Newton–Raphson, etc., inefficient [25]. Hence, specialized algorithms such as the Backward/Forward Sweep (BFS) method are required for load flow analysis of radial distribution networks. Such techniques are based on Kirchhoff’s Current Law (KCL), which defines the current injections into the network as Equation (4) [26].
I i j = ( P i j + j Q i j V i j )
where I i j , V i j , P i j , and Q i j represent the current, voltage, and active and reactive power, respectively, at the i t h bus during the j t h iteration. Applying KCL to the test system in Figure 2 results in the Bus Injection to Branch Current (BIBC) matrix in Equation (5) [26]:
B A B B B C B D B E = 1 1 1 1 1 0 1 1 1 1 0 0 1 1 1 0 0 0 1 1 0 0 0 0 1 I A I B I C I D I E
The current variations at all the buses due to either load changes or faults causing corresponding voltage changes are defined by the Branch Current to Bus Voltage (BCBV) matrix in Equation (6) [26].
V A V A V A V A V A V B V C V D V E V F = Z A B 0 0 0 0 Z A B Z B C 0 0 0 Z A B Z B C Z C D 0 0 Z A B Z B C Z C D Z D E 0 Z A B Z B C Z C D 0 Z D F B A B B B C B D B E

2.3. Problem Formulation

The first objective of this research is to find the optimal location and size of a new DG in the utility network, which reduces the overall system losses and improves the voltage profile. Therefore, the objective function of this problem can be formulated as Equation (7),
F ( X D G , P D G , Q D G ) = m i n ( γ 1 V s a g + γ 2 S L + γ 3 Δ θ )
where i 3 γ i = 1 and γ [ 0 , 1 ] is the weighted coefficient. The optimization problem defined in Equation (7), with its members defined in Equations (1)–(3), has equality, inequality, and bound constraints. The equality constraints are explained using Equation (8), which states that the sum of the utility power ( S N ) and DG power ( S D G ) should be equal to the sum of the total system load ( S L o a d ) and losses ( S L ) in order to maintain the balance of power and ensure the system stability. However, the load profile considered in Equation (8), which in this case is a combination of industrial, commercial, and residential entities with a cumulative capacity of 5.6 MVA at different power factors, is assumed to be fluctuating at a steady rate from 2.5 MW to 5.0 MW within the scheduled time frame.
S N + S D G = S L o a d + S L
With the successful integration of the DG with the utility network, the system losses need to be lower than the allowed thermal limits of the lines. Therefore, the X/R ratio of the new DG ( X D G R D G ) should be less than the cumulative X/R ratio of the load and utility ( X L R L + X N R N ), satisfying the phase angle jump condition, as described by the inequality constraint in Equation (9).
X D G R D G < X L R L + X N R N
Further, it is assumed that the location of the new DG ( X D G ) is near the load center, so the iteration of the GA always starts from Bus-B ( X B u s B ) and ends at Bus-E ( X B u s E ), as defined by Equation (10).
X B u s B X D G X B u s E
Moreover, the size of the new DG ( S D G ) may be less than or equal to the total connected load ( S L o a d ), but should be always greater than the system losses ( S L ), as explained by Equation (11).
S L < S D G S L o a d
The voltage at all the buses ( V B u s ) should be within the defined lower ( V L o w ) and upper ( V H i g h ) tolerance limits of ± 10 % , which define the bound constraint using Equation (12) together with Equations (10) and (11) on the objective function in Equation (7).
V L o w V B u s V H i g h
As a part of the optimization problem, the financial constraints also need to defined for the optimal placement of new DGs and the possible return in terms of loss reduction. The capital cost ( C c ) in $/h upon installing a new DG is defined by Equation (13):
C c = α 1 S D G 2 + α 2 S D G + α 3
where α 1 , α 2 , and α 3 are the cost coefficients, and their values not only depend on the size and nature of the incoming DG, but also the characteristics of the utility network under investigation. In this research, their values are chosen as 0.1, 0.23, and 0.34, respectively. Based on these values, the cost of installing a given synchronous DG of size 3.33 MVA is about 2.125 $/h. Hence, the daily return (R) achieved in $ on the loss reduction after an optimal integration of DG is determined by Equation (14):
R = Δ P L × E R × T D
where Δ P L is the change in the active power loss of the network, E R is the tariff rate of supplied energy, and T D is the time duration of DG operation. The values of E R and T D selected for this research are 0.015 $ / kWh and 24 h, respectively.

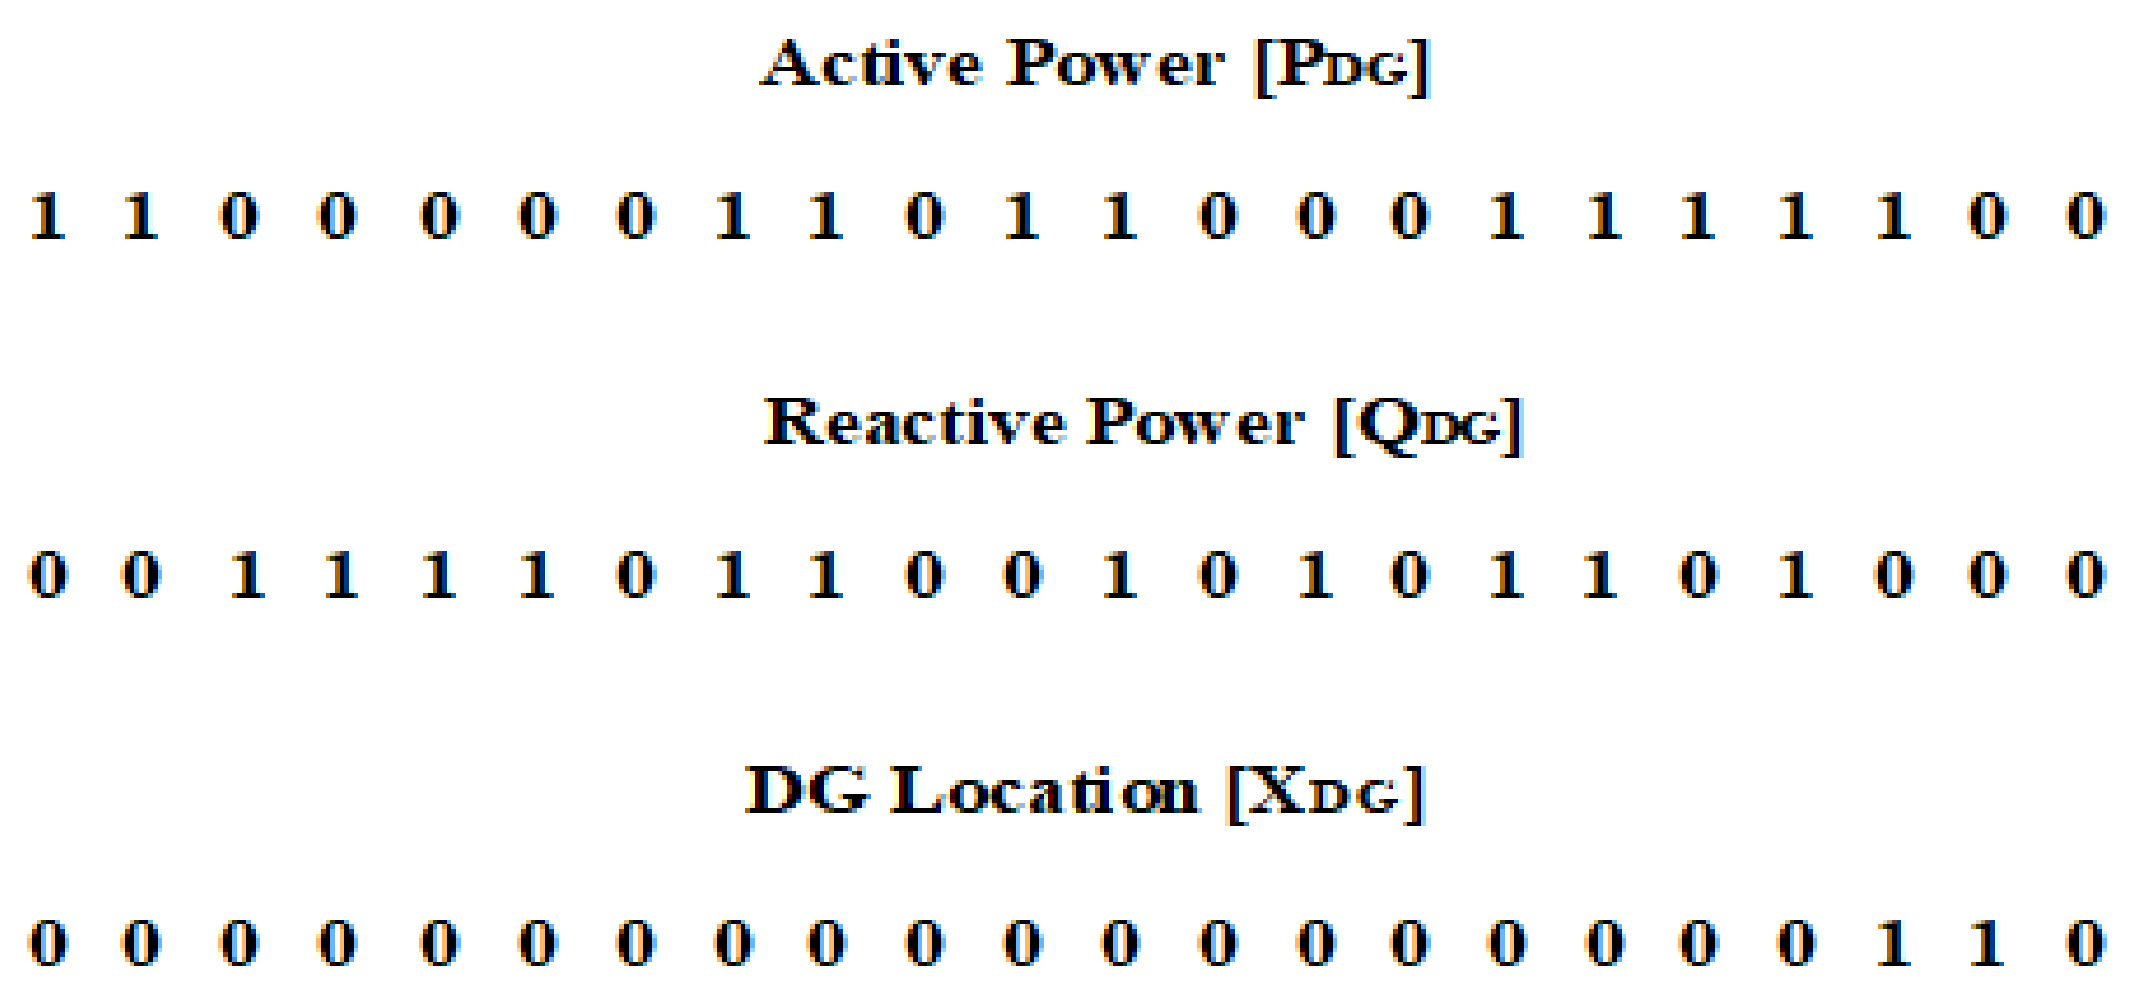
2.4. Genetic Algorithm

The Genetic Algorithm (GA) is a biologically-inspired method based on Darwin’s principle, which evaluates the best possible set of solutions for the fitness of human beings [27]. The main reason for using GA for our application is its parallel search for points from the population. Therefore, it cannot be trapped into a local optimum like conventional techniques, which search for a single point in each iteration. The GA is a probabilistic approach rather than a deterministic and does not involve any derivatives or auxiliary data, but uses fitness parameters to search for the optimal solution.
The GA outputs different chromosomes as shown in Figure 4 for the optimal location and size of the DG based on the constraints of the objective function in Equation (7) for maximizing the voltage profile of the system and minimizing the power losses. Evaluating the objective function using two operators, mutation and crossover, the new set of chromosomes is generated. The crossover operator is used to find the best possible parameter space, and the mutation operator guards the resultant information such that it is encrypted. The stopping criteria for GA are based on two conditions, i.e., either the value of the objective function calculated from the new set of chromosomes is less than the pre-defined error or the maximum number of iterations for the system has been reached. In this research, the crossover and mutation operators (C and M) are assigned probabilities of 0.7 and 0.2, respectively. The algorithm is initialized with a set of 15 chromosomes for 36 iterations, and the final set of chromosomes in Figure 4 defines the best possible location and size of the new DG, obtained with the optimal solution of the objective function in Equation (7).

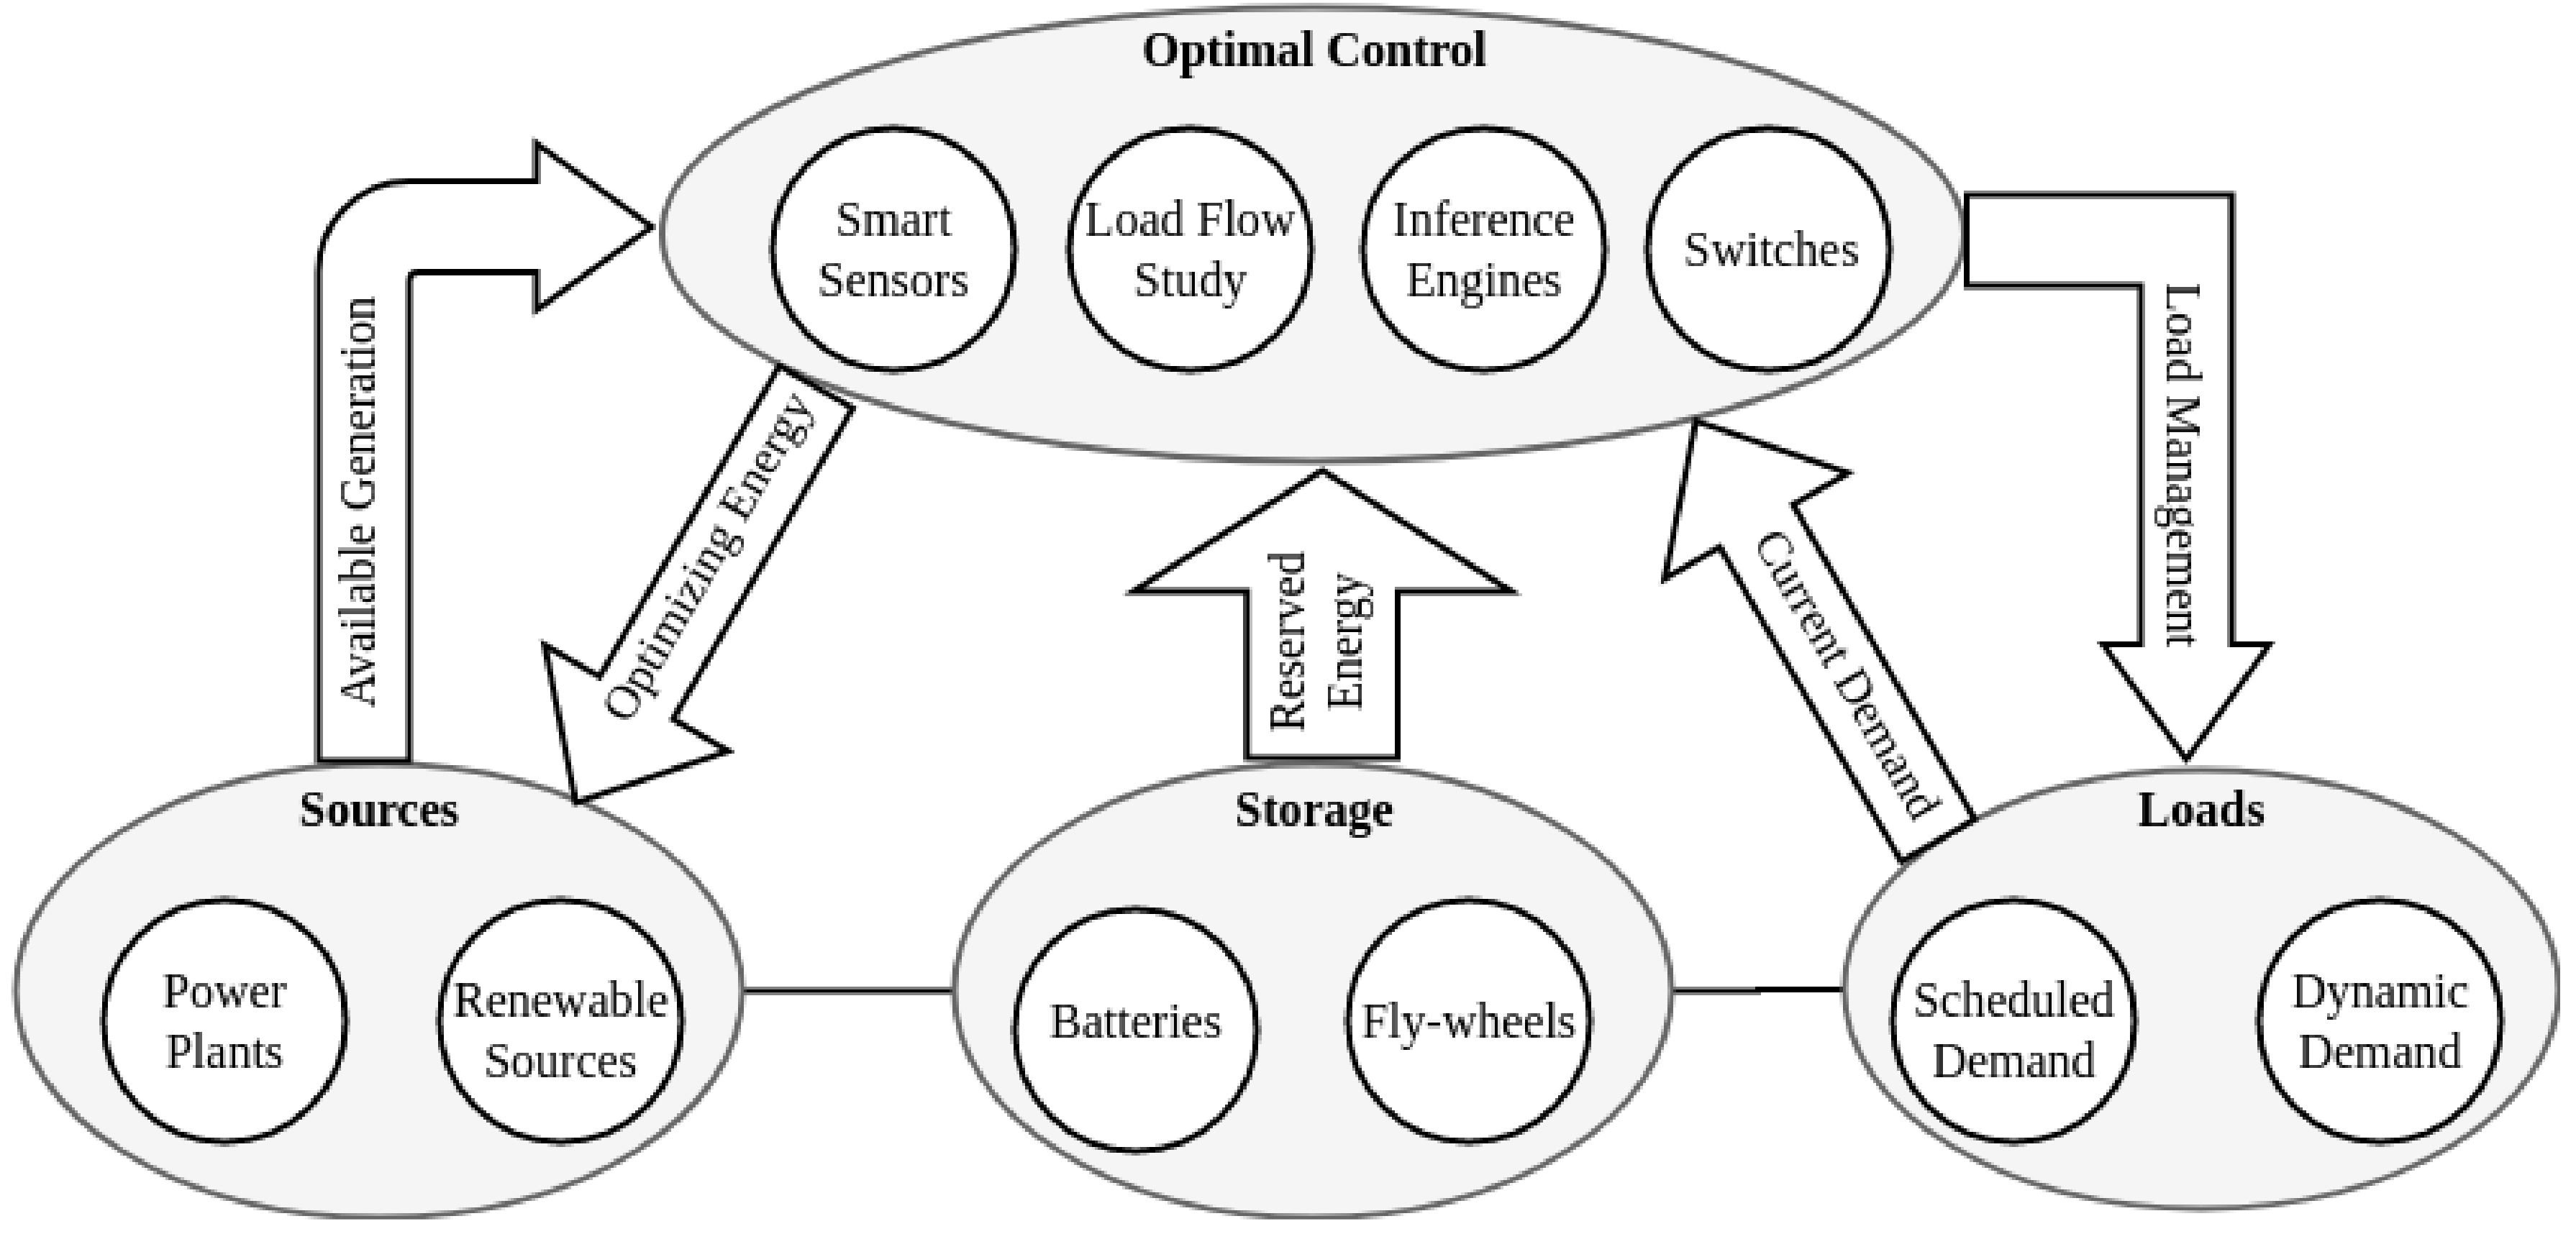
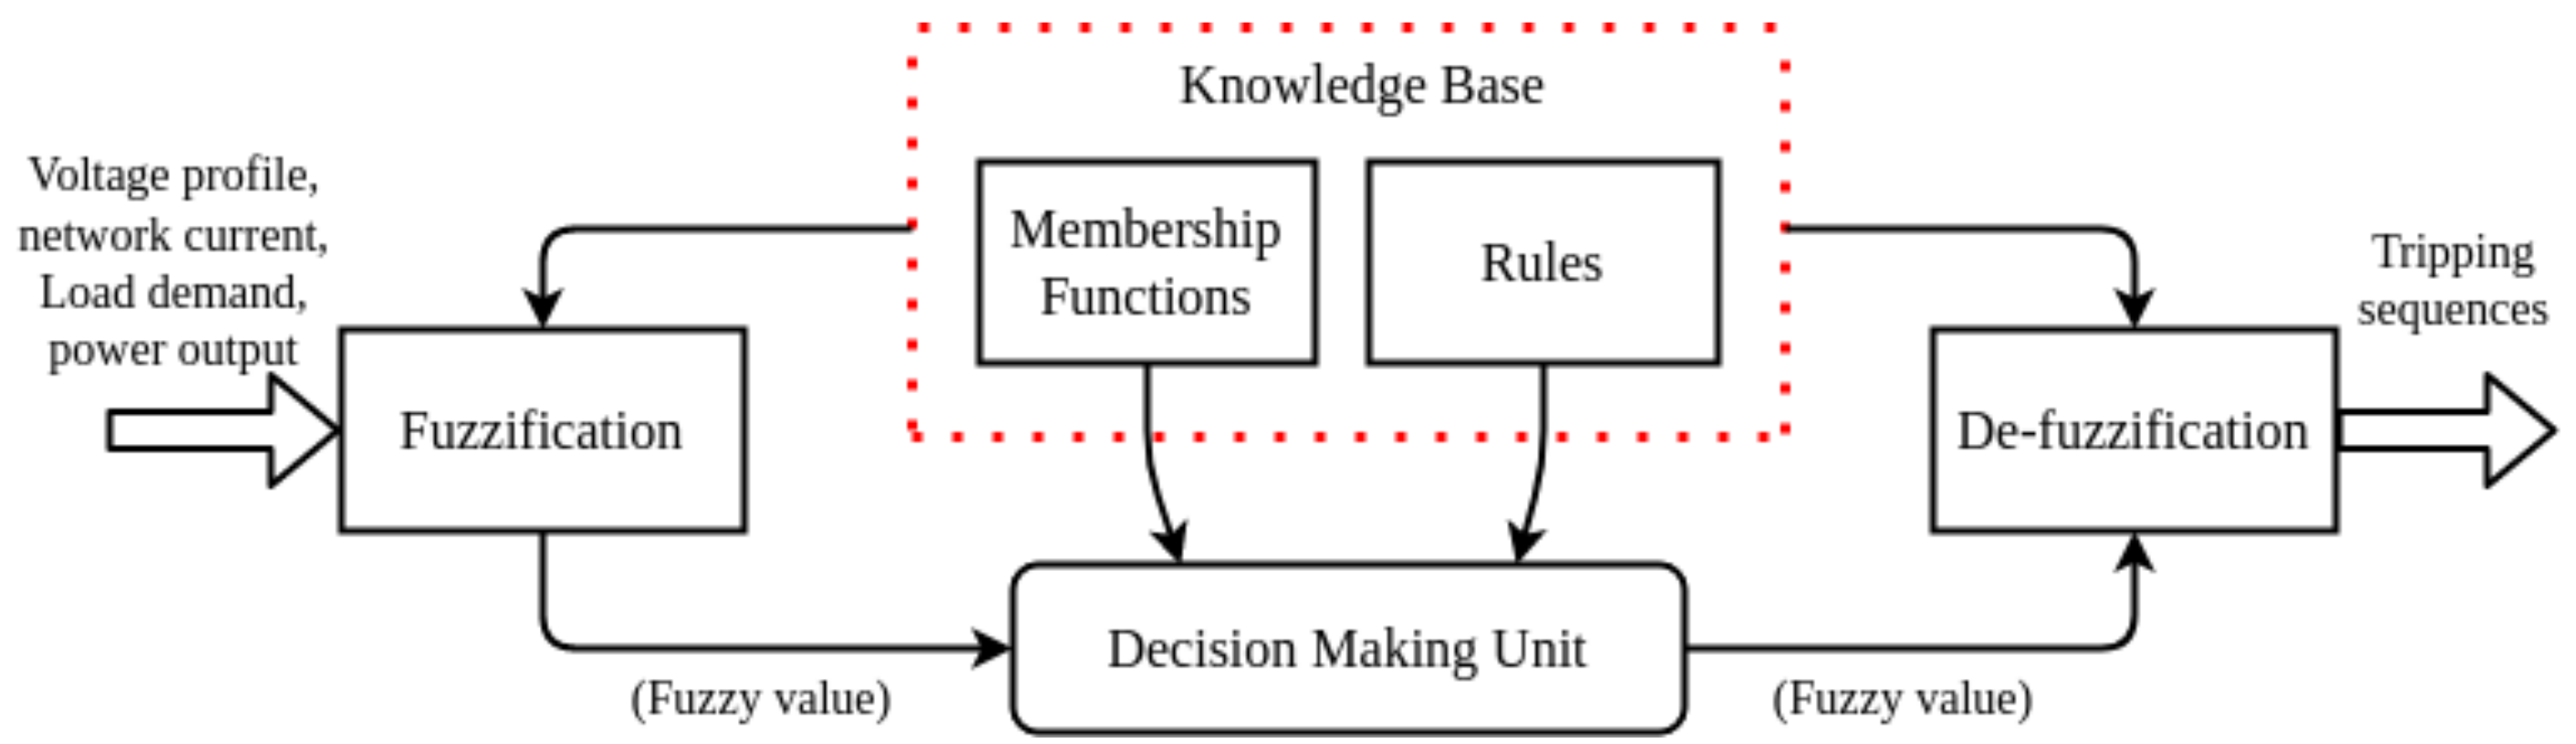
2.5. Fuzzy Inference System

A Fuzzy Inference System (FIS) is based on if-then conditions to make approximations of complex nonlinear functions, representing the trends of network variables. The FIS mainly consists of five major functionalities for exploiting qualitative features of human reasoning and decisions in terms of data sets without considering their quantitative aspects in particular, as shown in Figure 5, where the fuzzification module transforms the numerical values of the system variables, i.e., current, voltage, and power, into fuzzy values by leveraging a knowledge base having pre-defined rules with the respective correspondence of the variables defined using membership functions. Such fuzzy values are given as the input to the decision making unit, which acts as an inference engine to generate switching sequences according to the network conditions. The resultant switching sequences are de-fuzzified using information from the knowledge base, to make them compatible with the tripping operation of appropriate breaker.
The input variables to the FIS in this research use the Gaussian membership function, which is defined by Equation (15):
f i , j ( x i ) = e x p { 1 2 ( x i μ j σ j ) 2 }
where x i represents the system variables and μ j and σ j are the mean and variance of the Gaussian function, respectively. Further, the set of rules is defined considering the first order Sugeno formulation, and the corresponding output is thus given by Equation (16) [28].
y = m = 1 N τ m ( r V p + s I p + t P l o a d + u P o + v ) m = 1 N τ m
where N is the total number of rules developed, which in this case is 12. V p , I p , P l o a d , and P o are the voltage profile, system current, load demand, and cumulative power output of the sources, respectively. r, s, t, u, and v are the parameters of the inference engine, and τ m is the triggering instant of the respective rule.
The proposed framework for the optimal placement of new DGs and effective energy management under normal and contingency conditions is summarized in Algorithm 1.
Algorithm 1: DG placement and energy management.
Electronics 10 00172 i001
In Algorithm 1, the GA and FIS are leveraged together in a unified framework to not only increase the benefits of integrating new DGs, but also to regulate the power flow under different network conditions to optimally meet the load demands. The input to the framework is the voltage profile, which includes variations in its magnitude ( V s a g ) and phase angle ( Δ θ ) and the system losses ( S L ), and the output is the desired switching profile. For all the input variables of the test network in Figure 2 determined using distributed load flow algorithms using Equations (4)–(6), if their values are less than or equal to the pre-defined norms, the GA computes the optimal location and size of the incoming DG using Equation (7) provided all the constraints in Equations (8)–(12) are satisfied; otherwise, the GA output is discarded, and the loop repeats until it achieves the desired outcome. Once the optimal location and size of the new DG is determined, then different contingencies are simulated similar to real-time conditions, i.e., load deviations, islanding, faults, etc. Under such scenarios, the cumulative supply from the DGs and grid sources is checked against the desired load profile and losses to generate controlled switching sequences using the FIS. Abnormality is detected using the current profile of the system, and if it is found, the FIS either trips the associated breakers or regulates the energy flow to minimize the adverse effects of the given contingency. Conversely, if the system operates in the normal condition given that the sum of the supply from the DGs and grid is equal to the sum of the load demand and system losses, the FIS remains inactive.

3. Results and Discussion

In the proposed framework, the environment is initially created in Simulink, as a first step to test the idea, and it is then validated on a Power Hardware-In-the-Loop (PHIL) setup in real time as a proof of concept for practical results, as shown in Figure 6. In Figure 6, the power system simulator replicates the characteristics of the utility network defined in Figure 2. The PXI platform simulates the response of the DG technology, while the grid control server implements the optimization techniques (FIS, GA, etc.) to regulate the system operation and performance, and the communication system simulator is used to develop a communication path between different interfaces. Further, it uses Phasor Measurement Units (PMUs) that measure the magnitudes of the voltage, current, and phase angle jump. The results presented in the following subsections are the final outcomes from the PHIL setup in Figure 6.

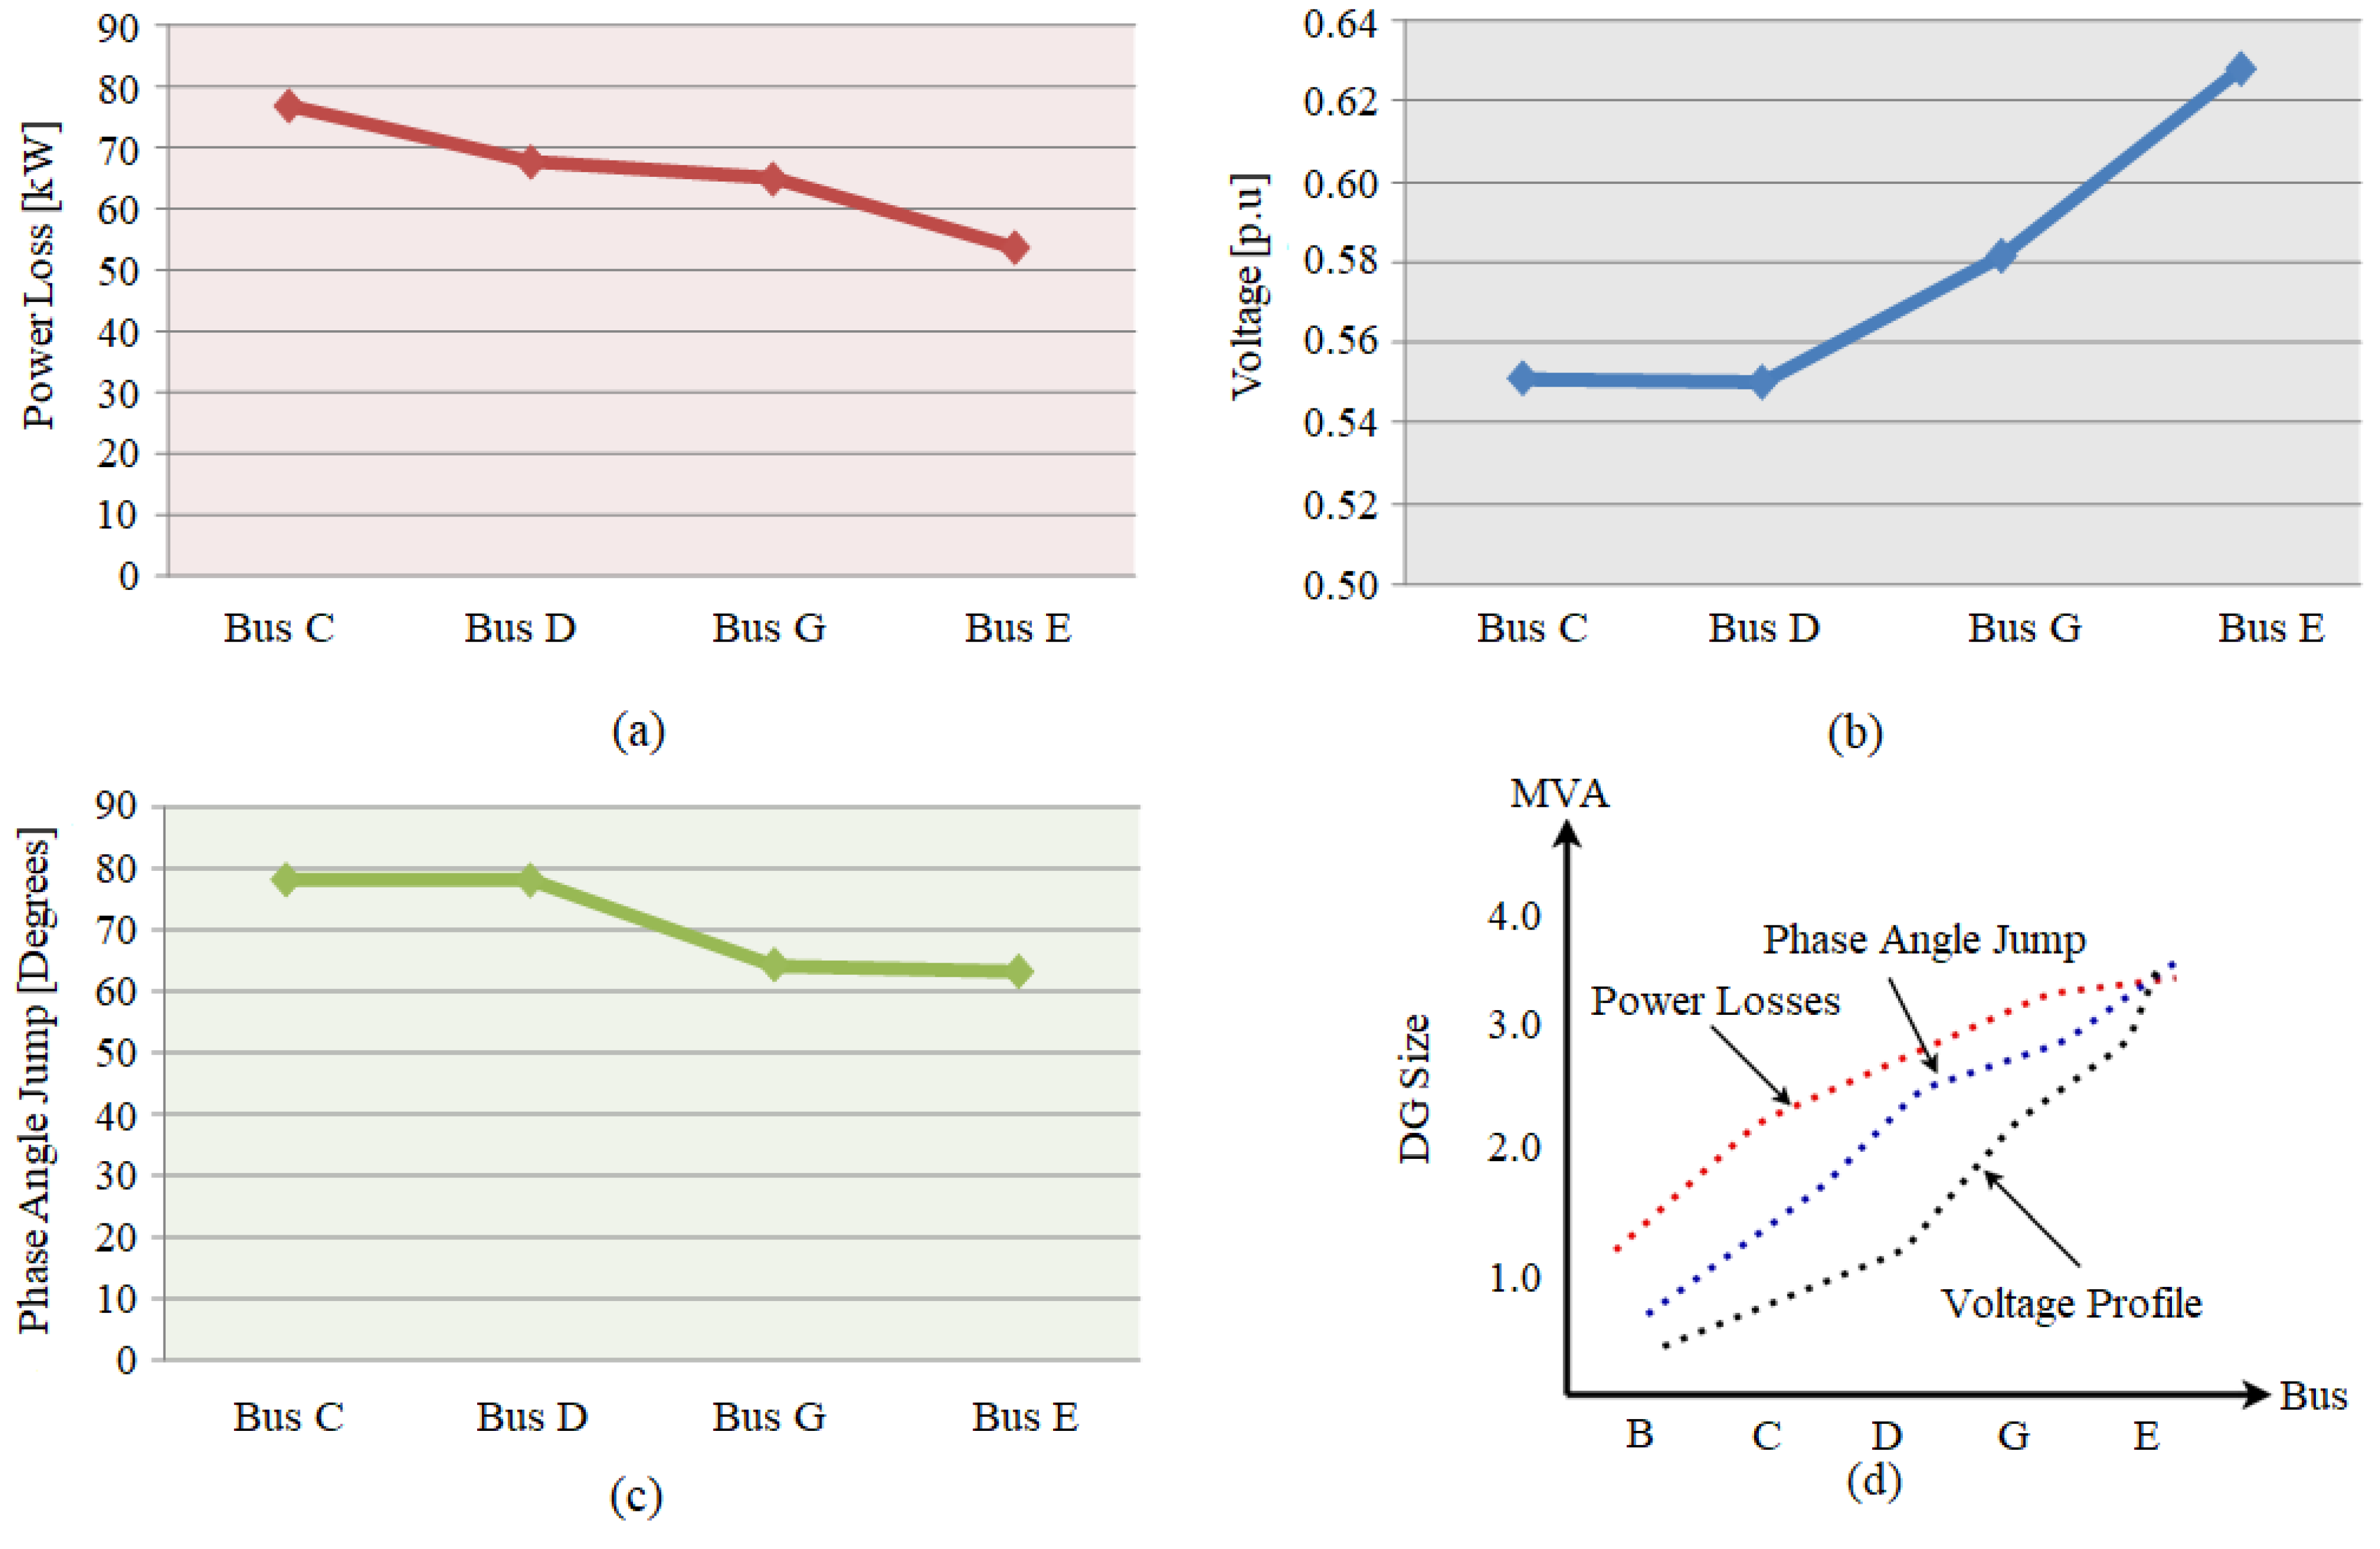
3.1. Optimal Location and Size of the DG

The installation of a new DG however has positive impacts on the network performance, thereby reducing the power losses and improving the voltage profile. However, based on the optimal location and size of the DG, the characteristics of the utility network change accordingly. In order to evaluate the performance of the test network in Figure 2 against the power losses, voltage sag, and Phase Angle Jump (PAJ), the following three distinct scenarios are considered.

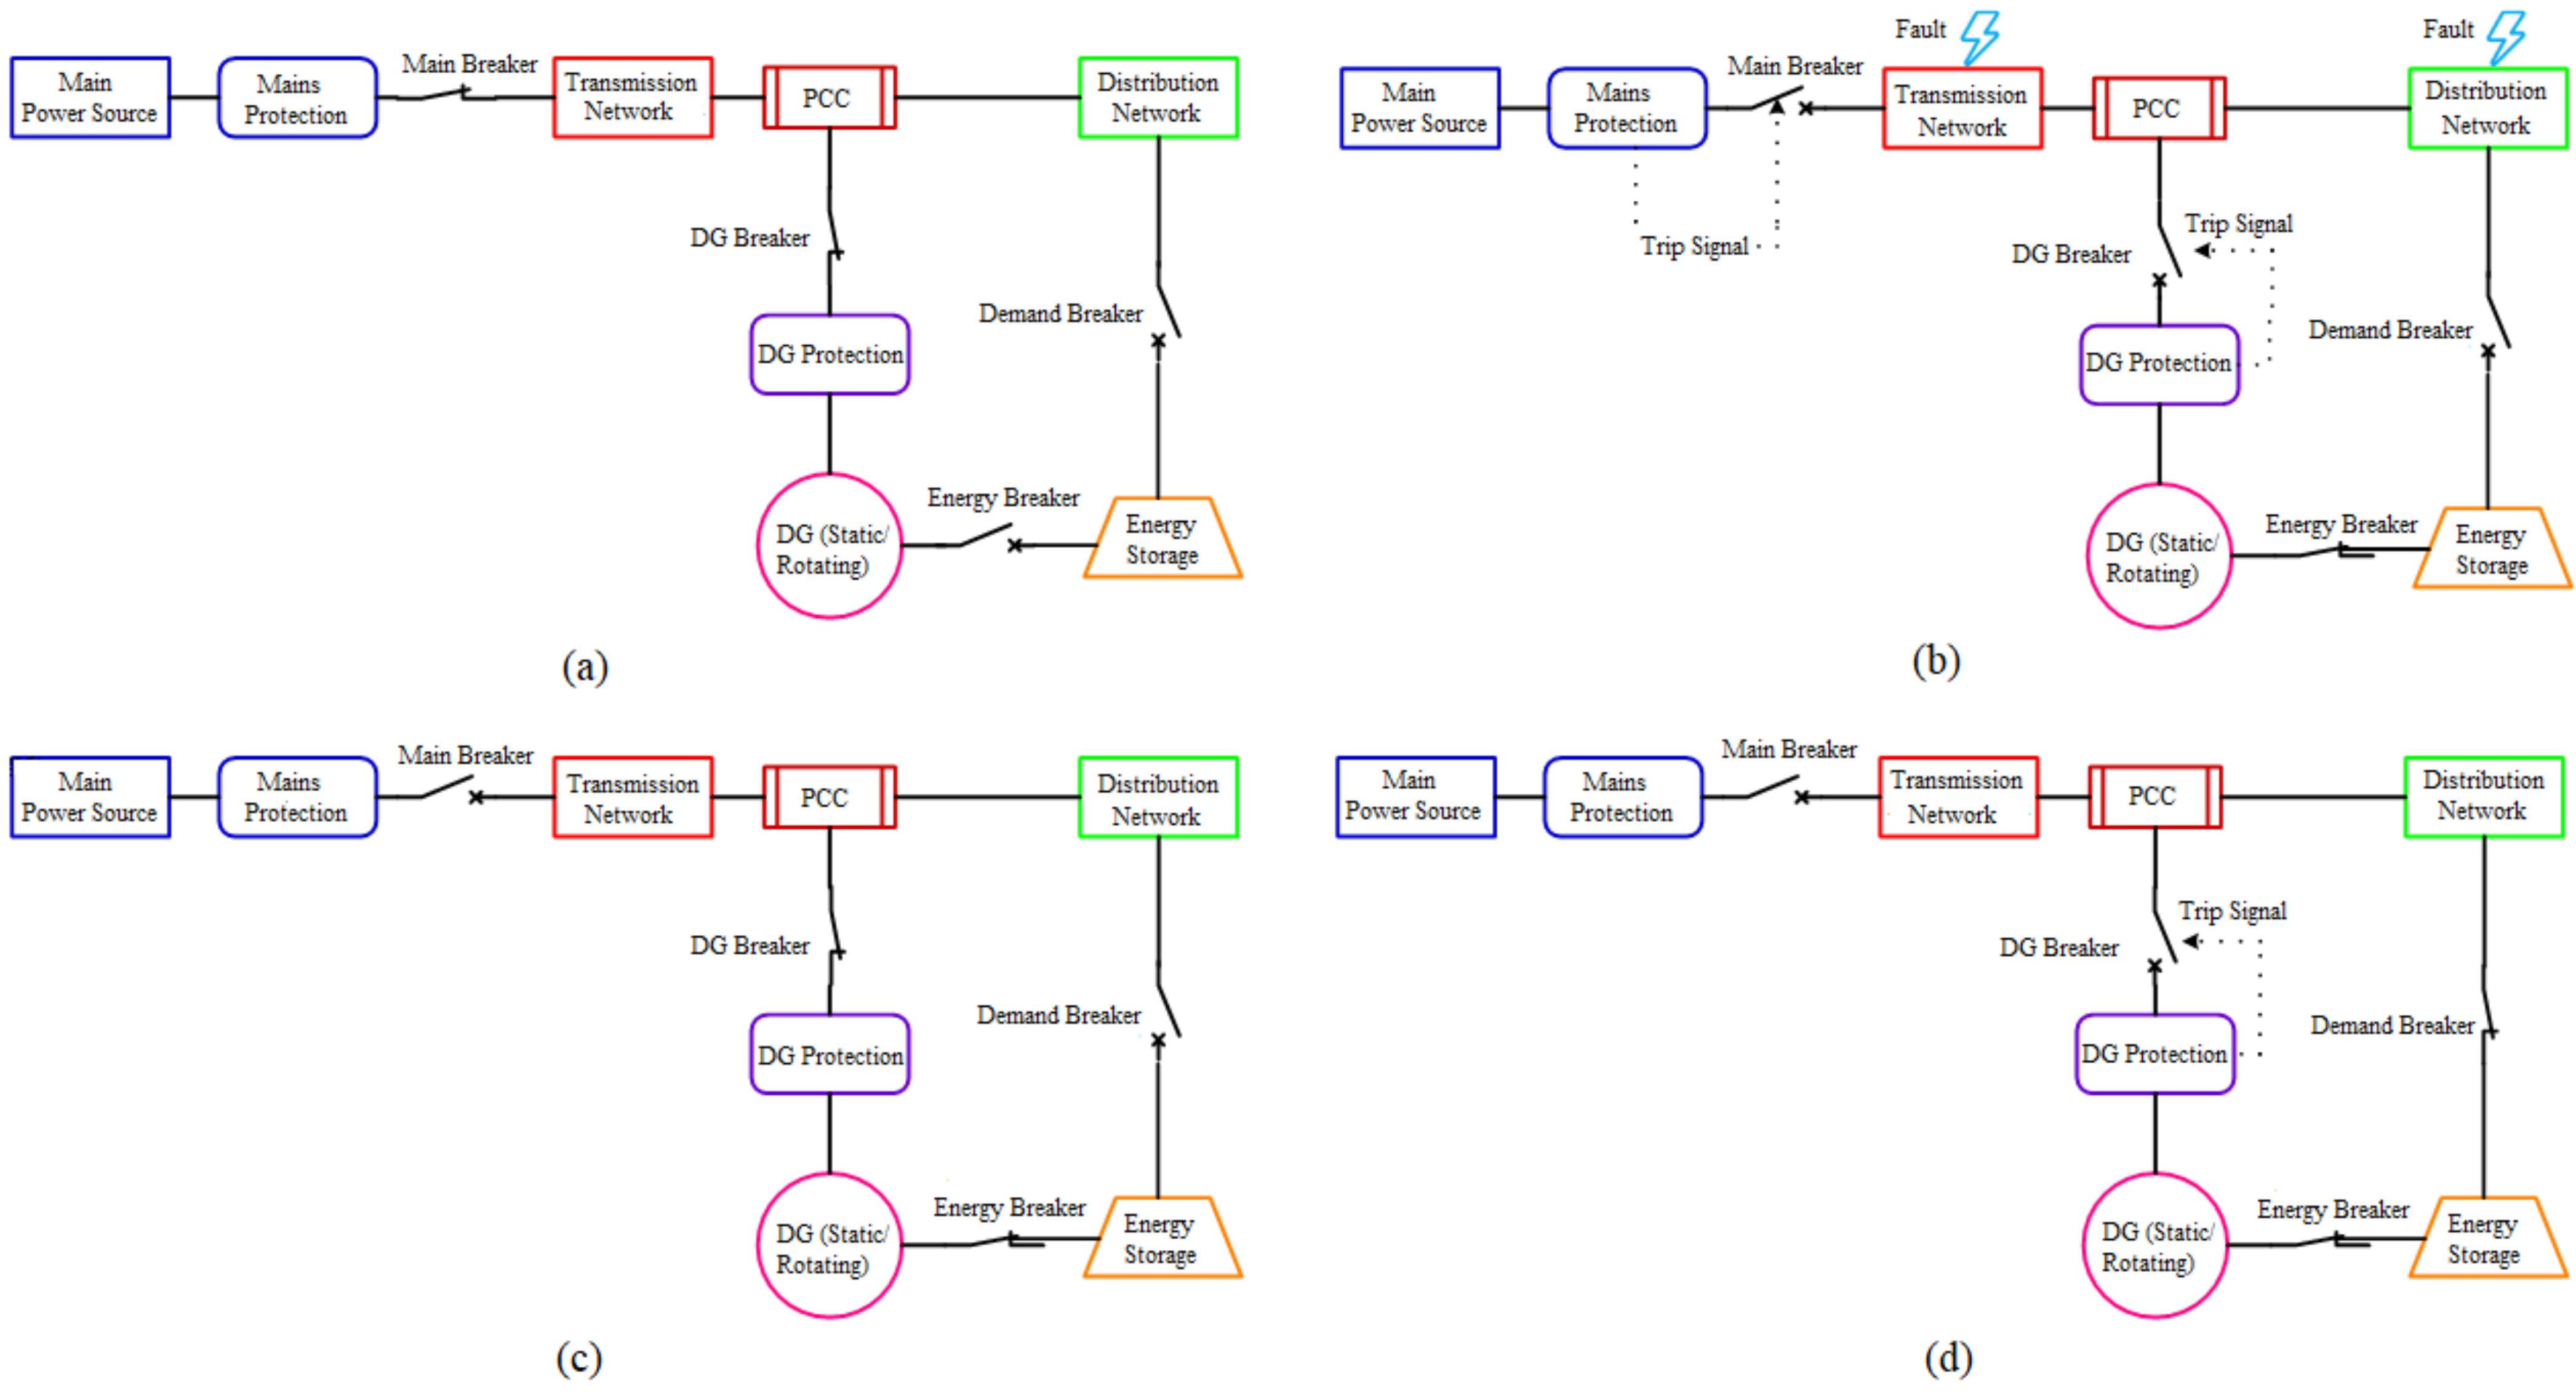
3.1.1. Normal Condition

Under the normal condition, the integration of the DG improves the system performance as shown in Figure 7. The power loss at Bus-C beforehand is about 154.654 kW, as shown in Figure 7a, and reduces to 103.789 kW when the DG is connected at Bus-E near the load center, which gives an instant return of approximately $0.793 per hour. Due to the radial nature of the test network in Figure 2, the voltage drop however should increase, as we move away from the sources. However, due to the presence of the DG, it is still under the permissible limits of ± 10 % , as illustrated in Figure 7b. Moreover, the value of the PAJ varies with the deviations in the combined X/R ratio of the feeder and DG with respect to the source, and its minimum value occurs at Bus-E, as indicated in Figure 7c. Based on all such network characteristics, the best location of the new DG during the normal condition is found to be at Bus-E near the load center with the optimal size of 3.1735 MW and 1.136 MVAr, determined using the GA, as shown in Figure 7d. It is evident from Figure 7d that the network characteristics intersect at Bus-E after 30 iterations, specifying the optimal location and size of the new DG.

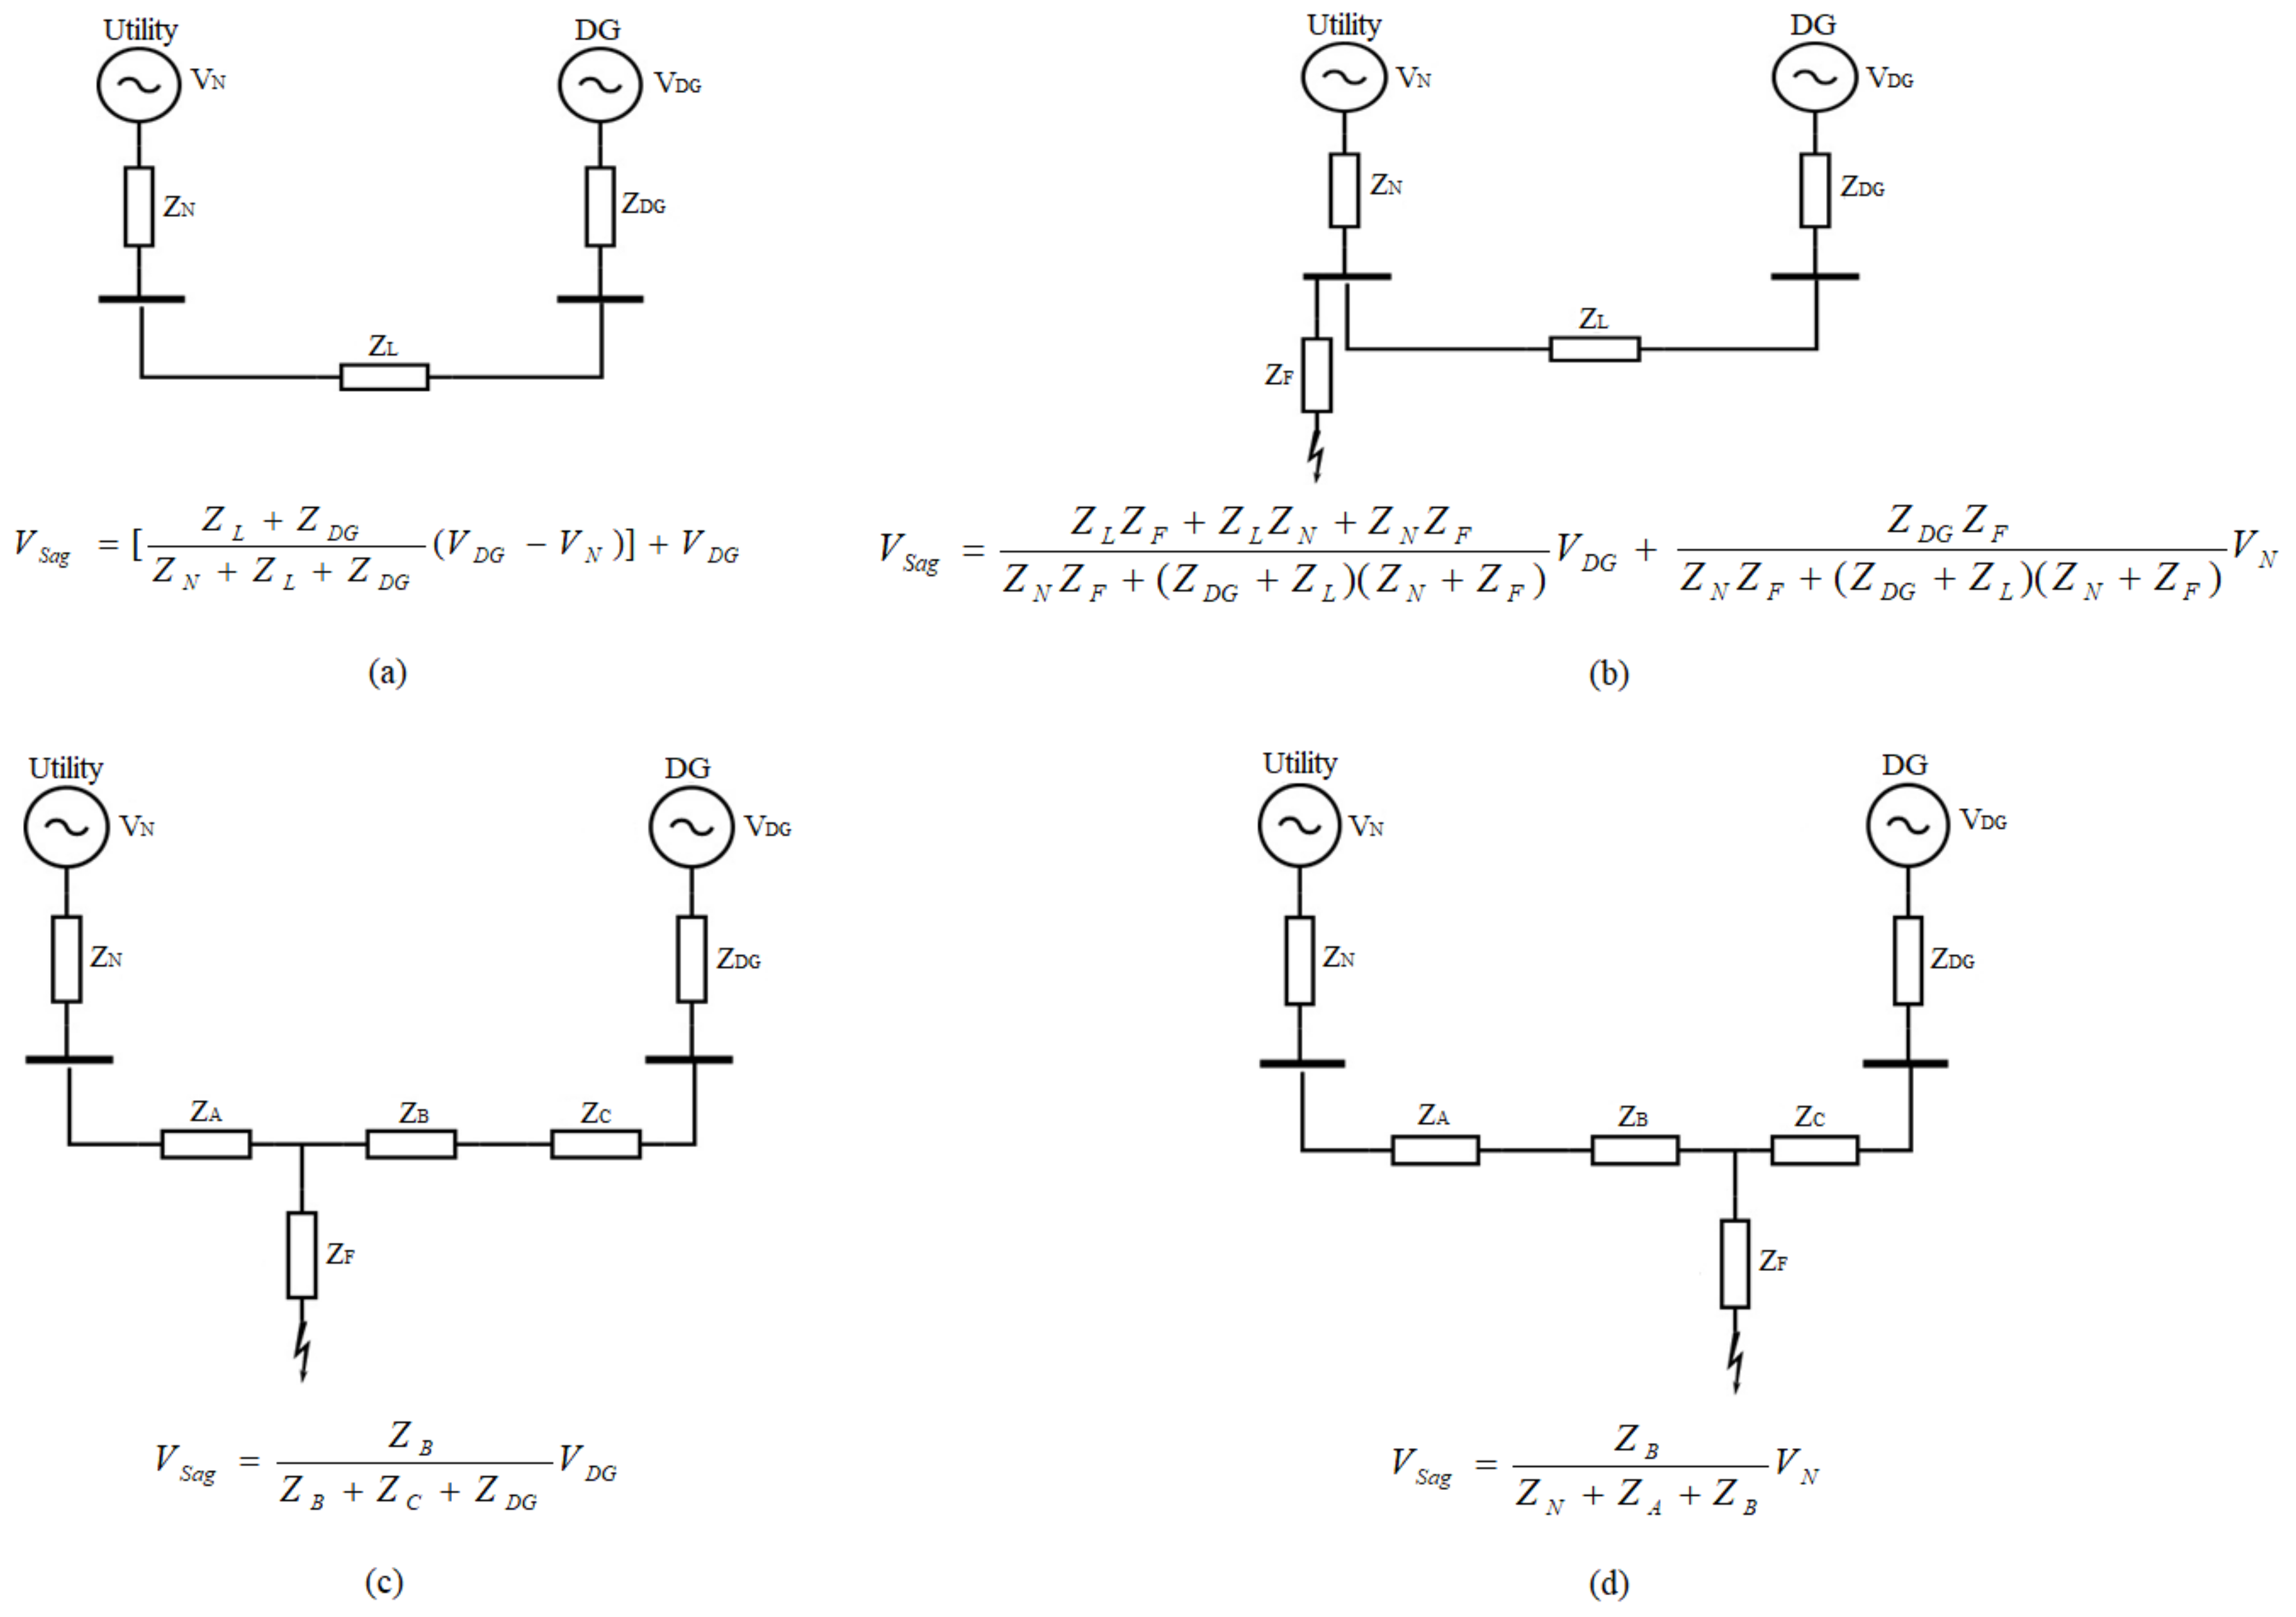
3.1.2. Fault Condition

With the inception of symmetrical fault in the network, a huge amount of current starts to flow. Under such conditions, the DG should not be operated, otherwise it will contribute to the fault current and may even not only harm the network, but also itself. The isolation of the DG during fault conditions depends on its dedicated protection scheme, and if it fails to operate, this results in the DG continuing to supply power, which is hazardous for the network personnel. For fault conditions, if the fault occurs near the source, the amount of power loss, that is 278.93 kW, is higher than that occurring near the load center at Bus-G, i.e., 195.75 kW, as shown in Figure 8a, which gives a savings of approximately $ 1.248 per hour. It can be seen from Figure 8a that there is not a big difference between the losses at Bus-G and Bus-E. Further, the voltage limits are also violated at both, and among all, the best voltage profile is maintained at Bus-E, i.e., 0.7812 p.u., as illustrated in Figure 8b. Moreover, the PAJ excursions, shown in Figure 8c, are highest at Bus-C and lowest at Bus-E, i.e., 73.7509 radians. In view of such system characteristics, the optimal location of the DG is determined to be at Bus-E with a size of 3.1735 MW and 1.009 MVAr. However, during the fault condition, the desired solution using GA is obtained after 32 iterations, when the network characteristics intersect each other, which in this case again is at Bus-E, as illustrated in Figure 8d.

3.1.3. Islanding Condition

During the islanding condition, a power imbalance occurs owing to the fact that the DG alone is unable to supply all three types of connected loads, i.e., industrial, commercial, and residential, as shown Figure 2. Under such a scenario, the power loss in the system is low (with a reduction of about 26.707 kW, which gives a return of $0.4 per hour) because a lesser amount of current flows, as shown in Figure 9a, but unfortunately, the voltage profile is worse, violating the allowable tolerance limits due to the extra loading on the DG, as illustrated in Figure 9b. Further, the PAJ variations are least at Bus-C under such a condition, as presented in Figure 9c. Due to the network characteristics, a compromise decision is made to decide the best possible location and size of the new DG. However, the amount of power losses is least and the voltage profile is better at Bus-E; on the other hand, the PAJ deviations are small at Bus-C. Therefore, the best location during the islanding found using GA is at Bus-D with a size of 3.1735 MW and 1.009 MVAR, as shown in Figure 9d. It is evident from Figure 9d that the desired results are obtained after 35 successful iterations of the GA.

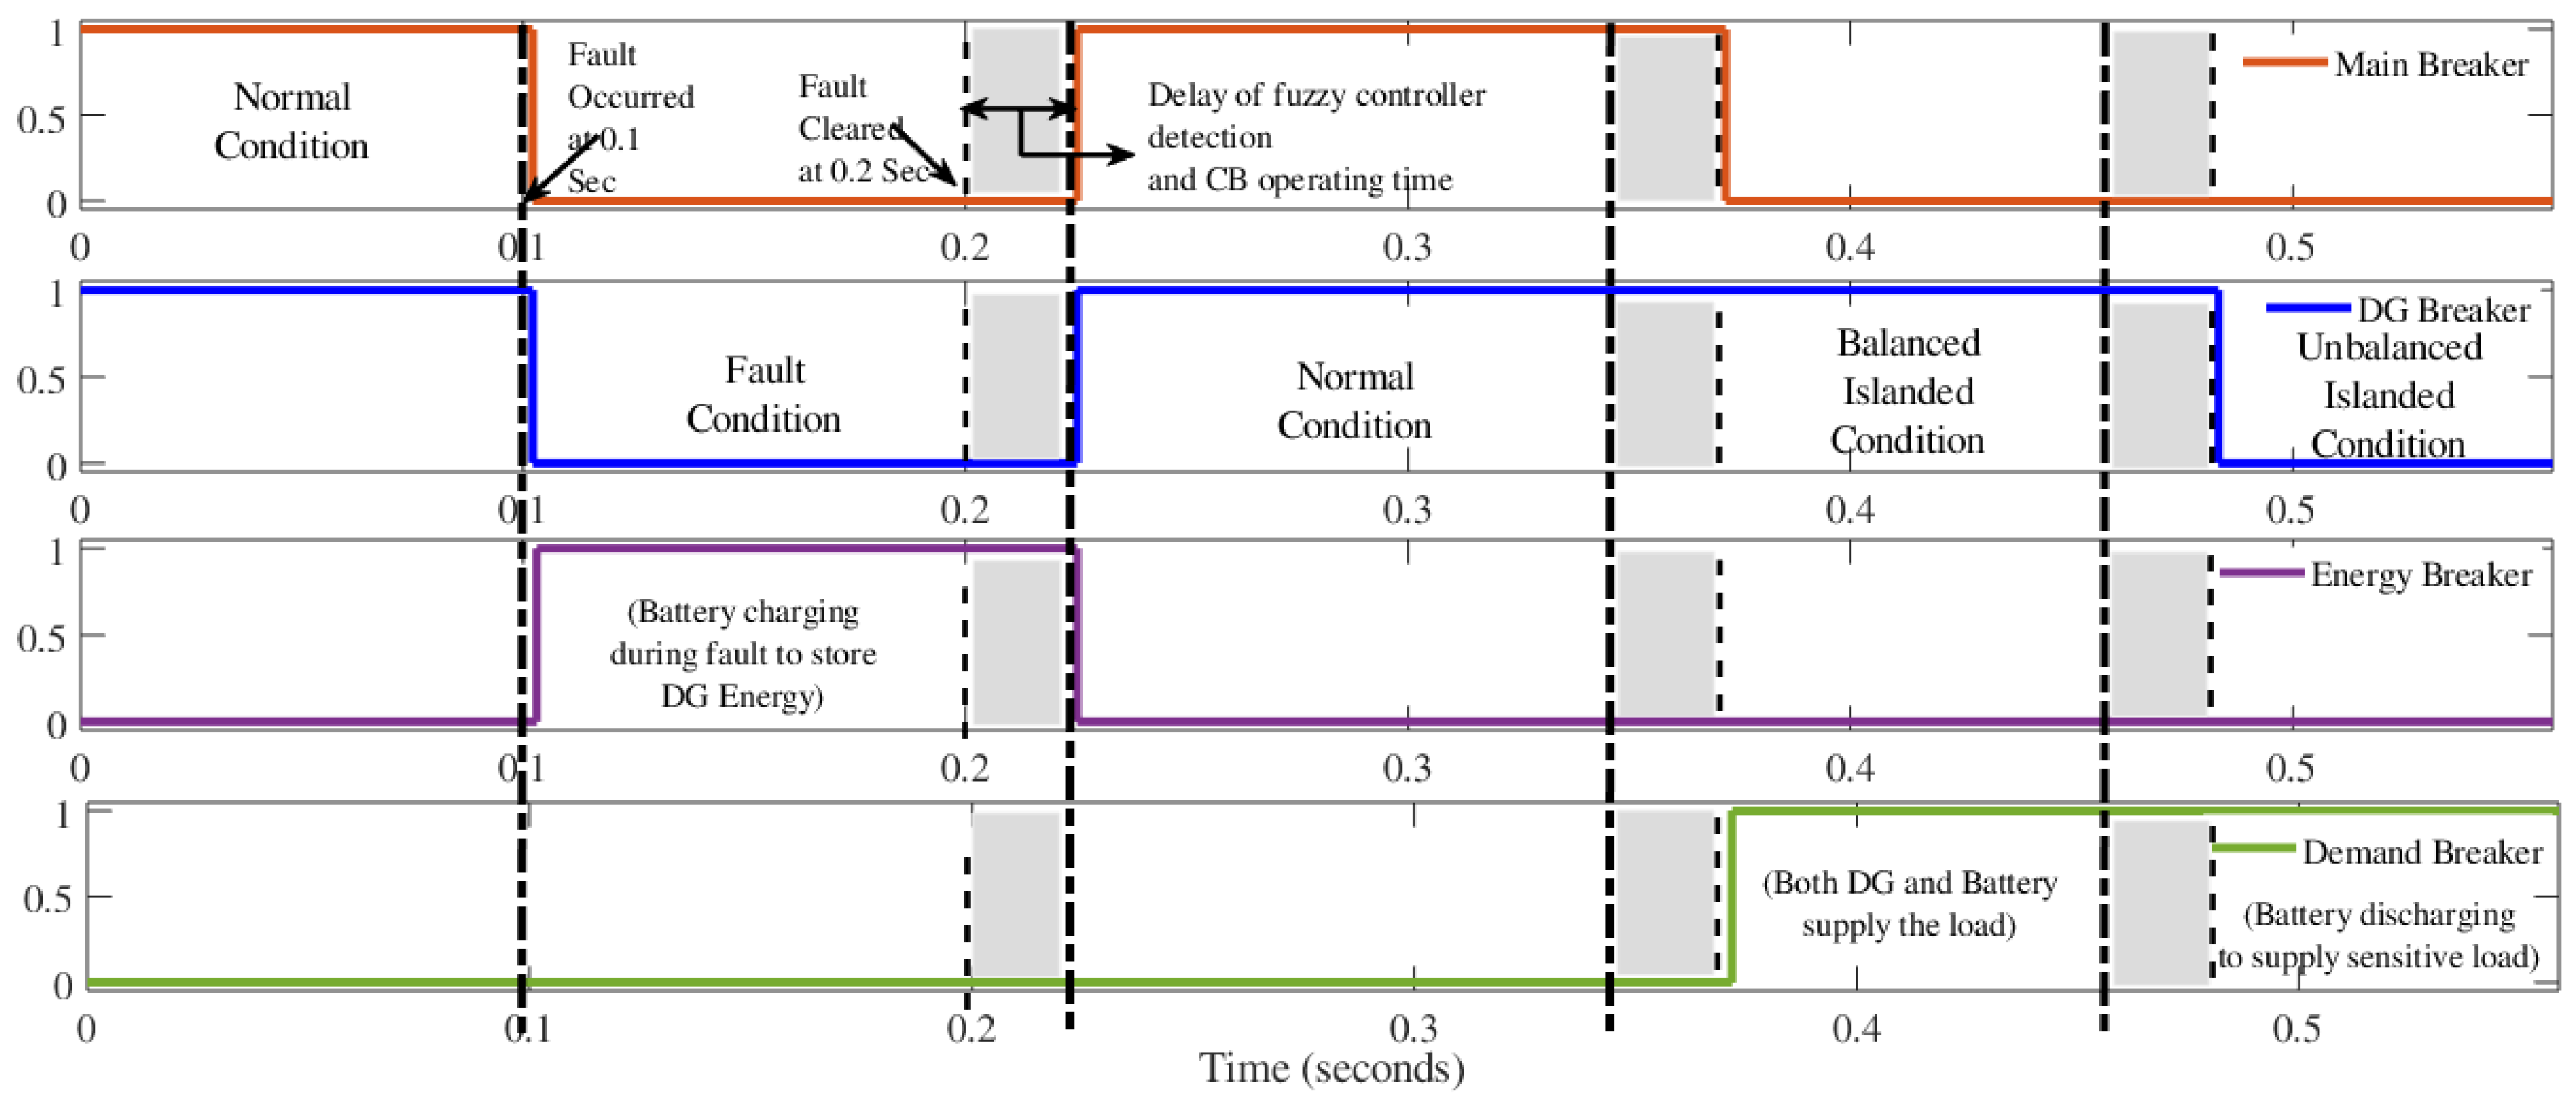
3.2. Energy Management System

The performance of the utility network during the fault and islanding conditions is extremely compromised if corrective measures are not taken in a timely and efficient manner. However, even with the proper placement and size of the new DG, such adverse effects diminish, but still prevail in the system for a long time if proper strategies are not designed. Further, the reliability and robustness of the system against the fault and islanding conditions are lost and thus require designing an adaptive and efficient EMS to deal with them effectively, with the aim of improving the system performance. The energy management strategies proposed, designed, and validated under normal and contingency states are presented in Figure 10. The FIS is used for generating the different switching schemes, as shown in Figure 11 for the proposed strategies in Figure 10.

3.2.1. Normal Condition

Under the normal condition, when all the network constraints are within the pre-defined limits and the system is operating efficiently, the proper placement of the DG reduces the system losses and improves the voltage profile. The energy management strategy designed for such a network condition is presented in Figure 10a. In this scenario, the protection schemes of the DG and the main supply are inactive, and the energy breaker is responsible for energy management under abnormal conditions, while the demand breaker is used to meet the increased load demands during the critical situations. Both of these breakers are disconnected during the normal condition. In the normal state, the main supply and DG collectively meet the power demands of end-users, as shown in Figure 11, with both the energy and demand breakers being switched off.

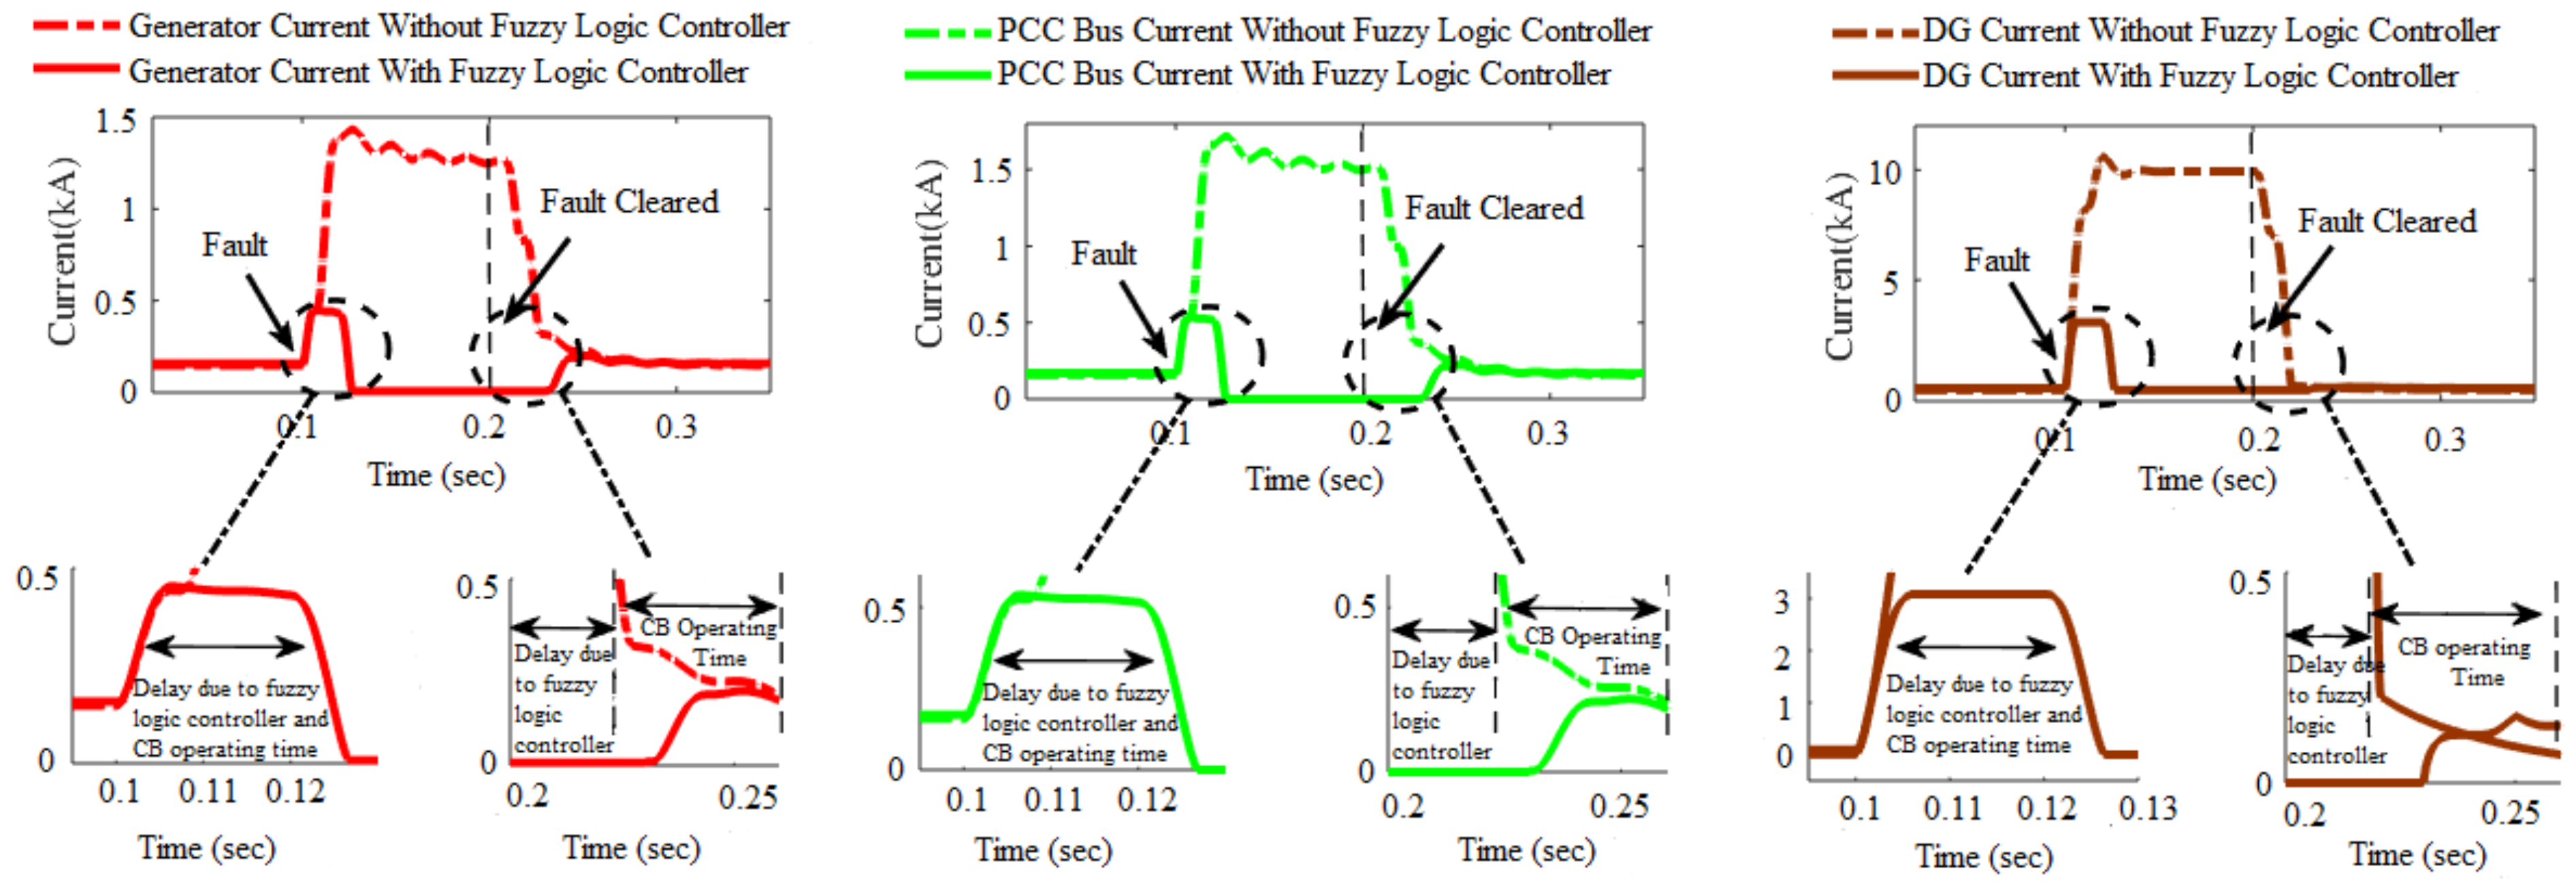
3.2.2. Fault Condition

When the faults occur in the system either at the transmission or at the distribution side, the protection schemes of the mains and DG need to function in timely manner and thus isolate the sources. Under this condition, the energy generated by the DG may be stored for later use when the faults are removed, and this necessitates using an Energy Storage System (ESS). The energy management strategy designed to deal with different fault conditions is proposed in Figure 10b. In this condition, the energy breaker remains closed, and the demand breaker is open until a fault is present in the system. With the fault occurring near the load center at 0.1 s in Figure 12, the fuzzy logic controller instantly detects it in Figure 11 due to the abrupt changes in the network current and trips the main and DG circuit breakers, while the energy breaker remains closed to store the DG’s energy. When the fault is cleared at 0.2 s, the main and DG breakers get closed after a 1.5 cycle delay, caused by the fuzzy logic controller and circuit breaker operating time sequences, as shown in Figure 13. In Figure 13, at 0.3 s, the network is restored to its normal state after the fault elimination. Further, at 0.35 s, the grid is disconnected, and the network enters into an islanding mode; thus, the power flow from the grid drops to approximately zero.

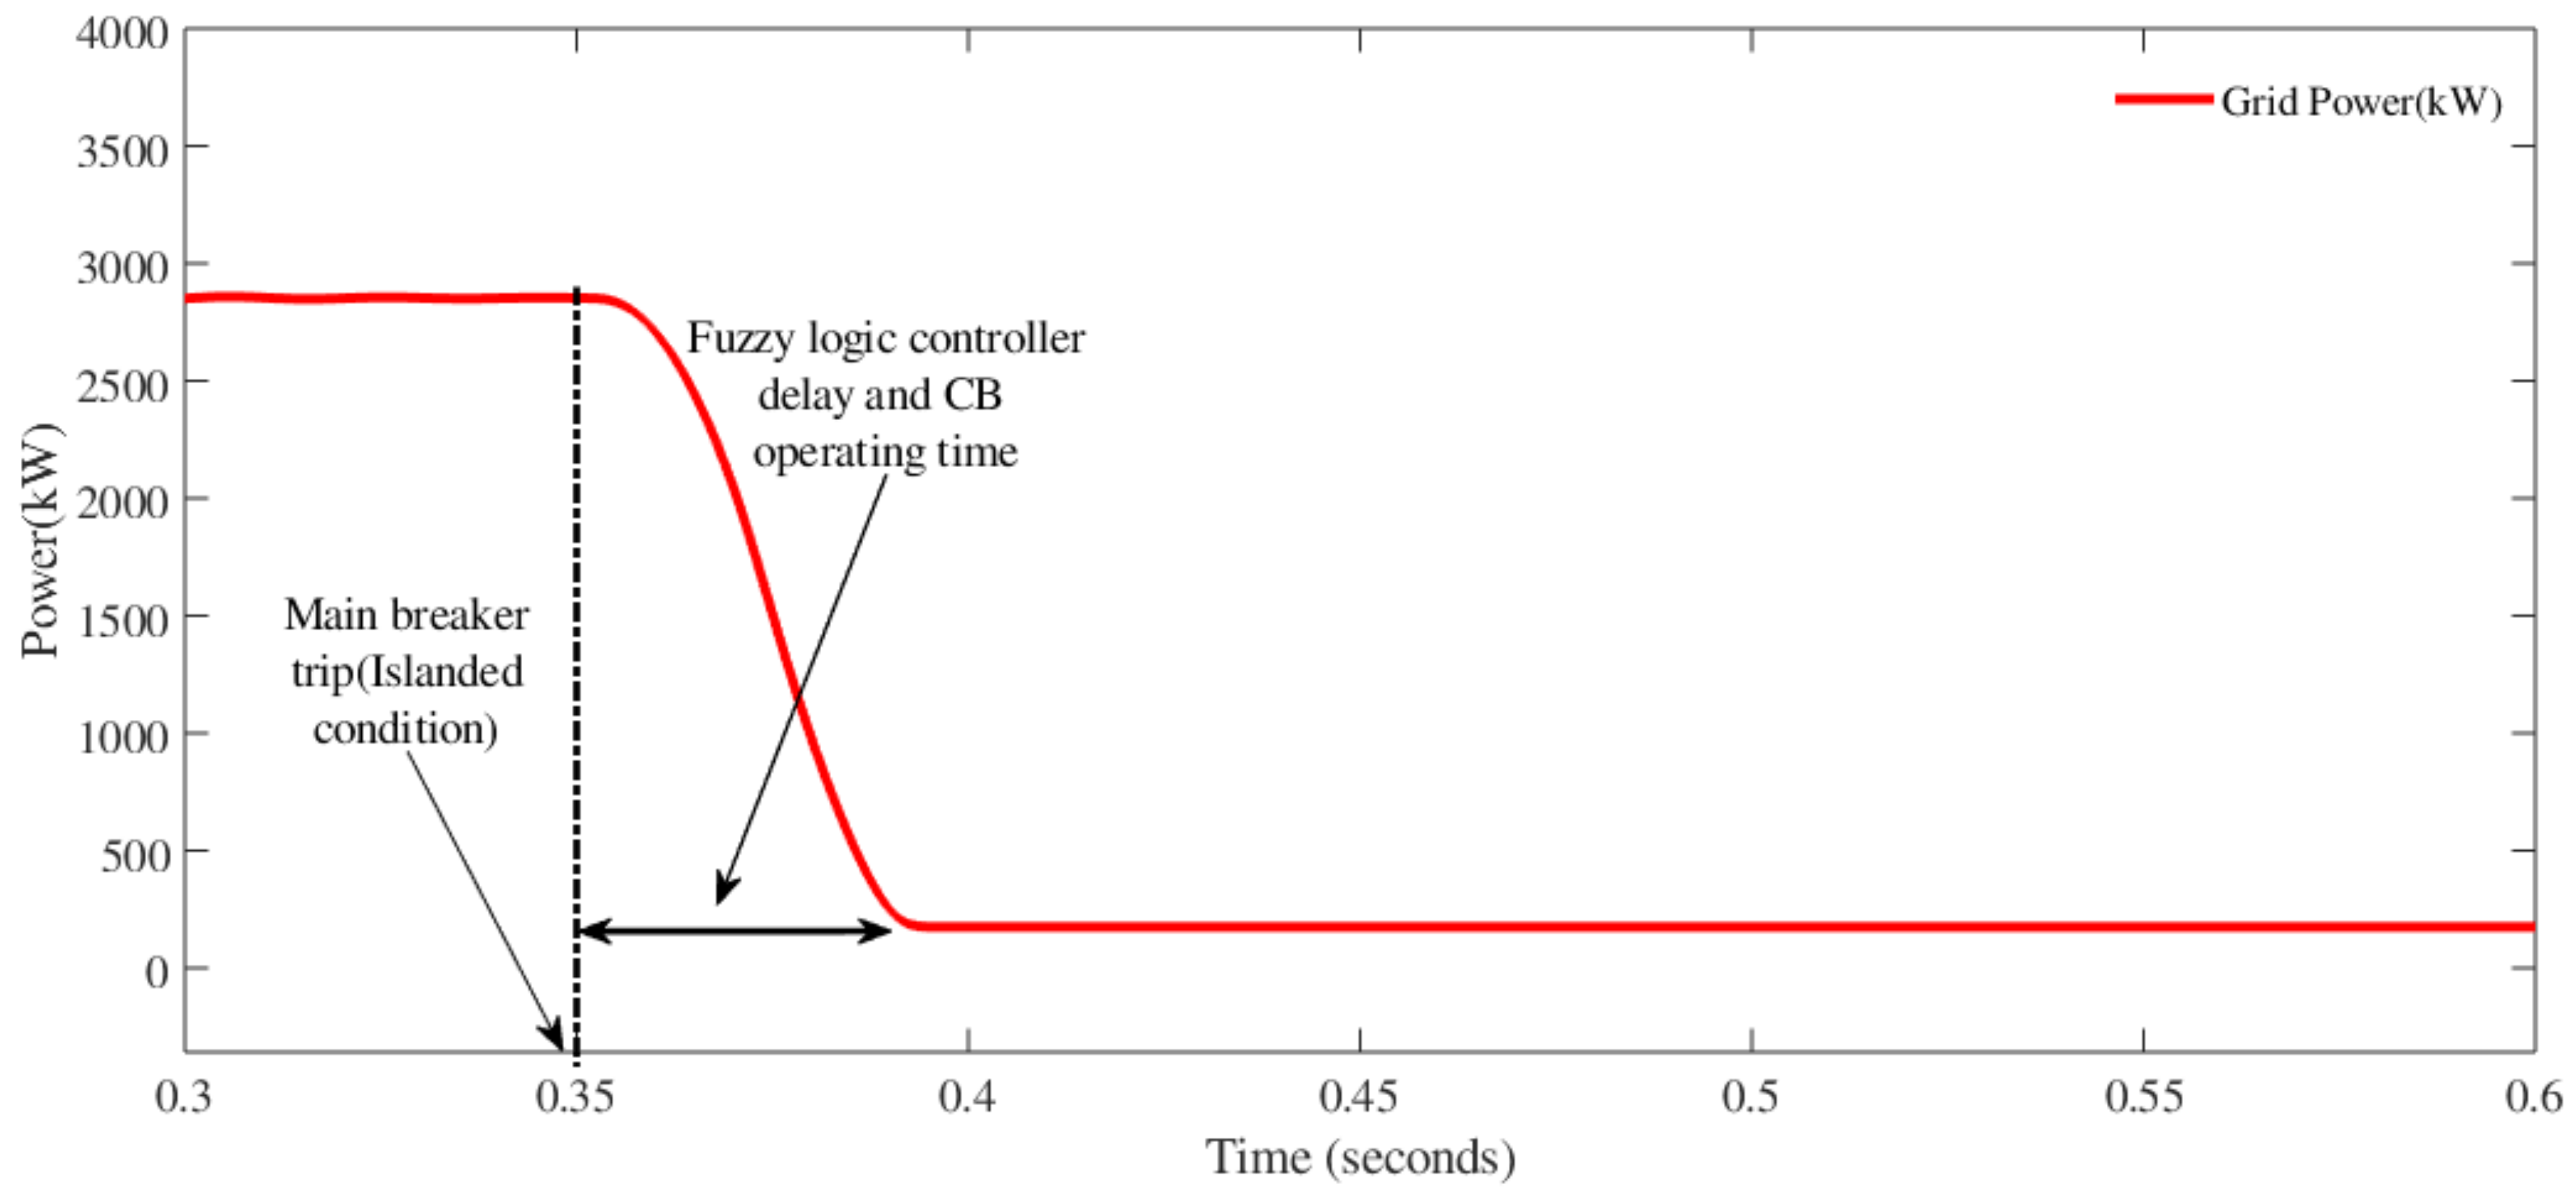
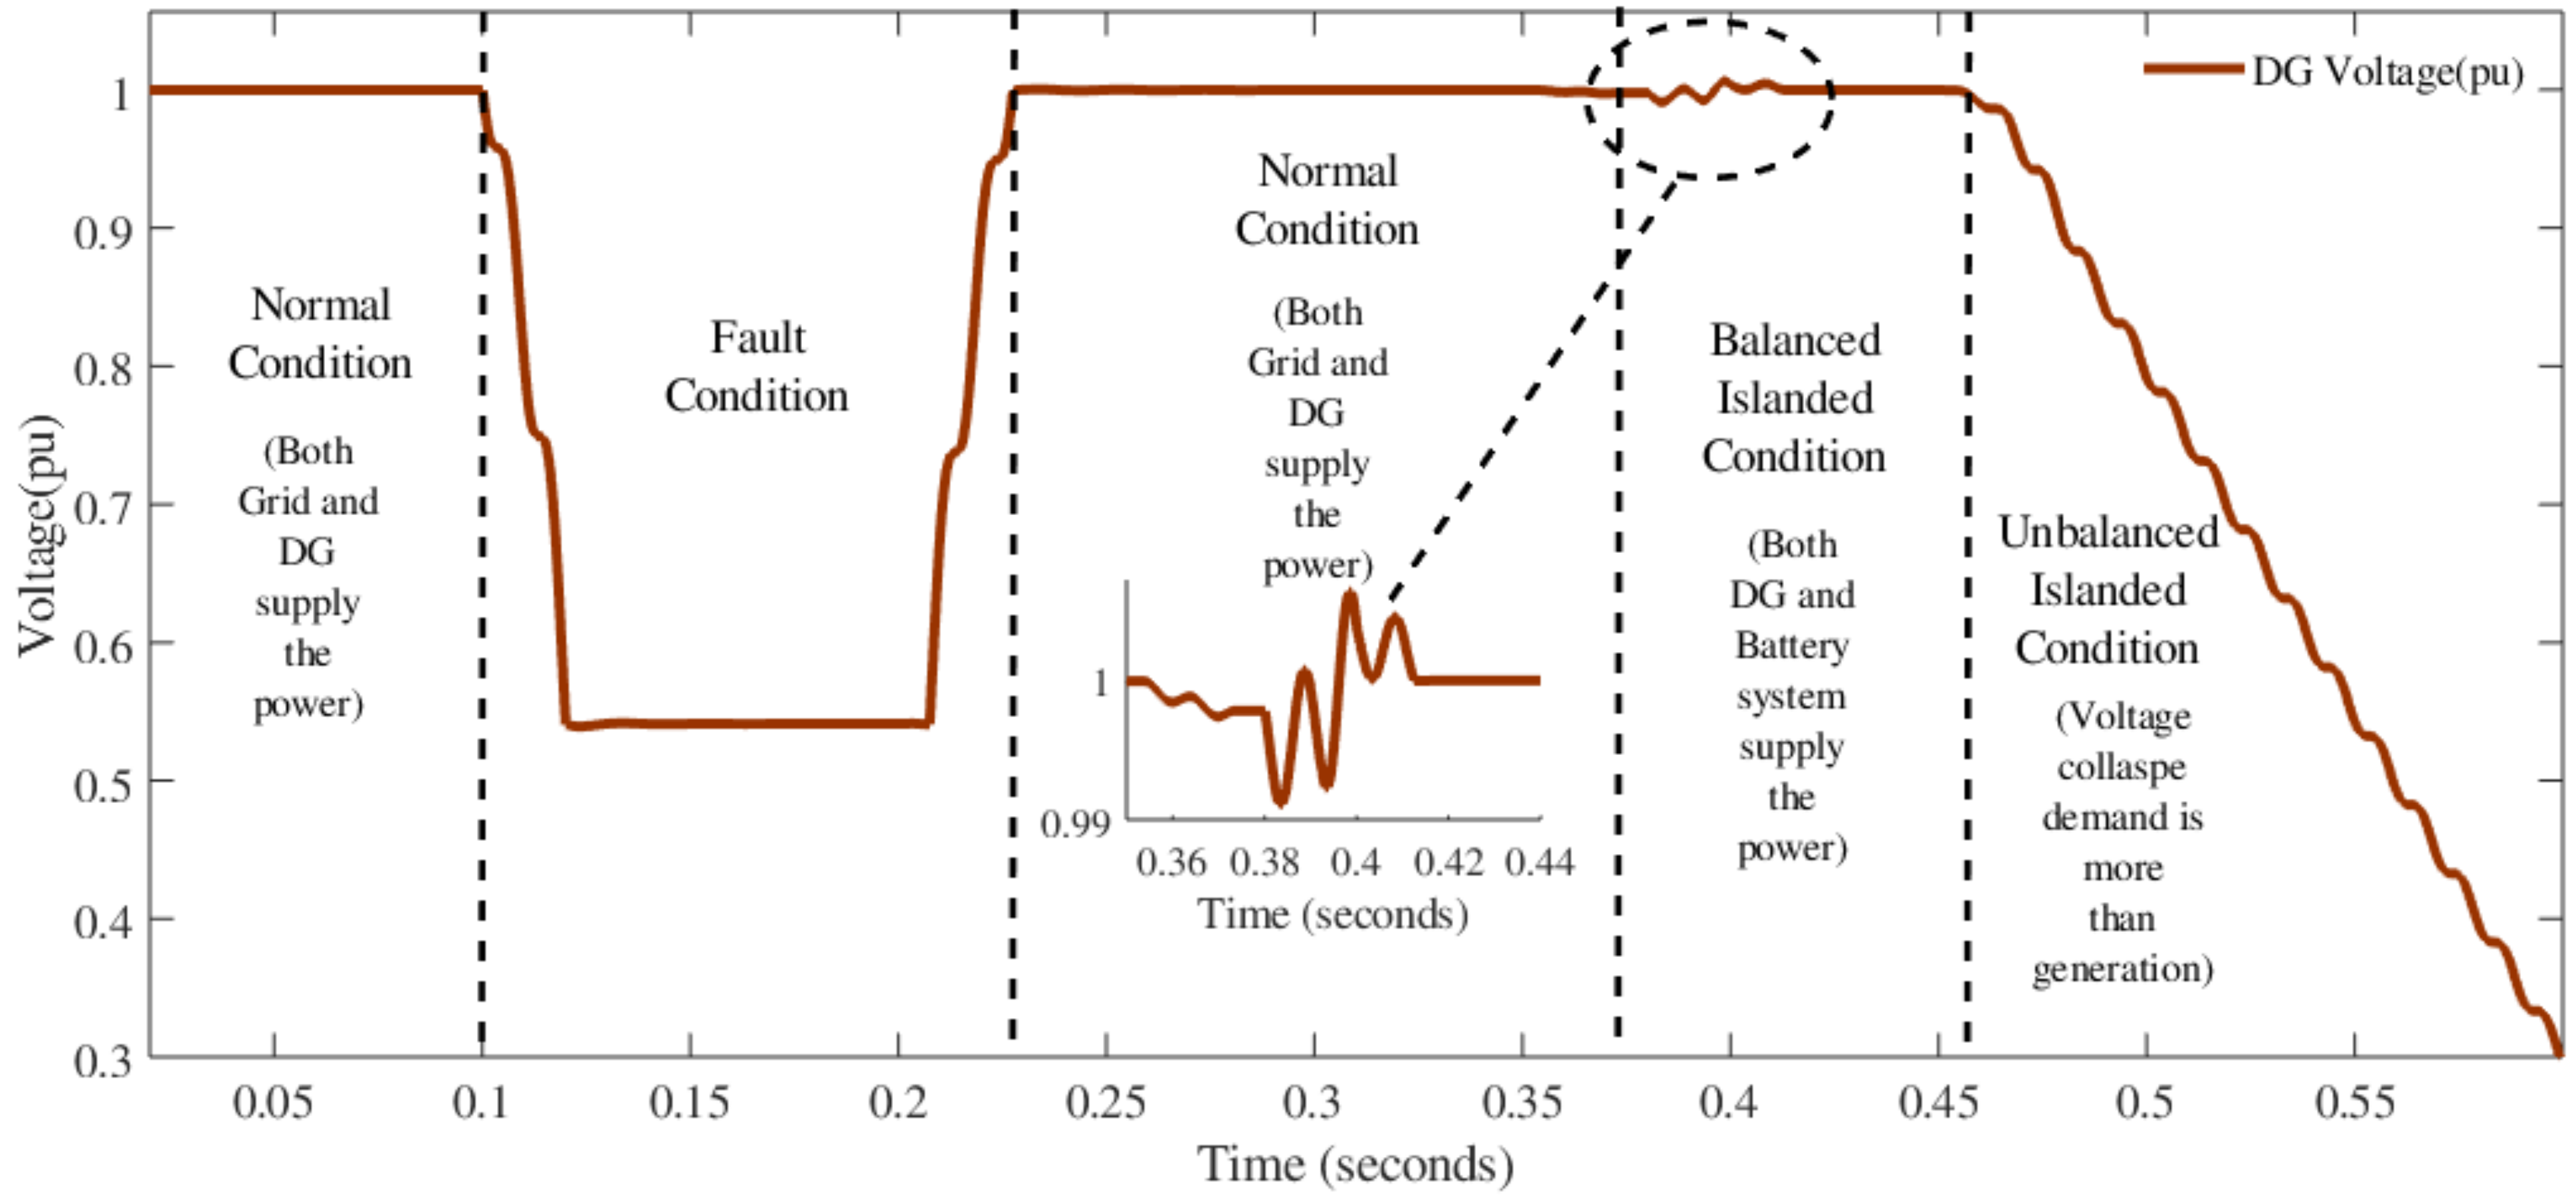
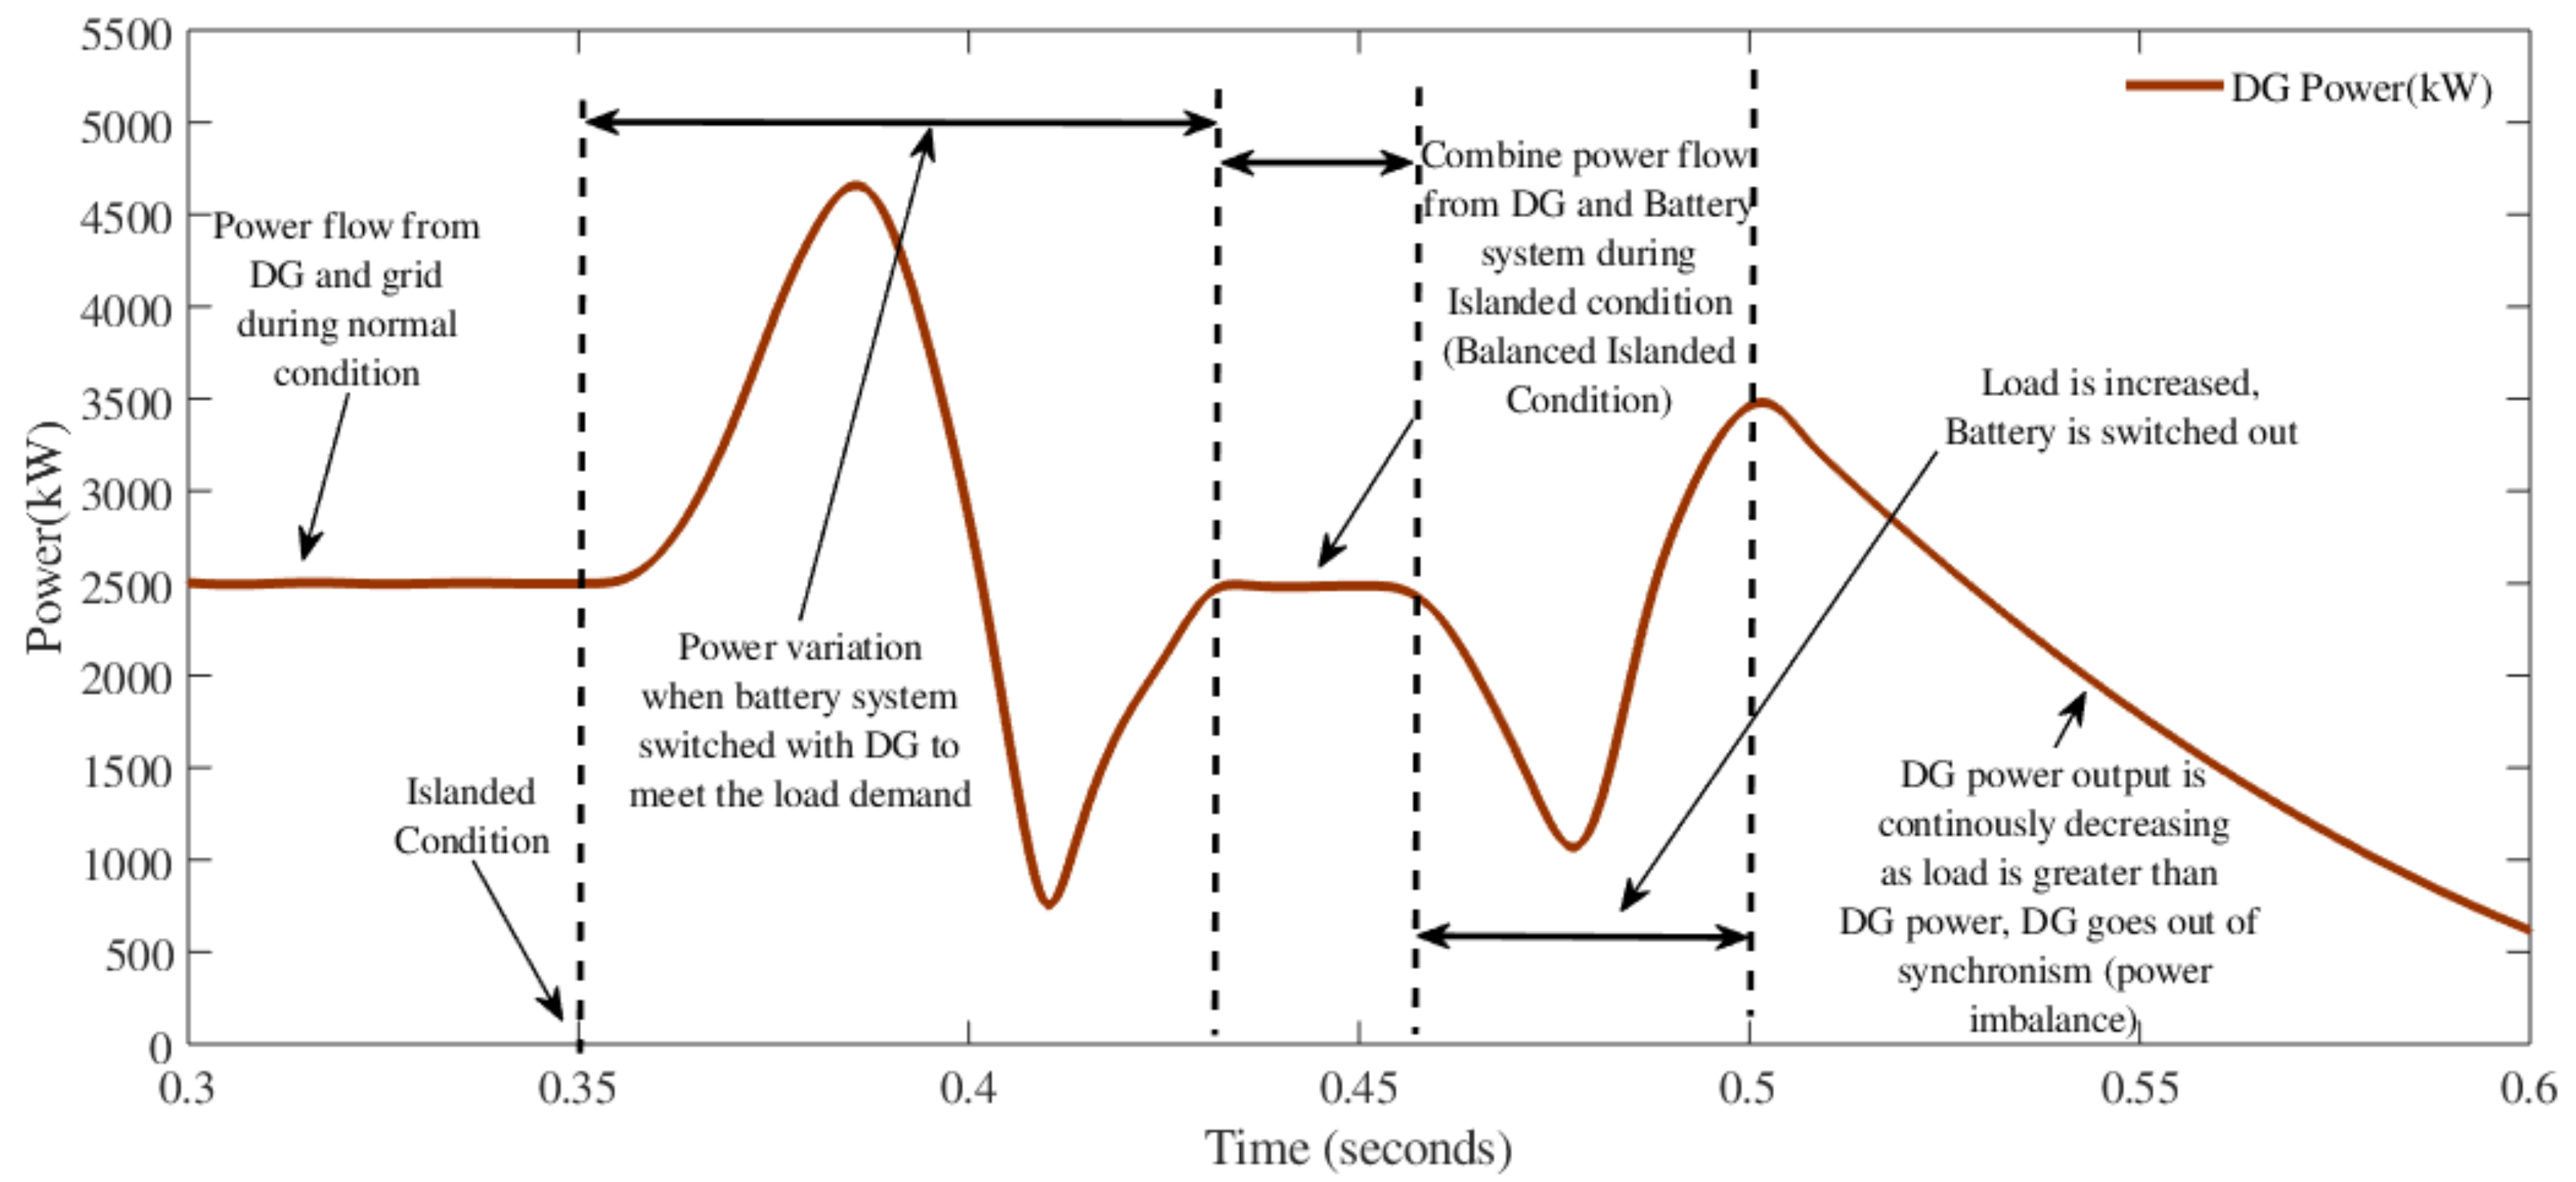
3.2.3. Islanding Condition

When the main supply to the network is lost, this results in islanding conditions, and the DG may be allowed to supply the load alone, if its output matches the energy demand. However, if a power mismatch occurs, the DG needs to be taken out of the system, and the reliability of the network to supply the load is thus lost. To address this problem, the energy management strategy is designed and discussed in Figure 10c. This scenario is called balanced islanding, which represents the condition that the cumulative energy of the DG and ESS are able to cope with the given load requirements, as shown in Figure 11. In Figure 11, the main breaker trips after 0.35 s; the grid supply is disconnected, and the network operates in the balanced islanding condition. Initially, the system loading is larger than the DG output, and the ESS switches on to meet the additional energy demand, as shown in Figure 14. In Figure 14, after 0.35 s, the system operates in islanding mode, with both the DG and ESS supplying the load, as illustrated in Figure 15. The close-up view of the voltage profile in Figure 14 confirms that the cumulative supply from the DG and ESS is more stable than the grid and DG together. This is due to the obvious reason that the main source is at distance from the load center and causes more power losses, while the ESS and DG are installed near the load premises.
During the imbalance islanding in Figure 10d, when the cumulative power of the ESS and DG is unable to meet the load demand, the DG needs to be disconnected from the system using its dedicated protection scheme. However, the ESS, having the fewer stability issues as compared to the DG system, continues to supply energy to emergency and critical loads, i.e., street lights, hospitals, etc., via its direct link. It is evident from Figure 11 that when the load on the distribution side is increased after 45 s in Figure 15, it causes unbalanced islanding and huge voltage collapse in Figure 14. Therefore, the DG breaker trips at 49 s while the ESS continues to supply the sensitive loads.

3.3. Comparative Analysis

To validate the performance of the proposed framework, it is compared with other existing approaches in Table 1. In Table 1, the Tabu Search (TS) algorithm, which is commonly used for evaluating the combinatorial optimization task, is exploited for the optimal placement of the DG in [29], based on improving the system voltage and reducing the line losses under a uniformly distributed load profile. This search algorithm has a higher convergence rate and hence takes less processing time to reach the desired results within fewer iterations. On the other hand, the Artificial Bee Colony (ABC) algorithm, used for the optimal sizing and location of the DG in [30], takes a longer time to converge and is also computationally expensive because it is based on the intuitive foraging behavior of honey bees. However, the Ant Colony Optimization (ACO) algorithm, inspired by the behavior of ants of reaching the target while following the shortest path, was used in [31] for the proper placement of new DGs. This algorithm has a compromising performance in terms of reducing the voltage deviations; otherwise, it is better than ABC. Overall, the suggested technique is not only robust against system abnormalities using the FIS, but it also tries to maximize the system performance, thereby reducing line losses and voltage variations (sag and phase angle jump) with the optimal placement of the DG using the GA. Further, the proposed framework is also computationally efficient and converges in a reasonable time to the desired outcomes.

4. Conclusions

This research proposed a framework that in the first steps exploited the genetic algorithm in order to determine the optimal placement and sizing of the distributed generators in the utility network under distinct system conditions. The GA together with load flow analysis made decisions on the basis of three critical parameters of the network: power losses, voltage profile, and phase angle jump. Under all investigated system conditions (normal operation, fault, and islanding), the best possible location was always decided to be near the load center, at Bus-E, with the optimal size of 3.33 MVA, in accordance with the system constraints. Even though the proper placement and sizing of the newly installed DG were not guaranteed, the excellent performance of the investigated power system—especially under the fault and islanding conditions—thus make it necessary to design a proper energy management system.
All the energy management strategies, under all the investigated system conditions, were designed using a fuzzy inference system. Amongst all proposed strategies, it was observed that the FIS with the proper membership functions and rules implemented was able to correctly detect, monitor, and regulate the abnormalities in a way that allowed the performance of the network to be optimized and the energy to be stored for emergency use. The switching patterns, generated by fuzzy controllers, were used to operate all four different circuit breakers (the main one, DG, energy, and demand breakers) sequentially, according to the network characteristics—determined through a load flow study. Eventually, in order to validate the effectiveness and robustness of the proposed approach against abnormalities, it was compared with other existing state-of-the-art methods, and we found that it integrated new DGs optimally and also regulated the energy flow according to the network conditions.
A possible extension, to the above presented research, is to use the Markov decision process for the optimum location and sizing of mixed (inverter- and non-inverter-based) DGs in a complex distribution network involving the combination of radial and mesh topologies. Furthermore, for a autonomous and adaptive energy management system, deep neural networks together with the forest of trees approach can be applied to deal with the environmental and network uncertainties and the dynamic nature of PVs or wind-based DG systems at run-time under severe network contingencies.

Author Contributions

The major contributions of all the authors are summarized as: conceptualization—S.K.; methodology—S.K. and M.F.S.; software—S.K. and M.F.S.; validation—S.K., M.F.S., S.S., A.M., and Z.H.K.; formal analysis—S.K., A.M., and V.B.; investigation—S.K. and L.S.; resources—Z.H.K. and L.Z.; data curation—Z.H.K. and M.A.S.; writing, original draft preparation—S.K., L.S., and S.A.S.; writing, review and editing—L.Z. and M.A.S.; visualization—Z.H.K.; supervision—L.S. and L.Z.; project administration—L.Z.; funding acquisition—L.Z. All authors have read and agreed to the published version of the manuscript.

Funding

This research received no external funding.

Acknowledgments

The authors are thankful to Sukkur IBA University, Pakistan, for providing state-of-the-art facilities to conduct this research. Additionally, the first author is also grateful to Jan Izykowski from Wroclaw University of Science and Technology, Poland, for his guidance and support during the Master’s studies.

Conflicts of Interest

The authors declare no conflict of interest.

References

  1. Katyara, S.; Staszewski, L.; Leonowicz, Z. Protection coordination of properly sized and placed distributed generations–methods, applications and future scope. Energies 2018, 11, 2672. [Google Scholar] [CrossRef] [Green Version]
  2. Katyara, S.; Shah, M.A.; Iżykowski, J. Power loss reduction with optimal size and location of capacitor banks installed at 132 kV grid station qasimabad Hyderabad. Present Probl. Power Syst. Control. 2016, 53–64. [Google Scholar]
  3. Paliwal, P.; Patidar, N.P.; Nema, R.K. Planning of grid integrated distributed generators: A review of technology, objectives and techniques. Renew. Sustain. Energy Rev. 2014, 40, 557–570. [Google Scholar] [CrossRef]
  4. Katyara, S.; Staszewski, L.; Chachar, F.A. Determining the Norton’s Equivalent Model of Distribution System with Distributed Generation (DG) for Stability Analysis. Recent Adv. Electr. Electron. Eng. Former. Recent Patents Electr. Electron. Eng. 2019, 12, 190–198. [Google Scholar] [CrossRef]
  5. Sultana, U.; Khairuddin, A.B.; Aman, M.M.; Mokhtar, A.S.; Zareen, N. A review of optimum DG placement based on minimization of power losses and voltage stability enhancement of distribution system. Renew. Sustain. Energy Rev. 2016, 63, 278–363. [Google Scholar] [CrossRef]
  6. Jang, S.I.; Kim, K.H. An islanding detection method for distributed generations using voltage unbalance and total harmonic distortion of current. IEEE Trans. Power Deliv. 2004, 19, 745–752. [Google Scholar] [CrossRef]
  7. Katyara, S.; Hashmani, A.; Chowdhary, B.S.; Musavi, H.A.; Aleem, A.; Chachar, F.A.; Shah, M.A. Wireless Networks for Voltage Stability Analysis and Anti-islanding Protection of Smart Grid System. Wirel. Pers. Commun. 2020. [Google Scholar] [CrossRef]
  8. Kanchev, H.; Lu, D.; Colas, F.; Lazarov, V.; Francois, B. Energy management and operational planning of a microgrid with a PV-based active generator for smart grid applications. IEEE Trans. Ind. Electron. 2011, 58, 4583–4592. [Google Scholar] [CrossRef] [Green Version]
  9. Palma-Behnke, R.; Benavides, C.; Lanas, F.; Severino, B.; Reyes, L.; Llanos, J.; Sáez, D. A microgrid energy management system based on the rolling horizon strategy. IEEE Trans. Smart Grid 2013, 4, 996–1006. [Google Scholar] [CrossRef] [Green Version]
  10. Öner, A.; Abur, A. Voltage stability based placement of distributed generation against extreme events. Electr. Power Syst. Res. 2020, 189, 106713. [Google Scholar] [CrossRef]
  11. Katyara, S.; Shah, M.A.; Chowdhary, B.S.; Akhtar, F.; Lashari, G.A. Monitoring, control and energy management of smart grid system via WSN technology through SCADA applications. Wirel. Pers. Commun. 2019, 106, 1951–1968. [Google Scholar] [CrossRef]
  12. Ogunjuyigbe, A.S.O.; Ayodele, T.R.; Akinola, O.A. Optimal allocation and sizing of PV/Wind/Split-diesel/Battery hybrid energy system for minimizing life cycle cost, carbon emission and dump energy of remote residential building. Appl. Energy 2016, 171, 153–171. [Google Scholar] [CrossRef]
  13. Prommee, W.; Ongsakul, W. Optimal multiple distributed generation placement in microgrid system by improved reinitialized social structures particle swarm optimization. Int. Trans. Electr. Energy Syst. 2011, 21, 489–504. [Google Scholar] [CrossRef]
  14. Thirugnanam, K.; Kerk, S.K.; Yuen, C.; Liu, N.; Zhang, M. Energy Management for Renewable Microgrid in Reducing Diesel Generators Usage with Multiple Types of Battery. IEEE Trans. Ind. Electron. 2018, 65, 6772–6786. [Google Scholar] [CrossRef]
  15. Merabet, A.; Ahmed, K.T.; Ibrahim, H.; Beguenane, R.; Ghias, A.M.Y.M. Energy Management and Control System for Laboratory Scale Microgrid Based Wind-PV-Battery. IEEE Trans. Sustain. Energy 2017, 8, 145–154. [Google Scholar] [CrossRef]
  16. Gözel, T.; Hocaoglu, M.H. An analytical method for the sizing and siting of distributed generators in radial systems. Electr. Power Syst. Res. 2009, 79, 912–918. [Google Scholar] [CrossRef]
  17. Prabha, D.R.; Jayabarathi, T. Optimal placement and sizing of multiple distributed generating units in distribution networks by invasive weed optimization algorithm. Ain Shams Eng. J. 2016, 7, 683–694. [Google Scholar] [CrossRef] [Green Version]
  18. Khalesi, N.; Rezaei, N.; Haghifam, M.-R. DG allocation with application of dynamic programming for loss reduction and reliability improvement. Int. J. Electr. Power Energy Syst. 2011, 33, 288–295. [Google Scholar] [CrossRef]
  19. Valencia, F.; Collado, J.; Sáez, D.; Marín, L.G. Robust energy management system for a microgrid based on a fuzzy prediction interval model. IEEE Trans. Smart Grid 2015, 7, 1486–1494. [Google Scholar] [CrossRef]
  20. Adhikari, S.; Sinha, N.; Dorendrajit, T. Fuzzy logic based on-line fault detection and classification in transmission line. SpringerPlus 2016, 5, 1002. [Google Scholar] [CrossRef] [Green Version]
  21. Katyara, S.; Akhtar, F.; Solanki, S.; Leonowicz, Z.; Staszewski, L. Adaptive fault classification approach using digitized fuzzy logic (dfl) based on sequence components. In Proceedings of the 2018 IEEE International Conference on Environment and Electrical Engineering and 2018 IEEE Industrial and Commercial Power Systems Europe (EEEIC/I & CPS Europe), Palermo, Italy, 12–15 June 2018; pp. 1–7. [Google Scholar]
  22. Mohsin Ajeel, K. Optimal location of a single distributed generation unit in power systems. MS&E 2018, 433, 012087. [Google Scholar]
  23. Gomez, J.C.; Morcos, M.M. Voltage sag and recovery time in repetitive events. IEEE Trans. Power Deliv. 2002, 17, 1037–1043. [Google Scholar] [CrossRef]
  24. Shukla, T.N.; Singh, S.P.; Srinivasarao, V.; Naik, K.B. Optimal sizing of distributed generation placed on radial distribution systems. Electr. Power Components Syst. 2010, 38, 260–274. [Google Scholar] [CrossRef]
  25. Muruganantham, B.; Gnanadass, R.; Padhy, N.P. Performance analysis and comparison of load flow methods in a practical distribution system. In Proceedings of the 2016 National Power Systems Conference (NPSC), Bhubaneswar, India, 19–21 December 2016. [Google Scholar]
  26. Thakur, T.; Dhiman, J. A new approach to load flow solutions for radial distribution system. In Proceedings of the 2006 IEEE/PES Transmission and Distribution Conference and Exposition: Latin America, Caracas, Venezuela, 15–18 August 2006. [Google Scholar]
  27. Augugliaro, A.; Dusonchet, L.; Favuzza, S.; Ippolito, M.G.; Mangione, S.; Sanseverino, E.R. A modified genetic algorithm for optimal allocation of capacitor banks in MV distribution networks. Intell. Ind. Syst. 2015, 1, 201–212. [Google Scholar] [CrossRef] [Green Version]
  28. Heydari, G.; Gharaveisi, A.; Vali, M. New formulation for representing higher order tsk fuzzy systems. IEEE Trans. Fuzzy Syst. 2015, 24, 854–864. [Google Scholar] [CrossRef]
  29. Nara, K.; Hayashi, Y.; Ikeda, K.; Ashizawa, T. Application of tabu search to optimal placement of distributed generators. In Proceedings of the 2001 IEEE Power Engineering Society Winter Meeting. Conference Proceedings (Cat. No. 01CH37194), Columbus, OH, USA, 28 January–1 February 2001; Volume 2, pp. 918–923. [Google Scholar]
  30. Abu-Mouti, F.S.; El-Hawary, M.E. Heuristic curve-fitted technique for distributed generation optimisation in radial distribution feeder systems. IET Gener. Transm. Distrib. 2011, 5, 172–180. [Google Scholar] [CrossRef]
  31. Wang, L.; Singh, C. Reliability-constrained optimum placement of reclosers and distributed generators in distribution networks using an ant colony system algorithm. IEEE Trans. Syst. Man Cybern. Part C Appl. Rev. 2008, 38, 757–764. [Google Scholar] [CrossRef]
Figure 1. General sketch of the energy management system for the optimal allocation of resources in accordance with the network conditions.
Electronics 10 00172 g001
Figure 2. One line diagram of the test system.
Electronics 10 00172 g002
Figure 3. Different system contingencies and associated voltage sag estimations. (a) Normal condition, (b) fault condition at the utility bus, (c) fault condition for the transmission network near the utility, and (d) fault condition for the transmission network near the DG.
Electronics 10 00172 g003
Figure 4. Final set of chromosomes for the optimal location and size of the new DG determined with the application of the GA.
Electronics 10 00172 g004
Figure 5. Proposed fuzzy inference system for effective energy management strategies in utility networks.
Electronics 10 00172 g005
Figure 6. Power Hardware-In-the-Loop (PHIL) setup for DG placement and energy management in the utility network under normal and contingency conditions.
Electronics 10 00172 g006
Figure 7. Characteristics of the system under the normal condition for proper placement and sizing of the new DG: (a) power losses at different buses, (b) voltage profile of the system, (c) Phase Angle Jump (PAJ) variations, and (d) GA outcome over 30 iterations.
Electronics 10 00172 g007
Figure 8. System performance under fault condition for the optimal location and size of the new DG: (a) power losses at different system buses, (b) system voltage profile, (c) the trend of PAJ at various buses, and (d) GA output over 32 iterations.
Electronics 10 00172 g008
Figure 9. System profile during the islanding condition for the optimal location and size of the new DG: (a) power losses at different buses, (b) voltage profile of the system, (c) PAJ variations at different buses, and (d) GA output over 35 iterations.
Electronics 10 00172 g009
Figure 10. Energy management strategies for different operating conditions: (a) normal state, (b) fault condition, (c) balanced islanding condition, and (d) imbalanced islanding condition.
Electronics 10 00172 g010
Figure 11. Switching patterns generated using the fuzzy inference system for circuit breakers under different operating conditions.
Electronics 10 00172 g011
Figure 12. Current flows from different power system actors when fault occurs near the load center with the proposed energy management system using the fuzzy inference system. The dotted plots illustrate the short circuit current with no energy management strategy being active.
Electronics 10 00172 g012
Figure 13. Profile of the power flow from the mains. At 0.3 s, the system returns to its normal state. At 0.35 s, the grid is disconnected, and the system enters the islanding condition, while the power flow from the grid drops approximately to zero.
Electronics 10 00172 g013
Figure 14. Voltage profile at the DG bus under different system conditions. The voltage under the normal condition is 1 p.u., and with the fault inception it dips down to 0.52 p.u. After 0.35 s, the system is in islanding mode with both the DG and battery system supplying the load. After 0.45 s, the load is increased and results in a voltage collapse.
Electronics 10 00172 g014
Figure 15. DG output under different system conditions. Until 0.35 s, a load of 5000 kW is shared equally among the mains and DG. At 0.35, the mains are tripped, and the system enters the islanding mode with the load greater than the DG, and thus, the ESS is switched in, to tackle the energy difference. At 0.45 s, the load is further increased, which causes the power imbalance with the DG’s output constantly decreasing, which represents its being out of synchronism.
Electronics 10 00172 g015
Table 1. Comparative analysis for the optimal placement of the DG and energy management control. TS, Tabu Search; ABC, Artificial Bee Colony.
TechniqueLoss Reduction (%)Voltage Deviation (p.u.)Number of IterationsEnergy Imbalance (%)Detection Period (Cycles)Computational Time (s)
TS [29]51.470.0214226NANA9.87
ABC [30]53.630.0346873NANA12.43
ACO [31]35.550.0421362NANA11.56
Proposed Framework45.320.011763413.282.5011.65
NA—Not Applicable; loss reduction (%)—decrease in the percentage of existing line losses with the integration of each new DG; voltage deviation (p.u.)—the ability to maintain the voltage profile within the pre-defined IEEE regulation limits, i.e., ± 5 % ; number of iterations—steps taken by the search algorithm to reach the final outcome; energy imbalance (%)—exploiting all the available energy sources to meet the load demand effectively; detection period (cycles)—operating duration of switching-sensing elements to detect the abnormality in the system; computational time (s)—processing resources consumed by the respective technique to reach the desired end goal.
Publisher’s Note: MDPI stays neutral with regard to jurisdictional claims in published maps and institutional affiliations.

