1. Introduction
Hidden dangers and risks accompany coal mining. There are more than 20,000 coal mines in China, 95% of which are underground coal mines [
1]. Underground coal mines are complex. Due to underground coal seams and hydrological conditions, underground problems are difficult to predict. Many sources of instability factors exist, such as underground gas changes, floods, fires due to high geothermal temperature, and gas explosions, or coal mining machinery faults caused by faults. Appropriate measures to avoid or provide early warning of disasters and faults have become the top priority of coal mine safety research. Initially, coal communication systems generally used a special coaxial cable. The radio wave was dispersed into the mine tunnel by the central station and then spread through the tunnel’s radio stations. Wired transmission is safe and reliable, and the transmission capacity is large. The signal is stable, which helps obtain underground news in time. However, wired transmission requires the use of complicated cables, and additional cables can cause other effects in narrow tunnels. Real-time information in underground coal mines is essential for monitoring the underground conditions of coal mines. Compared with aboveground, underground communication is affected by various conditions, such as underground rocks and, potentially, metals. Because underground conditions are highly complex, underground passages are crowded and narrow. Large-scale wired communication has an impact on mining projects. Due to the general rise of wireless communication, early scientific researchers abandoned wired communication and instead pursued wireless communication for mining applications [
2].
Compared with wired transmission, wireless transmission is flexible, robust, portable, and uneven in layout. However, it does not affect narrow mine tunnels due to its difference, or open-wire or optical cable transmission. However, wireless transmission is easily affected by the environment. Mine communication is a specialized area of communication research, and differs from general ground and indoor communication. The walls of mine tunnels are rough, the interior is hot and humid, and there are numerous branch tunnels. Numerous coal mining machines are also present, in addition to a large number of coal mining machines. Due to the metal shell of the mine, the propagation environment and characteristics of radio waves in mines are significantly different from those of general ground communication [
3]. Furthermore, numerous signal multipath effects occur in mines, such as are non-line-of-sight transmission, difficulty of the signal directly reaching the target receiver, and propensity to fading effects. Underground mines can be regarded as an implementation of non-line-of-sight transmission in a limited space. Compared with the free transmission channel [
4] of general wireless communication, underground wireless communication must consider more influences, and, at present, underground communication continues to face a number of challenges.
Due to its advantages of low cost, low power consumption, and strong anti-interference, Zigbee is widely used in smart homes, industry, short-range monitoring, etc. It is also an option for wireless transmission in mine communication. In 1978, Murphy, J.N. [
5] and his team placed a detector with a Zigbee communication module inside a mine and obtained a relatively stable signal; Zhang Changsen [
6] and others proposed mine personnel positioning based on ZigBee technology. The system’s design scheme, the specific implementation process, and the implementation diagram of the software and hardware structure were outlined. Jiao Shangbin [
7] and others used the Zigbee technology component wireless sensor network to collect data, such as gas concentration, carbon dioxide, temperature, and humidity in the mine, and adopted the Karl Mann filtering method to remove random errors. Experiments proved that the system was better able to collect and communicate the required data.
In the study of mine communication to reduce open-wire communication, Zigbee technology has unique advantages. Zigbee is established based on the IEEE802.15.4 protocol, uses spread spectrum methods to enhance anti-interference [
8], and uses modulation methods such as BPSK (Binary Phase Shift Keying), ASK (Amplitude Shift Keying), and O-QPSK (Offset-Quadrature Phase Shift Keying) to enhance noise interference and reduce signal distortion. In mine communication, it is necessary to combat the energy loss caused by noise interference and multipath effects, and the influence on the network’s network capacity and stability. This study simulated the mine communication environment, abstracted it into a similar channel environment, and monitored the Zigbee modulation signal’s stability. Based on the research of the Zigbee modulation method, the study made in-depth improvements and the current article discussed the problem of network connection. Parallel measures were applied to the inner and outer layers of the technology to make improvements. Zigbee’s modulation method was studied from the inner layer, and O-QPSK was selected as the improvement target. Starting from the demodulation synchronization of O-QPSK, the aim was to address the issue of demodulation synchronization to reduce the signal delay problem. The implementation of Zigbee networking was studied from the outer layer, and the network strength was selected for the network life endurance of the Internet of Things, with the aim to address the edge node off-network belt caused by excessive network capacity. The problems of signal loss and the inability of upper-layer nodes to perceive, the primary information loss caused by the failure of virtual nodes, and the life of the network are also considered. An addition aim was to address the issue of energy waste caused by the transmission power adjustment problem of the Zigbee device itself; that is, energy is lost, and the resulting energy waste of the entire network leads to reduced network life. Finally, this study addressed the problems caused by signal delay, the impact of single node problems on the entire network, and the network’s energy-saving requirements.
2. Technical Selection and Discussion of Technical Defects
Coal is an important energy source in China and plays a pivotal role in the industrial field. However, due to the complexity of the underground environment and the incredibly complex mine structure, coupled with the low level of miners’ education and poor production safety awareness, coal mine accidents have occurred frequently in recent years, causing heavy casualties and economic losses, and affecting economic development and social stability. The importance of mine communication is self-evident. The efficiency of mine communication is related to the efficiency of production and the safety of workers. Most existing mine communication systems are wired communication, via communication cables laid in the tunnel, and then through 485 or CAN buses. There is a delay before the data to be transmitted to the ground monitoring center and, as the coal mine deepens, a large number of cables are laid in the tunnel. After mining is completed, the original cables are discarded, representing wasted investment.
Moreover, in an accident, cables may be damaged, causing the interruption of underground communication, thus making it impossible to locate personnel, which is not conducive to timely rescue. Wireless communication is a new technical research direction. At present, RFID technology is most commonly used. KJ90 and KJ95 are the more mature communication systems using RFID currently available. However, RFID also has high prices, high maintenance costs, poor compatibility, and suffers from the issue of anti-interference. Therefore, the research and development of a wireless mine communication system with a low price, easy maintenance, high reliability, and strong compatibility, and that can be easily expanded and upgraded is currently required. This chapter analyzes this issue. As the focus of analysis, an appropriate technology is selected from the range of technologies currently available. This technology and its drawbacks are analyzed, and improvements are suggested.
2.1. Technology Selection
Based on the above analysis, considering the conditions of the experimental environment, the following issues need to be considered when selecting a wireless network:
Node problem: The number of nodes that need to be deployed should be within the control range, and the size of the nodes needs to be small. In a mine environment, little space exists in which to arrange a large number of nodes with large volumes.
Data volume problem: The amount of data that needs to be transmitted is small, but the data packet loss rate is low, and the security, authenticity, and real-time delivery of the data need to be guaranteed.
Power supply problem: Because follow-up maintenance is troublesome, the battery life must be long.
Cost issue: Considering the actual demand, the cost should be reduced. As the area of the mine increases, the number of nodes increases accordingly. If the individual cost is high, the overall cost will be higher, so it is necessary to reduce the individual cost to reduce overall costs.
Selection problem: The selected technology must be mature and meet the first four requirements.
According to a collation of relevant data, several currently available mature wireless technologies were selected for comparison. The comparison is shown in
Table 1:
The selection of technology must refer to multiple aspects. According to the five requirements, Zigbee technology was selected for the current research. Zigbee technology has a low cost, mature technology, long transmission distance, and low power consumption. Currently, it has mature applications in various fields. Zigbee technology uses ASK, BPSK, and O-QPSK [
9], which are modulation technologies for encoding and despreading [
10]. These modulation technologies enhance the anti-interference of Zigbee technology, which has low operating difficulty and is portable. The advantages of strong performance and good signal penetration are consistent with the requirements of this article.
2.2. Problems in the Selection of Technology
Zigbee technology is one of the more mature wireless communication technologies currently available, and its applications are extensive, particularly in smart homes. The mine communication environment has particular characteristics. Wireless communication equipment in a mine with suffer varying degrees of interference, and wireless technology also has a number of shortcomings. In the mine communication environment, these technical shortcomings can cause serious communication problems. The article begins with the aspects of modulation technology, networking, and the aspect of the environment to discuss technical defects.
2.2.1. Problems Caused by Modulation Technology
Zigbee technology at 2.4 GHz uses O-QPSK modulation. O-QPSK modulation technology overcomes the problems of signal 180° mutation and phase ambiguity caused by BPSK modulation. In addition, the use of DSSS (Direct Sequence Spread Spectrum) overcomes the problem of weakened anti-interference under ASK modulation. Typical O-QPSK demodulation is based on the same principle as QPSK demodulation. A demodulation method based on feedback timing is often used, but this demodulation scheme has significant problems. In this scheme, the synchronization system’s role is to synchronize the locally generated PN code with the PN code in the received signal, that is, the same frequency and the same phase. The signal received through the wideband filter is correlated with the local PN code in the multiplier, and the device and mobile equipment are calibrated to adjust the voltage-controlled clock source. The PN code generator and the received signal generated by the adjusted local clock are consistent. Once the useful signal is captured, the tracking device is activated to adjust the voltage-controlled clock source. If the synchronization fails due to the random number seed, a new round of sampling and tracking process begins. Therefore, the entire synchronization process includes two steps. The first step is to search for the synchronization head, and the second step is the closed-loop automatic control and adjustment process. This demodulation scheme’s significant disadvantage is that symbol synchronization is complicated when the carrier is not synchronized. Furthermore, carrier synchronization requires symbol synchronization to provide correct clock information. The timing loop delay is considerable, and the signal-to-noise ratio is low.
2.2.2. Problems Caused by Networking Technology
According to the 2.4 GHz Zigbee device parameter display of Texas Instruments (
Table 2), there is an upper limit on a Zigbee network’s capacity. Furthermore, the area covered by the wireless communication network is also limited. According to mobile communication theory [
11], as the distance to the signal source increases, the signal is weakened; when the maximum distance is reached, the signal is effectively non-existent. When the environment is poor, the signal penetration ability is blocked, the coverage area is reduced compared with a line-of-sight environment; in extreme cases, the decline is significantly weakened. Under the same network capacity, the signal coverage area under a non-line-of-sight environment will be weaker than that under a line-of-sight environment, and the network capacity may not reach its maximum in actual situations. The increase in network capacity is not conducive to the ability of edge nodes. Among the three topologies of Zigbee, the mesh structure that can cover the largest capacity also suffers from the problem that edge nodes are easily broken.
In Zigbee networks, when the network capacity increases, each transmission node’s load also increases. The load of the central node and the transmission node will increase more, but the node’s ability to handle the load is limited, leading to delays in message delivery and signal instability. In severe cases, the collapse of a central node with excessive load will cause the network to collapse. The expansion of network capacity also increases the number of nodes. Nodes at the edge of the coverage area are edge nodes, maybe due to the central source’s distance. Nodes too distance from the network center may lose contact unexpectedly. However, the network may not be able to respond in time or even be unaware of the problem, which is a more significant issue in practice. Furthermore, a larger number of nodes requires route searching and maintenance, causing higher routing expense and produce significant energy loss.
2.2.3. Problems Caused by the Environment
For several reasons, the environment of mine communication is a unique in the context of channel research [
12]:
The transmission environment is complex: Mine tunnels have narrow spaces with a large number of coal seams, rock walls, soil, etc. There also numerous types of coal mining machinery, which is concentrated due to the narrow tunnels.
Significant electromagnetic interference: Coal mining equipment is mostly metallic and is used in large numbers. The unique composition of the roadway wall absorbs part of the electromagnetic wave or forms a multipath fading effect.
Other factors: Mine tunnels are not a fixed working environment, and the movement of personnel and machinery also affects the transmission of signals. The excavation of tunnels and subsequent mining directions are carried out randomly, and the direction of extensions is also different. This increases the requirements for the re-coverage of wireless systems.
Based on this discussion, an approximate mine tunnel channel is abstracted, and corresponding measures are taken. Developing this abstract requires further assumptions.
2.2.4. Summary
Based on the above discussion, this study aimed to improve the existing technology from several perspectives:
3. Several Measures to Improve Existing Technology
Zigbee technology has a number of shortcomings, which relate mainly to two aspects. In this section, technical improvements are suggested to address these two areas. To better demonstrate the technical route of this section, its content is organized according to the workflow shown in
Figure 1:
As shown in the figure above,
Section 3.1 explains the construction of a mine-like communication environment, generally using the Rayleigh and Nakagami channels. In this study, the Nakagami channel was chose as the experimental channel.
Section 3.2 will briefly explain the theoretical part of the improvement measures against the drawbacks of modulation technology, and the specific implementation will be carried out in
Section 4.1;
Section 3.3 is the theoretical discussion part for the drawbacks of networking technology, and the specific implementation will be done in
Section 4.2 and
Section 4.3 3.1. Simulate Mine Tunnel Environment
Mine channels are generally abstracted into the Rayleigh and Nakagami channels. The Rayleigh channel has no direct-sight path component but is accompanied by irregular fading effects. It is generally used as a model of an ideal mine tunnel environment. Previous research [
13] notes that the Rayleigh channel is not capable over long distances. In the long-distance mine channel environment, the three-dimensional shape of the roadway is approximately cubic in the open channel environment. If the transmission distance is within 100 m, the electromagnetic wave transmission characteristics of 900, 1800 and 2.45 MHz are approximately in line with the Rician distribution. When obstacles are added and line-of-sight propagation is blocked, as the transmission distance increases, the electromagnetic wave distribution fits the Rayleigh distribution. However, the Rayleigh distribution also has the disadvantage of not being sufficiently flexible. The Nakagami channel was established based on the Rayleigh channel, but can be flexibly changed by changing the value of m, allowing description of the different fading characteristics of multipath signals. The Nakagami-m fading expression is as follows:
where
is the average power,
is the gamma function, and
is the fading parameter. When
, the above equation degenerates into Rayleigh fading; when
, the above equation approximates Rayleigh fading with fading parameter K; and
represents no fading. By changing the value of m, the Nakagami model can be transformed into a variety of fading models.
3.2. Discussion on Improvement of the Drawbacks of Modulation Technology
As shown in
Figure 2, the classic O-QPSK demodulation scheme uses the principle of two-channel signal modulation. The digital baseband signal is divided into I and Q channels, which are then multiplied by the carrier and added together to obtain the modulated signal. However, realizing the polarity conversion of the signal and the serial-to-parallel conversion to separate the odd and even bits are challenges.
Figure 2 shows an O-QPSK demodulation scheme based on feedback timing.
O-QPSK suffers from synchronization problems in the process of carrier recovery and symbol timing during demodulation. To solve this problem, in the traditional feedback timing demodulation scheme [
14], a new demodulation scheme is used. The new method separates carrier recovery and symbol timing recovery, prioritizes them, and performs them separately. Carrier recovery and symbol timing recovery are performed separately. Timing recovery is based on the frequency domain nonlinear estimation algorithm to extract timing error information, and symbol positioning adjustment uses error control data interpolation.
Figure 3 shows the recovery principle.
3.3. Discussion on Measures against the Disadvantages of Networking Technology
In a large-scale network, edge nodes can be disconnected due to the long distances involved, and disconnection cannot be detected in time by the central node. In this case, most of the network will not be significantly affected, but the disconnection will have an impact in actual situations. The network disconnection mechanism, power control mechanism, and error control protocol are proposed measures to address this phenomenon; however, when there are many nodes, the routing overhead increases significantly and causing unnecessary wastage of energy. In practice, the Zigbee network is used to reduce costs and simultaneously allow long distance use. The improvement of the LEACH protocol was proposed to address this issue, such that edge node breakage does not affect the overall network. However, the fracture of important nodes will cause the collapse of the comprehensive system centered on those nodes. The artificial redundant node and alternative link mechanisms have been proposed to address this problem. These measures are described in detail below, and related implementations are carried out in
Section 4.
3.3.1. Network Disconnection Reconnection Mechanism, Power Control Mechanism, and Error Control Protocol
In a large-scale network, edge nodes are at risk of detachment. After edge nodes detach, they become isolated nodes. In actual situations, edge nodes generally serve as end nodes to transmit critical information. The detachment of edge nodes may cause significant information loss. Because isolated nodes must be rejoined to the network, a network disconnection reconnection mechanism is proposed. The process is divided into two main steps: node offline determination and the node access mechanism. In the judgment of offline nodes, if the node sends information to neighboring nodes but does not receive feedback, it is determined that it is offline. The network access mechanism is needed if the node is not in the network (i.e., become an isolated node), and if it is determined that it is an isolated node, network access is started. After the node determines that it is offline, the node’s network layer starts the network access mechanism, that is, sends a network access request to the neighboring node. If the neighboring node sends back the permission request to enter the network, the node sends its related data to the neighboring node. Then, the neighboring node sends the connection information, and the two nodes establish a connection.
The transmission power required for wireless network signal transmission is proportional to the transmission distance [
15]. When there are many nodes, a large amount of energy loss occurs in route discovery and route searching. To save the energy of the overall network, a power control mechanism is proposed. The power control mechanism (The schematic diagram is shown in
Figure 4) is mainly aimed at remedial measures after the link is interrupted due to the breaking of a node during the networking stage. The transmitting power range of node A is the blue circle range. When node B, the neighbor of A, is damaged, node A’s transmitting power increases to cover the nearest node C in addition to node B.
The impact of the mine environment must be considered. The error control protocol is controlled by the Z-TACK protocol stack, which can reduce the environment’s impact. The error control protocol is divided into a response mechanism and a retransmission mechanism. In the response mechanism, if the response frame is received after the data is sent, it is determined that the data is successfully sent; if the response frame is not received after the data is sent, the retransmission mechanism is started. If the confirmation frame is not returned within the specified Response WaitTime, it will be retransmitted. The number of transmissions of the retransmission mechanism is limited, and generally considered to be three times. If the confirmation frame is still not returned, the node is considered offline, the link is broken, and the link repair mechanism is started.
3.3.2. Improve-LEACH Agreement
Information exchange and transmission between nodes are required. The LEACH algorithm divides several nodes into a cluster group. Each cluster group has a cluster head node. The cluster head node collects the data of all group members and transmits it to the upper level. Then, if the cluster head node fails, the next cluster member is rotated to be the cluster head node. The LEACH protocol amortizes the high energy consumption cost of data transmission to the cluster members and ensures the cluster members’ average life span [
16].
The LEACH protocol results in energy loss of the overall network, and causes a significant amount of energy wastage in actual use. An Improved-LEACH protocol is proposed to address this energy waste. The Improved-LEACH protocol changes the automatic cluster head election mode to a manual cluster head election mode. Manual cluster head election is based on the environment and node address, the actual environment, and other factors [
17]. The selected cluster head node prolongs its service life accordingly (for example, by using better Zigbee equipment and better quality power). Other cluster nodes in the cluster are ordinary nodes. The ordinary nodes in the cluster are mainly responsible for communicating with each other and passing information to the cluster head node, and the cluster head node is mainly responsible for gathering and sending information and external communication. Ordinary nodes have a lighter task and only need to communicate within the cluster, and do not need to maintain routing information outside the cluster [
18]. Cluster head nodes have a heavier task, and need to cache and retain information within the cluster, and cache information for other cluster head nodes. The Improved-LEACH protocol can reduce the network overhead caused by the automatic selection of cluster head nodes and reduce the network energy consumption.
3.3.3. Manual Redundant Node Mechanism and Alternative Link Mechanism
Breaking important nodes will cause significant losses. To address this problem, two measures are proposed: the artificial redundant node and alternative link mechanisms. The artificial redundant node measure places a redundant node beside the full link; the node joins the network only when the link has problems. The schematic diagram is shown in
Figure 5.
The arrangement of redundant nodes in the artificial redundant node approach must be based on field detection and actual needs. If there costs are significant, another mechanism can be used, i.e., the alternative link mechanism. The schematic diagram is shown in
Figure 6.
A link is placed near virtual nodes, and information in a particular area is routed through specific links. As shown in
Figure 6, nodes a and b are routed through letter links, and nodes c and d are routed through digital links. During routing, when information is routed through node A to node B, the information of node A and B is packaged together. When vital link information is routed, the information of the passed node will be packaged together. Nodes c and d are treated similarly. When node B is damaged, node A and node B are broken, and node A temporarily forwards the information to node 1. The central controller can obtain node damage information via the information when parsing the file package for future maintenance.
4. Concrete Realization of Improvement Measures
This section presents the specific implementation of the measures proposed in
Section 3. The main components of the implementation, for the improvement of modulation technology, are the realization of the reconnection mechanism of the network, the power control mechanism, and the LEACH improvement protocol.
4.1. The Realization of O-QPSK Modulation Based on Feedforward Timing
To overcome the difficulty of synchronization caused by typical O-QPSK demodulation, the O-QPSK demodulation method based on feedforward timing uses separate carrier recovery and symbol timing recovery. According to the schematic diagram in
Section 3, the following specific implementation is carried out.
4.1.1. Symbol Timing Recovery
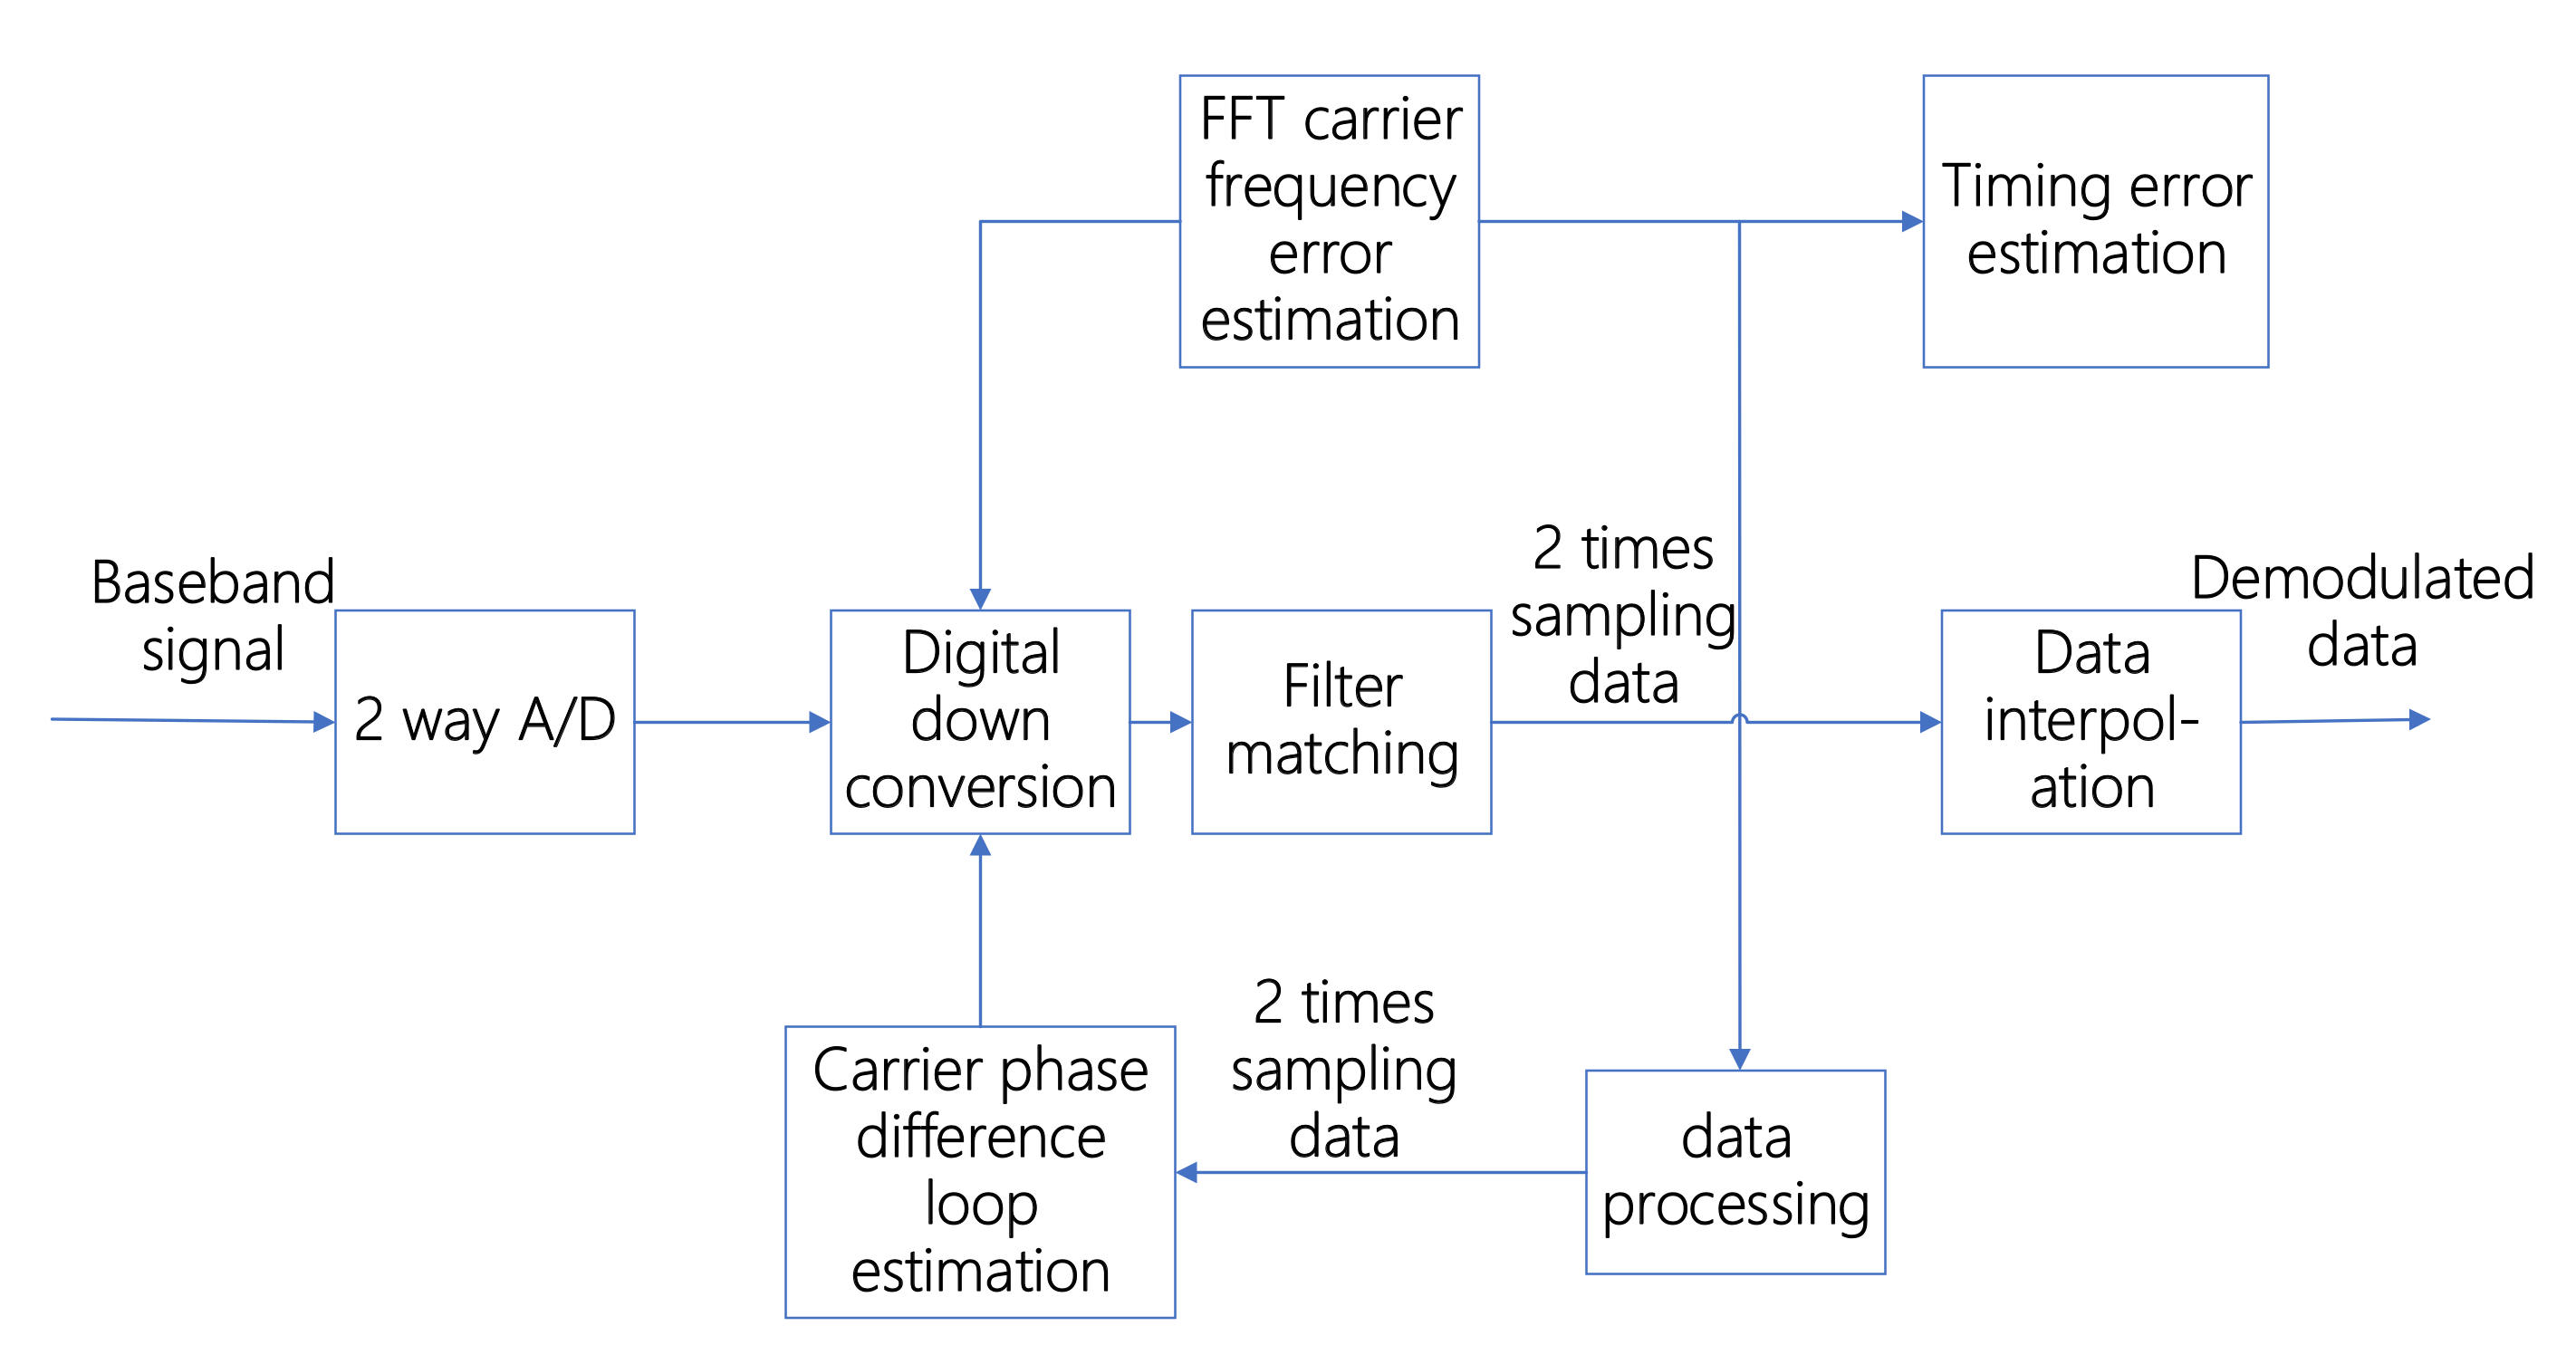
Figure 7 shows the new demodulation method proposed in this article. The new method also uses 2-channel A/D sampled data but, unlike the traditional method, it feeds the timing error back to the A/D data sample, which then passes through the digital down-conversion matched filter. After carrier recovery, the new method feeds the error back to the digital down-conversion, and then performs data interpolation and data demodulation through matched filtering. The specific implementation flow chart is shown in
Figure 8 below.
Timing recovery adopts interpolation timing based on a frequency domain nonlinear estimation algorithm. After two A/D channels sample the baseband signal, it is digitally down-converted, then matched filtered, and subjected to two data amplification sampling processes [
19]. The amplified sampled data after matched filtering uses a square loop algorithm for timing error estimation processing, and the processed timing error is used as the error estimation of data interpolation for the different filters for timing completion.
The signal
after the baseband signal is sampled by two A/D channels is:
where Q and I are two input signals,
is the carrier frequency offset, and t is the time.
takes the real part as:
After raising cosine rolling, the signal
after the filter is:
At this time, the signal is a function of time, is the carrier frequency deviation, and is the signal phase.
The
signal is matched and filtered after digital down-conversion, the signal at this time is given by:
where
is the noise signal,
is the carrier frequency,
is a uniformly distributed random variable in (0, 2
).
After the signal
is amplified and sampled two times by the data, the signal
is:
In Formula (6), .
In the process of modulating the signal, to save the power of the transmission signal, the square loop algorithm is used to directly extract the carrier [
20]. The received signal after the square loop contains the carrier frequency component of twice the frequency, and the phase locked loop is used. After extraction, the corresponding signal can be obtained via two frequency divisions. The sampling data amplified two times is extracted through the square loop for the timing error.
Figure 9 shows the principle diagram of symbol timing recovery.
is squared and transformed into:
where
is:
After passing through the band-pass filter,
is:
where
.
The feedback signal is multiplied by the input signal, and the error signal is obtained as:
where
is the system error coefficient,
and
are the error signals of the two input signals. After simplifying Formula (11), the error signal is obtained through a low-pass filter and a two-frequency divider:
In addition,
is multiplied by its complex form and Fourier transform is used to obtain an error signal estimate. The obtained error signal estimate is used as the timing error. This value is used as the data interpolation timing error and used for symbol timing through the difference filter. The error estimate
is:
where m is the number of samplings, N is the sampling value, L is the sampling step size,
is the conjugate function of the error signal, and k is an integer.
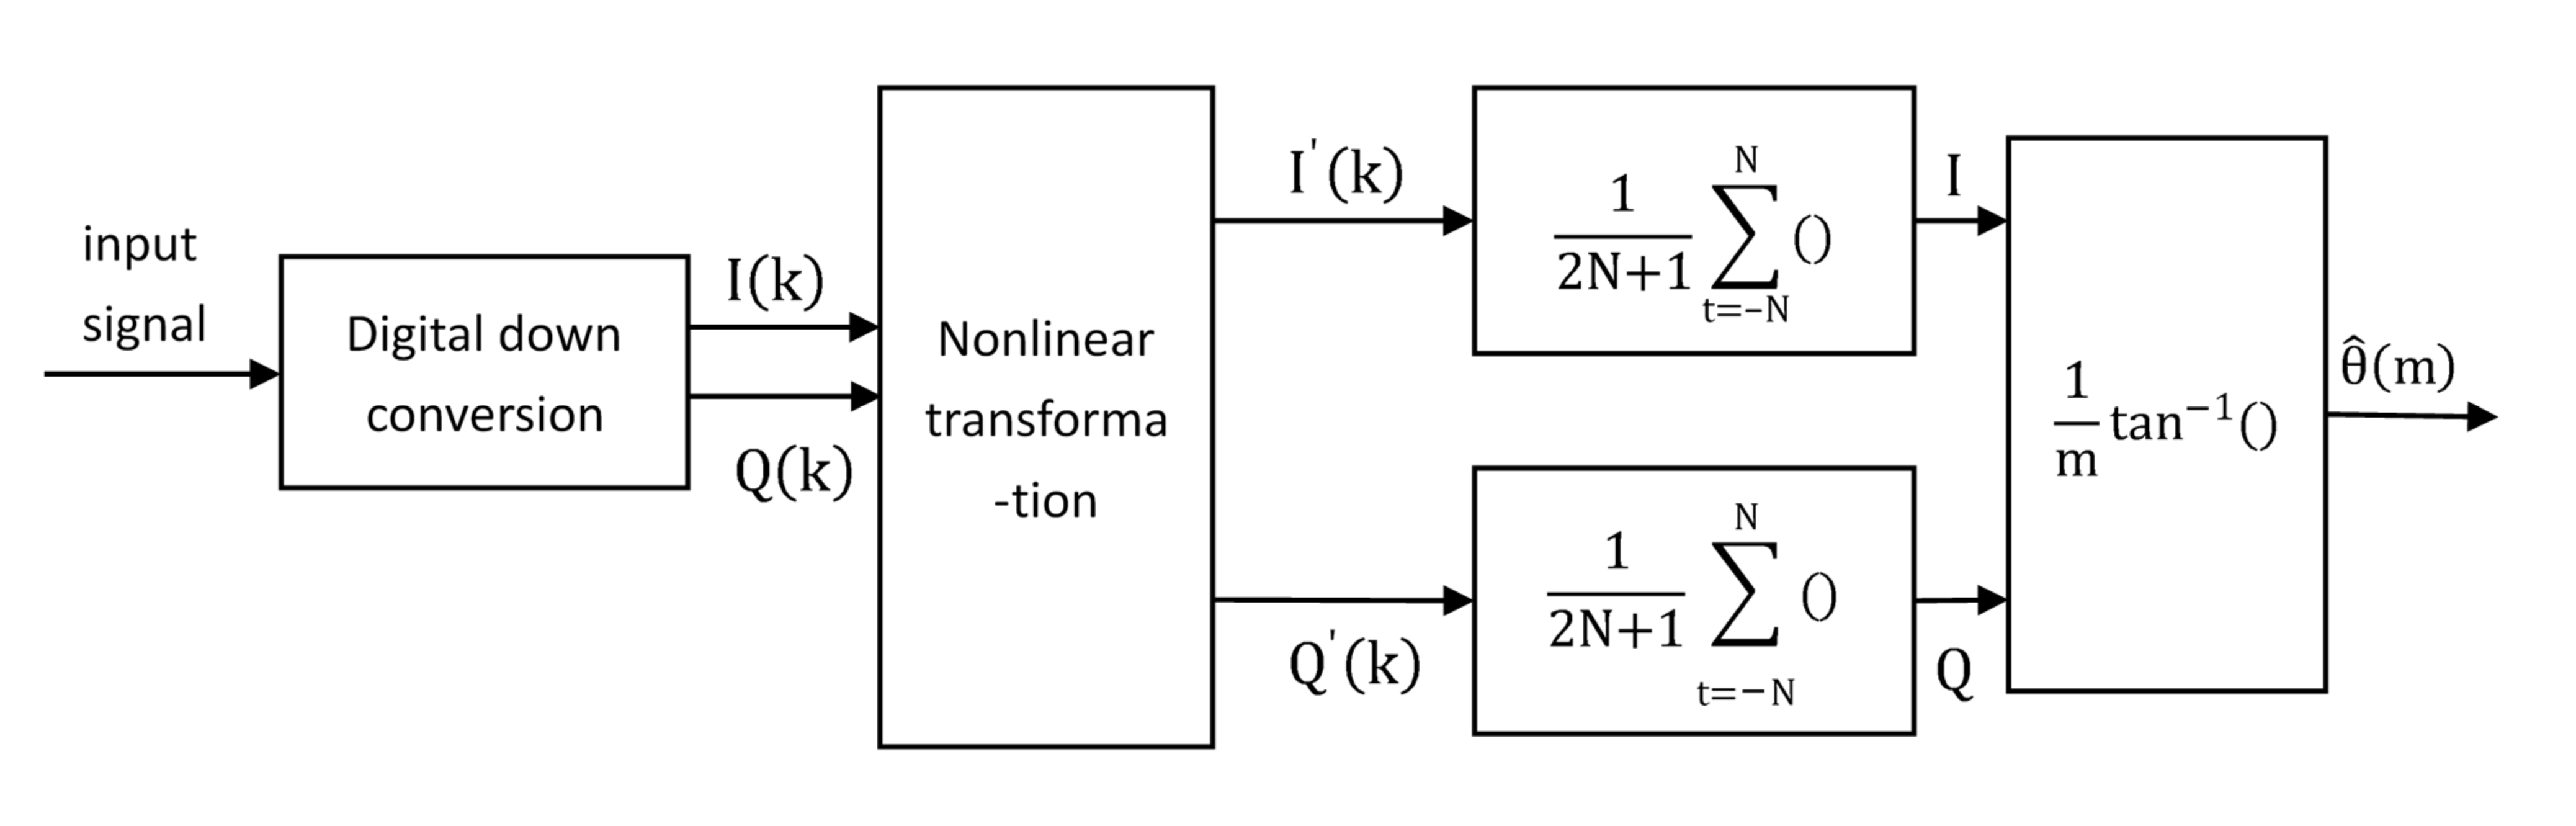
4.1.2. Carrier Recovery (Carrier Frequency Estimation)
Carrier recovery uses FFT (Fast Fourier Transformation) [
21]. FFT quantizes the carrier frequency with limited precision, and performs nonlinear transformation on the signal to eliminate the influence of modulation. The signal s(t) is:
Frequency domain analysis of
and
is:
The FFT carrier frequency difference estimation principle is shown in
Figure 10.
For O-QPSK, the output signal after nonlinear transformation is:
The twice-sampled data after matched filtering extracts the error in the symbol timing recovery. In the carrier recovery, the carrier frequency offset must be extracted for the lower-level signal modulation and applied to the carrier and timing synchronization; in (18b,c), let
, for O-QPSK,
, so the Fourier change of (18a) can obtain the carrier frequency shift amount as:
is the symbol rate, the location of the maximum peak point, and is the number of FFT points.
4.1.3. Carrier Recovery (Carrier Phase Estimation)
The carrier phase estimation uses the Costas loop [
22] composed of a phase detector and a loop filter. The schematic diagram of the carrier phase estimation recovery part is shown in
Figure 11:
The phase detection output is:
4.2. Realization of Reconnection Mechanism and Power Control Mechanism after Network Disconnection
4.2.1. Realization of Network Disconnection and Reconnection Mechanism
Figure 12 shows a schematic diagram of the principle of the disconnected network reconnection mechanism. In the figure, nodes A, B, C, and D are child nodes, nodes, parent nodes, and ancestor nodes, respectively. Node B sends information to node C and then obtains the confirmation information from node C. Assuming that node B goes offline unexpectedly, then node B cannot obtain the confirmation information from node C at this time. Let node B send messages to node C and node A three times. If no confirmation frame is returned on both sides, it is determined that node B is offline; if the confirmation frame from node A is obtained, and the confirmation frame from node C is not obtained, the parent node is offline. The node B increases the power and sends information to the ancestor node D to ensure the smooth transmission of the information.
Figure 13 shows a detailed flowchart of this mechanism.
4.2.2. Realization of Power Control Mechanism
The power control mechanism’s realization requires the TXPower register [
23] in the Zigbee protocol stack. The specific algorithm realization is shown in
Figure 14:
The specific description is as follows:
After initialization, considering that the subsequent battery supplement or replacement is not frequent during actual use, the power setting depends on the specific situation. Set the initial power P, and all nodes will send a beacon request frame Associate.request [
24].
After the node receives the request frame, it will return an Associate.indication confirmation frame, which will contain the node ID and network address.
The node sending the request frame checks the returned confirmation frame, and calculates the number of neighboring nodes “NodeNum”.
When NodeNum <2, increase the transmission power and continue to send the request Associate.request; when NodeNum >2, reduce the transmission power and continue to send the request Associate.request; when NodeNum = 2, there is only one upstream “neighbor” in the communication range node and a downstream “neighbor” node, and the process ends. When NodeNum = 3, there are 3 “neighbor” nodes in the communication range, node IDs are compared, the two nearest neighbor nodes are selected, and the process ends
4.3. Implementation of LEACH Improved Protocol
In the LEACH protocol application phase, the data of a single node is often associated with the end-user of the sensor network, and the events that occur in the environment require high-level functional data to be described [
25]. The Improved-LEACH protocol is changed to select the cluster head manually, and the primary purpose is to reduce the transmission energy of the nodes in the cluster. In the Improved-LEACH protocol, data must be transmitted for all nodes, and the final data will be uploaded to the base station. If the node is elected as a cluster head, the cluster head node must have enough energy to transmit, and each node can use different transmission energy and support different MAC (Media Access Control) protocols; each node forms a local cluster, and through the FCM clustering algorithm, a node is identified as the cluster head [
26]. Other non-cluster head nodes transmit their data to the cluster head, and the cluster head receives data from all cluster members and processes the data sent to the base station. If the cluster head selection is sufficient, then cluster head nodes consume more energy than non-cluster head nodes, so cluster head nodes will quickly consume their limited energy. Once the cluster head’s energy is lower than the communication capability threshold, it no longer operates, and all cluster nodes lose communication capability. Therefore, in the Improved-LEACH protocol, a random selection of high-energy sensor nodes is introduced as the cluster head of the cluster to avoid the rapid loss of any sensor node’s capacity in the wireless network. In the Improved-LEACH protocol algorithm, the selection of cluster head nodes is divided into different rounds. At the beginning of each round, a new cluster is formed, and then data is transmitted from the node to the cluster head, and the cluster enters a stable state.
The basic principle of the Improved-LEACH protocol is as follows: For the data to be analyzed, the user determines a–c and then divides the data into c categories, and the center position of each category is marked by the cluster center. Such an initial division requires repeated correction of the cluster center to the optimal position through the FCM algorithm [
27]. A function represents the distance from any data point to the corresponding cluster center. This function is minimized based on this iteration until the weighted sum of the distances from each type of data point to its corresponding cluster center reaches the minimum. The iteration ends when the data is successfully divided into category c by the FCM algorithm [
28].
The Improved-LEACH protocol selects the cluster head and the formation process of the cluster as follows:
- (1)
Initialization: Set the number of clusters c, 2 ≤ c ≤ n; set the iteration stop threshold to ε, initialize the cluster center P(0), and the iteration counter b = 0.
- (2)
The new classification matrix U is obtained by the following formula:
- (3)
The classified cluster center pi is obtained by the following formula:
If ‖P(b + 1) − P‖ < ε, the algorithm ends, and the cluster center P is selected and becomes the cluster head node. At this point, each cluster in the network has a different node, and each cluster has a unique identifier; otherwise, let b = b + 1 and jump to step (2).
In the first round of the algorithm, the system pre-specifies the optimal number of cluster heads c and uses the FCM algorithm to divide the entire wireless network into c cluster areas. Each node is divided into one of the cluster areas. The weighted sum of the distances from the class node to its corresponding cluster head is the smallest. In the wireless network’s life cycle, the cluster class structure is fixed; once the cluster class identifier of each node is given, it will not change until the node fails. In the next round, the algorithm starts, with the exception of the cluster head of the previous round. In addition to nodes, other ordinary nodes in the cluster need to report their own energy value, Ecur. In the previous round, the cluster head node selects the node with the highest Ecur value and uses this node as a new cluster head node, and other nodes become ordinary nodes. If several nodes in the cluster class have the same Ecur value and are all the largest, then the cluster head node is selected according to the ID size of these nodes. After the cluster head node is selected, the node will allocate communication time slots for each common node according to the number of nodes in the cluster class and then broadcast the message to other nodes using the CSMA (Carrier Sense Multiple Access)/MAC protocol. Ordinary nodes must keep their receivers listening to the cluster head node’s broadcast at this stage.
In the Improved-LEACH protocol algorithm, the single-hop communication mode is used. The advantage of adopting the single-hop communication mode is that ordinary nodes do not need to monitor at all times and only need to send data to the cluster head in the TDMA (Time Division Multiple Access) time slot allocated to them, and then enter the sleep state, thus saving energy. When communicating between clusters, the single-hop communication mode is used, which reduces the number of long-distance communications with base station nodes and can save energy.
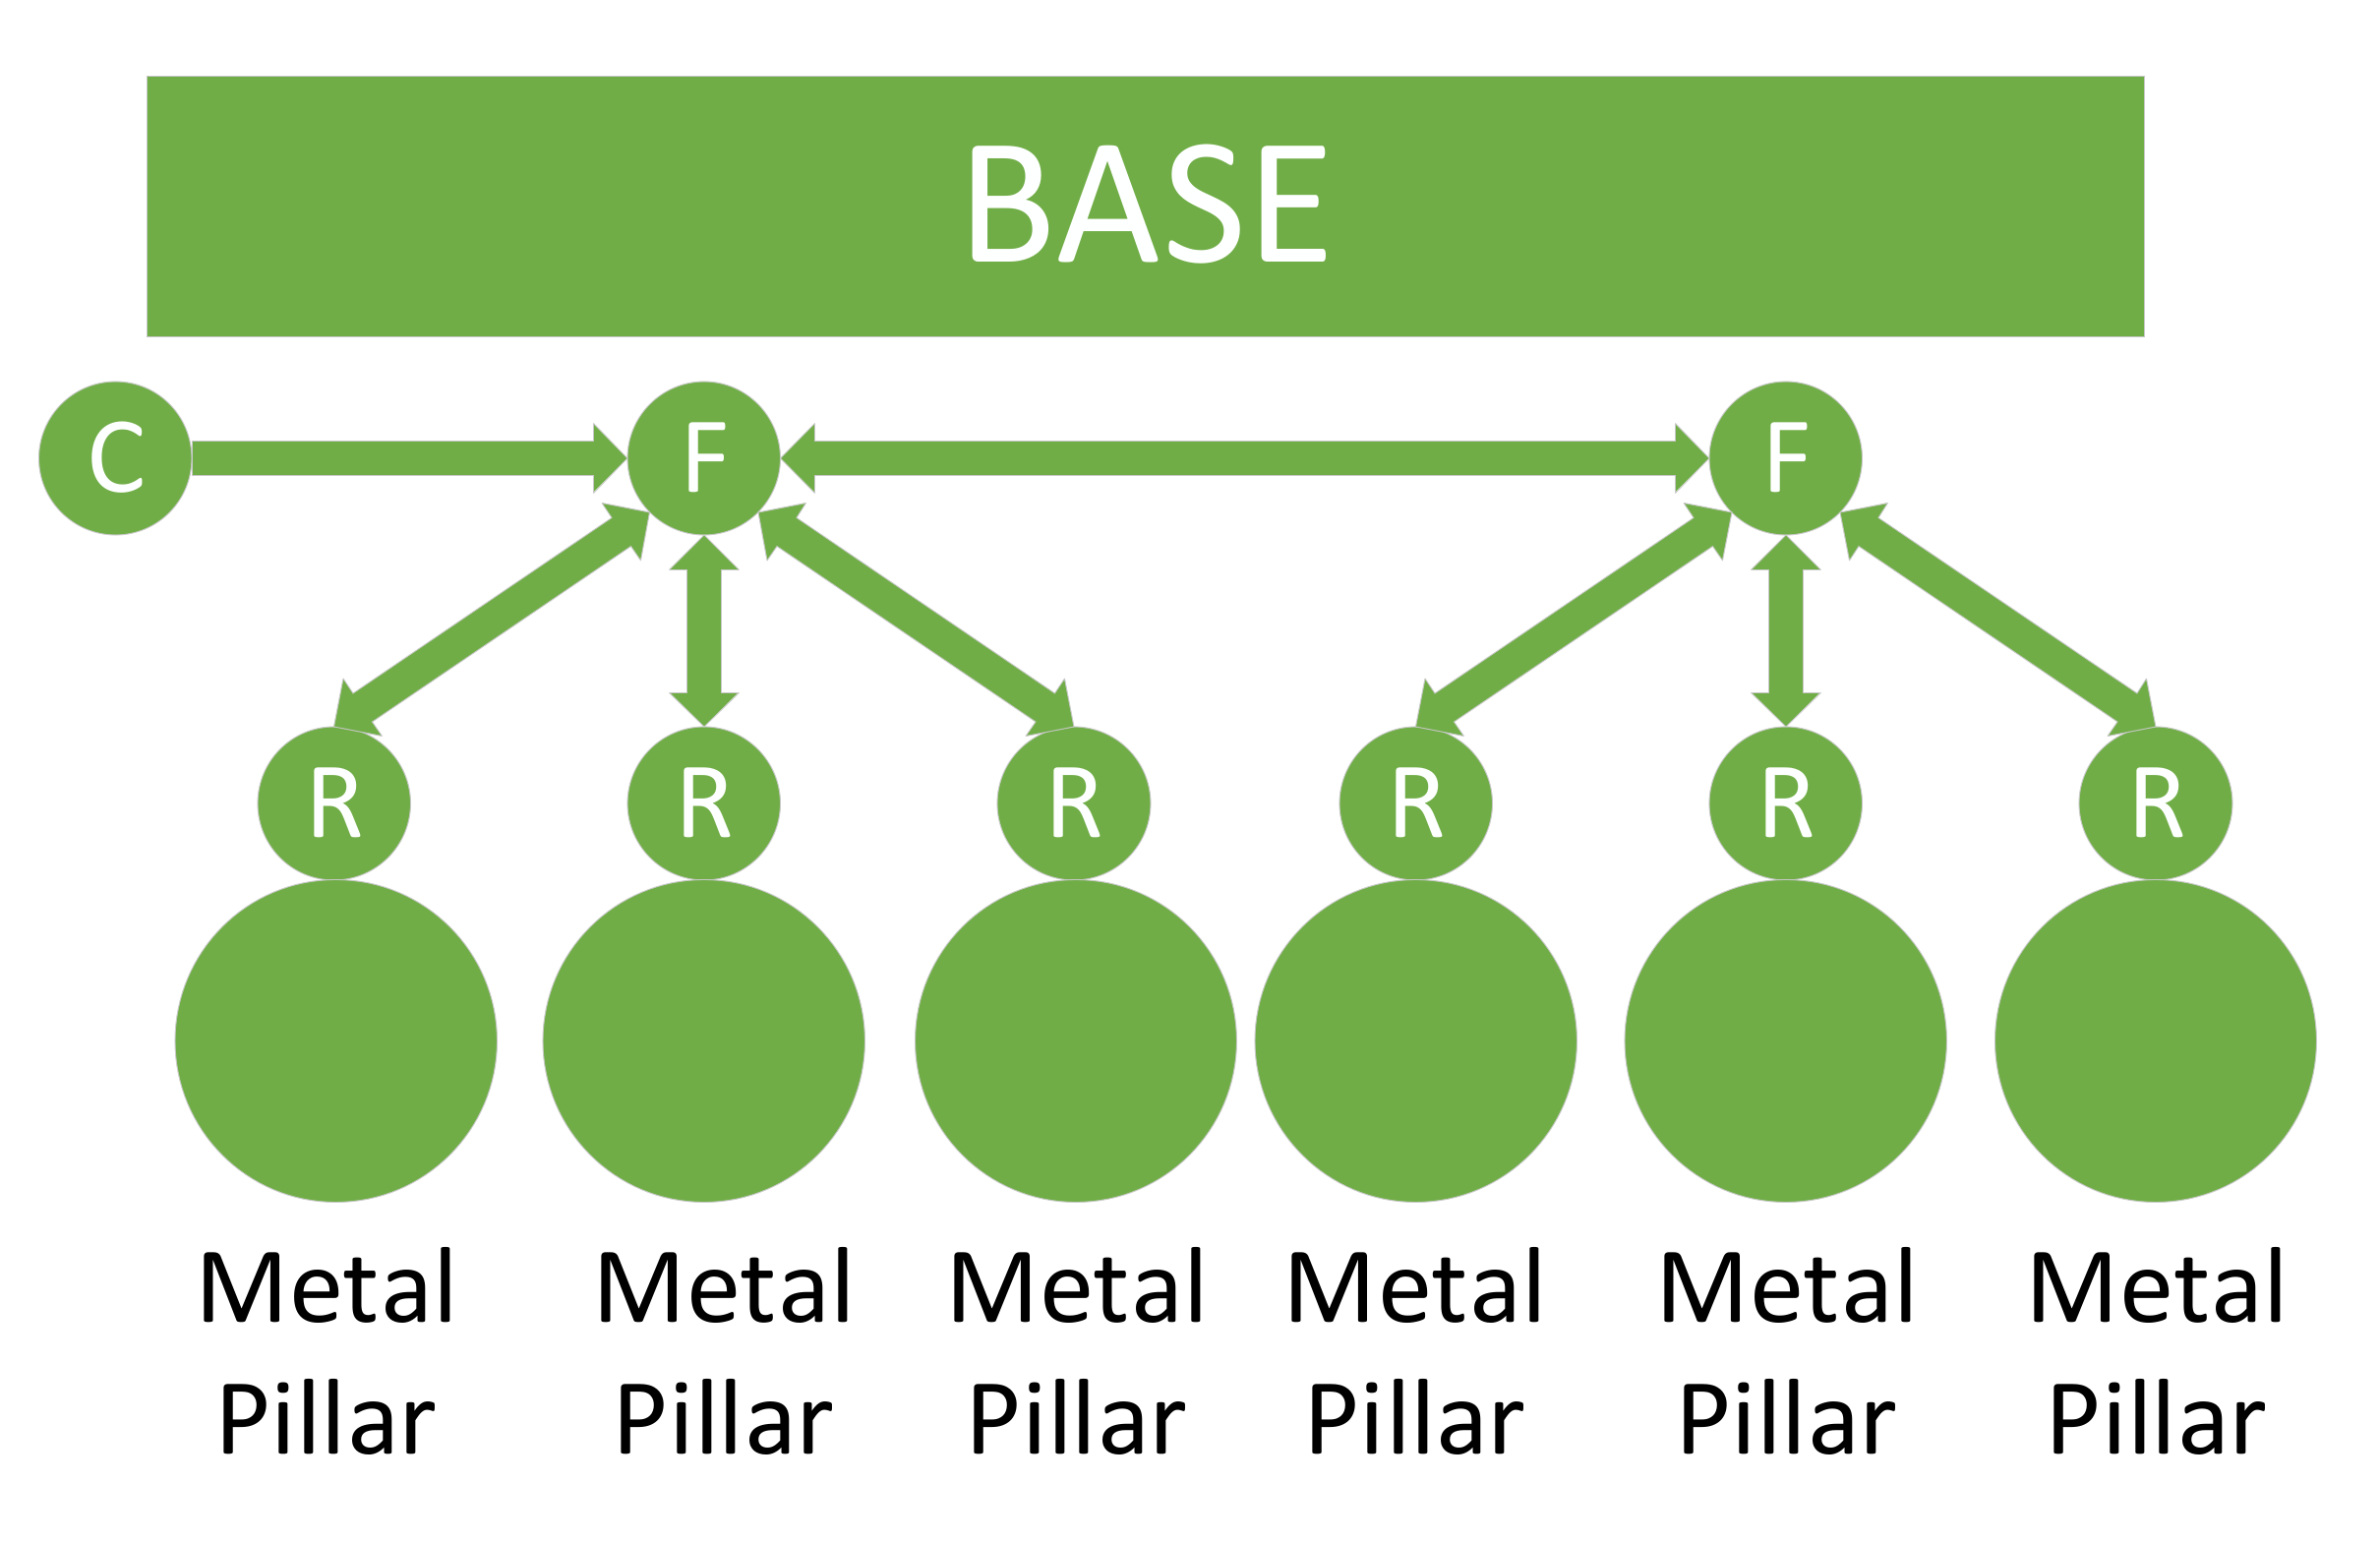
5. Simulation and Performance Comparison of Improvement Measures
The article uses the Nakagami analog channel to describe the channel environment of the mine tunnel. The article’s background is based on installing suitable wireless equipment on the hydraulic supports in the mine environment. In the simulated environment schematic diagram, the equipment is placed on hydraulic supports for receiving and transmitting. The general schematic diagram is shown in
Figure 15.
The simulation experiment adopted a similar arrangement, and the idea of simulating the channel is as follows [
29]:
The modulated random signal passes through the
port, passes the Rayleigh fadingchannel, and then passes the Rayleigh sampling sequence to convert the complex signal into amplitude and phase angle. The amplitude of the sequence is passed through the unbuffer module. The unbuffer module parameter to overlap = 0 [
30]. Finally, a uniformly distributed random sequence and a Nakagami random sequence are sequentially generated through function transformation, and finally the output signal is normalized and the Nakagami distribution is regularized to the required power value through the gain module [
31]. Then, the amplitude and phase angle input are converted into Nakagami’s complex signal output, and then output by the Out1 output port.
The Zigbee device chip adopts CC2530, which meets the IEEE802.15.4 standard, and has the characteristics of high integration, low power consumption, low cost, and low rated voltage. The chip has a powerful integrated development environment, and the development difficulty is low [
32]. The protocol stack is configured inside the chip, which results in low energy consumption generated during the work process.
5.1. O-QPSK Performance Test Based on Feedforward Timing
According to the previous section, three device boards and one Zigbee device form a small network. This small network is called a cluster. The coverage area of the cluster is about 10 m or less. A cluster group is tentatively set for 10 m. In each cluster, the group is connected to a ZigBee device, which acts as a coordinator and is connected to the upper computer. The schematic diagram is shown in
Figure 16, with the experimental device placed in the experimental environment.
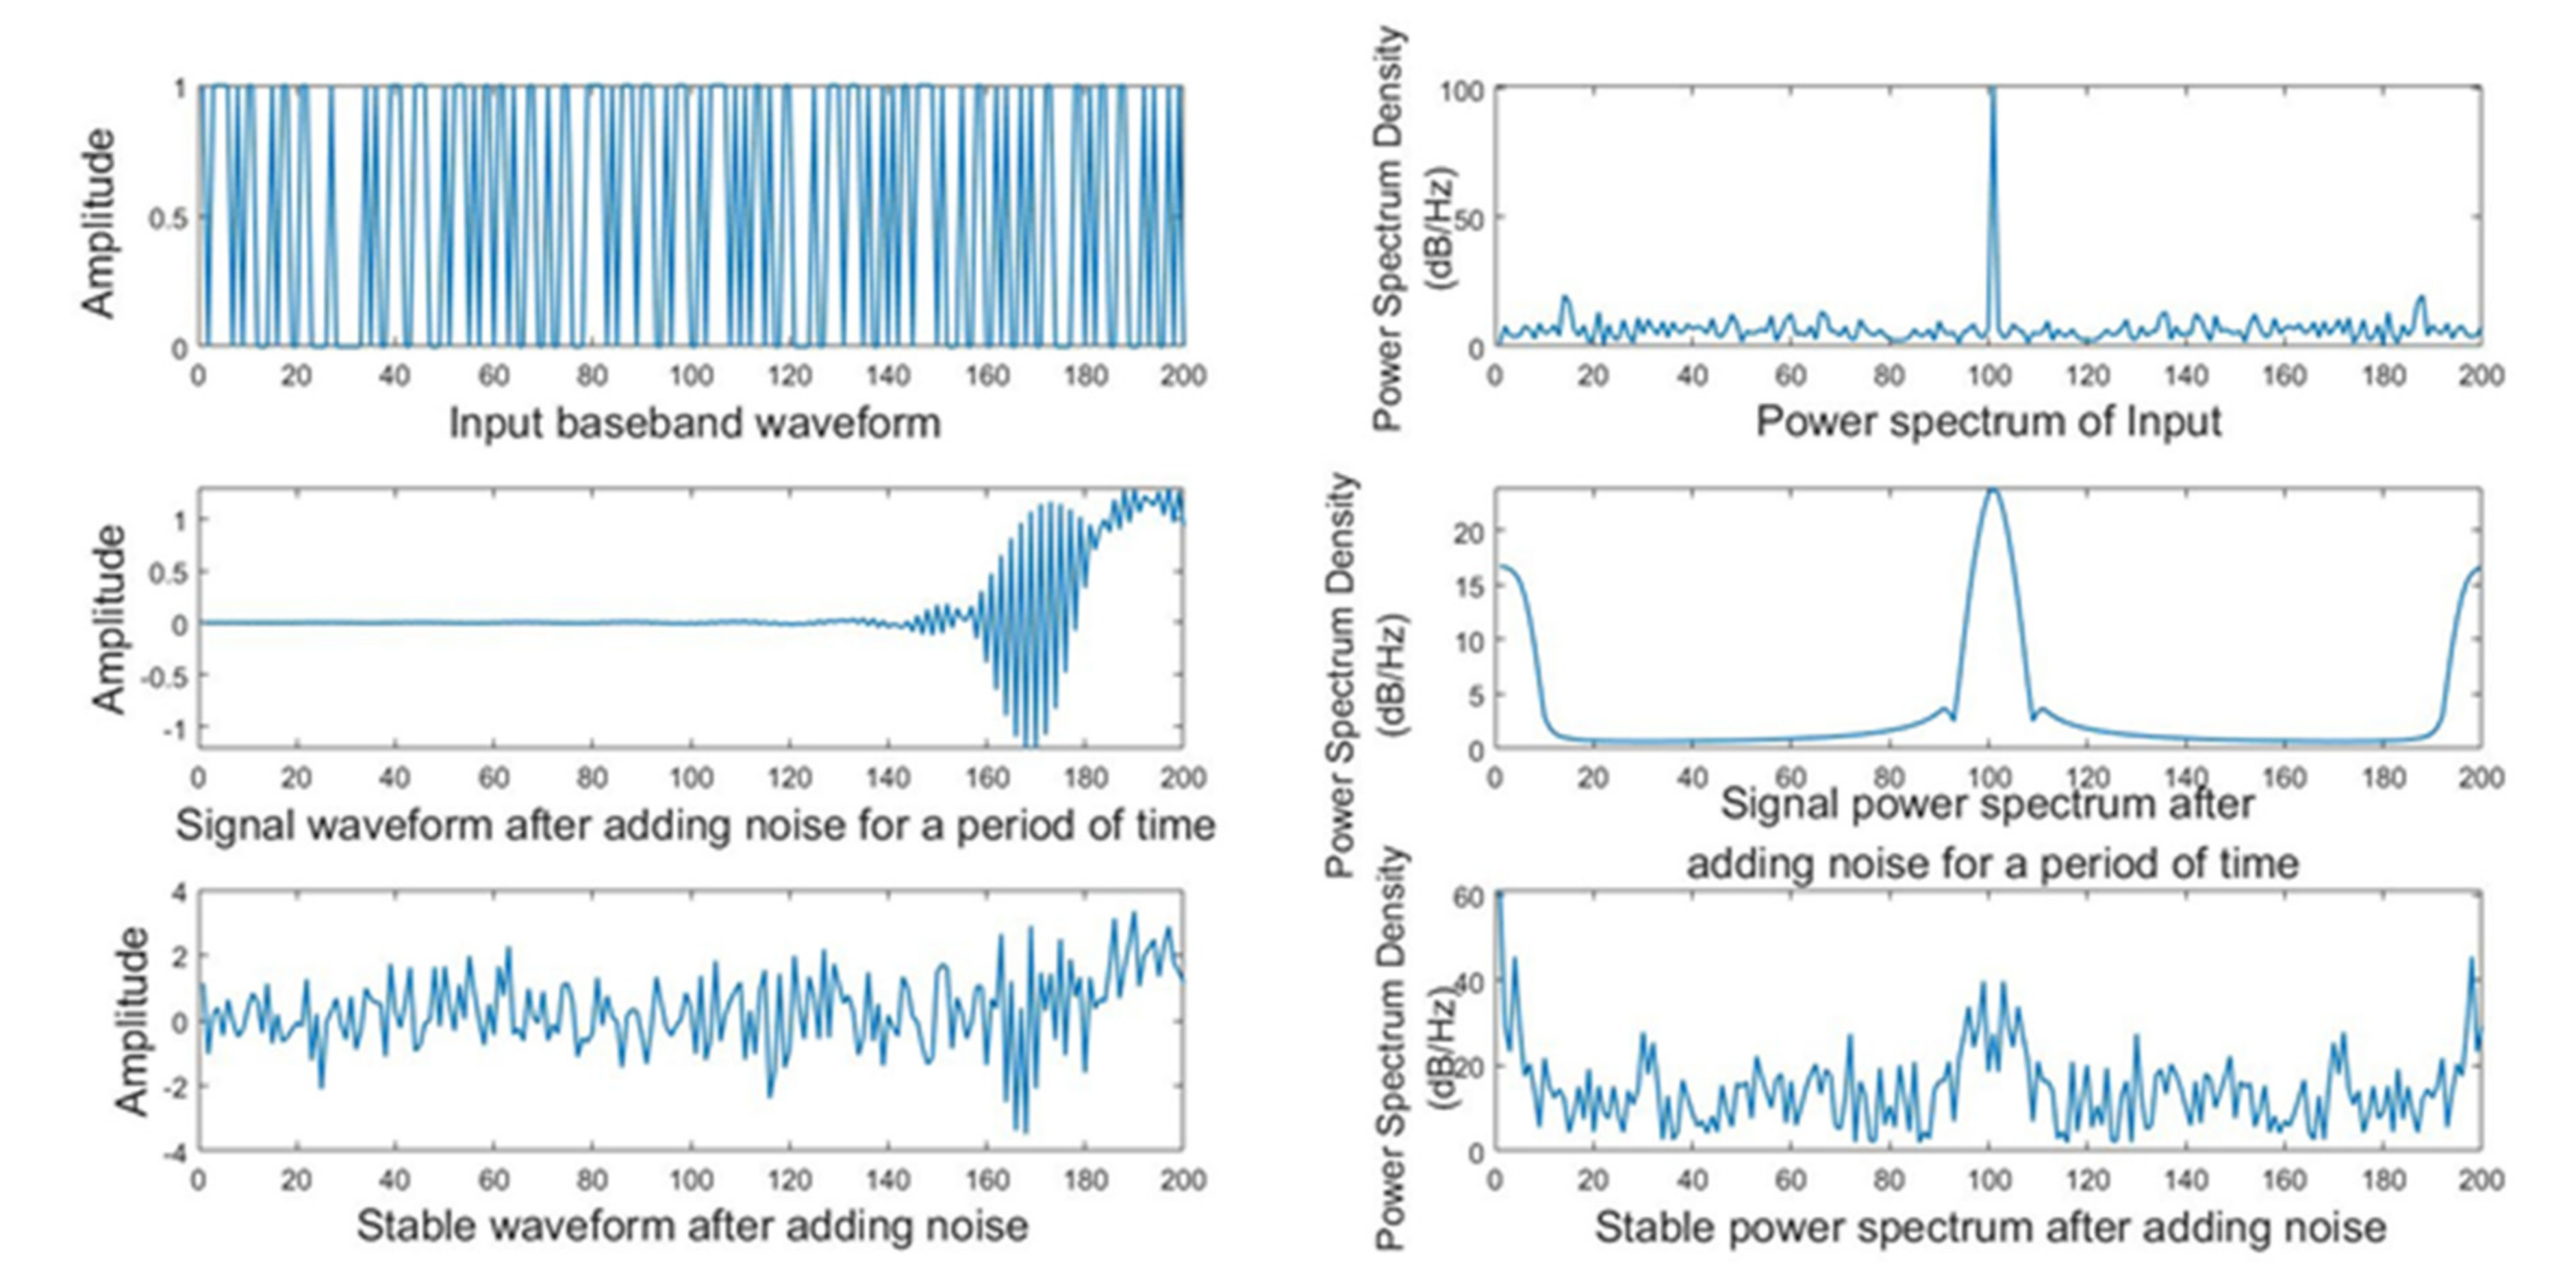
The number and type of equipment used is fixed. When the number is large, it may have an individual impact on the single experimental equipment. Therefore, a small amount of equipment was used temporarily for observation. To simulate the environment, a noise signal was superimposed on the input signal to simulate a mine environment. Then, MATLAB was used to detect the fluctuation of the data and intensity test, and observe the signal waveform. The input signal was stable, and the noise channel was superimposed to show a messy signal performance, as shown in
Figure 17. After the channel conditions were stabilized, the waveform continued to show a messy signal performance, as shown in
Figure 17. Thus, the other characteristics of the signal must be observed.
As shown in
Figure 18a–c, the baseband signal sent by the information source is a stable signal with energy concentrated around 0 Hz. The signal and power performance of the upper and lower branches are similar to those of the baseband signal. The baseband signal is modulated and sent; whether the modulation changes the performance and or affects the subsequently received signal requires further observation.
As shown in
Figure 19a–c, the demodulated signal is consistent with the baseband signal, and the power is concentrated at 0 Hz, which is the same as that of the original baseband signal. It can be considered that the signal is undamaged and not affected by channel interference. Although this method involves some complication, it ensures that the demodulated signal’s properties remain unchanged. Furthermore, the performance is not compromised, which proves that the method is relatively successful.
According to the verification of simulation experiments, the signal’s demodulation process is relatively smooth, and the demodulated signal is the same as the original signal, indicating that the demodulation method based on feedforward timing is more successful in the application of O-QPSK. However, it can be seen from the eye diagram (As shown in
Figure 20) that noise interferes with Zigbee devices; the symbols are overlapped, and although the “eye” type is open and closed, it is small. This indicates crosstalk between the symbols, although its impact is weak and mainly affected by noise. Thus, attention should be paid to the influence of noise when making adjustments.
5.2. Verification of Improvement Measures in the Case of Multiple Devices
The simulation experiment under multiple devices requires the support of the conclusion of the O-QPSK simulation experiment based on feedforward timing, and the device initialization is first required. The device is chaotic during initialization but tends to stabilize over time, as shown in
Figure 21.
After the network nodes are stable, several measures proposed in the article are used for comparison. The regional parameters were first set, as shown in
Table 3.
First, a network health test must be conducted. A previous article proposed the disconnection mechanism, the power control mechanism, and the error control protocol to address the problem of node disconnection. The artificial redundant node and alternative link mechanisms were proposed for crucial and essential nodes. However, during the test, it is necessary to observe the changes in the total number of network nodes for evaluation. According to the settings, the broken node sends a message to the adjacent node to confirm that it is offline. However, if the node is not off the network due to damage, it can initiate a reconnection request, and the transmission chain of the node that is offline due to damage will temporarily route the message to another transmission link. The console can obtain information about whether the node is on the network through the node ID and node network address.
Table 4 shows the data table of changes in the number of nodes.
According to the experimental data, all of the nodes spent about 35 min on the network. Initially, due to equipment initialization and other reasons, the network construction was slow. After the test started, the network comprised only five nodes for approximately 100 min. According to the investigation, this was due to external reasons on site (accidental disconnection caused by the drop). The device was relatively stable and there was no disconnection.
Table 5 shows the signal delay detection. Detecting the degree of network signal delay can also provide a measure of the health of the network. In the experiment, any 10 nodes were selected for testing. To minimize the error, the average delay was calculated through multiple tests. The aim was to reduce the impact of large errors for each detection. According to the data in the table, the signal delay was not obvious during the time period of the simulation experiment and was relatively stable.
Figure 22 shows the signal strength coverage detection. It can be seen from the figure that the signal was relatively strong within 100 m, significantly weakened within 100–150 m (although a weak signal was present), and almost no signal was present beyond 150 m.
The Improved-LEACH protocol was mainly aimed at network energy saving, thus reducing unnecessary waste in the process of route discovery and route searching. However, it also improves the delay problem in the signal transmission process, that is, the reduction of signal transmission time, as shown in
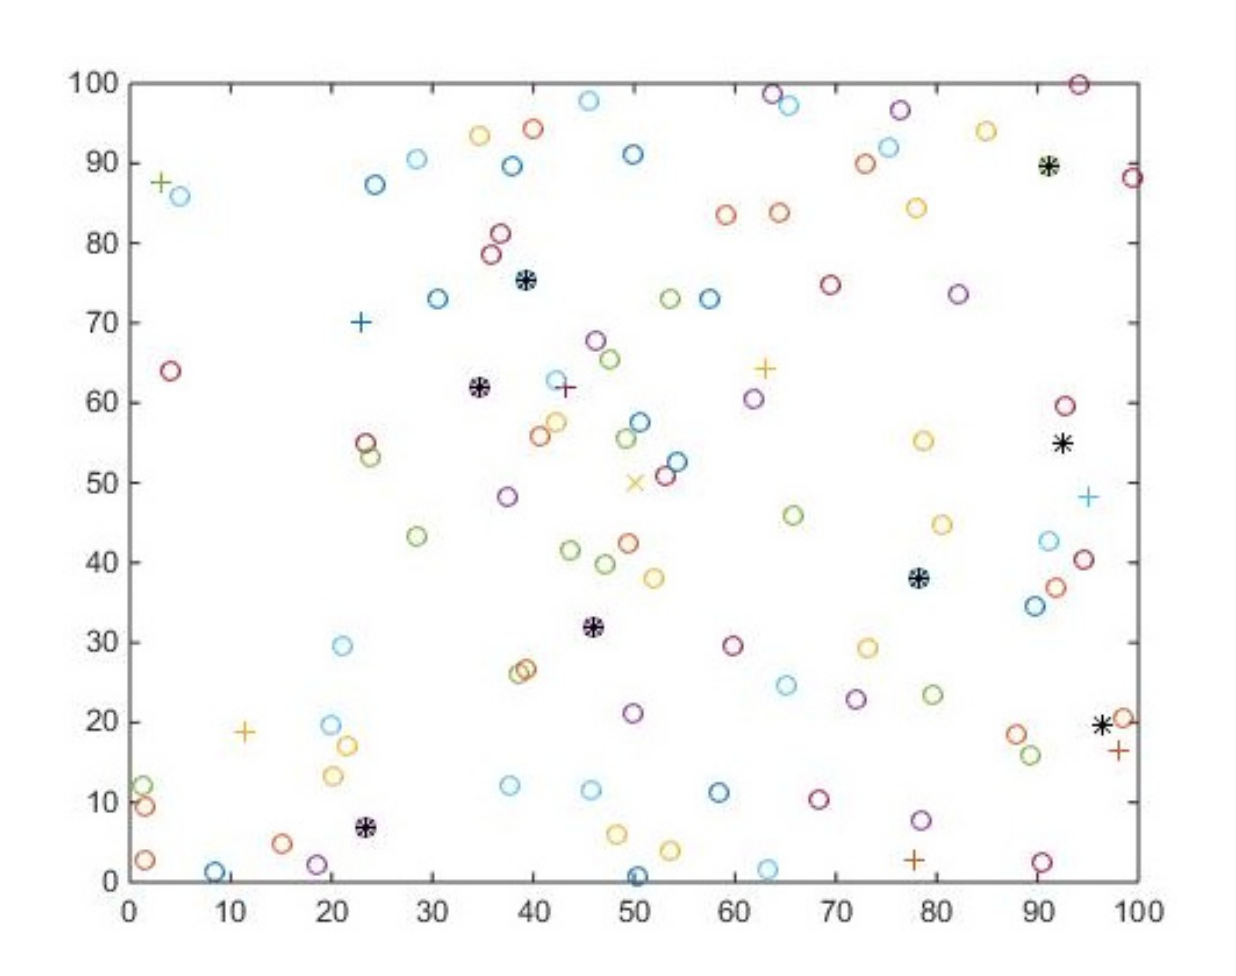
Figure 23. To improve the performance of the nodes under the LEACH protocol, the number of nodes in the experiment was 100, and the area was selected to be 100 m
2 to manually set obstacle areas. The nodes were randomly arranged, and the life of the network was reflected by the death of the first node and half of the nodes in the network. The experiment was cycled by counting the number of rounds of network cluster establishment when the first node died, when half of the nodes died, and when all of the nodes died. According to the initial settings, the initial energy of the node was 0.05 J. The network life cycle comparison when the number of cluster heads in the algorithm was 2, 3, 4, 5 and 6 is shown in
Table 6:
It can be seen from
Table 6 that the life cycle of the wireless network is longest when the number of cluster heads is 5.
Table 7 shows the number of rounds experienced using different algorithms when the number of nodes die:
The first column contains the name of each protocol, and the first row contains the number of node deaths.
Table 7 shows that the Improved-LEACH protocol performs well when the number of nodes in each stage dies. Observing the delay test under the LEACH improved protocol, it can be seen that the Improved-LEACH protocol reduces the signal delay problem. In addition, when the transmit power is increased, the packet loss rate is significantly reduced, and it is possible to communicate information over a longer distance. Compared with the LEACH protocol, the Improved-LEACH protocol provides limited alleviation of the delay and packet loss problems. Specific data are shown in
Table 8,
Table 9,
Table 10 and
Table 11 below.
6. Conclusions
This study was undertaken in the context of underground mines. The current article introduces the communication conditions of underground mines and notes that the mine environment is complicated, thus, the mine communication environment is severe. Zigbee technology was selected from the currently available mature communication technologies. Although Zigbee technology is more mature, it has a number of disadvantages. The article focuses on addressing the disadvantages arising from the technical modulation technology itself and those due to the networking technology. Aiming at the drawbacks of modulation technology, an improvement measure was proposed. According to the simulation verification in
Section 5, the improved O-QPSK modulation method performs well, addresses the difficulty of synchronization caused by the original modulation technology, and provides a more accurate solution. Excluding the original data, the shape and performance are not changed. Although the process is more cumbersome, it has higher security and significantly improved adaptability. It is suitable for the communication environment outlined in this article, and can be particularly used for signal transmission under non-line-of-sight conditions. Five mechanisms and an improved protocol were proposed to address the disadvantages of networking technology. In large-scale networking, which is often carried out in practice, the network is affected by the layout. For example, this article noted that Zigbee large-scale networks are affected by multipath and fading effects in mines. These have a significant impact on the network. Thus, four mechanisms were proposed, in addition to one protocol and an improved protocol. Among these, for node disconnection, a network reconnection mechanism was proposed. The power control mechanism and error control protocol provide response and temporary remedial measures after the edge node goes offline, whereas the artificial redundant node and alternative link mechanisms provide important remedial measures for node collapse or disconnection. The Improved-LEACH protocol addresses the problem of reducing the energy expenditure of the overall network. After analyzing the mine communication environment, the approximate Nakagami channel was proposed as a simulation experiment environment. In the simulation experiment, the number of nodes, signal delay, signal strength, and packet loss rate were tested. The experimental results prove that the proposed measures can achieve the expected effect, effectively enhancing the health of the network and better adapting to the harsh communication environment of underground mines.


