Abstract
Cardiovascular diseases have been reported to be the leading cause of mortality across the globe. Among such diseases, Myocardial Infarction (MI), also known as “heart attack”, is of main interest among researchers, as its early diagnosis can prevent life threatening cardiac conditions and potentially save human lives. Analyzing the Electrocardiogram (ECG) can provide valuable diagnostic information to detect different types of cardiac arrhythmia. Real-time ECG monitoring systems with advanced machine learning methods provide information about the health status in real-time and have improved user’s experience. However, advanced machine learning methods have put a burden on portable and wearable devices due to their high computing requirements. We present an improved, less complex Convolutional Neural Network (CNN)-based classifier model that identifies multiple arrhythmia types using the two-dimensional image of the ECG wave in real-time. The proposed model is presented as a three-layer ECG signal analysis model that can potentially be adopted in real-time portable and wearable monitoring devices. We have designed, implemented, and simulated the proposed CNN network using Matlab. We also present the hardware implementation of the proposed method to validate its adaptability in real-time wearable systems. The European ST-T database recorded with single lead L3 is used to validate the CNN classifier and achieved an accuracy of 99.23%, outperforming most existing solutions.
1. Introduction
1.1. Background
Coronary Heart Disease (CHD), also known as Cardiovascular Disease (CVD) is a result of lack of blood supply to the heart organ. CHD is attributed to many different types of arrhythmia, which are generally defined as irregular, slow, or rapid heart beats. Acute Myocardial Infarction (MI) can result in death, but fatalities usually depend on the severity of an arrhythmia. The rising mortality rates due to these heart diseases have demanded early diagnosis of cardiac conditions before they progress to acute MI and leading to death. The most common tool to diagnose different types of arrhythmia is Electrocardiogram (ECG). Thorough analysis of ECG has gained much attention among researchers to accurately and effectively diagnose arrhythmia and critical cardiac conditions. Traditional diagnosis involves bedside ECG recording and the physician’s presence to analyze and diagnose a condition. However, such methods are time consuming and in most severe cardiac cases, time is crucial in diagnosing such a condition.
Real-time monitoring has overcome this shortcoming by sending the acquired ECG data from the body-attached portable and wearable device to a central location for automated diagnosis using advanced machine learning methods and algorithms. Real-time monitoring systems have reduced the requirement of patients traveling to the clinic and the doctor’s or physician’s presence. It has improved the telehealth experience for most users and facilitates early diagnosis and treatment towards saving lives. Early diagnosis can save costs in the healthcare industry, as about 17.9% of the national cost is due to CVD [1]. ECG analysis and classification in real-time monitoring systems is carried out through multiple processes described by the stages-based model in Reference [2]. These processes can be grouped into three steps, that is, data acquisition, preprocessing and feature engineering and classification for machine learning approaches. One such approach is proposed in this study.
In this study, we aim to detect Normal (N), ventricular ectopic (V), and ST-segment changes that contribute towards the diagnosis of MI. We build on top of our prior work [3] and present a three-layer model for the classification of ECG into three classes of Normal, ST-change, and V-change types. The model is based on a Convolutional Neural Network (CNN) that works at layer three of the model and trained on 2-D ECG images; a snapshot of the ECG wave between two consecutive R-peaks. The extracted ECG within every two consecutive R-peaks is referred to as an image for the purpose of the machine learning experiments in this study. The proposed model is referred to as our 2-D CNN throughout this paper. This model can be used for real-time monitoring and integrated with portable and wearable devices for ECG acquisition and preprocessing. The images can be sent to a central location for classification by applying our proposed 2-D CNN. Devices like smartwatches and smartphones are now an integral part of our daily lives. These devices can be leveraged as portable and wearable devices for real-time monitoring of the health status. This encourages the users’ cooperation to accept this as a diagnostic support tool towards improving health and the quality of life.
To evaluate our 2-D CNN classifier, we have acquired ECG signals from the publicly available European ST-T database (ESCDB) [4]. Though the standard 12-lead ECG and/or ECG collected from several leads provide most effective results, recent research has shown that ECG data acquired from a single lead, mostly used in portable real-time monitoring devices such as smartphones and smartwatches [5,6,7], has started to gain acceptance for detecting certain arrhythmia types and pathological rhythms such as atrial fibrillation. Consecutive recording of multiple single-lead ECG can also be effective for detecting ischemic diseases and MI [5]. Reduced number of leads has tremendous benefits in real-time monitoring systems as less number of sensors will be attached to the body surface, making it more convenient for any user to employ. To this end, ESCDB is an appropriate database for evaluating algorithms and techniques in this context, as it has single-lead ECG recordings. The CNN algorithm in this work is implemented in Matlab and the preprocessing of ECG data is achieved in Python 3.7.
1.2. Electrocardiography
Electrocardiography, although invented more than a century ago by a Dutch physiologist Willem Einthoven, still remains the most useful and readily available investigation in the field of cardiology throughout the world. The Electrocardiogram (ECG) is the graph showing the recorded cyclic electrical activity of the heart, received through the electrodes of the ECG leads attached to the body surface, as shown in Figure 1. The electrical activity is generated by the cardiac tissues, as small potentials, which are amplified by the electrocardiograph and recorded on graph paper as ECG. The ECG is usually recorded with twelve leads, known as conventional leads. The first set of six leads is called limb leads, which record the potential across the frontal plane. These six limb leads are further divided into three standard limb leads, also known as bipolar leads and three unipolar limb leads, named AVR, AVL, and AVF. The second set of six conventional leads is called precordial leads, also known as chest leads. These leads record the potential across the horizontal plane and are named V1 to V6. These twelve conventional leads are oriented towards the heart in such a manner that reflect, together a two-dimensional view in two perpendicular planes, the frontal plane and the horizontal plane. A third dimension in the sagittal plane can be added, for example, by an esophageal ECG or the measurement may be done using three orthogonal vectorcardiographic leads such as in the Frank’s orthogonal lead system containing seven electrodes [8]. However, with the growing technology and computer vision techniques, the diagnosis of heart conditions from analyzing the ECG signal recorded with a single lead, or recorded sequentially from multiple single-lead ECG, has started to gain clinical acceptance in the recent years, especially using portable monitoring devices [5]. These advances can further be employed to significantly improve the real-time detection and automated diagnosis of different cardiac conditions such as MI, also known as “heart attack” and ischemic heart disease.
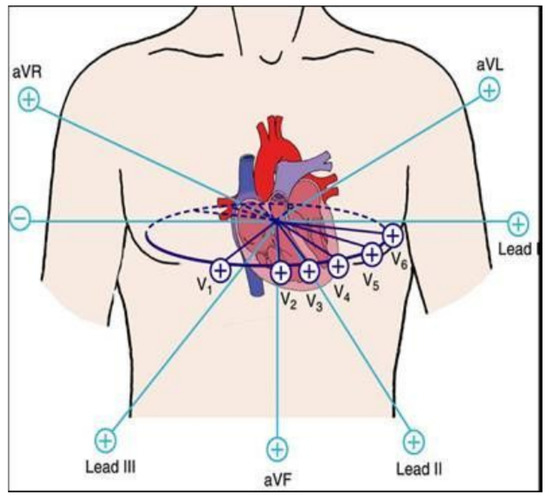
Figure 1.
Electrocardiogram (ECG) conventional leads orientation.
The importance and significance of electrocardiography is well recognized not only in the diagnosis of MI, but also in detecting conduction disturbances or abnormalities and various types of arrhythmia. The advent of modern medical therapy of unstable angina and acute MI, and the development of interventional cardiology, has increased the significance of electrocardiography in contemporary cardiology. The ECG waves and fiducial points are named in alphabetical order. These are called the P, QRS-complex, and T-waves, as shown in Figure 2. The R-peak is generally known as the focal point of an ECG beat, and the time interval between two consecutive R-peaks is called the R-R interval (also referred to as the RR interval). The amplitude, shape, and time interval of these waves provide significant information about the state of the heart. The QRS-complex reflects the ventricular depolarization generated by the positive wave when impulse spreads towards the positive pole of the respective ECG lead [9,10]. MI usually affects the ventricles, and therefore the QRS abnormalities are associated with the ST-T abnormalities. The ST-segment elevation is mostly the earliest change in acute MI and its early detection is of much significance from the medical treatment point of view. Premature ventricular complexes (PVC), also known as ventricular ectopic (V), are the premature beats originating from slow ventricular activation and reflected as a wide QRS complex in ECG. These may reflect underlying cardiac diseases, such as the ischemic heart disease. According to the Association for the Advancement of Medical Instrumentation (AAMI), the non-life threatening arrhythmia types can be categorized into five classes: non-ectopic or Normal (N), supraventricular ectopic (S), ventricular ectopic (V), fusion (F), and other unknown (Q) categories [11]. The process of detecting different types of arrhythmia into its appropriate cardiac condition is called classification.
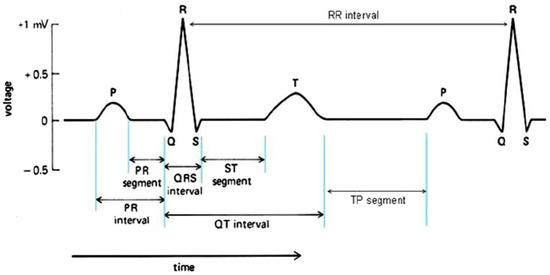
Figure 2.
ECG R-R interval and fiducial points.
1.3. Three-Layer Process
Diagnosis of a cardiac condition requires proper detection of the arrhythmia with Computer-Aided Design tools such as machine learning techniques. The detection process involves ECG signal acquisition, removal of noise by preprocessing, identifying the fiducial points in the ECG wave such as the QRS-complex and ST-segment, as shown in Figure 2, and classifying it into different types of arrhythmia. We present these steps as a structured model consisted of a three-layer process, shown in Figure 3. Layer 1 behaves as the sensor layer responsible for data acquisition. Layer 2 acts as a coordinator between the first and third layer and is responsible for any preprocessing. Layer 3 has the role of a central location responsible for identifying and classifying the ECG signal. We explain the implementation of this three-layer model as follows:
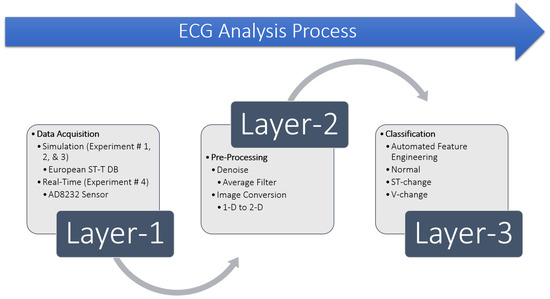
Figure 3.
Layer-based ECG Analysis Process.
The very first step in any ECG analysis is to acquire the ECG signal. For evaluation of algorithms and techniques, ECG signals are usually acquired from publicly available databases. We have acquired ECG signals from the ESCDB database at the first layer of this process and evaluated our method. The selection of datasets is discussed in Section 5.3. We have also evaluated our method in real-time with ECG signals acquired from the AD8232 sensor discussed in Section 6.4. The second layer consists of ECG preprocessing, since the acquisition of the ECG signal inherits embedded circuit noise and external power-line noise. It is very crucial to filter these noise sources for better detection of the fiducial points, classification and reducing false negatives which are more critical compared to false positives. We have used average filtering to denoise the ECG signal and to perform different experiments in this study, discussed in Section 5.3. However, there are other methods to filter noise from ECG data, such as the ones presented in References [12,13,14,15,16]. Since our model uses 2-D images with a CNN, we need to convert the ECG signal from one-dimension (1-D) to a (two-dimensional) 2-D image at this preprocessing layer. This is achieved using Python by plotting the ECG signal between every two consecutive R-peaks, and saving it as an image. Layer 3 takes these images as input to our proposed 2-D CNN, trains the network with automated feature engineering and classifies the ECG image into three classes representing either “Normal”, “ST-change”, or “V-change”. The proposed 2-D CNN model is discussed in detail in Section 5.4.
1.4. Motivation
Ever since the COVID-19 pandemic has started, it has not only flooded the hospitals with patients and limited the number of intakes, but has also changed the way treatment is provided. Patients, now, have to make an appointment, wait in the parking lot for the room to be available and sanitized, and confront limited availability of physicians. This has introduced another layer of hurdle in the early diagnosis and treatment of cardiac conditions. The rapid rise of COVID-19 has intrigued many researchers to perform research in this area and develop real-time continuous monitoring systems that can identify these cardiac conditions at the user’s residence. This motivated us towards this study as a contribution to the ongoing research of real-time ECG analysis and classification.
In the recent years, numerous methods and techniques have been developed for real-time monitoring systems, but these are evaluated with ECG data recorded with multiple leads [17,18,19], available on public databases such as MIT-BIH (MITDB) [20]. Real-time monitoring systems heavily depend on portable and wearable devices such as body-attached sensors, patches, smartwatches and smartphones. Such sensors and devices usually record and acquire the ECG data with a single lead to improve user experience, convenience, and acceptance. This is our second motivation to perform this study to analyze ECG data recorded with a single lead for real-time monitoring. We have used the single-lead ECG data provided by the ESCDB database to evaluate our method and to support the reliability and accuracy of real-time diagnosis, detection, and monitoring.
Most advanced machine learning techniques have analyzed ECG data in one-dimension (1-D) to classify different arrhythmia types. However, their models generally employ many layers in the form of a neural network or CNN structure. The computational complexity of such structures is discussed later in Section 7. It is seen that complexity grows with more layers in the CNN structure. Complex designs and systems do not perform at fairly high and acceptable accuracy levels. CNN and deep learning are known best for computer vision and image classification. It is worth exploring the smart and automated feature engineering capability of a CNN to learn ECG fiducial points and classify based on supervised learning. This motivated us even further to perform this study by taking the 1-D ECG signal and converting it into a two-dimensional (2-D) image to train and evaluate our proposed 2-D CNN model and classify ECG into three classes.
2. Key Contributions
This study aims to contribute to the growing area of research in ECG analysis and detection of different arrhythmia types in real-time to prevent various cardiac conditions and to improve telehealth practices. In this paper, a less complex CNN structure is proposed that can be feasible for real-time ECG monitoring, particularly useful for detecting the onset of a heart attack, with extensive experiments and analysis performed on the ESCDB database. Our contributions to this area of research can be summarized as follows:
- Present an overview of ECG and its significance in detecting different arrhythmia types and cardiac conditions.
- Present a layer-based model for ECG analysis including acquisition, preprocessing and classification processes and summarize the components.
- Present an optimized CNN network based on a global averaging technique to improve the classification accuracy significantly.
- Present a detailed literature review of ECG analysis and classification algorithms using traditional and machine learning approaches for both offline simulations and real-time systems.
- Discuss and present the proposed CNN architecture and summarize its components and parameters for our simulation results.
- Present detailed results for three simulation experiments performed using our proposed model and its comparison with related work in this area.
- Present a hardware implementation of our proposed model in accordance with the three-layer ECG analysis process.
- Discuss ECG classification and outline applications for real-time monitoring systems, including portable and wearable devices and ECG sensor networks for the adaptation of our proposed model.
3. Paper Organization
This paper is organized as follows—in Section 4, the detailed literature and related work is presented for this paper. This section is further divided into two sections. In Section 4.1, we provide detailed related work of traditional approaches for ECG classification. Section 4.2 describes the related work of machine learning approaches for ECG classification. The proposed model is explained in Section 5 with four subsections, discussing ECG acquisition and preprocessing in Section 5.1 and Section 5.2, respectively. Dataset preparation for the experiments is described in Section 5.3, and the architecture of the proposed CNN model is explained in Section 5.4. In Section 6, we provide details of the experiments performed in this study, followed by four subsections that present details of four experiments. Section 6.1, Section 6.2 and Section 6.3 present details of the first, second, and third experiments, including results and graphs, respectively. In Section 6.4, we present a real-time monitoring system of our proposed model using hardware implementation. In Section 7, results of the experiments are discussed, and performance evaluations are presented. Research tools and applications of our proposed model are presented in Section 7.1. Section 8 concludes this paper and provides insights for future directions.
4. Related Work
Typically, an output of a system is based on a function applied to the input. Traditional algorithms work in such scenarios where outputs are generated by applying predefined rules or functions to the inputs. These rules or functions remain the same. Traditional algorithms require manual observation and optimization to achieve the desired results. Whereas machine learning algorithms generate the output, optimize the underlying function and then regenerate the output that is close to the expected output in an automated fashion. Both traditional and machine learning algorithms have applications towards clinical diagnosis. We present related work in this section that have used these methods to analyze the ECG signal for the detection and classification of its different arrhythmia types. Traditional approaches of ECG analysis generally refer to conventional signal processing techniques that employ various filters and time and/or frequency domain transforms. This is while machine learning based ECG analysis techniques are relatively newer compared to traditional approaches. These techniques involve machine intelligence to learn the trend of data and make predictions.
ECG analysis and classification rely upon proper identification of fiducial points such as the ST-segment and QRS-complex. The process of fiducial points detection is called Feature Engineering (FE). Traditionally FE is performed by manually observing the ECG graph by a doctor, which results in a diagnosis. In the recent development of modern technology with real-time monitoring systems, fiducial points such as the QRS complex and arrhythmia detection is now an automated FE process performed by mathematical techniques such as the Tompkins Wavelet Transform (WT) [21,22], machine learning techniques such as CNN [23], and arrhythmia detectors by Long-Short Term Memory (LSTM) [24] evaluated with data acquired by sensors. Fiducial points detection methods that are evaluated with the ESCDB dataset include thresholding and windowing techniques [25,26], time-domain techniques [27,28,29] for ST-segment detection, and position-based QRS detectors [30]. Other methods include WT [31,32,33], Discrete Wavelet Transforms (DWT) [34,35,36,37], Windowing Algorithms [38] and Finite Impulse Response (FIR)-based adaptive filters [39].
However, our proposed 2-D CNN model eliminates the need of FE as it learns these features on the fly during the training cycle with convolutions and feature maps. Therefore, we find it unnecessary to report performance metrics for the FE methods discussed above. One can refer to Reference [2], a recent survey paper on ECG signal analysis, for further review of these FE methods and their performances reported in the literature. In this study, we glance at traditional and machine learning approaches for classification of ECG into different arrhythmia types and detection of ST-segment changes and ischemia (i.e., MI). Furthermore, a comparison is provided between our proposed approach and others.
4.1. Traditional Approaches
Ischemia detection by analyzing the ST-segment deviation using Isoelectric Energy Function (IEF) was introduced in Reference [40] and has been evaluated on the ESCDB database. In Reference [41], the authors presented a method that uses the Pan-Tompkins algorithm to detect the ST-segment deviations with a success rate of 97.03% and error of 2.97% on the ESCDB database. ST deviation (elevation or depression) based classification of arrhythmia into normal and abnormal classes was presented by Reference [42] and achieved a sensitivity of 98.2%, and 97.17% positive predictive value (ppv) when evaluated with the ESCDB database. A Time-frequency based approach to classify MI was proposed by Reference [43] and achieved 94.23% accuracy, 95.72% sensitivity and 98.15% specificity when evaluated with the ESCDB database. Another ischemic beat classification with Genetic Algorithm (GA) and Multicriteria Decision Analysis (MDA) was presented by Reference [44] and achieved 91% for both sensitivity and specificity. A rule-based method to classify ST morphology into normal and abnormal was introduced in Reference [38] and achieved 90.1% accuracy and 98.9% sensitivity when evaluated with ESCDB. Another method has been introduced by Reference [45] to detect ischemia based on statistical features of the ST-segment deviation and performed classification of normal and abnormal beats with 97.71% sensitivity and 96.89% ppv on the ESCDB database.
4.2. Machine Learning Approaches
Using machine learning techniques, the authors of Reference [46] have proposed employing Decision Trees (DT) and Random Under Sampling (RUS) boosting-based techniques to detect the ST-segment and T-wave anomalies in ECG from the same ESCDB database with a sensitivity of 86%. In Reference [36], ST-deviation is detected by an ensemble classifier-based backpropagation neural network. The deviation is obtained by subtracting the detected ST-segment from the isoelectric level of its beat. They have achieved sensitivity of 90.75%. The basic Support Vector Machine (SVM) is a kind of administered learning model, which is generally known as a binary classifier and groups information into two classes using isolating hyperplanes. SVM was proposed by Vapnik, an algorithm that extracts a function to classify unknown data [47] and mainly separates data into two classes based on supervised learning. This makes SVM a strong classifier candidate for application towards ECG signal classification into two classes of normal and abnormal [48]. There are variations of SVM such as a Multiclass Support Vector Machine (MSVM) and Complex Support Vector Machine (CSVM) that can be used to classify ECG arrhythmia types into multiple classes, as presented by Reference [49]. In Reference [35], the authors have detected the ST-segment episodes and changes and have classified arrhythmia into six classes using SVM. The Rule-Based Decision Tree (RBDT) approach to classify ischemic and arrhythmic beats into normal and abnormal was introduced as a fuzzy expert system by the authors of Reference [50]. Rules are derived based on the ST-segment value depending on the time between the R-peak and the start of the ST-segment slope. In Reference [51], the authors have used an ensemble learning technique called Adaptive Boosting (AdaBoost) also known as meta-learning, used to enhance binary classification efficiency in detecting abnormal beats from the ECG signal and have evaluated on three databases of MITDB, QT [52], and ESCDB. Studies have shown that Artificial Neural Networks (ANN) are powerful data analysis tools. Analysis of ECG with an ANN-based approach to detect ischemic episodes was presented by Reference [53]. In Reference [54], the authors presented a Multi-Module Neural Network System (MMNNS) to classify S and V heartbeats evaluated on the MITBIH and ESCDB databases. A Densely connected CNN (DenseNet) based classifier which classifies four ECG patterns was presented by Reference [55] and evaluated on two databases, including the ESCDB database. Classification of ST-segment into normal, depressed, and elevated levels using multiple features extracted with the Random Forest (RF) technique was achieved in Reference [56] with 86.9% accuracy, 85.18% sensitivity (ST normal), 87.35% sensitivity (ST depressed), and 88.06% sensitivity (ST elevated) on the ESCDB database. CNN is best known for computer vision applications and works great in image classification. Two dimensional (2-D) CNN model to classify arrhythmia types using ECG signal as a converted image has been presented by References [57,58,59] and evaluated on the MITBIH database.
5. Proposed Model
Our proposed model works in four steps as follows:
- ECG data acquisition, which is explained in Section 5.1
- Preprocessing of the acquired data for the denoising process and conversion of 1-D ECG signal to 2-D image, explained in Section 5.2
- Data is organized into multiple datasets. Description of this procedure is explained in Section 5.3. The organized datasets are used to train the proposed CNN architecture to perform multiple experiments described in Section 6.
- A 2-D CNN model is trained on the organized datasets. Explanations are provided in Section 5.4.
Each of these steps of the proposed model are further explained in their respective sections.
5.1. Data Acquisition
Automatic detection and classification of cardiac conditions such as ischemia and MI with advanced machine learning techniques requires evaluation of these methods, techniques and algorithms for better accuracy to avoid false positives and false negatives. For research and evaluation purposes, clinically pre-recorded ECG signals are publicly available to evaluate the efficiency and performance of these methods. In this study, we have used the ESCDB available on Physionet data bank website https://www.physionet.org. This database contains ECG waveforms recorded by a Holter Machine with recordings of 2 h per patients and includes 70 males and 8 females, aged 30 to 84 years old. Each patient was suspected of myocardial ischemia as diagnosed. Each annotated recording contains ECG data collected with two ambulatory chest leads; Lead 3 (L3) and Lead 5 (L5); sampled with 250 Hz as the sampling frequency, and 5 V as the amplitude of the smallest step (precision) measured in voltage. The annotations provide the beat type, gender, age, clinical outcome, imbalance in electrolytes, and a summary of its pathology. This database was coordinated by the Institute of Clinical Physiology of the National Research Council (Pisa, Italy) and the Thoraxcenter of Erasmus University (Rotterdam, Netherlands). While this database provides annotations per beat, it is found to have nonischemic ST-segment changes due to drifts in the ST-segment deviation level or postural changes leading to false positives. On the other hand, it may contain beats detected as ischemic but with no ST-T change in nature, leading to false negatives. Finally, the definition of ischemia has been updated since this database has been posted. Examples of the ECG waveforms of Lead 3 and Lead 5 from the ESCDB database are shown in Figure 4.
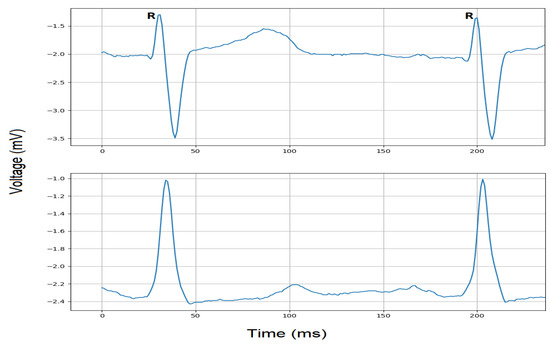
Figure 4.
ECG signals within R-R interval extracted from Lead 3 (top) and Lead 5 (bottom).
5.2. Preprocessing
In real-time ECG monitoring, once the ECG signal is acquired at Layer 1 of the ECG signal analysis process, it is sent to a coordinator at Layer 2 for further processing. This coordinator can be a Personal Digital Assistant (PDA), smart App on a smartphone, or a microcontroller device that processes this ECG data. The second layer is mainly responsible for cleaning (denoising) the ECG signal and the detection of R-peaks so that the ECG wave can be captured between two consecutive R-peaks called R-R interval and transformed into a 2-D image for classification with our 2-D CNN model at Layer 3.
The running ECG signal is first cleaned from any noise sources (such as internal/embedded or external noise) that may have been introduced by sensors or location at the time of acquisition. There are many methods available to denoise the ECG signal such as State Space Recursive Least Square (SSRLS) adaptive filter [13], Adaptive Notch Filter (ANF) [14] and Fast Fourier Transform (FFT) [15]. However, for removing Gaussian noise, impulse noise or salt and pepper noise from 1-D signals and/or 2-D images, linear filters such as the average and weighted filters can be used. Weighted filters can reduce high frequency components, but sharp details in the signal or image may be lost [60]. As this study proposes a method for real-time systems, the acquired ECG signal may be contaminated with power-line, power supply or radio signal noise. Therefore, we have used a rather simple and less complex average window filter for denoising such noise sources [61]. A moving average window filter takes the average of the neighboring values while moving along the ECG signal. The number of neighboring values becomes the window size of the filter. It removes fluctuations and smooths out the noise by working as a low pass filter. After many iterations, the optimized window size of 5 () has been found to provide the optimum trade-off between greater amount of noise reduction and loss of signal details such as compromising the signal shape and/or morphology of the fiducial points [60] to produce a clean ECG signal. This denoising filter process is applied in real-time on the running ECG signal regardless of the position of the R-peaks and the other fiducial points, and is performed before transforming the 1-D ECG signal into a 2-D image representation. The moving average filter can be mathematically defined by Equation (1).
As the cleaned ECG signal between every two consecutive R-peaks is converted to a 2-D image in this preprocessing layer, the R-peaks should be detected accurately after denoising and before signal to image conversion. There are methods such as Discrete Wavelet Transform (DWT) [62], Windowing Algorithm [63], Empirical Mode Decomposition (EMD) based RR detector algorithm [64] and selective decomposition [65] for R-peak detection in real-time monitoring systems. A complete cycle of the ECG can be detected based on discrete data presented in Reference [66]. Adaptive thresholding and local maximums with search-back mechanisms can be used effectively to detect the R-peaks. However, for the purpose of simulation, we have used the R-peak annotations on the pre-recorded ECG signals. Using Python 3.7 IDE, the “rdsamp” function of the WaveForm-DataBase (WFDB) package reads the record file that contains the cleaned ECG signal and uses the starting and ending sample numbers to plot the ECG signal in a two dimensional image. These starting and ending sample numbers are the sample numbers of two consecutive R-peaks and are provided to “rdsamp” function for each R-R interval to generate the image containing one complete cycle of the ECG wave.
Figure 5 depicts an example of a noisy and cleaned Lead 3 signal after the moving average denoising filter is applied. It can be observed that the quality of the signal has improved without compromising the characteristics of the ECG wave. The extracted cleaned ECG wave between every two consecutive R-peaks is then converted into a 2-D image using the Python code and sent to Layer 3 for classification into one of the three classes. The conversion of 1-D ECG signal to 2-D ECG image can be assumed as a snapshot (screenshot) taken between every two consecutive R-peaks and stored as an image whose pixel intensity values, throughout the image, altogether compose the shape of the ECG wave.
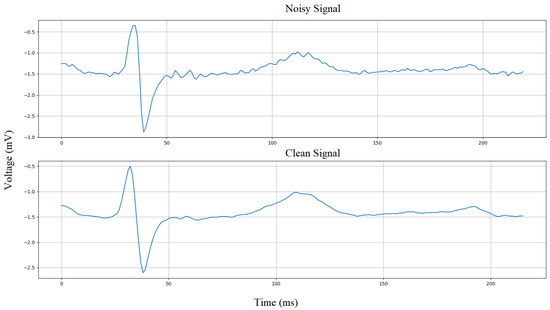
Figure 5.
Average filter denoising.
5.3. Dataset Preparation
Initially, we have selected thirty records from the ESCDB database, which are grouped into four collections. We have then selected images (ECG data between two consecutive R-peaks converted to 2-D image) from each collection and created four datasets, which we have used in our experiments. These thirty records are organized in collections as follows. The first collection has fifteen records and consists of ECG signals recorded with Lead 3. The second collection has six records containing ECG signals recorded with Lead 5. The third collection has six records containing ECG signals recorded with Lead 3. The fourth collection has nine records containing ECG signals recorded with Lead 3.
Three datasets are created for intra-patient analysis [67] using collection 1, 2, and 3 named Dataset1 (DS1), Dataset2 (DS2), and Dataset3.1 (DS3.1). Additionally, Dataset3.2 (DS3.2) is created for inter-patient analysis [68,69], as follows. In the intra-patient division scheme, data extracted from one patient may appear in both training and test sets of the machine/deep learning model. Whereas, in the inter-patient division scheme, data derived from one patient appears in only one set; either training or test set of the machine/deep learning model. DS1 consists of a total of 600 images, 300 images per class taken from the first collection. DS2 contains a total of 600 images, 300 images per class taken from the second collection. DS3.1 has a total of 900 images, 300 images per class taken from the third collection, and DS3.2 also has a total of 900 images, 300 images per class taken from fourth collection. However, as DS3.2 is created for inter-patient analysis [67,68,69,70,71,72], it is further grouped into two datasets, DS3.2 TrainingSet containing 200 images from six records for training the classifier and DS3.2 TestingSet contains 100 images from three records for validation of the classifier. These images are the ECG waves within two consecutive R-peaks processed at Layer 2 of our proposed three-layer ECG signal analysis process shown in Figure 3. Table 1 shows these database collections and dataset selection. The record numbers and the number of images are also presented.

Table 1.
Database collection and dataset selection.
5.4. CNN Architecture
A CNN-based model typically consists of an input layer, CNN kernel layers also known as filters or feature maps, pooling layers, a fully connected layer and an output layer. The size of each layer depends on the problem and its optimization defines the efficiency of the model [73]. We present a 2-D CNN based classifier model that performs the automated feature engineering and learns the fiducial points with global averaging presented at the feature map level of the CNN. The proposed method, integrates the feature engineering and classification capabilities as compared to traditional approaches that requires pre-extracted features. This minimizes the complexity, time, and overhead of the diagnosis process. The CNN model consists of 7 layers as shown in Figure 6 and uses the Adaptive Moment (ADAM) method for backpropagation [74]. ADAM is a stochastic optimizer and updates weights based on value and gradient only. It calculates the gradients for weights optimization during the 2-D CNN training. ADAM works great with CNN and its other variations as it combines the advantages of Adaptive Gradient (AdaGrad) and Root Mean Square Propagation (RMSProp).
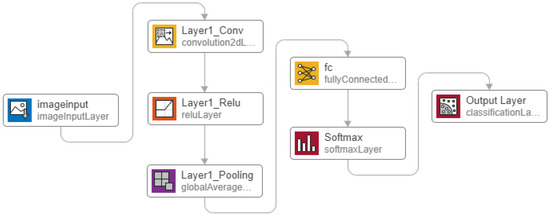
Figure 6.
Proposed 2-D Convolutional Neural Network (CNN) architecture.
The proposed CNN architecture takes image as the input with the optimized size of 28 × 28 pixels. This size has been found after several trials and iterations. The size of the 2-D image need not be zero-padded to the duration of the longest R-R interval. Therefore, the ECG data between two consecutive R-peaks of a long R-R interval (e.g., corresponding to bradycardia), is transformed to an image with the fixed size of 28 × 28 pixels, similarly as in the case of an ECG with shorter R-R intervals. However, the ECG morphologies would appear more condensed or spread out. Thus, after the training process, the system will learn to differentiate such ECG images from normal ones or other classes. It is important to note that larger image sizes require more number of neurons and makes the system computationally ineffective. This in turn puts more computational burden during the training process. The “augmentedImageDatastore” function of Matlab is used to covert the input image into 28 × 28 pixels.
Convolution with the optimized kernel size of 5 × 5 is applied to the image, and generates four feature maps. These feature maps get rectified by the Rectified Linear Unit (ReLU) activation function expressed in Equation (2). ReLU rectifies the gradient vanishing problem and is less complex as compared to TanH and Sigmoid functions [75]. The rectified feature maps go through the pooling layer. We have used global average pooling that is known for object localization. This layer generates the average value per output class which becomes a regression problem for the next layer of the fully connected network. The fully connected layer’s output is normalized to a probability distribution by the Softmax activation function (calculated by Equation (3)). Softmax generates predicted output values between 0 and 1 for each class.
During the training process, the amount that the weights are updated is referred to as the step size or the learning rate. The learning rate is, specifically, a configurable hyper-parameter used in the training of neural networks. The Loss Function or error is another important component of neural networks and points to the prediction error of a neural network. The method to calculate the loss is called Loss Function. It is also referred to as the cost function as a measure of error between the value the model predicts and the actual value. In a neural network, the cost (loss) function is generally minimized and the gradient of the loss with respect to the weight parameters are updated in several iterations to converge to a final validation loss (error). In in this work, the predicted and labeled values are used to calculate the error using the cross-entropy (loss) function expressed by Equation (4). The backpropagation process then optimizes the weights to minimize the error by calculating the gradients and updating the weights with the ADAM resolver algorithm, as shown in Algorithm 1.
| Algorithm 1: Adaptive Moment ADAM |
| - — — — — — — — |
The details of the proposed architecture including CNN and its parameters, are summarized in Table 2. By designing a CNN with the structure of Figure 6 and the listed parameters in Table 2, the proposed 2-D CNN ECG classification idea of this paper can be reconstructed and the results presented in Section 6 can be reproduced.
where P is the probability of each class, N is the total number of classes, and x is the calculated output after forward pass.
Table 2.
CNN Structure and Parameter Details.
The details of the ADAM algorithm and how the weights are updated during the training process of a CNN architecture, is expressed below.
6. Results
We performed three experiments based on simulations with variants of the CNN architecture based on our proposed 2-D CNN classifier. In this section, we present the results of each experiment, including the classified output for each class, accuracy, and loss graph. The performance metrics are discussed in Section 7. Each of these experiments uses a Matlab augmented function to convert the ECG data between every two consecutive R-peaks into a 28 × 28 pixel, gray-scaled image as an input to the 2-D CNN from its appropriate dataset. Datasets DS1, DS2, and DS3.1 are based on the intra-patient division scheme and are further split into 70/30 training and testing sets with labels for training and validation of the CNN algorithm. The “splitEachLabel” function in Matlab is used that takes a ratio (0.7 in our case) as an argument and creates two separate image datasets, one for training and the other for testing for DS1, DS2 and DS3.1. Dataset DS3.2 is based on the inter-patient division scheme and is split into training set (DS3.2 TrainingSet) and testing set (DS3.2 TestingSet) with a ratio close to 70/30 (approximately 66.6/33.3). Records used to construct the DS3.2 TrainingSet are different from the records used for the DS3.2 TestingSet (as shown in Table 1), making both sets an independent collection of records. The training options and 2-D CNN parameters are shown in Table 2.
6.1. First Experiment
The first experiment classifies the ECG signal into two classes: Normal and Abnormal. This experiment uses dataset DS1 containing a total of 600 images from our database collection 1 as shown in Table 1. The 2-D CNN architecture/network shown in Figure 6 is trained on the training set derived from DS1. Validation is performed using the testing set, and Figure 7 shows the output of the forward pass of an ECG image classified as Normal or Abnormal after the validation is completed. Figure 8 shows the accuracy graph, and Figure 9 shows the loss function for the training progress.
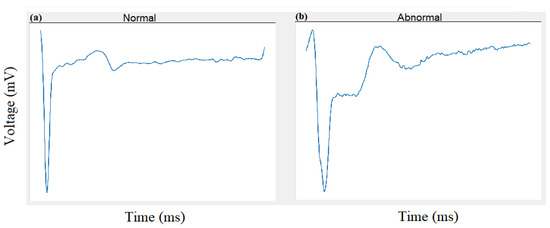
Figure 7.
Experiment 1: Classification of Normal (a) and Abnormal (b) beats using 2-D CNN.
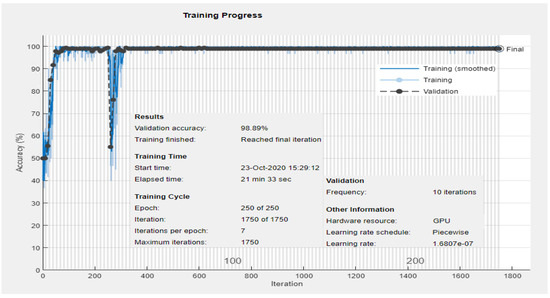
Figure 8.
Experiment 1: Training and validation accuracy progress for two classes: Normal and Abnormal using DS1.
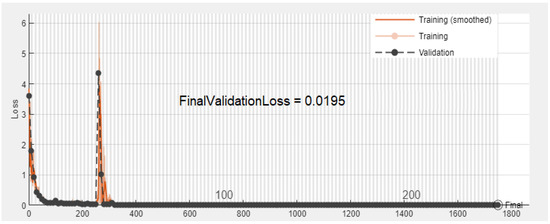
Figure 9.
Experiment 1: Validation error convergence progress for two classes: Normal and Abnormal using DS1.
6.2. Second Experiment
The second variant of the CNN architecture performs the second experiment to classify the ECG signal images into two classes of Normal and Abnormal using dataset DS2 from our database collection 2, shown in Table 1. DS2 has a total of 600 images recorded with Lead 5 and is further split into training and testing sets and to train and validate the proposed network. Validation yields classification results shown in Figure 10.
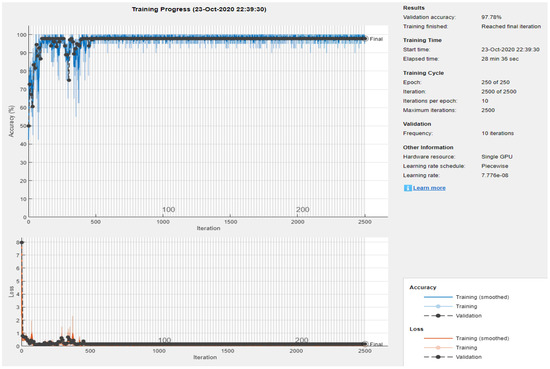
Figure 10.
Experiment 2: Training and validation accuracy progress for two classes: Normal and Abnormal using DS2.
6.3. Third Experiment
The third experiment is performed for both intra-patient and inter-patient classification of the ECG signal into three classes: Normal (N), Ischemic beat (ST-change), and V-change using datasets DS3.1 and DS3.2 from our database collection 3 and 4 respectively, shown in Table 1. DS3.1 contains a total of 900 images, and our proposed 2-D CNN is trained on the training set from DS3.1. Figure 11 shows the classification results of three images classified as Normal, ST-change, and V-change based on the intra-patient division scheme. Figure 12 and Figure 13 show the accuracy and loss progress graphs, respectively. We have repeated the third experiment and used DS3.2 to classify ECG signal into the three classes for the inter-patient scheme. Figure 14 shows the classification results of three images classified as Normal, ST-change, and V-change based on inter-patient scheme. The accuracy and loss progress graphs for the inter-patient scheme using DS3.2 are shown in Figure 15.

Figure 11.
Experiment 3 Intra-patient scheme using DS3.1: Classification of Normal (a), ST-Change (b), and V-change (c) beats using 2-D CNN.
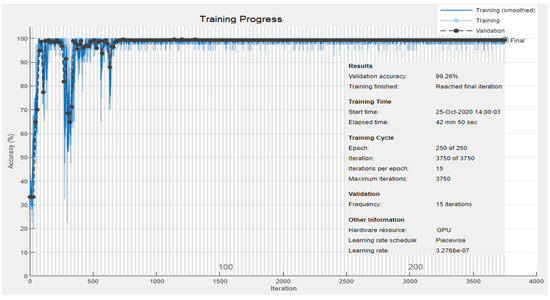
Figure 12.
Experiment 3 Intra-patient scheme using DS3.1: Training and validation accuracy progress for three classes: Normal, ST-change, and V-change.
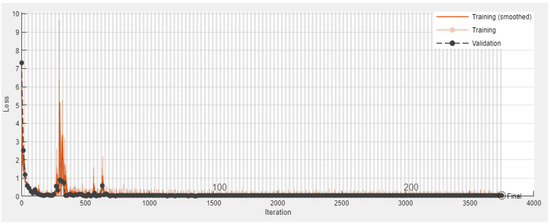
Figure 13.
Experiment 3 Intra-patient scheme using DS3.1: Validation error convergence progress for three classes: Normal, ST-change, and V-change.
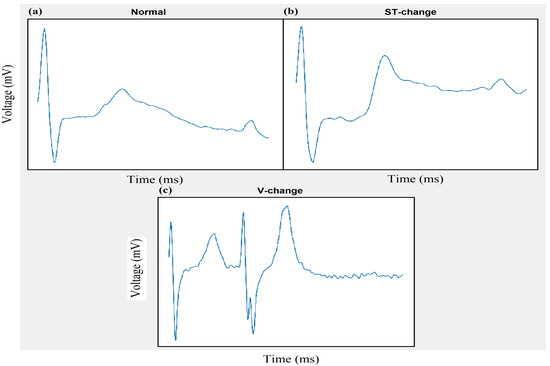
Figure 14.
Experiment 3 Inter-patient scheme using DS3.2: Classification of Normal (a), ST-Change (b), and V-change (c) beats using 2-D CNN.

Figure 15.
Experiment 3 Inter-patient scheme using DS3.2: Training and validation accuracy and error progress for three classes: Normal, ST-change, and V-change.
6.4. Fourth Experiment
We have also performed a fourth experiment with hardware implementation, illustrated in Figure 16. This experiment follows the process of our proposed three-layer ECG signal analysis model presented in Figure 3 of Section 1.3. At Layer 1, ECG data is acquired with the AD8232 (Analog Devices, Inc., Norwood, MA, USA) ECG measurement board, that is directly attached to an Arduino mega 2560 with wires. AD8232 is an analog single lead, low-power integrated frond-end heart monitor that is used for a variety of vital signs monitoring applications. It is a 3-pin lightweight portable sensor from Analog Devices that operates on 3.3V DC voltage and gives an analog output. Other sensors such as Zio Patch [76] and Shimmer [77], a Bluetooth (BT)-based wireless sensor, can also be used to acquire ECG. At Layer 2, the coordinator Arduino mega microcontroller device receives the data for preprocessing. The ECG signal is sent to the smartphone for graphical representation using the IEEE802.15.1 Bluetooth protocol and displayed with a smartphone app designed in the open source visual studio code IDE. The smart app is programmed in Javascript using the “react” library and “react-native” framework. However, wireless IEEE802.11x and Zigbee IEEE802.15.4 [78] protocols can also be used to send the data from the controller to the smartphone app. The coordinator then sends the preprocessed data to Layer 3 at a central location in the form of images using the IEEE802.11x based wireless connection for classification using our trained 2-D CNN algorithm running on Amazon Web Services (AWS) cloud. These images occupy bandwidth when traveling over networks such as wireless or Global System for Mobile Communication (GSM). Bandwidth requirements can cause latency and become a hurdle in a successful data transfer process. Data compression can overcome this problem by compressing the data to reduce the overall packet size during the transfer. The data is not compressed between the coordinator and Layer 2 in this experiment for the purpose of simplicity. However, lossless compression techniques such as Quad Level Vector (QLV) [79,80] and Huffman coding are available to address the bandwidth requirements. The purpose of the fourth experiment is to show that our proposed architecture can be adopted for real-time monitoring systems using portable and wearable devices.
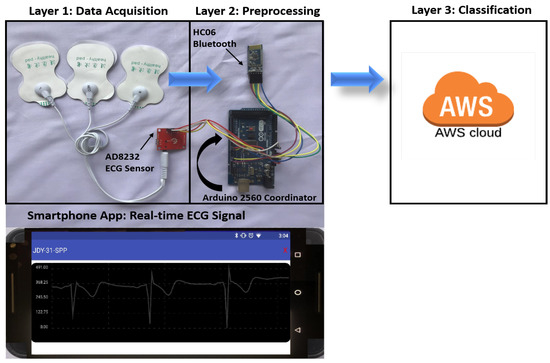
Figure 16.
Real-time ECG signal analysis and classification.
7. Discussion
We performed multiple experiments (Exp), and in the first three simulation experiments, preprocessing was repeated to create augmented images in gray-scale with the size of 28 × 28 pixels. Images were shuffled every epoch during the training for each simulation experiment to achieve better training. Table 3 shows the optimized parameters used during the training process for the simulation experiments. The Validation Frequency is calculated from Equation (5).
Table 3.
Training Parameter Details.
Observing the results of Figure 12 yields that our method of 2-D CNN has achieved the best accuracy of 99.26% in detecting three classes of Normal, ST-change, and V-change with the intra-patient scheme. Our method in the second experiment has also improved the classification accuracy shown in Figure 10 when identifying two classes of Normal and Abnormal, as compared to other methods which attempted to classify ECG signal into Normal and Abnormal classes. It can be concluded that our proposed method of 2-D CNN has outperformed other machine learning and traditional methods when tested with ESCDB. Following the notion that intra-patient division may result in a biased system [70], inter-patient division is thus, recommended for cases where the classification module will be applied on new patient data [67,68,69,70,71,72]. Figure 14 shows the results of a preliminary experiment performed for the inter-patient scheme, and is yet to be explored as future work for adaptation in real-time monitoring systems.
We achieved better results with less number of layers in the CNN network structure; thereby yielding much less complexity. The complexity of a CNN can be calculated in the form of Big O notations [81], expressed by Equation (6).
where d is the number of convolutional layers, denotes the filter’s width in a given layer and and are the sizes of the filter and output feature map, respectively.
Table 4 shows the reported performance metrics including F1-score (f1), success-rate and positive predictive value (ppv) of the related work in comparison with our study. We have calculated the accuracy (acc), sensitivity (sen), and specificity (spe) performance metrics based on the True Positives (TP), True Negatives (TN), False Positives (FP) and False Negative (FN) values, using Equations (7)–(9), respectively, to evaluate our method. These metrics are summarized in Table 5 and are additionally shown in the confusion matrices of Figure 17 for our simulation experiments.
Table 4.
Comparison of traditional and machine learning approaches for ECG classification.
Table 5.
Performance results of experiments.
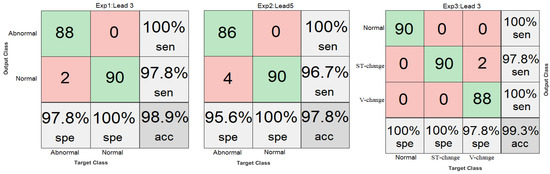
Figure 17.
Confusion Matrices.
7.1 Research Tools and Applications
There are PC-based and hardware-based tools available to test and evaluate our model. As for PC-based tools, we used Matlab for our simulation experiments, as well as for designing, training and evaluation of our proposed 2-D CNN model. Other PC-based tools such as Python and Labview provide libraries that can be used in simulations. We used Python for database analysis and dataset preprocessing. On the other hand, the “R” tool provides a more robust view of analyzing datasets. System dynamics modeling can also be used to evaluate the effectiveness of our model for health monitoring tools, in general, in a broader societal perspective [82,83]. As for hardware-based tools, we used the ECG sensor AD8232, and coordinator Arduino Mega 2560 for our fourth hardware experiment presented in Section 6.4, and shown in Figure 16. ECG sensors with clips, cup electrodes or patches can be used with our proposed model for ECG acquisition. Other hardware tools such as System on Module (SoM), System on Chip (SoC), emulator boards such as AM335X and NXP Nexperia 8550 can be used in addition to other Open Source HardWare (OSHW)-based emulators such as Arduino, ADuCM361 and Duino Olimexino, to analyze and classify ECG with our proposed 2-D CNN classifier and three-layer process architecture. However, the implementation of real-time ECG monitoring systems will introduce some difficulties in the daily workflow of clinicians, especially when many patients are referred to the clinic with suspected pathology. Cloud servers should be restructured effectively to aid prioritizing the notifications sent to clinicians and patients. In addition, legal issues, regulatory standards and security, privacy and confidentiality protocols play vastly important roles here as well. Particularly, the systems should be highly accurate in ECG acquisition, processing and analysis so that suspected pathology is not missed to reduce the warning threshold for the owner (user) of the monitoring device (e.g., smartwatch). The devised ECG algorithms implemented on these systems should be, therefore, able to reduce the false negatives to as low as possible to avoid missing suspected cardiac rhythms. Clinical trials of such devised systems can be further investigated for their performance, but are beyond the scope of this paper.
The applications of the proposed model presented in this study are not limited to ECG analysis but rather have a wide range of applications including the telehealth and the electronics industry. Besides diagnosis of cardiac conditions in real-time for adults, it can also be used to monitor fetus ECG and detect abnormalities. A method in Reference [84] shows how to achieve a cleaned ECG signal of the fetus. Our proposed method is scalable and can be implemented on microcontroller-based devices such as TI MSP430 and TMS320-6713 that can later be adopted and used in portable simulators such as Fluke Prosim and TriSmed TSM3000B for research purposes. Our method can further be implemented and integrated within smart devices such as smartwatches and smartphones for real-time monitoring and diagnosis. This method can also be implemented in electronic circuits to monitor sinusoidal signals and detect abnormalities such as noise interference or intruder information tapping in the signal. Electronic signatures are usually an image of a person’s handwritten signature. These electronic signatures can be validated using our proposed method once trained on the signatures dataset.
8. Conclusions and Future Work
ECG monitoring is vital to diagnose any abnormality in the heart. Early detection and treatment of ischemia and MI can save lives. ST-segment changes are early signs of a heart attack and are classified with better accuracy with our proposed method. Initial and timely diagnosis of cardiovascular diseases can drive the acceptance of a solution and plays an essential role in a patient’s health status during an active cardiac condition. This study showed that we had improved the diagnosis time by presenting a less complicated system for real-time monitoring performed with both simulation-based experiments (Experiments 1–3) and a hardware-based experiment (Experiment 4). We have introduced a three-layer process to analyze and classify ECG in both simulations and in real-time as presented in Experiment 1 for Normal and Abnormal classes. We have proposed a 2-D image-based CNN classifier that classifies three classes including ST-changes. We have presented detailed literature reported on ECG classification based on both traditional and machine learning techniques and compared their performance evaluation metrics with those that are achieved with our approach. Multiple experiments were performed to evaluate our model and the best accuracy of 99.26% with an error of 0.0371 was achieved with the intra-patient division scheme and the accuracy of 87.33% with an error of 0.2647 was achieved with the inter-patient division scheme when evaluated on the ESCDB database. We presented the research tools used in this study and shed light on other PC-based and hardware-based tools available for the research community to further explore and improve ECG classification. We presented real-life applications in the health industry, electronics industry and others that our proposed model can be used for. The need for feature engineering has been eliminated with our approach since CNN learns features automatically during the training process. Our proposed method has much less complexity as compared to others in this area of research, making our model feasible to be implemented in real-time monitoring systems.
As a future direction, we plan to evaluate our model with multiple databases using the inter-patient division scheme and classify more arrhythmia types such as fusion and other unknown beats. In addition, we plan to collect new images of ECG and create a dataset of our own to reflect real-life scenarios, and further, evaluate our method on a real-time system presented in this study. Moreover, we plan to convert the trained network from Matlab to C-code to implement in microcontroller-based systems and to test it for a portable and wearable device to perform real-time monitoring and classification. Furthermore, we plan to develop an application, integrated with a microcontroller-based system, to monitor the health of a person’s heart.
Author Contributions
Supervision, K.E., A.A., M.F. and O.A.; Writing—original draft preparation, M.W.; Writing—review and editing, K.E. and M.F.; Conceptualization, M.W., K.E. and A.A.; Methodology, M.W., M.F. and O.A.; Software, M.W. and O.A.; Validation, K.E., A.A, M.F. and O.A.; Formal Analysis, M.W., M.F. and O.A.; Investigation, K.E., A.A., M.F. and O.A.; Resources, K.E., A.A., M.F. and O.A.; Data Curation, M.W.; Visualization, M.W., K.E. and M.F.; and Project Administration K.E., A.A., M.F. and O.A. All authors have read and agreed to the published version of the manuscript.
Funding
This research was funded in part by the UB Partners CT Next Innovation Grant 2019–2020. Also, the authors acknowledge funds received from the University of Bridgeport to buy equipment to support this research.
Data Availability Statement
Publicly available datasets were analyzed in this study. This data can be found here: https://physionet.org/content/edb.
Conflicts of Interest
The authors declare no conflict of interest.
Abbreviations
The following abbreviations are used in this manuscript:
| Abbreviation | Full form |
| 1-D | One Dimensional |
| 2-D | Two Dimensional |
| AAMI | Association for the Advancement of Medical Instrumentation |
| Accuracy | |
| AdaBoost | Adaptive Boosting |
| AdaGrad | Adaptive Gradient |
| ADAM | Adaptive Moment |
| AF | Atrial Fibrillation |
| ANF | Adaptive Notch Filter |
| ANN | Artificial Neural Network |
| AWS | Amazon Web Services |
| CHD | Coronary Heart Disease |
| CNN | Convolutional Neural Network |
| CSVM | Complex Support Vector Machine |
| CVD | Cardiovascular Disease |
| DenseNet | Densely connected CNN |
| DS1 | Dataset1 |
| DS2 | Dataset2 |
| DS3.1 & DS3.2 | Dataset3 |
| DT | Decision Trees |
| DWT | Discrete Wavelet Transform |
| ECG | Electrocardiogram |
| EMD | Empirical Mode Decomposition |
| ESCDB | European ST-T Database |
| F1-score | |
| FE | Feature Engineering |
| FFT | Fast Fourier Transform |
| FIR | Finite Impulse Response |
| False Negative | |
| False Positive | |
| GA | Genetic Algorithm |
| GSM | Global System for Mobile Communication |
| IEF | Isoelectric Energy Function |
| LSTM | Long-Short Term Memory |
| MDA | Multicriteria Decision Analysis |
| MI | Myocardial Infarction |
| MITDB | MIT-BIH Arrhythmia Database |
| MMNNS | Multi-Module Neural Network System |
| MSVM | Multiclass Support Vector Machine |
| OSHW | Open Source HardWare |
| PDA | Personal Digital Assistant |
| Positive Predictive Value | |
| QLV | Quad Level Vector |
| RBDT | Rule Based Decision Tree |
| ReLU | Rectified Linear Unit |
| RF | Random Forest |
| RMSProp | Root Mean Square Propagation |
| RUS | Random Under Sampling |
| Sensitivity | |
| Specificity | |
| SSRLS | State Space Recursive Least Square |
| SVM | Support Vector Machine |
| TD | Time Domain |
| True Negative | |
| True Positive | |
| WFDB | WaveForm-DataBase |
| WT | Wavelet Transform |
References
- Benjamin, E.J.; Virani, S.S.; Callaway, C.W.; Chamberlain, A.M.; Chang, A.R.; Cheng, S.; Chiuve, S.E.; Cushman, M.; Delling, F.N.; Deo, R.; et al. Heart disease and stroke statistics update: A report from the American Heart Association. Circulation 2018. [Google Scholar] [CrossRef] [PubMed]
- Wasimuddin, M.; Elleithy, K.; Abuzneid, A.; Faezipour, M.; Abuzaghleh, O. Stages-Based ECG Signal Analysis from Traditional Signal Processing to Machine Learning Approaches: A Survey. IEEE Access 2020, 8, 177782–177803. [Google Scholar] [CrossRef]
- Wasimuddin, M.; Elleithy, K.; Abuzneid, A.; Faezipour, M.; Abuzaghleh, O. ECG Signal Analysis Using 2-D Image Classification with Convolutional Neural Network. In Proceedings of the International Conference on Computational Science and Computational Intelligence, Special Track: International Symposium on Health Informatics & Medical Systems CSCI-ISHI’2019, Las Vegas, NV, USA, 5–7 December 2019; pp. 949–954. [Google Scholar]
- Taddei, A.; Distante, G.; Emdin, M.; Pisani, P.; Moody, G.; Zeelenberg, C.; Marchesi, C. The European ST-T database: Standard for evaluating systems for the analysis of ST-T changes in ambulatory electrocardiography. Eur. Heart J. 1992, 13, 1164–1172. [Google Scholar] [CrossRef] [PubMed]
- Samol, A.; Bischof, K.; Luani, B.; Pascut, D.; Wiemer, M.; Kaese, S. Single-lead ECG recordings including Einthoven and Wilson Leads by a smartwatch: A new era of patient directed early ECG differential diagnosis of cardiac diseases? Sensors 2019, 19, 4377. [Google Scholar] [CrossRef] [PubMed]
- Rajakariar, K.; Koshy, A.N.; Sajeev, J.K.; Nair, S.; Roberts, L.; Teh, A.W. Accuracy of a smartwatch based single-lead electrocardiogram device in detection of atrial fibrillation. Heart 2020, 106, 665–670. [Google Scholar] [CrossRef]
- Haverkamp, H.T.; Fosse, S.O.; Schuster, P. Accuracy and usability of single-lead ECG from smartphones-A clinical study. Indian Pacing Electrophysiol. J. 2019, 19, 145–149. [Google Scholar] [CrossRef]
- Jaros, R.; Martinek, R.; Danys, L. Comparison of different electrocardiography with vectorcardiography transformations. Sensors 2019, 19, 3072. [Google Scholar] [CrossRef]
- Fauci, A.S.; Kasper, D.L.; Hauser, S.L.; Longo, D.L. Harrison’s Principles of Internal Medicine; McGraw-Hill, Medical Publishing Division New York: New York, NY, USA, 2008; Volume 2. [Google Scholar]
- Goldberger, A. Atrioventricular (AV) Heart Block. In Clinical Electrocardiography: A Simplified Approach; Elsevier: Amsterdam, The Netherlands, 2006; pp. 203–214. [Google Scholar]
- Acharya, U.R.; Oh, S.L.; Hagiwara, Y.; Tan, J.H.; Adam, M.; Gertych, A.; San Tan, R. A deep convolutional neural network model to classify heartbeats. Comput. Biol. Med. 2017, 89, 389–396. [Google Scholar] [CrossRef]
- Lastre-Dominguez, C.; Shmaliy, Y.S.; Ibarra-Manzano, O.; Vazquez-Olguin, M. Denoising and Features Extraction of ECG Signals in State Space Using Unbiased FIR Smoothing. IEEE Access 2019, 7, 152166–152178. [Google Scholar] [CrossRef]
- Razzaq, N.; Sheikh, S.A.A.; Salman, M.; Zaidi, T. An intelligent adaptive filter for elimination of power line interference from high resolution electrocardiogram. IEEE Access 2016, 4, 1676–1688. [Google Scholar] [CrossRef]
- Chen, B.; Li, Y.; Cao, X.; Sun, W.; He, W. Removal of Power Line Interference From ECG Signals Using Adaptive Notch Filters of Sharp Resolution. IEEE Access 2019, 7, 150667–150676. [Google Scholar] [CrossRef]
- Shirbani, F.; Setarehdan, S.K. ECG power line interference removal using combination of FFT and adaptive non-linear noise estimator. In Proceedings of the 21st Iranian Conference on Electrical Engineering (ICEE), Mashhad, Iran, 14–16 May 2013; pp. 1–5. [Google Scholar]
- Furno, G.S.; Tompkins, W.J. A learning filter for removing noise interference. IEEE Trans. Biomed. Eng. 1983, 30, 234–235. [Google Scholar] [CrossRef] [PubMed]
- Arif, M.; Malagore, I.A.; Afsar, F.A. Detection and localization of myocardial infarction using k-nearest neighbor classifier. J. Med. Syst. 2012, 36, 279–289. [Google Scholar] [CrossRef] [PubMed]
- Acharya, U.R.; Fujita, H.; Sudarshan, V.K.; Oh, S.L.; Adam, M.; Koh, J.E.; Tan, J.H.; Ghista, D.N.; Martis, R.J.; Chua, C.K.; et al. Automated detection and localization of myocardial infarction using electrocardiogram: A comparative study of different leads. Knowl.-Based Syst. 2016, 99, 146–156. [Google Scholar] [CrossRef]
- Sun, L.; Lu, Y.; Yang, K.; Li, S. ECG analysis using multiple instance learning for myocardial infarction detection. IEEE Trans. Biomed. Eng. 2012, 59, 3348–3356. [Google Scholar] [CrossRef] [PubMed]
- Moody, G.B.; Mark, R.G. The impact of the MIT-BIH arrhythmia database. IEEE Eng. Med. Biol. Mag. 2001, 20, 45–50. [Google Scholar] [CrossRef]
- Hii, P.C.; Chung, W.Y. A comprehensive ubiquitous healthcare solution on an Android™ mobile device. Sensors 2011, 11, 6799–6815. [Google Scholar] [CrossRef] [PubMed]
- Miao, F.; Cheng, Y.; He, Y.; He, Q.; Li, Y. A wearable context-aware ECG monitoring system integrated with built-in kinematic sensors of the smartphone. Sensors 2015, 15, 11465–11484. [Google Scholar] [CrossRef]
- Rajpurkar, P.; Hannun, A.Y.; Haghpanahi, M.; Bourn, C.; Ng, A.Y. Cardiologist-level arrhythmia detection with convolutional neural networks. arXiv 2017, arXiv:1707.01836. [Google Scholar]
- Kłosowski, G.; Rymarczyk, T.; Wójcik, D.; Skowron, S.; Cieplak, T.; Adamkiewicz, P. The Use of Time-Frequency Moments as Inputs of LSTM Network for ECG Signal Classification. Electronics 2020, 9, 1452. [Google Scholar] [CrossRef]
- Oresko, J.J. Portable Heart Attack Warning System by Monitoring the ST Segment via Smartphone Electrocardiogram Processing. Ph.D. Thesis, University of Pittsburgh, Pittsburgh, PA, USA, 2010. [Google Scholar]
- Farhan, M.S.; Nahiyan, K.T. Myocardial Ischemia Detection from Slope of ECG ST Segment. Bangladesh J. Med Phys. 2017, 10, 12–24. [Google Scholar] [CrossRef]
- Rad, M.Z.; Ghuchani, S.R.; Bahaadinbeigy, K.; Khalilzadeh, M.M. Real time recognition of heart attack in a smart phone. Acta Inform. Med. 2015, 23, 151. [Google Scholar] [CrossRef] [PubMed]
- Uchaipichat, N.; Thanawattano, C.; Buakhamsri, A. The Development of ST-Episode Detection in Holter Monitoring for Myocardial Ischemia. Procedia Comput. Sci. 2016, 86, 188–191. [Google Scholar] [CrossRef]
- Oktivasari, P.; Hasyim, M.; Amy, H.; Freddy, H. A Simple Real-Time System for Detection of Normal and Myocardial Ischemia in The ST segment and T Wave ECG Signal. In Proceedings of the International Conference on Information and Communications Technology (ICOIACT), Yogyakarta, Indonesia, 24–25 July 2019; pp. 327–331. [Google Scholar]
- Bentes, P.; Nadal, J. A Telediagnosis Assistance System for Multiple-Lead Electrocardiography. Res. Sq. 2020. [Google Scholar] [CrossRef]
- Di Marco, L.Y.; Chiari, L. A wavelet-based ECG delineation algorithm for 32-bit integer online processing. Biomed. Eng. Online 2011, 10, 23. [Google Scholar] [CrossRef]
- Martínez, J.P.; Almeida, R.; Olmos, S.; Rocha, A.P.; Laguna, P. A wavelet-based ECG delineator: Evaluation on standard databases. IEEE Trans. Biomed. Eng. 2004, 51, 570–581. [Google Scholar] [CrossRef]
- Khan, T.T.; Sultana, N.; Reza, R.B.; Mostafa, R. ECG feature extraction in temporal domain and detection of various heart conditions. In Proceedings of the International Conference on Electrical Engineering and Information Communication Technology (ICEEICT), Dhaka, Bangladesh, 21–23 May 2015; pp. 1–6. [Google Scholar]
- Faezipour, M.; Saeed, A.; Bulusu, S.C.; Nourani, M.; Minn, H.; Tamil, L. A patient-adaptive profiling scheme for ECG beat classification. IEEE Trans. Inf. Technol. Biomed. 2010, 14, 1153–1165. [Google Scholar] [CrossRef]
- Bulusu, S.C.; Faezipour, M.; Ng, V.; Nourani, M.; Tamil, L.S.; Banerjee, S. Transient ST-segment episode detection for ECG beat classification. In Proceedings of the NIH Life Science Systems and Applications Workshop (LiSSA), Bethesda, MD, USA, 7–8 April 2011; pp. 121–124. [Google Scholar]
- Afsar, F.A.; Arif, M.; Yang, J. Detection of ST segment deviation episodes in ECG using KLT with an ensemble neural classifier. Physiol. Meas. 2008, 29, 747. [Google Scholar] [CrossRef]
- Ghaffari, A.; Homaeinezhad, M.; Akraminia, M.; Atarod, M.; Daevaeiha, M. A robust wavelet-based multi-lead electrocardiogram delineation algorithm. Med. Eng. Phys. 2009, 31, 1219–1227. [Google Scholar] [CrossRef]
- Xu, M.; Wei, S.; Qin, X.; Zhang, Y.; Liu, C. Rule-based method for morphological classification of ST segment in ECG signals. J. Med Biol. Eng. 2015, 35, 816–823. [Google Scholar] [CrossRef]
- Saadi, D.B.; Tanev, G.; Flintrup, M.; Osmanagic, A.; Egstrup, K.; Hoppe, K.; Jennum, P.; Jeppesen, J.L.; Iversen, H.K.; Sorensen, H.B. Automatic real-time embedded QRS complex detection for a novel patch-type electrocardiogram recorder. IEEE J. Transl. Eng. Health Med. 2015, 3, 1–12. [Google Scholar] [CrossRef] [PubMed]
- Kumar, A.; Singh, M. Ischemia detection using isoelectric energy function. Comput. Biol. Med. 2016, 68, 76–83. [Google Scholar] [CrossRef]
- Bhoi, A.K.; Sherpa, K.S.; Khandelwal, B. Arrhythmia and ischemia classification and clustering using QRS-ST-T (QT) analysis of electrocardiogram. Clust. Comput. 2018, 21, 1033–1044. [Google Scholar] [CrossRef]
- Haddadi, R.; Abdelmounim, E.; El Hanine, M.; Belaguid, A. ST Segment Analysis Using Wavelet Transform. IJCSNS Int. J. Comput. Sci. Netw. Secur. 2017, 17, 102–107. [Google Scholar]
- Kayikcioglu, İ.; Akdeniz, F.; Köse, C.; Kayikcioglu, T. Time-frequency approach to ECG classification of myocardial infarction. Comput. Electr. Eng. 2020, 84, 106621. [Google Scholar] [CrossRef]
- Goletsis, Y.; Papaloukas, C.; Fotiadis, D.I.; Likas, A.; Michalis, L.K. Automated ischemic beat classification using genetic algorithms and multicriteria decision analysis. IEEE Trans. Biomed. Eng. 2004, 51, 1717–1725. [Google Scholar] [CrossRef] [PubMed]
- Kumar, A.; Singh, M. Statistical analysis of ST segments in ECG signals for detection of ischaemic episodes. Trans. Inst. Meas. Control 2018, 40, 819–830. [Google Scholar] [CrossRef]
- Hadjem, M.; Naït-Abdesselam, F.; Khokhar, A. ST-segment and T-wave anomalies prediction in an ECG data using RUSBoost. In Proceedings of the 18th International Conference on e-Health Networking, Applications and Services (Healthcom), Munich, Germany, 14–16 September 2016; pp. 1–6. [Google Scholar]
- Faziludeen, S.; Sabiq, P. ECG beat classification using wavelets and SVM. In Proceedings of the IEEE Conference on Information & Communication Technologies, Thuckalay, India, 11–12 April 2013; pp. 815–818. [Google Scholar]
- Elhaj, F.A.; Salim, N.; Harris, A.R.; Swee, T.T.; Ahmed, T. Arrhythmia recognition and classification using combined linear and nonlinear features of ECG signals. Comput. Methods Programs Biomed. 2016, 127, 52–63. [Google Scholar] [CrossRef]
- Jannah, N.; Hadjiloucas, S. Detection of ECG arrhythmia conditions using CSVM and MSVM classifiers. In Proceedings of the IEEE Signal Processing in Medicine and Biology Symposium (SPMB), Philadelphia, PA, USA, 12 December 2015; pp. 1–2. [Google Scholar]
- Exarchos, T.P.; Tsipouras, M.G.; Exarchos, C.P.; Papaloukas, C.; Fotiadis, D.I.; Michalis, L.K. A methodology for the automated creation of fuzzy expert systems for ischaemic and arrhythmic beat classification based on a set of rules obtained by a decision tree. Artif. Intell. Med. 2007, 40, 187–200. [Google Scholar] [CrossRef]
- Pandit, D.; Zhang, L.; Aslam, N.; Liu, C.; Hossain, A.; Chattopadhyay, S. An efficient abnormal beat detection scheme from ECG signals using neural network and ensemble classifiers. In Proceedings of the 8th International Conference on Software, Knowledge, Information Management and Applications (SKIMA), Dhaka, Bangladesh, 18–20 December 2014; pp. 1–6. [Google Scholar]
- Laguna, P.; Mark, R.G.; Goldberg, A.; Moody, G.B. A database for evaluation of algorithms for measurement of QT and other waveform intervals in the ECG. In Proceedings of the Computers in Cardiology 1997, Lund, Sweden, 7–10 September 1997; pp. 673–676. [Google Scholar]
- Papaloukas, C.; Fotiadis, D.I.; Likas, A.; Michalis, L.K. An ischemia detection method based on artificial neural networks. Artif. Intell. Med. 2002, 24, 167–178. [Google Scholar] [CrossRef]
- Jiang, J.; Zhang, H.; Pi, D.; Dai, C. A novel multi-module neural network system for imbalanced heartbeats classification. Expert Syst. Appl. X 2019, 1, 100003. [Google Scholar] [CrossRef]
- Salem, M.; Taheri, S.; Yuan, J.S. ECG arrhythmia classification using transfer learning from 2-dimensional deep CNN features. In Proceedings of the IEEE Biomedical Circuits and Systems Conference (BioCAS), Cleveland, OH, USA, 17–19 October 2018; pp. 1–4. [Google Scholar]
- Wang, H.; Zhao, W.; Xu, Y.; Hu, J.; Yan, C.; Jia, D.; You, T. ST Segment Change Classification Based on Multiple Feature Extraction Using ECG. In Proceedings of the 2018 Computing in Cardiology Conference (CinC), Maastricht, The Netherlands, 23–26 September 2018; Volume 45, pp. 1–4. [Google Scholar]
- Izci, E.; Ozdemir, M.A.; Degirmenci, M.; Akan, A. Cardiac Arrhythmia Detection from 2D ECG Images by Using Deep Learning Technique. In Proceedings of the Medical Technologies Congress (TIPTEKNO), Izmir, Turkey, 3–5 October 2019; pp. 1–4. [Google Scholar]
- Jun, T.J.; Nguyen, H.M.; Kang, D.; Kim, D.; Kim, D.; Kim, Y.H. ECG arrhythmia classification using a 2-D convolutional neural network. arXiv 2018, arXiv:1804.06812. [Google Scholar]
- Wu, Y.; Yang, F.; Liu, Y.; Zha, X.; Yuan, S. A comparison of 1-D and 2-D deep convolutional neural networks in ECG classification. arXiv 2018, arXiv:1810.07088. [Google Scholar]
- Davies, E.R. Machine Vision: Theory, Algorithms, Practicalities; Elsevier: San Francisco, CA, USA, 2004. [Google Scholar]
- Smith, S. Digital Signal Processing: A Practical Guide for Engineers and Scientists; Elsevier: Burlington, MA, USA, 2013. [Google Scholar]
- Zidelmal, Z.; Amirou, A.; Adnane, M.; Belouchrani, A. QRS detection based on wavelet coefficients. Comput. Methods Programs Biomed. 2012, 107, 490–496. [Google Scholar] [CrossRef]
- Curtin, A.E.; Burns, K.V.; Bank, A.J.; Netoff, T.I. QRS complex detection and measurement algorithms for multichannel ECGs in cardiac resynchronization therapy patients. J. Transl. Eng. Health Med. 2018, 6, 1–11. [Google Scholar] [CrossRef] [PubMed]
- Liao, Y.; Na, R.X.; Rayside, D. Accurate ECG R-peak detection for telemedicine. In Proceedings of the IEEE Canada International Humanitarian Technology Conference-(IHTC), Montreal, QC, Canada, 1–4 June 2014; pp. 1–5. [Google Scholar]
- Sadhukhan, D.; Mitra, M. R-Peak Detection Algorithm for ECG using Double Difference And RR Interval Processing. Procedia Technol. 2012, 4, 873–877. [Google Scholar] [CrossRef]
- Setiawidayat, S.; Indra, M.R.; Sargowo, D.; Sakti, S. Determining the ECG 1 cycle wave using Discrete data. J. Theor. Appl. Inf. Technol. 2016, 88, 107. [Google Scholar]
- Mousavi, S.; Afghah, F. Inter-and intra-patient ECG heartbeat classification for arrhythmia detection: A sequence to sequence deep learning approach. In Proceedings of the ICASSP 2019-2019 IEEE International Conference on Acoustics, Speech and Signal Processing (ICASSP), Brighton, UK, 12–17 May 2019; pp. 1308–1312. [Google Scholar]
- Huang, H.; Liu, J.; Zhu, Q.; Wang, R.; Hu, G. A new hierarchical method for inter-patient heartbeat classification using random projections and RR intervals. Biomed. Eng. Online 2014, 13, 90. [Google Scholar] [CrossRef]
- Garcia, G.; Moreira, G.; Menotti, D.; Luz, E. Inter-patient ECG heartbeat classification with temporal VCG optimized by PSO. Nat. Sci. Rep. 2017, 7, 1–11. [Google Scholar] [CrossRef]
- Alfaras, M.; Soriano, M.C.; Ortín, S. A fast machine learning model for ECG-based heartbeat classification and arrhythmia detection. Front. Phys. 2019, 7, 103. [Google Scholar] [CrossRef]
- De Chazal, P.; O’Dwyer, M.; Reilly, R.B. Automatic classification of heartbeats using ECG morphology and heartbeat interval features. IEEE Trans. Biomed. Eng. 2004, 51, 1196–1206. [Google Scholar] [CrossRef]
- Li, T.; Zhou, M. ECG classification using wavelet packet entropy and random forests. Entropy 2016, 18, 285. [Google Scholar] [CrossRef]
- LeCun, Y.; Bengio, Y.; Hinton, G. Deep learning. Nature 2015, 521, 436–444. [Google Scholar] [CrossRef] [PubMed]
- Kingma, D.P.; Ba, J. Adam: A method for stochastic optimization. arXiv 2014, arXiv:1412.6980. [Google Scholar]
- Glorot, X.; Bordes, A.; Bengio, Y. Deep sparse rectifier neural networks. In Proceedings of the Fourteenth International Conference on Artificial Intelligence and Statistics, Ft. Lauderdale, FL, USA, 11–13 April 2011; pp. 315–323. [Google Scholar]
- Higgins, S.L. A novel patch for heart rhythm monitoring: Is the Holter monitor obsolete? Future Cardiol. 2013, 9, 325–333. [Google Scholar] [CrossRef]
- Burns, A.; Greene, B.R.; McGrath, M.J.; O’Shea, T.J.; Kuris, B.; Ayer, S.M.; Stroiescu, F.; Cionca, V. SHIMMER™—A wireless sensor platform for noninvasive biomedical research. IEEE Sensors J. 2010, 10, 1527–1534. [Google Scholar] [CrossRef]
- Song, S.J.; Cho, N.; Kim, S.; Yoo, J.; Yoo, H.J. A 2 Mb/s wideband pulse transceiver with direct-coupled interface for human body communications. In Proceedings of the International Solid State Circuits Conference-Digest of Technical Papers, San Francisco, CA, USA, 6–9 February 2006; pp. 2278–2287. [Google Scholar]
- Kim, H.; Yazicioglu, R.F.; Merken, P.; Van Hoof, C.; Yoo, H.J. ECG signal compression and classification algorithm with quad level vector for ECG holter system. IEEE Trans. Inf. Technol. Biomed. 2009, 14, 93–100. [Google Scholar]
- Kim, H.; Choi, S.; Yoo, H.J. A low power 16-bit RISC with lossless compression accelerator for body sensor network system. In Proceedings of the Asian Solid-State Circuits Conference, Hangzhou, China, 13–15 November 2006; pp. 207–210. [Google Scholar]
- He, K.; Sun, J. Convolutional neural networks at constrained time cost. In Proceedings of the IEEE Conference on Computer Vision and Pattern Recognition, Boston, MA, USA, 7–12 June 2015; pp. 5353–5360. [Google Scholar]
- Faezipour, M.; Faezipour, M. System Dynamics Modeling for Smartphone-Based Healthcare Tools: Case Study on ECG Monitoring. IEEE Syst. J. 2020. [Google Scholar] [CrossRef]
- Faezipour, M.; Faezipour, M. Sustainable Smartphone-Based Healthcare Systems: A Systems Engineering Approach to Assess the Efficacy of Respiratory Monitoring Apps. Sustain. Spec. Issue Glob. Health Policy Health Serv. Syst. -Health 2020, 12, 5061. [Google Scholar]
- Wasimuddin, M.; Gupta, N. Design and implementation of Least Mean Square adaptive filter on fetal electrocardiography. In Proceedings of the Zone 1 Conference of the American Society for Engineering Education, Bridgeport, CT, USA, 3–5 April 2014; pp. 1–5. [Google Scholar]
Publisher’s Note: MDPI stays neutral with regard to jurisdictional claims in published maps and institutional affiliations. |
© 2021 by the authors. Licensee MDPI, Basel, Switzerland. This article is an open access article distributed under the terms and conditions of the Creative Commons Attribution (CC BY) license (http://creativecommons.org/licenses/by/4.0/).