1. Introduction
The last decade has seen a dynamic development of electromagnetic devices capable of generating short-term microwave pulses in the order of a few nanoseconds, which are characterized by very high electric field strengths and can measure up to hundreds of kilovolts per meter. If such a field comes into contact with an electronic device, it generates very high currents within its circuits. This surge is very likely to cause damage to a circuit, especially when a circuit is semiconductor-based, i.e., has integrated circuits, memory chips, microprocessors, etc. These phenomena is used by state militaries and can also be used by terrorist organizations in the construction of various devices, the intent of which is to destroy, damage, or partially disable electronic equipment. Devices capable of generating such pulsed radiation are known as electromagnetic weapons. The power they generate ranges from several up to a dozen or so gigawatts. For this reason, the generated pulses are often called high-power microwave (HPM) pulses, if they are in a microwave frequency range, or high power electromagnetics (HPEM) in frequencies lower than 300 MHz [
1,
2,
3,
4,
5]. A distinguishing feature of HPM pulses is their very short duration, which enables reaching high power values with a relatively limited energy expenditure. From a metrology perspective, measuring such high electric field strengths is a great challenge, since radiation of such intensity may damage the measuring equipment. At the same time, the very short pulse durations result in a very wide spectrum of harmonic components. This requires the use of a meter measuring probe and a measurement chain characterized by a wide bandwidth. The most popular HPM pulse generators are the Marx generator and a vircator emitting pulses in the microwave range. HPEM sources, i.e., sources operating in the low megahertz frequencies, are typically based on a flux compression generator (FCG). As the durations of individual pulses are in the order of several nanoseconds, their spectrum can be wider than 500 MHz, and thus they can be treated as ultra-wide band (UWB) pulses.
To correlate the scale of negative effects of HPM/HPEM on both electronics and organisms, there is a need to measure the electric field strength in its peak, the duration of the pulse duration, and the whole spectrum of harmonics. Therefore, a probe attached to a HPM/HPEM meter must guarantee a flat transmittance from low megahertz frequencies up to gigahertz frequency values. Common radio frequency (RF) meter probes are generally based on dipole-diodes or thermistors and typically operate in a narrow waveband. Additionally, probe transmittances in available probes are typically improved through the use of additional electronic circuits, which perform additional processing in order to obtain flat characteristics vs. frequency in a specific waveband. Because of this, the time constants of such probes are rather high, which makes measurements of short pulses impossible. Generally speaking, the lowest possible threshold of pulse duration in a portable meter is 1 μs. With such a time constant, only the envelope of pulses can be measured. The harmonic spectrum can be determined using additional calculations, such as Fast Fourier Transform (FFT).
In addition, in recent years, it was observed that the adverse impact of HPM/HPEM pulses on electronics is stronger when not one, but a sequence of pulses (hundreds of pulses) is emitted. In such a case, it seems more reasonable to associate the negative effects of HPM/HPEM pulses on electronics not with pulse power, but rather with the total energy of the generated pulse train. Given the fact that both peak power and pulse energy can be very important in terms of interacting with electronic devices, another generation method—besides generating a high number of nanosecond-duration pulses—is to generate a pulse with a significantly longer duration, i.e., in the order of microseconds. Such pulses can be generated by readily available generators, such as magnetrons, which are commonly used in radars and are oftentimes modified by various agents to be capable of disabling or outright destroying electronic devices. Pulses generated by such a device do not fulfill the definition of HPM/HPEM radiation as the duration of the pulse is significantly longer than several nanoseconds, while its peak power is lower than a gigawatt. Nevertheless, it should be emphasized that such strong pulses can be even more dangerous to electronics. However, the measurement of RF signals of a microsecond pulse (or a pulse train) requires special numerical processing, which is different than for nanosecond-duration pulses.
It should also be noted that the intense electromagnetic transient phenomenon, which accompanies a nuclear explosion, may exhibit field densities of 100 kV/m with a nanosecond rise. Similar measuring equipment is also required for assessing the operation and parameters of such pulses.
Furthermore, an important problem is the need to verify which hazardous effects, if any, such high peak power may have on tissues or whole biological organisms. This investigation requires the use of a specialized meter, which would be capable of detecting high peak power, pulse time duration, and the spectrum of harmonics. Time duration and the spectrum of harmonics are necessary to correlate a biological response as energy absorption in tissues strongly depends on the frequency of the incident field. However, according to recent investigations, HPM/HPEM pulses (in the order of several nanoseconds) were found to have no adverse effects on biological structures, owing to their short pulse duration. Because of this, the HPM/HPEM pulses can be treated as a non-lethal weapon. According to NATO STANAG a dangerous threshold for these pulses is set at a high limit of 200 kV/m [
6]. To verify this threshold, an investigation involving biological matter was realized using a very high value of electric field strength, e.g., inside the waveguide E = 1.57 MV/m [
7]. Unfortunately, such a weak biological interaction with nanosecond pulses cannot be identified using high peak power of microsecond pulses, due to a carcinogenic health hazard that these pulses pose.
The following paper presents an elaboration of the probe capable of operating in an extremely broad range of frequency, i.e., from low MHz to GHz frequencies, with a flat transmittance vs. frequency. Such a broad frequency is even wider than that and is defined as the ultra-wide band (UWB) in signal analyses. Therefore, taking into account the requirements for the sensor, it is reasonable to use the term “UWB+”. In the work, a D-dot sensor was proposed as a detecting antenna, due to its low time constant, which allows the sensor to operate in the mentioned frequency range. Such a probe is capable of measuring a high-strength electric field. Nevertheless, uncritical use of such a sensor without a proper processing algorithm yields an incorrect result due to the presence of parasitic low-frequency components. Such parasitic components strongly depend on pulse time duration, and because of this, their impact must be individually taken into account. The proposed algorithm allows to elaborate both extremely short pulses, as well as longer pulses. As an example, the paper discusses two types of signals, with durations measured in nanoseconds and microseconds, respectively.
2. Metrology of High-Power Microwave Fields
Considering the aforementioned conditions, a potential meter should be a portable device, which would enable measurements both indoors and outdoors. It is also important to have it be powered by an independent power supply, enabling it to be used for measurements in the field.
Commercially available portable meters for measuring electric field strength are characterized by two significant limitations, which make them impossible for measuring HPM/HPME pulses. First of all, such meters can be used in electromagnetic fields, which are not higher than several kV/m (generally not higher than 1 kV/m). Higher field strengths can damage the measuring sensor and the meter’s measurement chain. Another restriction relates to time and frequency. In order to obtain a flat frequency response, the measuring sensors of the meters have built-in frequency equalizers, which increase their time constant, thus making it impossible to measure very short pulses.
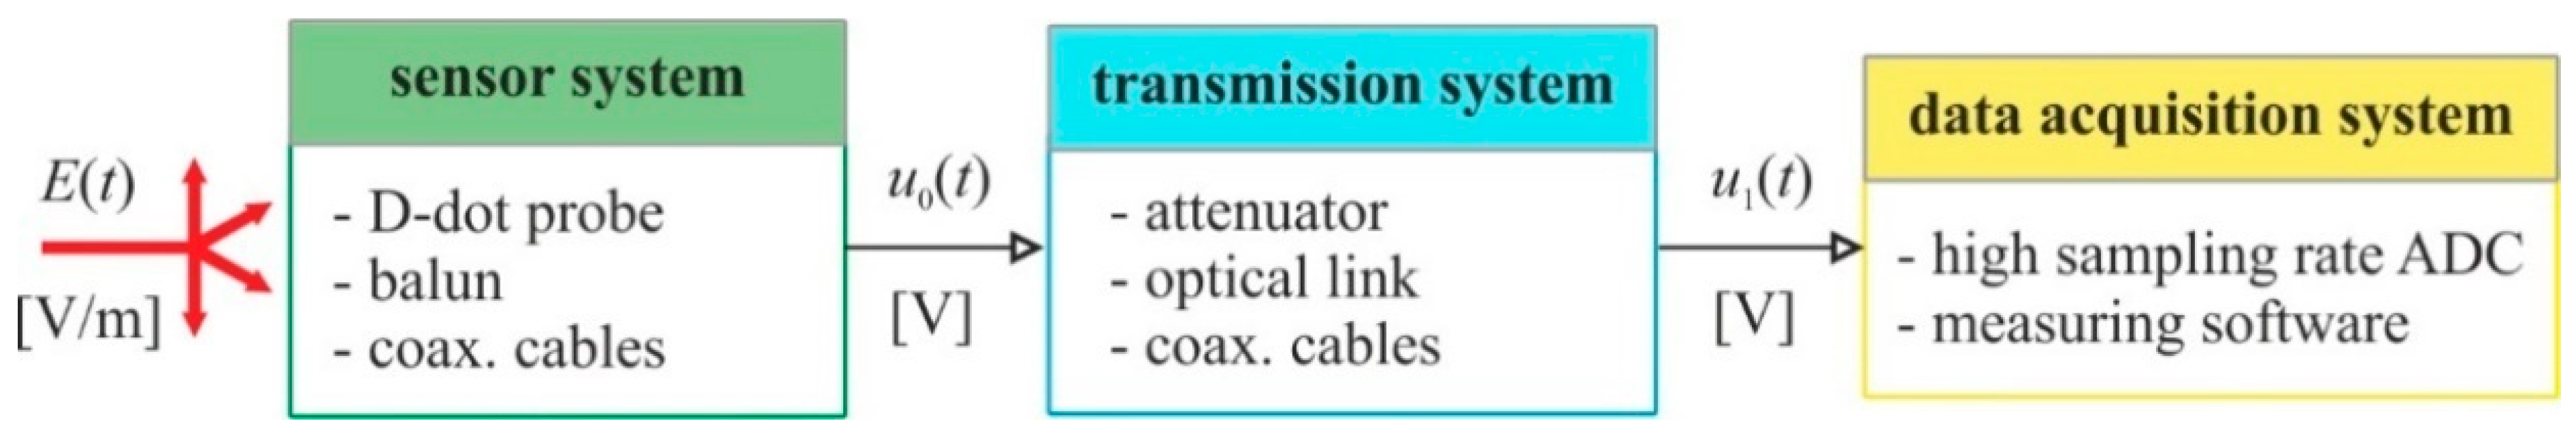
The development of A/D converters, which are currently being fitted in rapid digital oscilloscopes, led in recent years to the popularization of the so-called conventional method, in which the tested electromagnetic impact is represented by a time waveform of voltage on the output of a passive sensor reacting to electric field presence (a so-called D-dot sensor)—see
Figure 1. In this method, transmission via a fiber optic link is often used in order to protect the voltage acquisition circuits and to transmit the measurement result without distortions over a safe distance [
8,
9]. In addition, the measurement system structure contains a matching element, a so-called balun, and attenuators, which are used to change the range.
In order to develop algorithms for processing signals recorded by the acquisition system, one must perform an initial assessment of the nature of the measured electromagnetic field and analyze the properties of the measurement chain. The former is due to the fact that there are many types of generators, which may require dedicated pre-processing methods, while the latter will serve to implement the indirect task of a reverse nature, i.e., reconstructing the primary interference based on a directly measured output signal.
The article reviews the impact of properties of measurement chain components and the present low-frequency interference on the form of the processing algorithm and presents the results of its application in measuring the electric field of actual HPM/HPEM signal sources depending on pulse time durations.
3. Research Problem
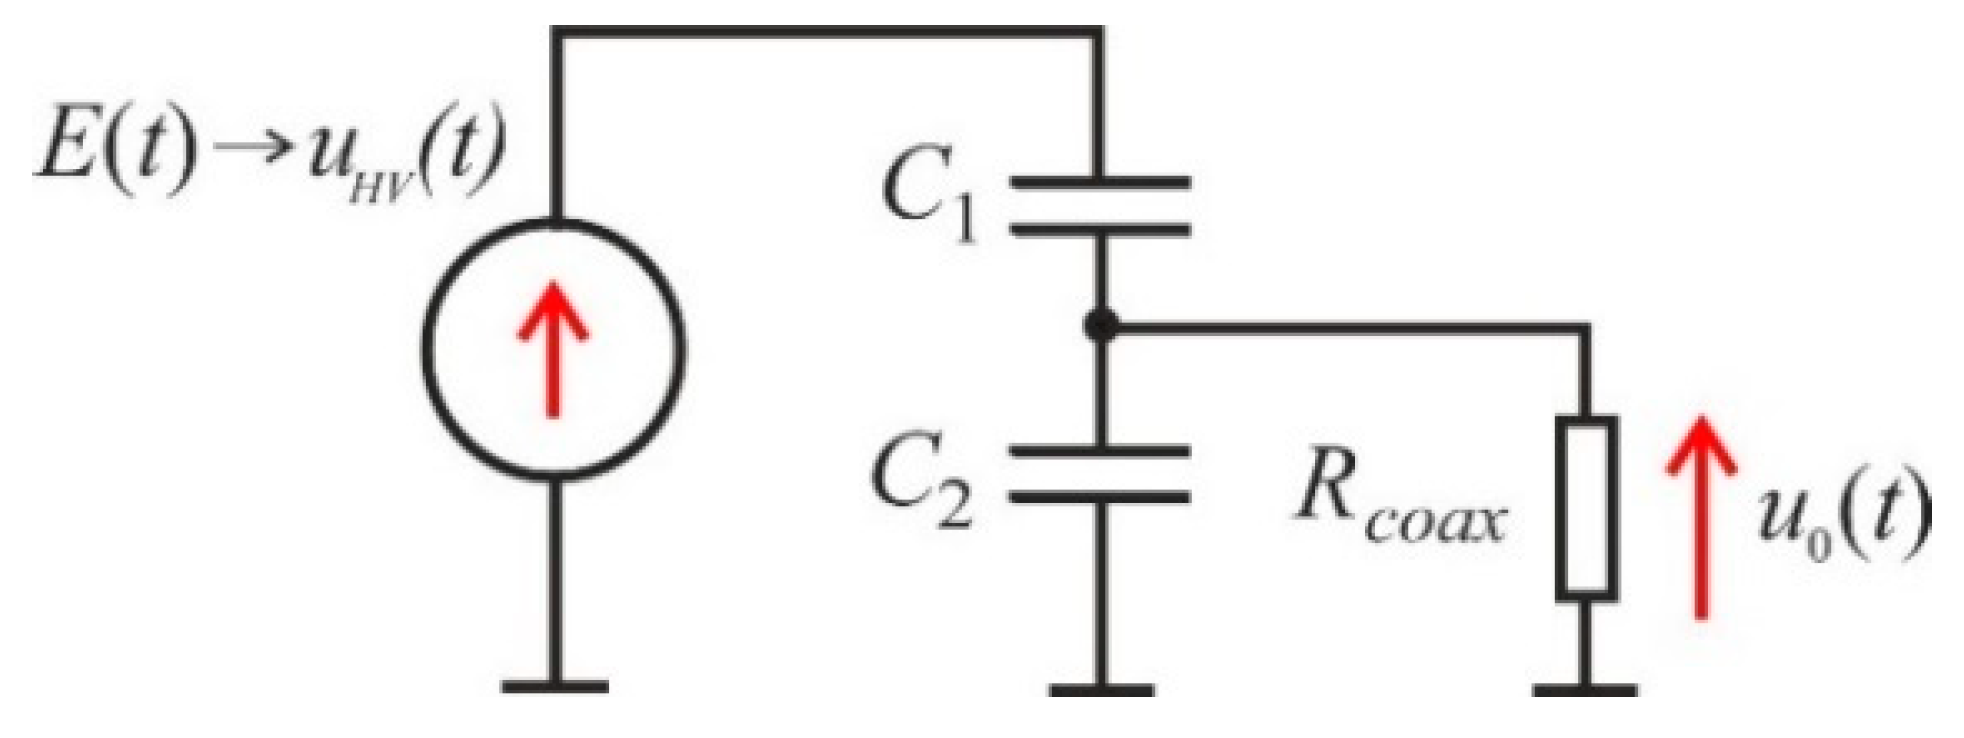
Calculations intended for quantitative measurements of HPM/HPEM parameters require the use of an electromagnetic field waveform reaching the antenna. This means that the algorithm for processing data acquired by an analog to digital converter (ADC) converter must be developed, and this algorithm must take into account the properties of all components within a measurement chain, which transmit signals to the master computer with dedicated software. According to
Figure 1, these elements form a structure with distinguishable analogue and digital parts. The aforementioned D-dot sensor is a fundamental component of the analogue part. Its equivalent diagram can be presented in the form of a voltage divider, built of two capacitors,
C1 and
C2, and loaded with connection impedance
Rcoax, as presented in
Figure 2 [
10].
The sensor converts high voltage
uHV caused by the tested electric field
E(
t) to the output voltage
u0. Its Laplace transfer function is determined by the relationship:
If the time constant
Rcoax(
C1 +
C2) remains very low, which is the most frequent case in available solutions, the sensor transfer function can be simplified to the form:
which corresponds to the differentiation operation in the time domain. This means that the sensor output voltage is proportional to the field derivative. Therefore, from the perspective of an algorithmic reconstruction of the incident field by the measuring software, it is necessary to apply a reverse operation, i.e., integration. Hence, the quantitative determination of an electric field
E(
t) reaching an antenna within a traditional measurement system is based on the following relationship:
where
u1int is an integral derived from the voltage processes by the analogue part of the measurement chain. The properties of the chain are determined by its structure. These properties are described globally by the correction factor
Ak. The factor includes sensor impedance
Rs, sensor effective area
Aeq, and chain element attenuation
KdB expressed in decibels. According to the methodology presented in [
11], it is possible to determine the correction factor based on the aforementioned values as a formula:
where
ε0 is the permittivity. The integration operation required in Equation (3) can be, with a sufficiently short sampling period
Tp, executed using a digital filter; a simulator of the analogue system approximating transmittance 1/
s for discrete signals. The possible approaches, included in the signal digital processing canon, generally offer various accuracies of integral determination [
12]. They are characterized by a transfer function in the domain of the complex variable
z, which implements the rules of Tustin Equation (5) and Simpson Equation (6), respectively:
Regardless of the integration method, each of its implementations is faced with a trend, which appears due to the presence of a constant or quasi-constant component in the acquired signal [
13,
14]. Evaluations of the impact of these components, present in acquired real HPM signals, and the determination of the processing algorithm, which would ensure desired waveforms can be obtained in a time-efficient manner, were treated as research problems.
4. Material
The test data was collected by a preliminary version of an HPM meter, constructed as per the concept shown in
Figure 1. A SP Devices ADQ7 module, with a 14-bit resolution, sampling frequency up to 10 GSa/s, and a range of ±500 mV, was chosen as an analogue-to-digital converter for the digital section of the measuring system. The module came with a software development kit (SDK), necessary for application development; it included device drivers, application programming interface (API) application programming interface, software tools for firmware installation and updates, as well as a sample program demonstrating the use of available functions. From the perspective of the measurement data processing algorithm, the most important component in a target measuring device was the application programming interface, the location of which, within the hardware and programming structure of module communication, is shown in
Figure 3.
The API interface provides the necessary tools for processing measurement data, including a function for high-level programming of the device’s operating parameters, as well as for receiving recording results to the master computer [
15]. While the method of calling an API function depends on the application development environment used, the input and output parameters, as well as the naming convention, remained unchanged.
With the maximum number of recorded samples, limited by the internal capacity of the module of 4 GB, the highest sampling frequency provided a data record length equal to approximately 200 ms. Data was recorded in real-time, despite the obvious limitations in terms of the transmission to a computer. One of the operating modes of the ADQ7 module was the so-called MultiRecord. In this mode, the module could be repeatedly triggered during a single session, collecting and storing data in DRAM memory for later transmission. The use of this mode is important, insofar as the HPM pulses can appear in a bundle, i.e., be repeated within a single source impact cycle. By declaring a certain number of records and the duration of each record, corresponding to the pulse duration, it was possible to automatically record each impact in the form of a pulse sequence, irrespective of the repetition period, which, in consequence, can be as long as desired.
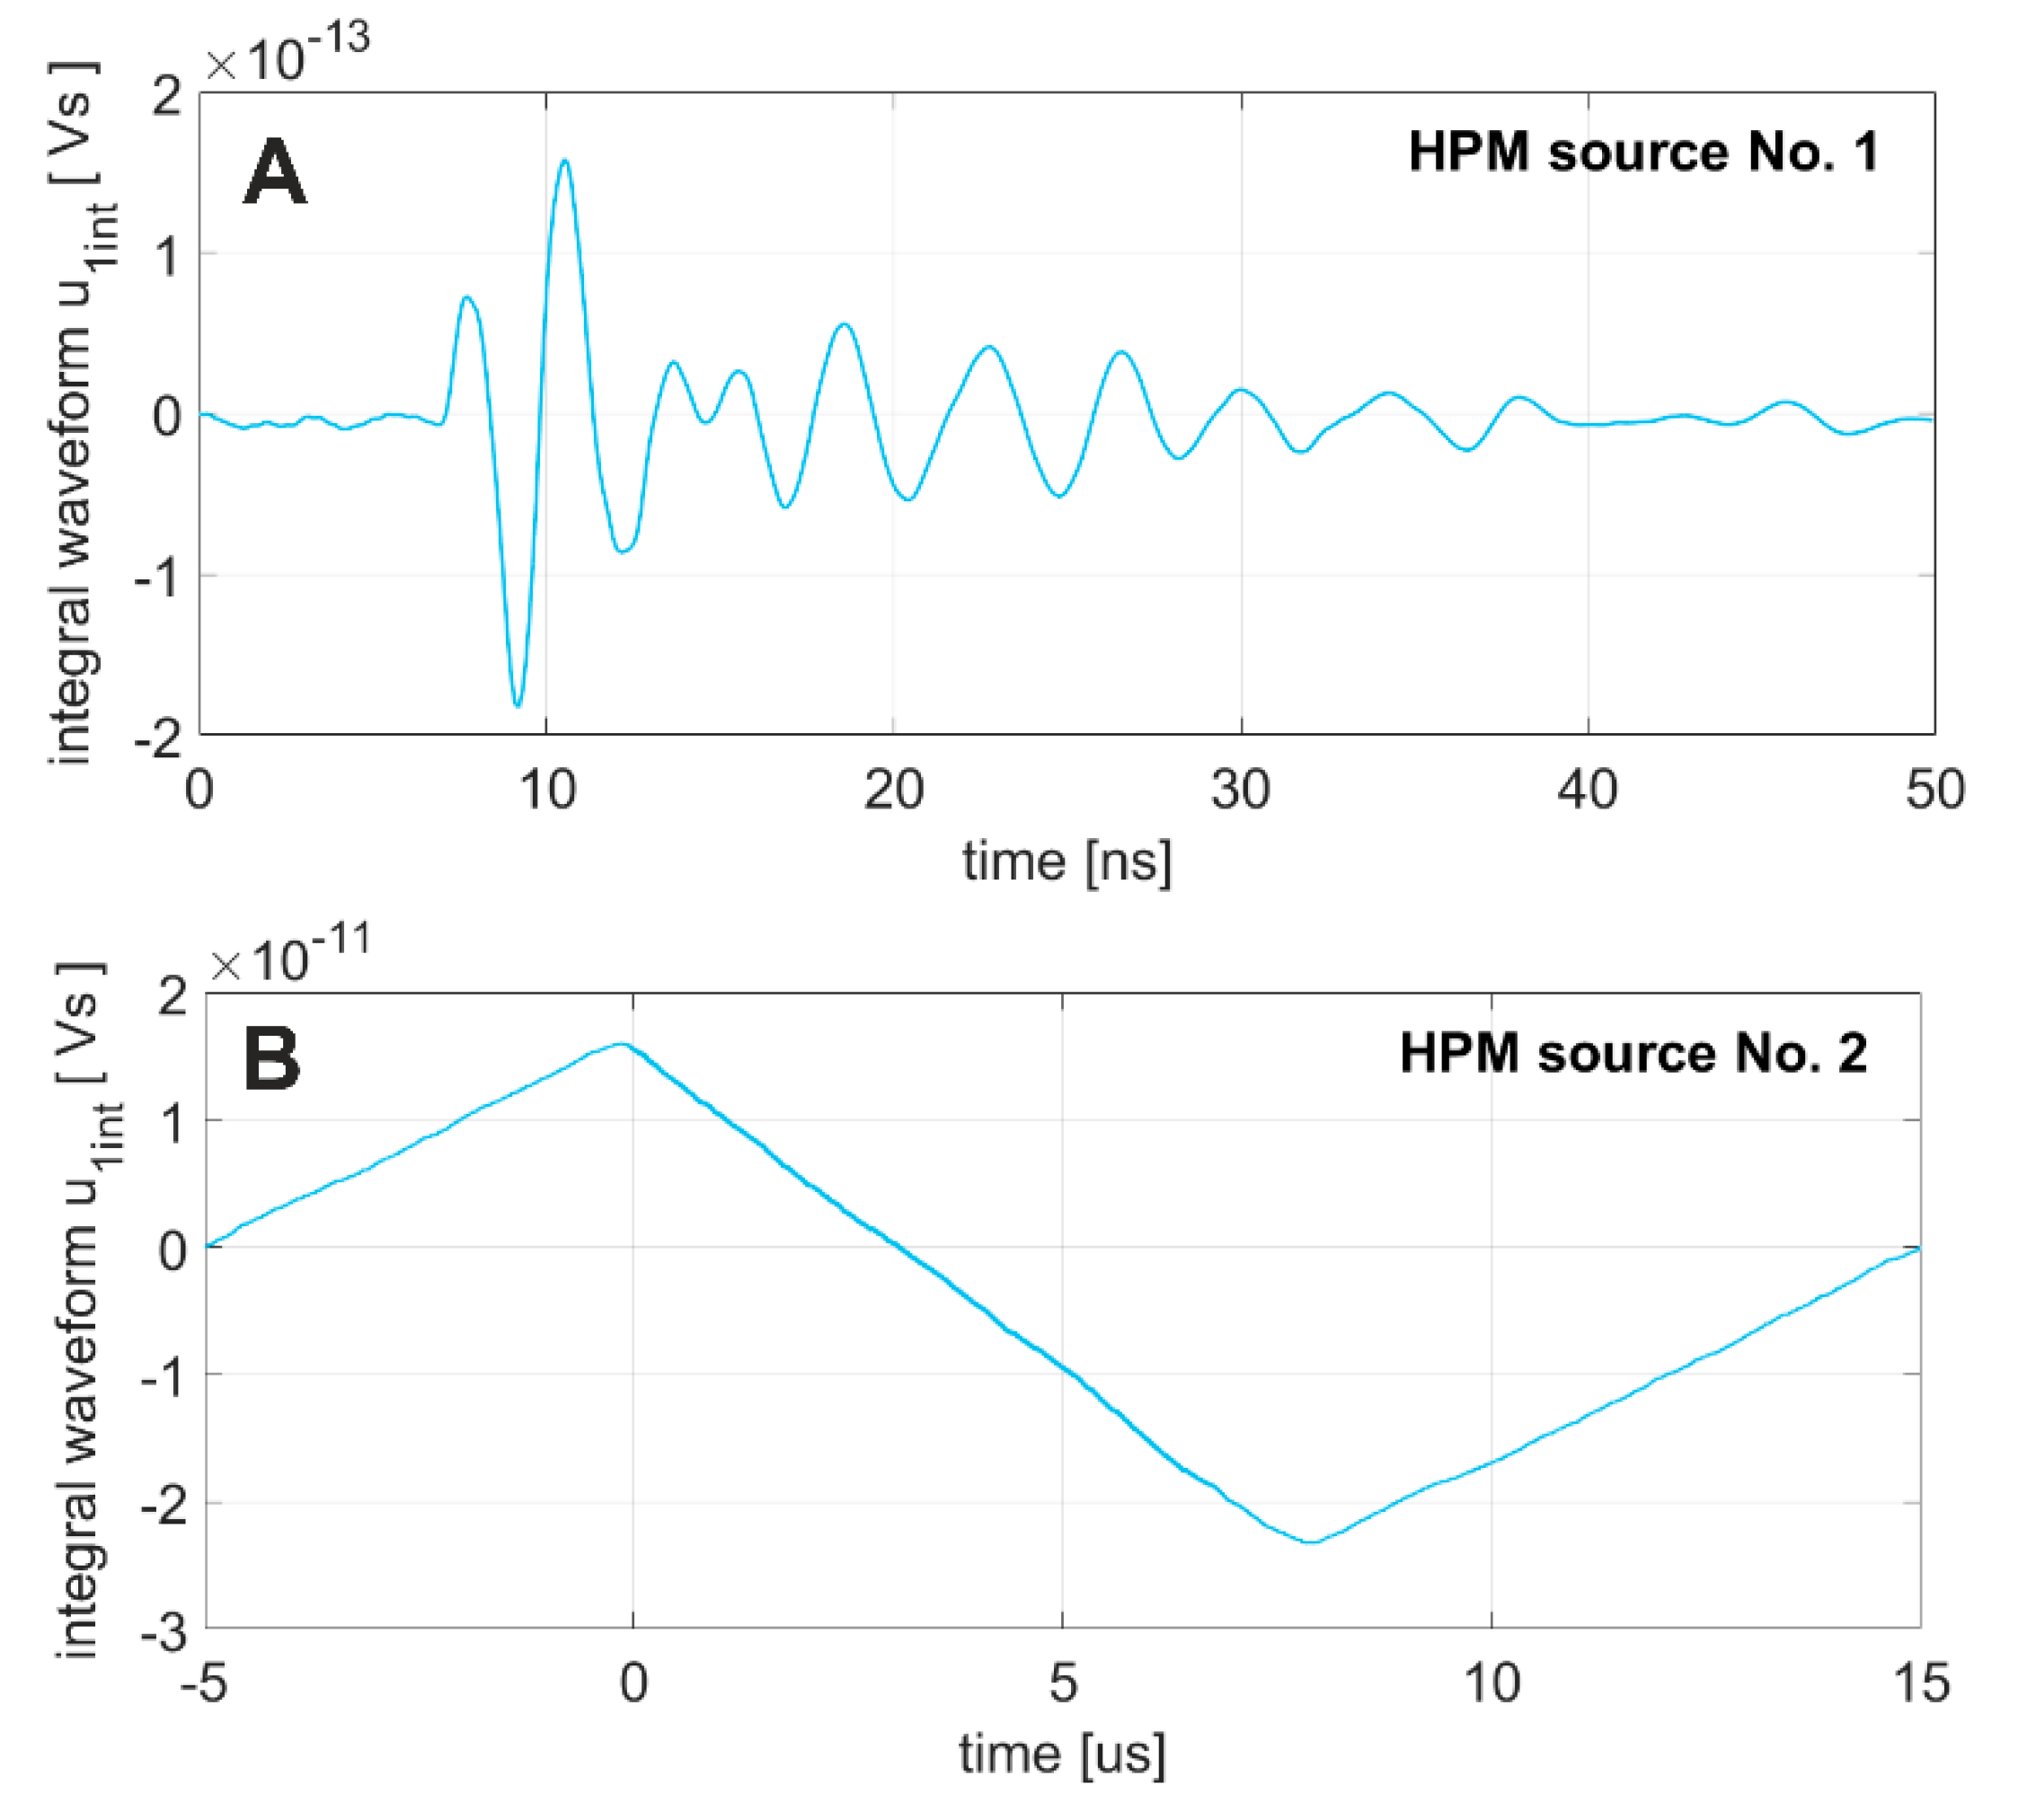
The recordings were conducted in an anechoic chamber, using two HPM sources, each with a different structure and time duration. The output voltage waveforms obtained from the analogue part of the measurement chain are shown in
Figure 4.
Each of those signals had a determined mean value
Uavg throughout the entire recording interval. The obtained values were −4.4 mV and 22.6 mV, respectively. The non-zero mean value indicated the possibility of an integral waveform trend, which is illustrated in
Figure 5.
It is clearly visible that the presence of a trend in a waveform with a short duration and a lower mean value is smaller, though it would still significantly hinder the determination of field parameters based on Equation (3). In contrast, in longer waveforms with a higher mean value, the trend distorts the integral waveform in an unacceptable manner.
5. Proposed Processing Methods
The simplest and most computationally-attractive attempt to remove the trend from the integral waveform is to discard the mean value from the input signal using its subtraction method. The outcomes of such processing relative to both analyzed signals are shown in
Figure 6.
It can be seen that in the case of the first waveform that such an operation ended in the desired outcome, whereas in the case of the second waveform, the only effect was obtained was a mean integral value that is close to zero, but its form still did not allow for assessment of the field waveform.
A more advanced method for limiting the impact of low-frequency parasitic components on a signal is the use of high-pass filtration. Due to the need to reconstruct an electric field, it is desirable to use a linear-phase filter for this purpose. This phase is guaranteed in the domain of digital signal processing by finite impulse response (FIR) filters. As part of a smaller research work, in order to obtain sufficiently high attenuation of parasitic signals with the assumed frequency below 80 MHz, a filter with an odd number of coefficients equal to 2001 was designed using the window method. The module with the obtained filter spectral transmittance is shown in
Figure 7.
The cut-off frequency of the filter was selected specifically to enable transferring of high-frequency components of both recorded signals; the standardized Fourier spectra are also shown for comparison in
Figure 7. The results of determining the integral waveforms after pre-processing using a designed filter are shown in
Figure 8.
This time, the obtained integral waveforms did not contain an undesirable trend in either case. However, this method had practical limitations due to the need to record hundreds of pulses and the computational complexity that was required for such rapid processing. The studies conducted using filtration through a traditional convolution algorithm show that, for a recording event covering a single pulse with a single record duration of 15 μs (composed of 125 k samples), the time necessary to complete filtration using an Intel Core i5 (Intel, Santa Clara, CA, USA) processor was 380 ms. A much better outcome was achieved by filtering within the frequency domain, i.e., determining the inverse Fourier transform from the product of the signal spectrum and filter coefficient sequence spectrum. Of course, the waveforms subjected to the operation of spectrum determination were extended appropriately in order to avoid distortions caused by the cyclical nature of such a convolution.
Table 1 summarizes, for comparison purposes, the average execution times of the preliminary filtration algorithm using both methods for a different number of pulses recorded in the
MultiRecord mode.
6. Conclusions
The presented material discusses the specificity of the digital processing of HPM/HPEM pulses measured by a traditional method. The basic required operation, arising from the D-dot sensor’s principle of operation, is integration. Execution of this operation requires pre-processing of the signals in order to minimize the trends resulting from the presence of low-frequency interference. Considering the variability of HPM/HPEM signals, we recommend high-pass filtration with a finite impulse response filter. In order to expedite filtration, especially in cases where a high number of pulses are repeatedly generated, its implementation should be based on using a relationship between the convolution operation and the product of the signal’s Fourier transform and FIR filter coefficient vector.
The proposed measuring device is very attractive; however, care must be taken as there are some potential shortcomings connected with its usage. Firstly, the D-dot sensor is a metal plate, and as such, it disturbs the distribution of the field being tested. However, with high-strength HPM/HPEM phenomena, which is the most frequent case, such distortions can be ignored. In addition, the polarization of the field, which is not known in advance when a generator is used as an offensive weapon in terrorist or military attacks, can cause issues in measurement. The proposed measuring chain and signal processing assumes that the polarization is known and fixed. As a result, the method fails when the polarization is opposite to what is expected or circular. Using another sensor with orthogonal orientation can solve this problem; however, a quite different, more advanced, signal processing method should be worked out for this purpose. However, in many cases, this issue is not as serious, as there are many tasks connected with HPM/HPEM measurement, where the objective is to quantitatively describe attenuation of electromagnetic shielding provided by dedicated enclosures made of materials of sufficient transmission loss. In these kinds of measurements, generators with fields of known polarization are usually used.


