1. Introduction
The importance of soil to plants is undeniable since soil provides plants with all the nutrition they need to grow. The intimate relationship between plant and soil starts from imbibition where the dry seed thermodynamically takes water from the soil, hydrates its embryo, and activates its metabolism. The proper growth of embryos is important since it ensures the establishment of root systems and leads to successful germination [
1,
2]. Many factors can contribute to imbibition such as soil moisture, soil structure, pericarp permeability [
3], and environment temperature [
4]. Farmers and researchers in agriculture study different recipes of the factors to improve imbibition, and thus quantitatively evaluating imbibition is critical for their goal.
In an experiment performed by the Iowa State University, 125,000 soybean seeds were planted on an acre of land. When the soybeans were harvested months later, only a total of 93,000 plants were collected [
5]. This experiment demonstrates the fact that the ratio of seeds planted to plants harvested is not 1:1. Because of the unlikelihood that every planted seed will germinate, the United States Department of Agriculture (USDA) requires that all commercially sold seeds to contain a tag that includes germination percentage, which is the average amount of seeds that will germinate in the package [
6]. A primary reason for the inability of seeds to germinate is due to poor environmental conditions. Since imbibition is an essential process in which embryo hydration and root establishment occur. The ability to monitor this process would allow agriculturalists to maximize efficient growing environments, such as temperature, humidity, and nutrition levels. Furthermore, the preliminary stages of germination are intriguing from a biological viewpoint because they are the foundation of the plant’s future development [
7].
Previously, the measurement of seed growth rate due to imbibition has been attempted through the utilization of imaging [
1,
8,
9,
10]. These methods include camera imaging, 3D X-ray imaging, 3D Magnetic Resonance Imaging (MRI), 2D passive thermography, and 2D bio-speckle imaging [
8]. Image-based techniques for imbibition detection are favorable because no physical contact with the seed is required, preventing invasion of the growing environment. However, these methods do not provide an accurate systematic quantitative analysis, due to interference from the residing soil. Furthermore, some of these imaging techniques are only possible on seeds with cork shell surroundings [
8]. This is not a trait that can be found in all species of seeds. Additionally, from the perspective of system design, another important drawback of imaging methods is the high system power consumption.
Another, more direct, process to measure seed imbibition requires recording either the weight or length of the seedling as time progresses [
11,
12]. This is an accurate way to track seed growth but requires removing the seed from its environment for each measurement. In doing so, the sprouting of the seed is impacted each time the growing environment is invaded. A seed growing solely in water can be measured in this manner, but the removal of a plant from the soil is much more of a delicate process.
The proposed solution is a system that can measure imbibition based on the size of the subject seed, while also being able to remain beneath the seeds’ residing soil while measuring. Doing so combines both the accuracy of physical measurement with the lack of invading the seed environment. The seed of interest is placed in a small probe containing a Force Sensing Resistor (FSR) [
13] and a coil spring. The probe, shown in Figure 1 is designed such that the surrounding soil can contact the seed but not contact the spring. As imbibition occurs, the seed begins to enlarge, which compresses the spring and decreases the resistance of the FSR. The proposed circuit introduces a novel technique that is based on using General Purpose Input Output (GPIO) pins of a microcontroller and provides reconfiguration by switching them between supply voltage and ground. The electronic circuit output is connected to a microcontroller that uses an Analog-to-Digital Converter (ADC) to determine the resistance of each FSR at regular time intervals. The recorded data are saved in an external micro-SD card. The microcontroller used includes an embedded Bluetooth module that can establish a connection with a smartphone or computer to transmit the recorded data.
This article presents a new solution to measure the imbibition and germination of maize seeds relying on the size change. First, the details of the proposed system are introduced in
Section 2, while elaborating on the novelty of the sensing front end and circuit design.
Section 3 presents the calibration process of the measuring probes using 3D-printed cuboids.
Section 4 provides a comparison and results of the proposed circuit against other traditional designs. Finally,
Section 5 concludes this work.
2. Proposed System Design
The proposed system uses Commercial Off-the-Shelf (COTS) components to convert the size of an object to pressure, and then to resistance. The varying resistance alters a related analog voltage, which is finally converted to a digital code. The size of the target object is estimated by applying coil spring pressure and measuring the produced force. Larger objects provide more exerted force. The resulting force is then converted to a resistance using an FSR. Using the proposed novel circuit design, the resistance value of the FSR can be represented by an analog voltage. This voltage is then converted to a digital code using an ADC. A selected microcontroller, which is the ESP32, stores the represented digital data into a micro-SD card, which can then be accessed using a request from any Bluetooth-enabled device.
The target object used in this system is the maize seed. The proposed sensing system aims to monitor the imbibition of maize seeds in soil or water. The developed system, shown in
Figure 1, consists of a sensing front-end (probes and FSRs), an electronic circuit that utilizes the proposed technique, a microcontroller, and a data receiver device that has Bluetooth capabilities (e.g., smartphone).
2.1. The Proposed Circuit Design
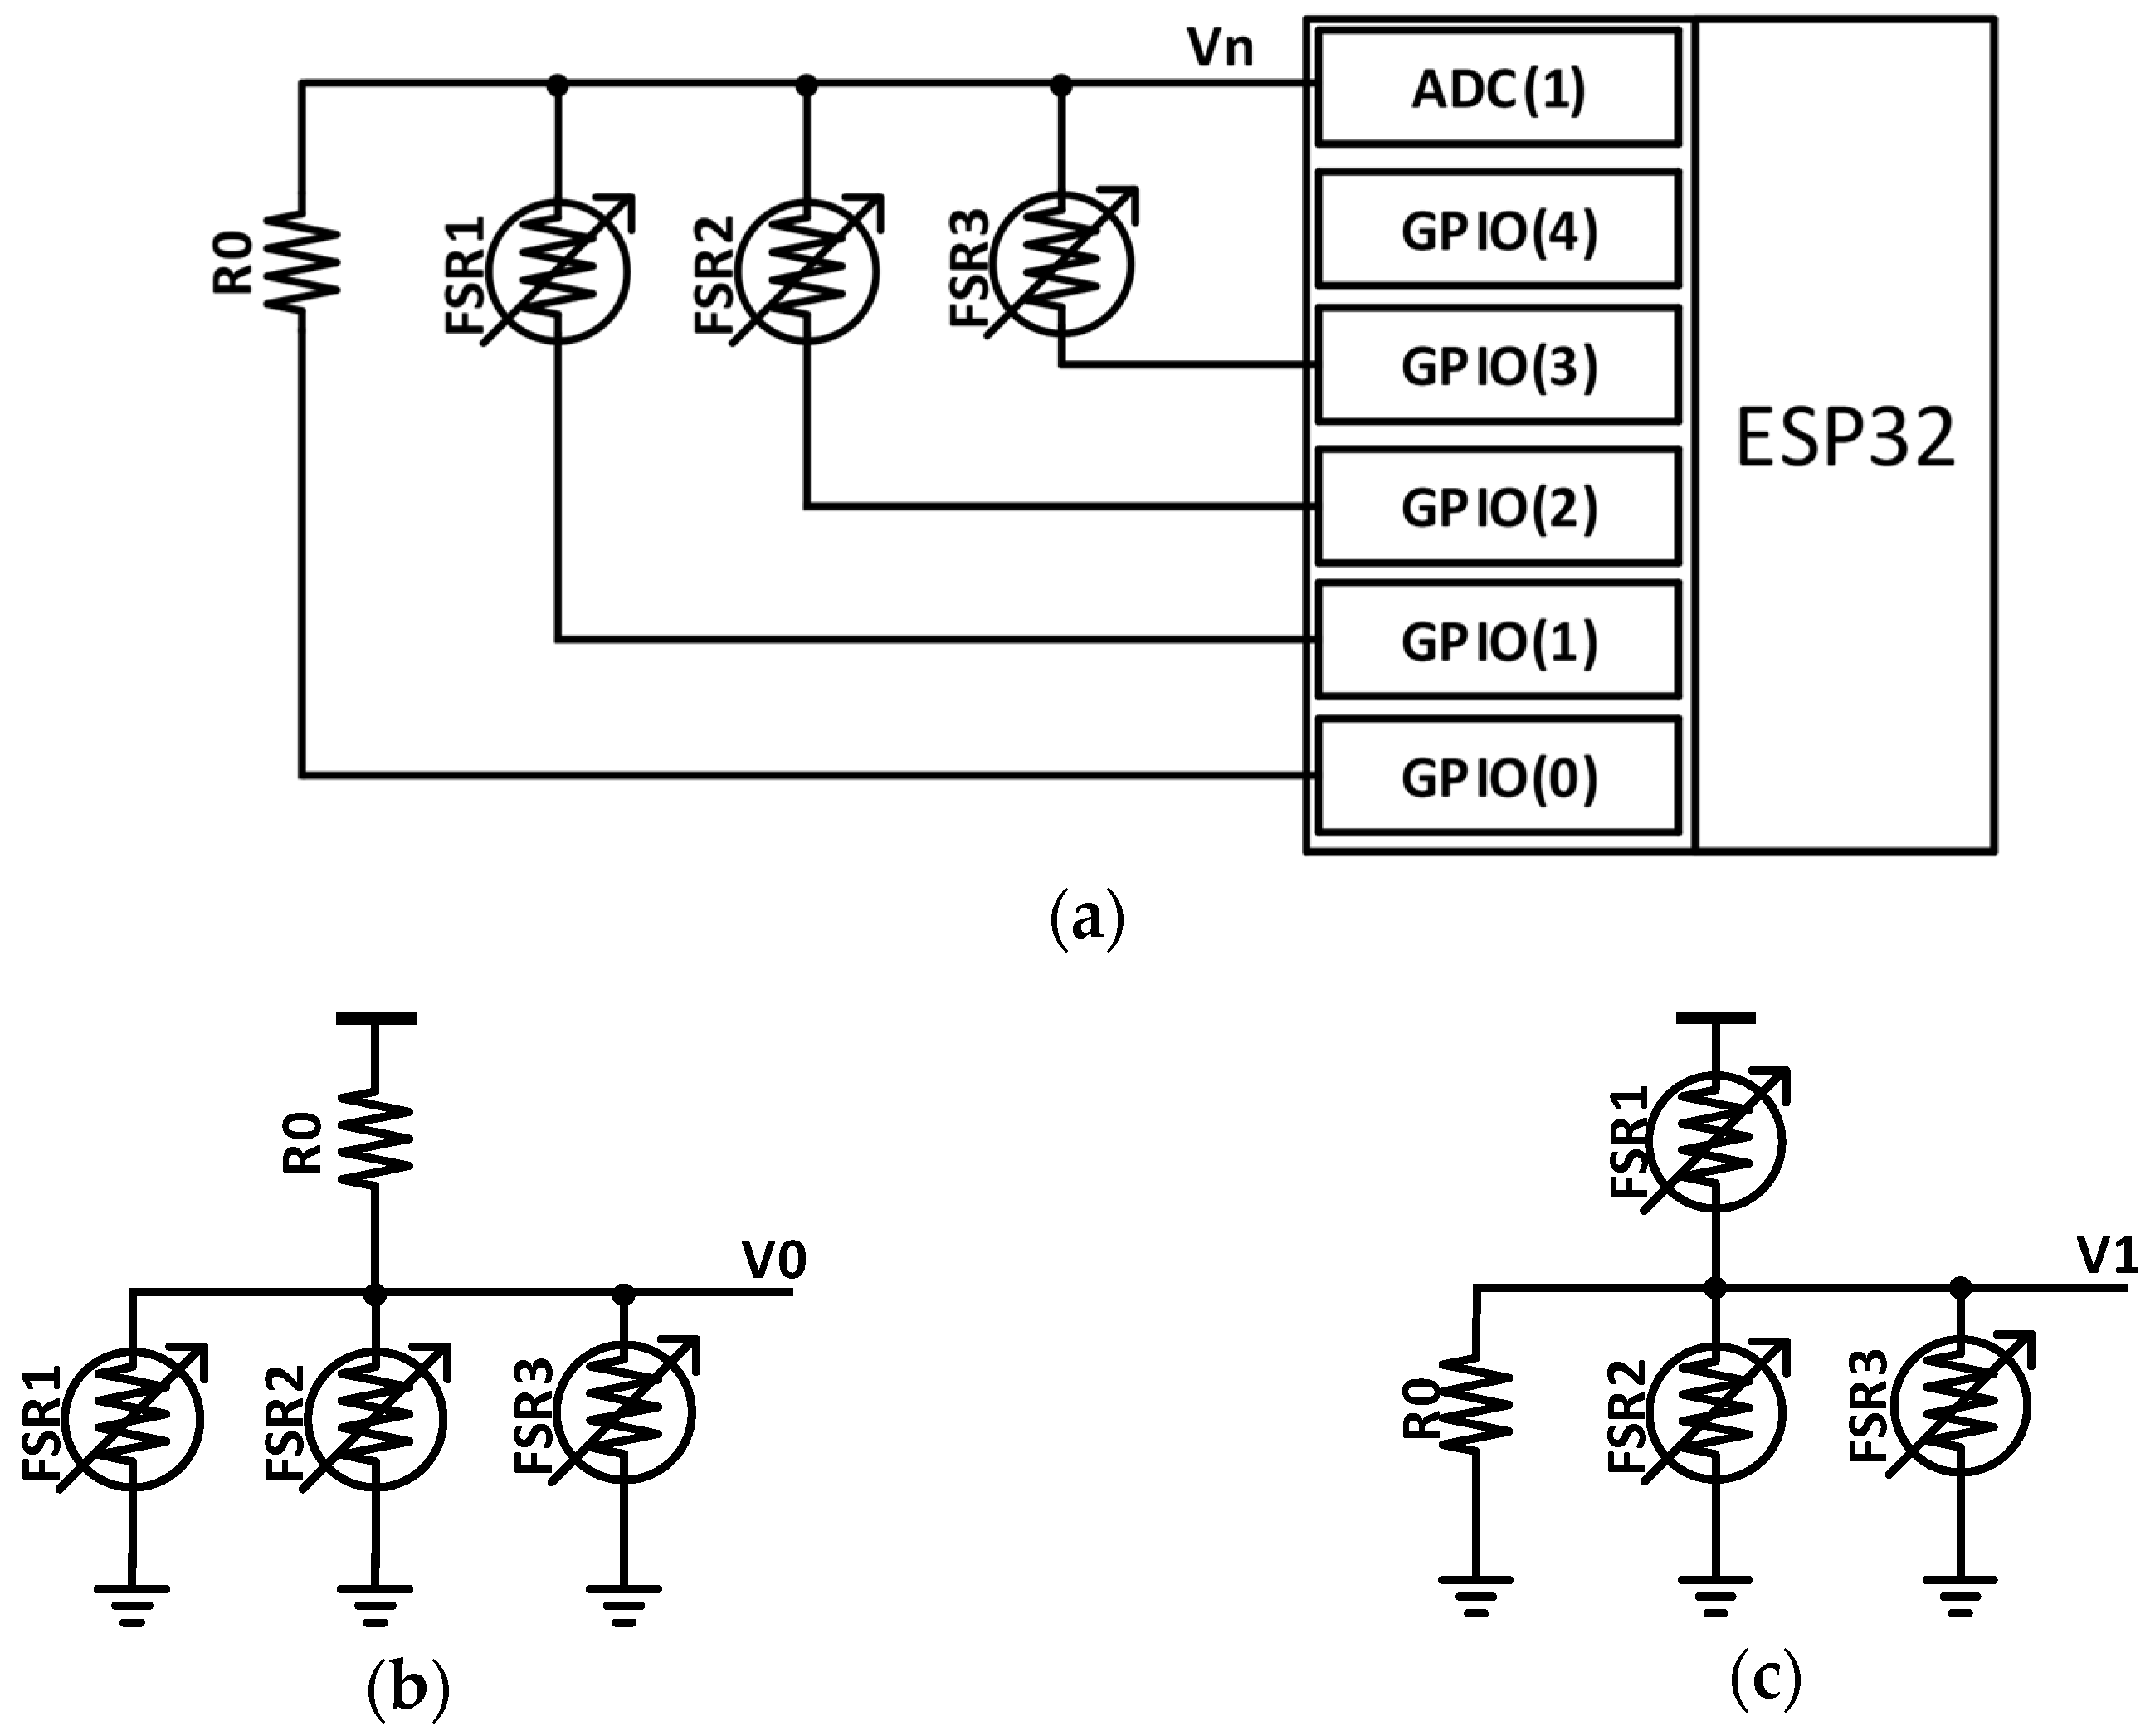
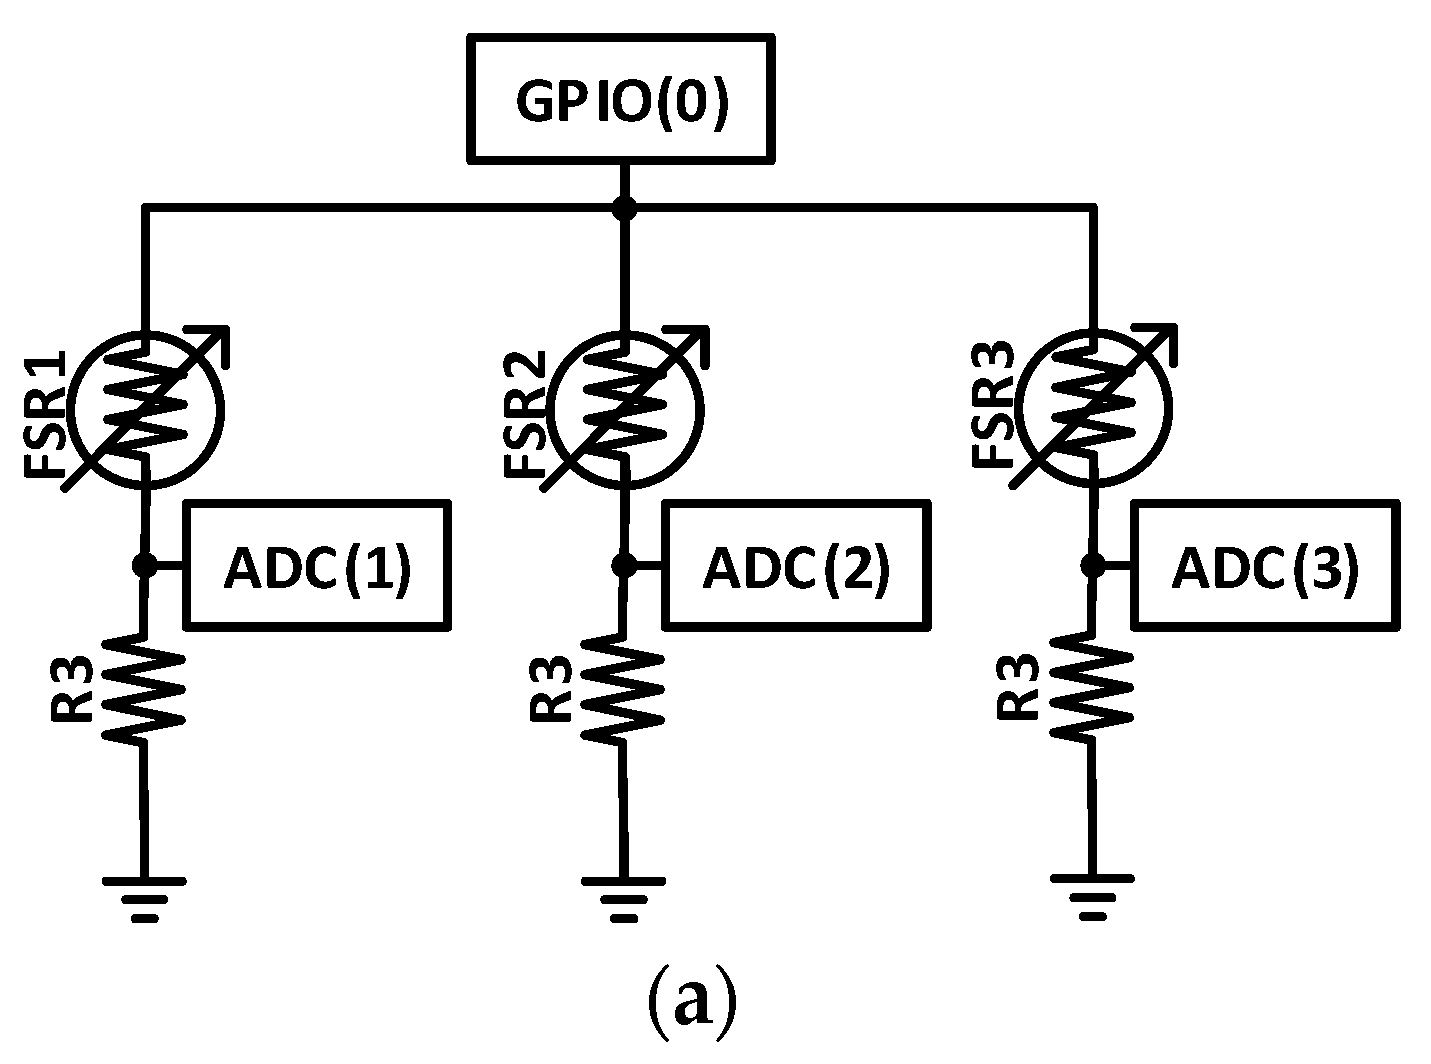
The proposed circuit design is optimized to measure the size of multiple objects by utilizing the GPIO pins of the microcontroller to shape different connection configurations of high (3.3V Voltage Supply (VDD)) or low (Ground (GND)). A connected example of the system is shown in
Figure 2a, any number (N) of FSRs (e.g., N = 3 FSRs), and one constant resistor (R0) are connected from their first terminals to different GPIO pins, while their other terminals are connected to the ADC pin. In this technique, the GPIOs are used instead of power gated transistors to control the power supply of the system without adding any external components (e.g., Metal-Oxide-Semiconductor Field-Effect Transistors (MOSFETs) or Bipolar junction transistors (BJTs)).
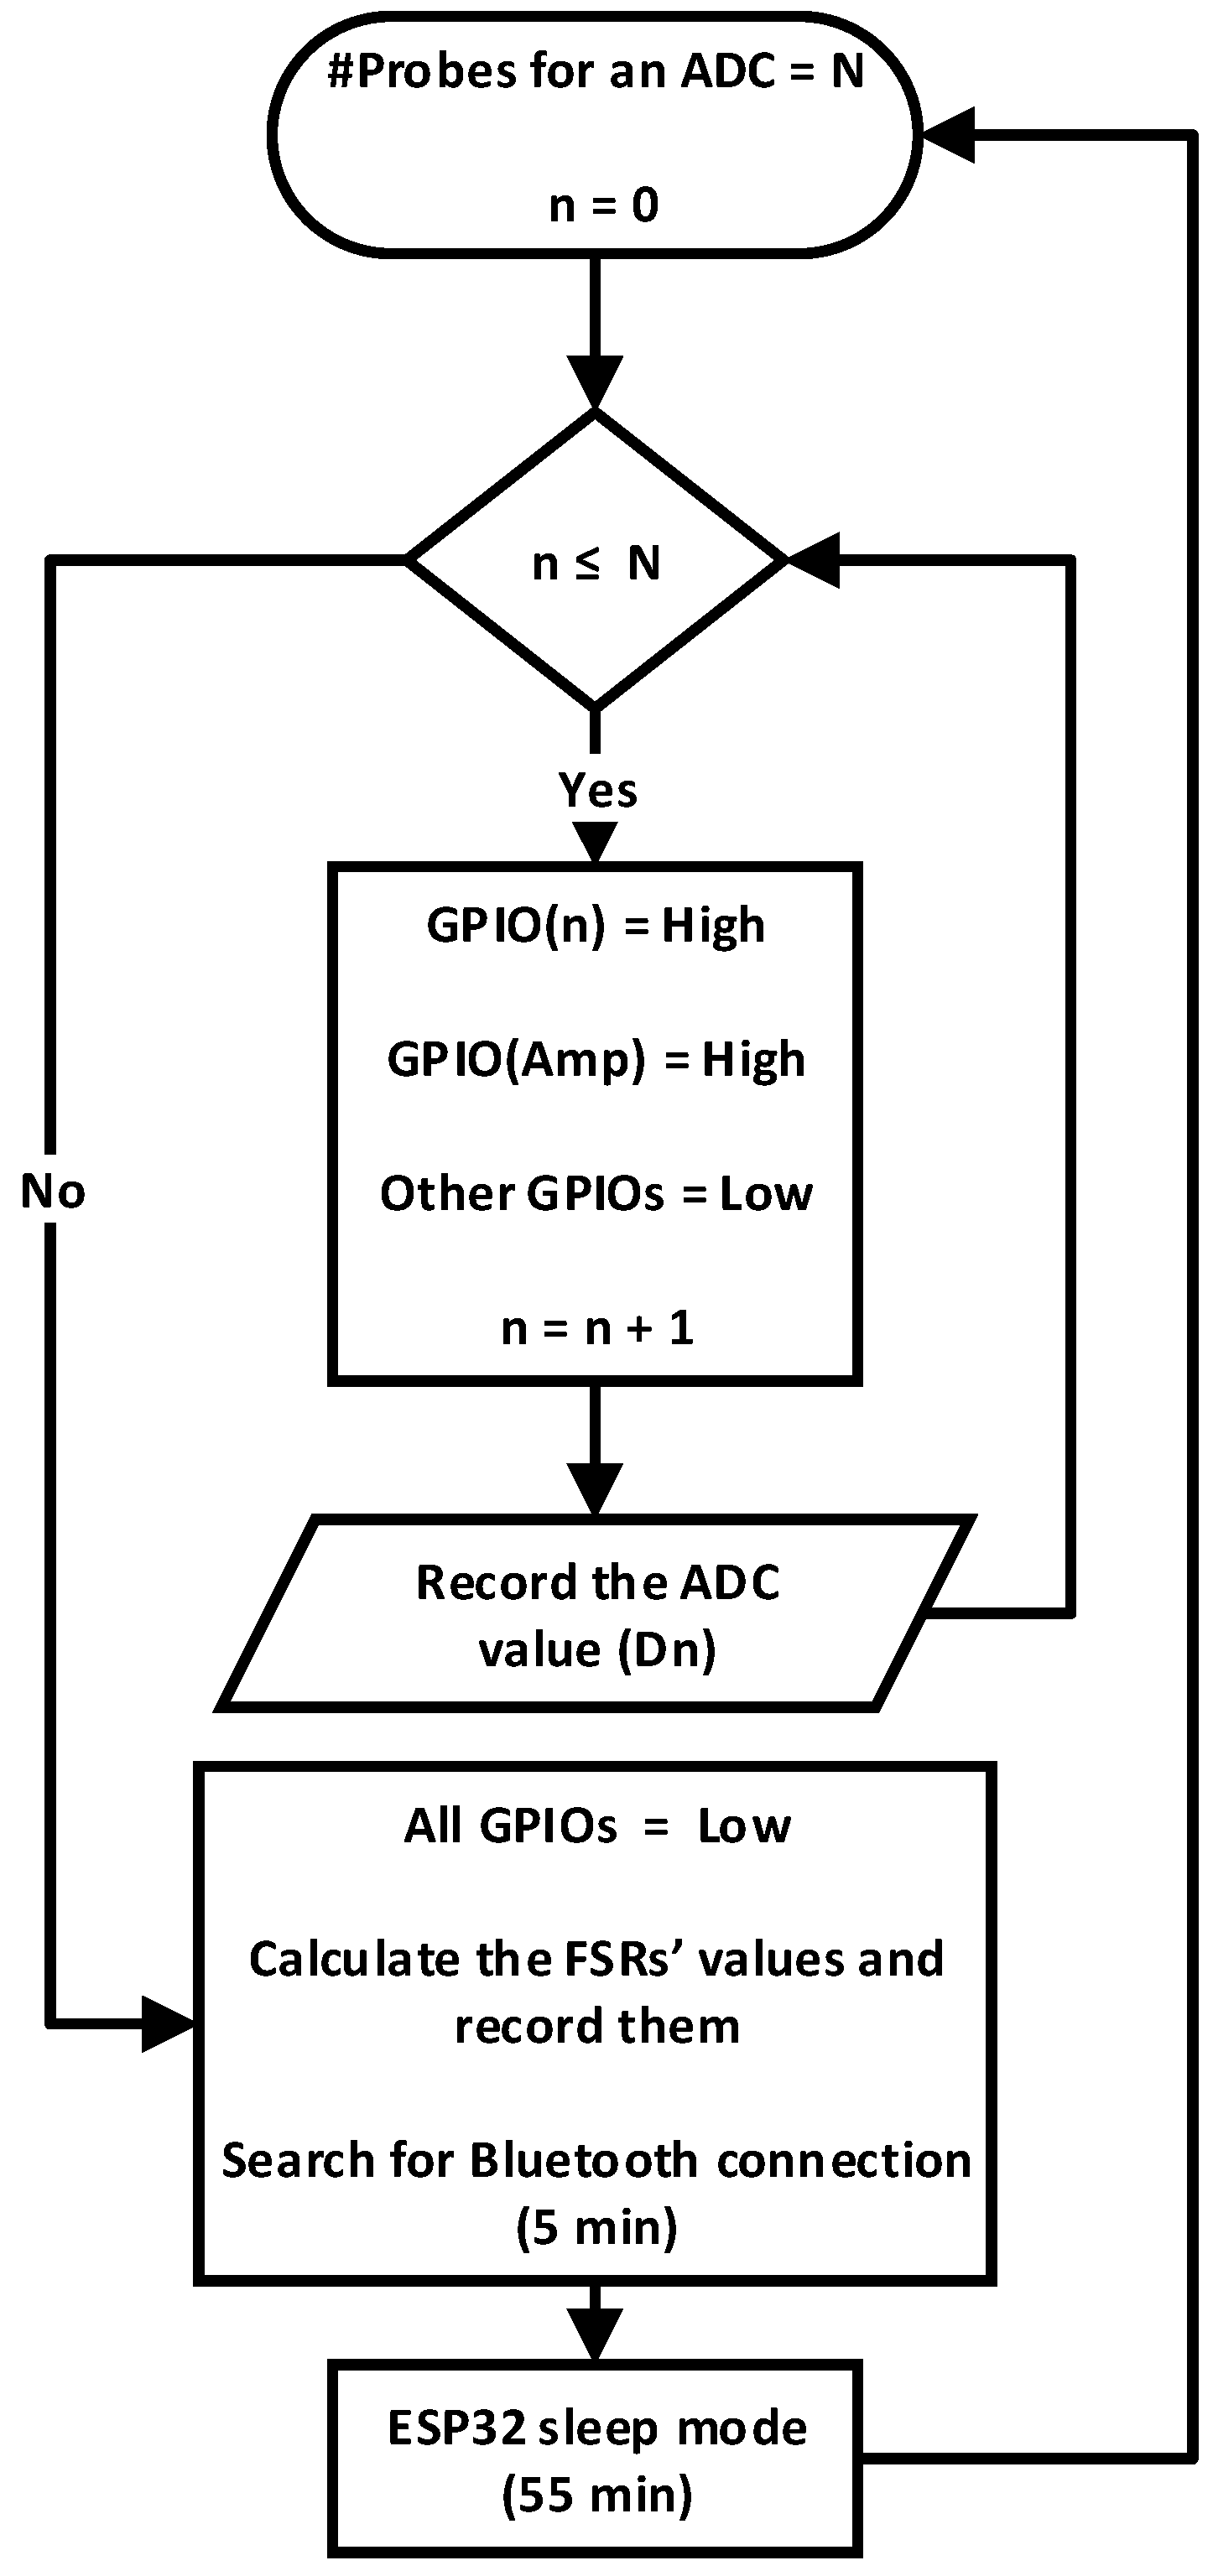
In the beginning, all GPIOs are set to low, ensuring zero absorption of current from the microcontroller. As the system is optimized to take one measurement set every hour, this method decreases the power consumption of the system significantly. During the measurement phase, GPIO(4) is switched high for the complete measurement period to supply the amplifier. Each GPIOs(0–3) is then successively switched to high momentarily, and then returns to low. This allows ADC(1) to get different readings according to each configuration. First, GPIO(0) is set to high and GPIOs(1–3) remain low, making R0 connected to VDD while the FSRs are connected to GND. The connection of this configuration is like that of
Figure 2b. The value of V0 is then read by the ADC(1) as digital code D0. The flowchart of the complete process is shown in
Figure 3.
Second, GPIO(1) is set to high and GPIOs(0,2,3) are set to low, making only FSR1 is connected to VDD, as shown in
Figure 2c. The value of any FSR can be calculated using Equation (1), which is derived in
Appendix A, using the constant resistor value (R0), the ADC value when GPIO(0) is high (D0)
, and the ADC value when GPIO(n) is high (Dn), where n = 1, 2, 3,..., N.
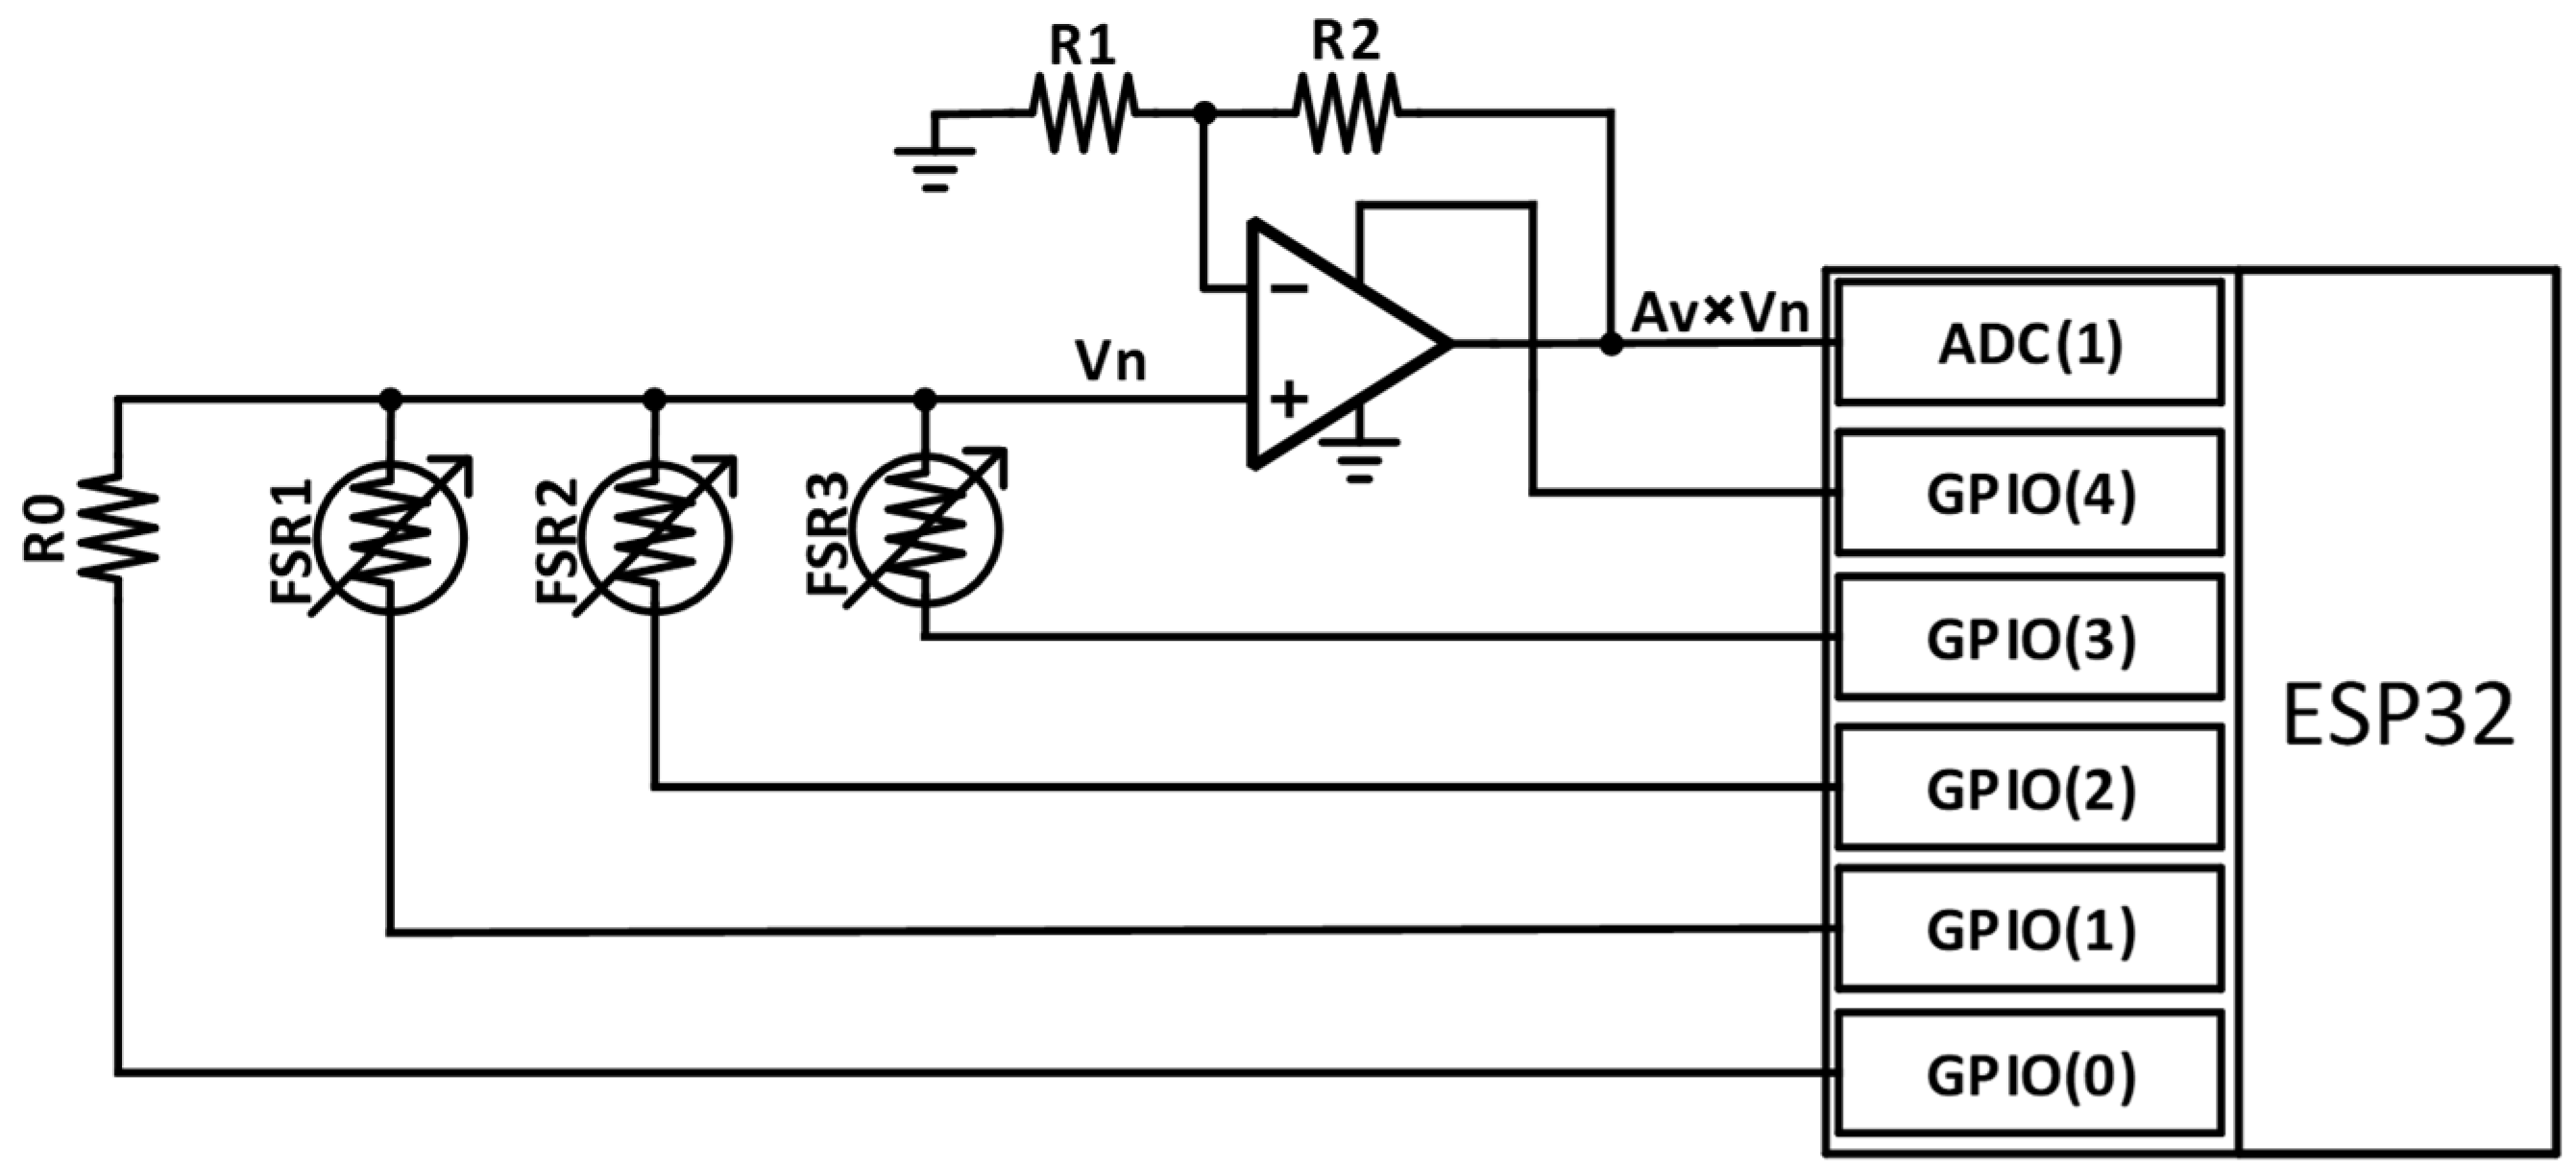
If the number of FSRs (N) is significantly large, then their parallel equivalent value will be very small leading to a decreased range of voltage Vn, which is read by the ADC. Subsequently, this can reduce the resolution of the measured FSR values. Adding a low-power non-inverting amplifier to the proposed method, as shown in
Figure 4, can help in stretching the Vn values to a wider voltage range that gives more accurate readings especially for low FSR values. Assuming that all FSRs and R0 are nearly equivalent in a consistent system, then the value of Vn is ~VDD/(N + 1). Amplifying the Vn signal, using a non-inverting amplifier, helps in increasing the resolution of the data collected by the ADC. Ideally, in the previously mentioned situation, the amplifier voltage gain (Av) can be set to N or N + 1. However, R0 does not change with other FSRs, and the FSR values have not to be exactly consistent as the seeds increase in size. Thus, it is better to set the amplifier gain to Av = ~N/2, which prevents the amplifier output from exceeding the ADC maximum level. The amplifier power supply is also connected to GPIO pin to power it on while measuring the FSR values.
An important advantage of the proposed system can be noticed from Equation (1), that FSRn values are not affected by the supply voltage as it affects both V0 and Vn evenly, and the value of each FSR can be directly calculated from the digital ADC readings (D0 and Dn) with the value of R0. Additionally, after adding the amplifier, its gain (Av) does not affect the calculations of FSRn, and Equation (1) is still valid as described in
Appendix A.
2.2. Sensing Front-End
The sensing front-end consists of a probe that holds a seed and a FSR sensor. The probe is designed to meet the size requirements of the growing seed, while not restricting the growth of the seed or affecting the surrounding environment. The probe design, shown in
Figure 5a, is left as open as possible to ensure that the corn seed is in contact with as much of its environment. The probe is also designed to contain and protect the compressing spring from soil particles by surrounding it in two moving cylinders, as shown in
Figure 5b. Moreover, instead of placing the seed between the cylinder and the FSR, the cylinder is placed between the FSR and the seed. This arrangement ensures that the force applied on the FSRs is distributed equally by the cylinder’s flat surface and eliminates any deviations caused by different shaped seeds, as shown in
Figure 5a.
The finalized probes are manufactured using a Formlabs Form 3 SLA Resin 3D printer [
14]. The printer utilizes a Stereolithography Apparatus (SLA) to shine a light on a synthetic resin polymer [
15]. This creates a photochemical reaction that solidifies the liquid resin with 25 µm precision. The manufacturing time for a set of four probes (each containing three parts) is roughly 12 h.
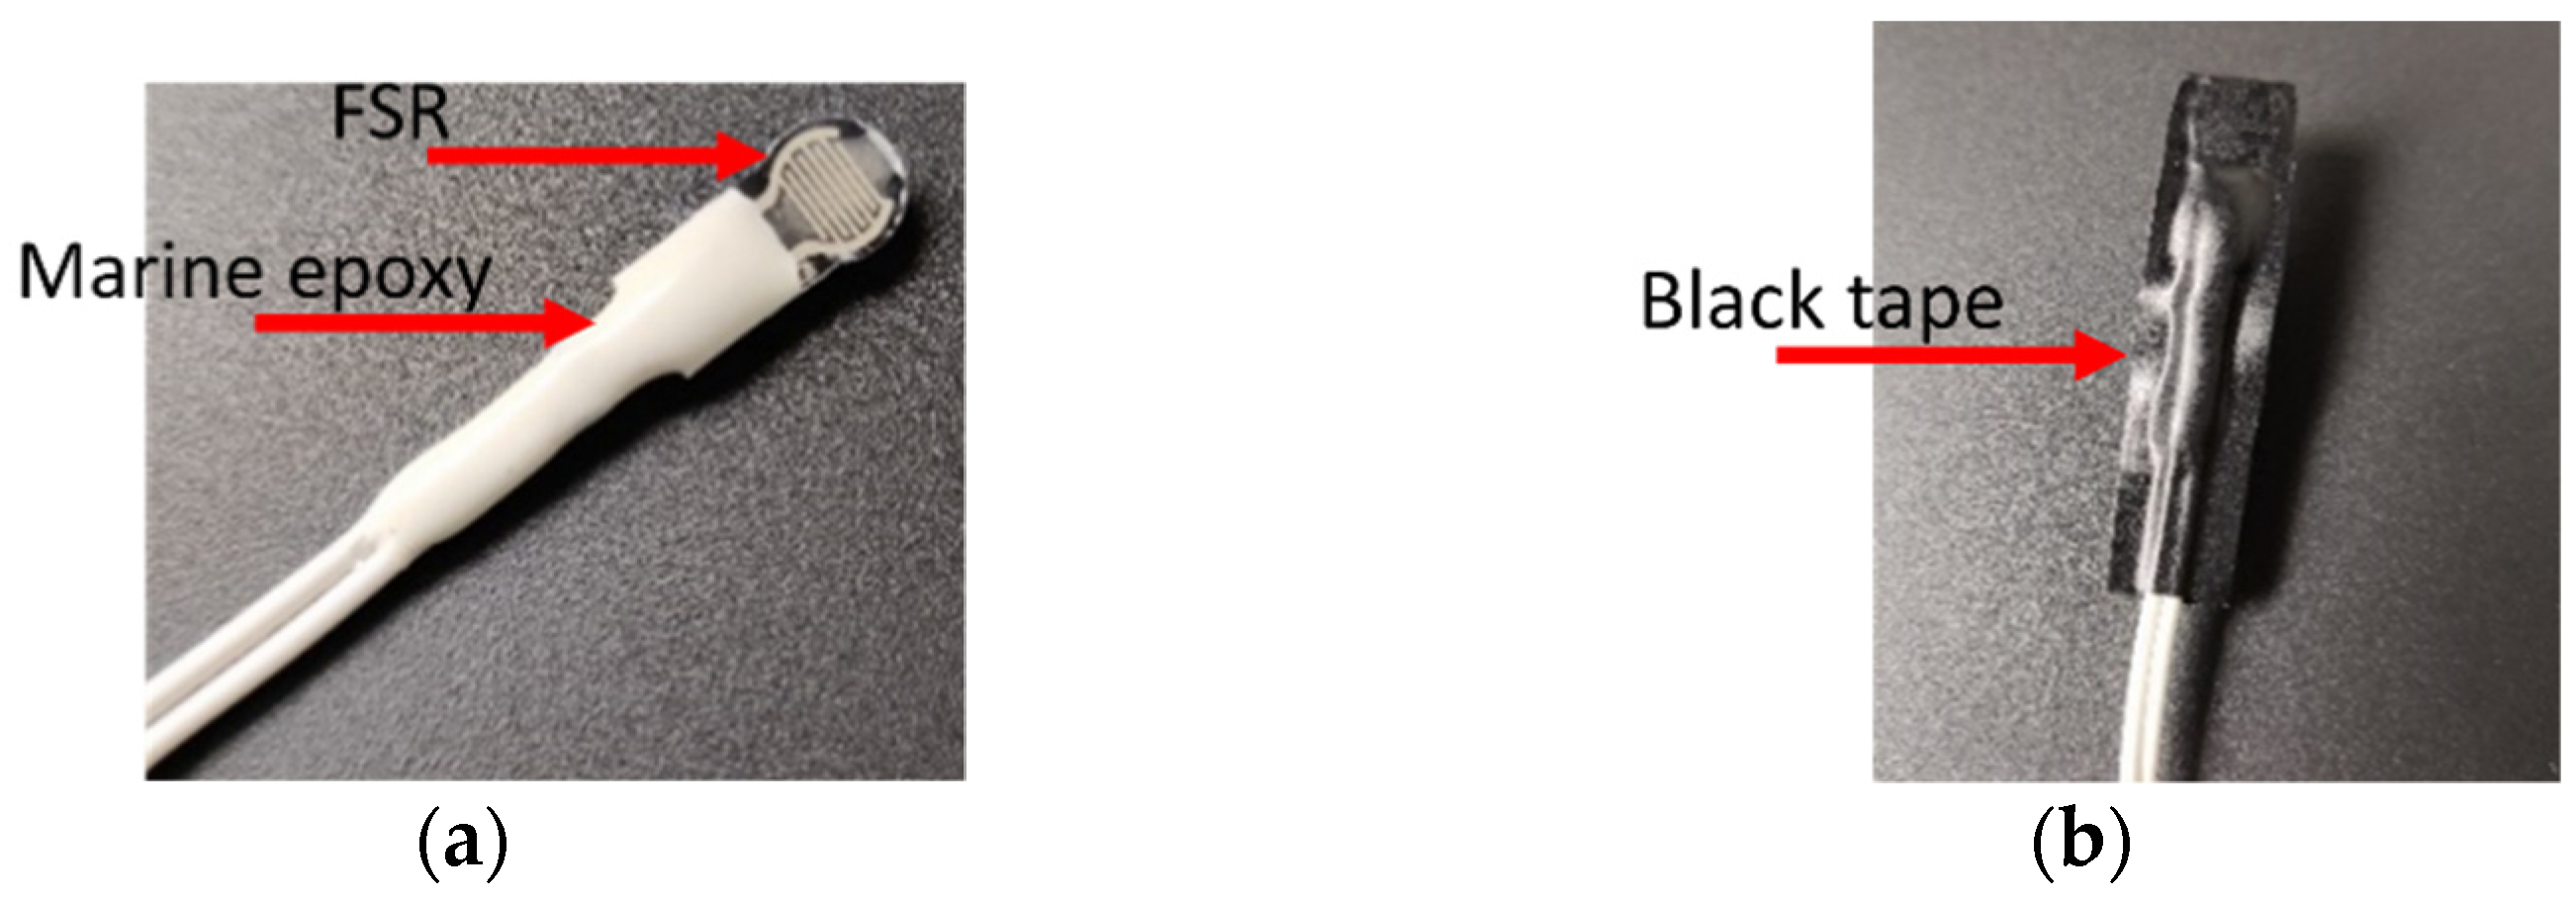
The FSR is used to translate the applied force on it, which expresses the seed size, to a resistance that can be measured in an electronics system. Because the sensing front-end is immersed in water or wet soil, the FSR must be protected or isolated appropriately. The FSR wiring terminals are coated with waterproof marine epoxy [
16] and the FSR sensing part is covered by a black electrical tape to isolate the FSR surface from water, as shown in
Figure 6.
Some samples of two types of maize seeds (burpee sweet corn and yellow popcorn seed) are planted in soil and grow until the seeds are sprouted above the soil. The observation of this test showed that the seeds are growing from the minimum thickness of ~4 mm to the maximum thickness of about 12 mm. Recording the size boundaries of the seeds helps in determining the suitable dimensions for designing the probe since the difference between the maximum and minimum thickness, which is about 8 mm, provides the maximum compression amount that the cylinders containing the coil spring should be able to handle. Additionally, the size of the seeds contributes to selecting the length of the coil spring to be 20 mm.
2.3. ESP32 Microcontroller
An ESP32 is utilized as the microcontroller for the proposed design because of its integrated Bluetooth capabilities [
17]. Numerous previous systems utilize the ESP32 as a controller due to its various features and capabilities [
18]. For this design, an ESP32 DEVKITV1 development board is used for simplicity. The board consists of 30 pins, including 25 GPIO pins and 15 ADC pins across two channels, and operates on a voltage range of 2.2 V–3.6 V. The ESP32 ADCs have a 12-bit resolution, which allows for very accurate voltage measurements. For a group of N seeds to be measured, it is at least required to use (N + 2) GPIO pins and an ADC.
When the ESP32 alone is operating in active mode, upwards of 260 mA is consumed from the power supply [
17]. However, active mode operation is only required when the seeds are being measured, which is once every 1 h, and when the recorded data are being transmitted. While none of the ESP32′s features are being used, the microcontroller enters deep sleep mode, powering off all unnecessary features. In deep sleep mode, the ESP32 only requires 10 µA [
17], which greatly diminishes the overall circuit’s power consumption.
Using the “SD.h” Arduino library and a micro-SD TF card adaptor, an external 1 Gigabyte micro-SD card can be used to store the recorded data. The digital codes (Dn) that represent the measured voltages from the ADC are first used to determine the resistance value of each FSR using Equation (1). The resistance value is then written to a text file, along with a string name to organize each value with its respective FSR. Once the file is appended, it is transferred to the micro-SD card until another measurement is made or a Bluetooth pull request occurs.
2.4. Data Transmission via Bluetooth
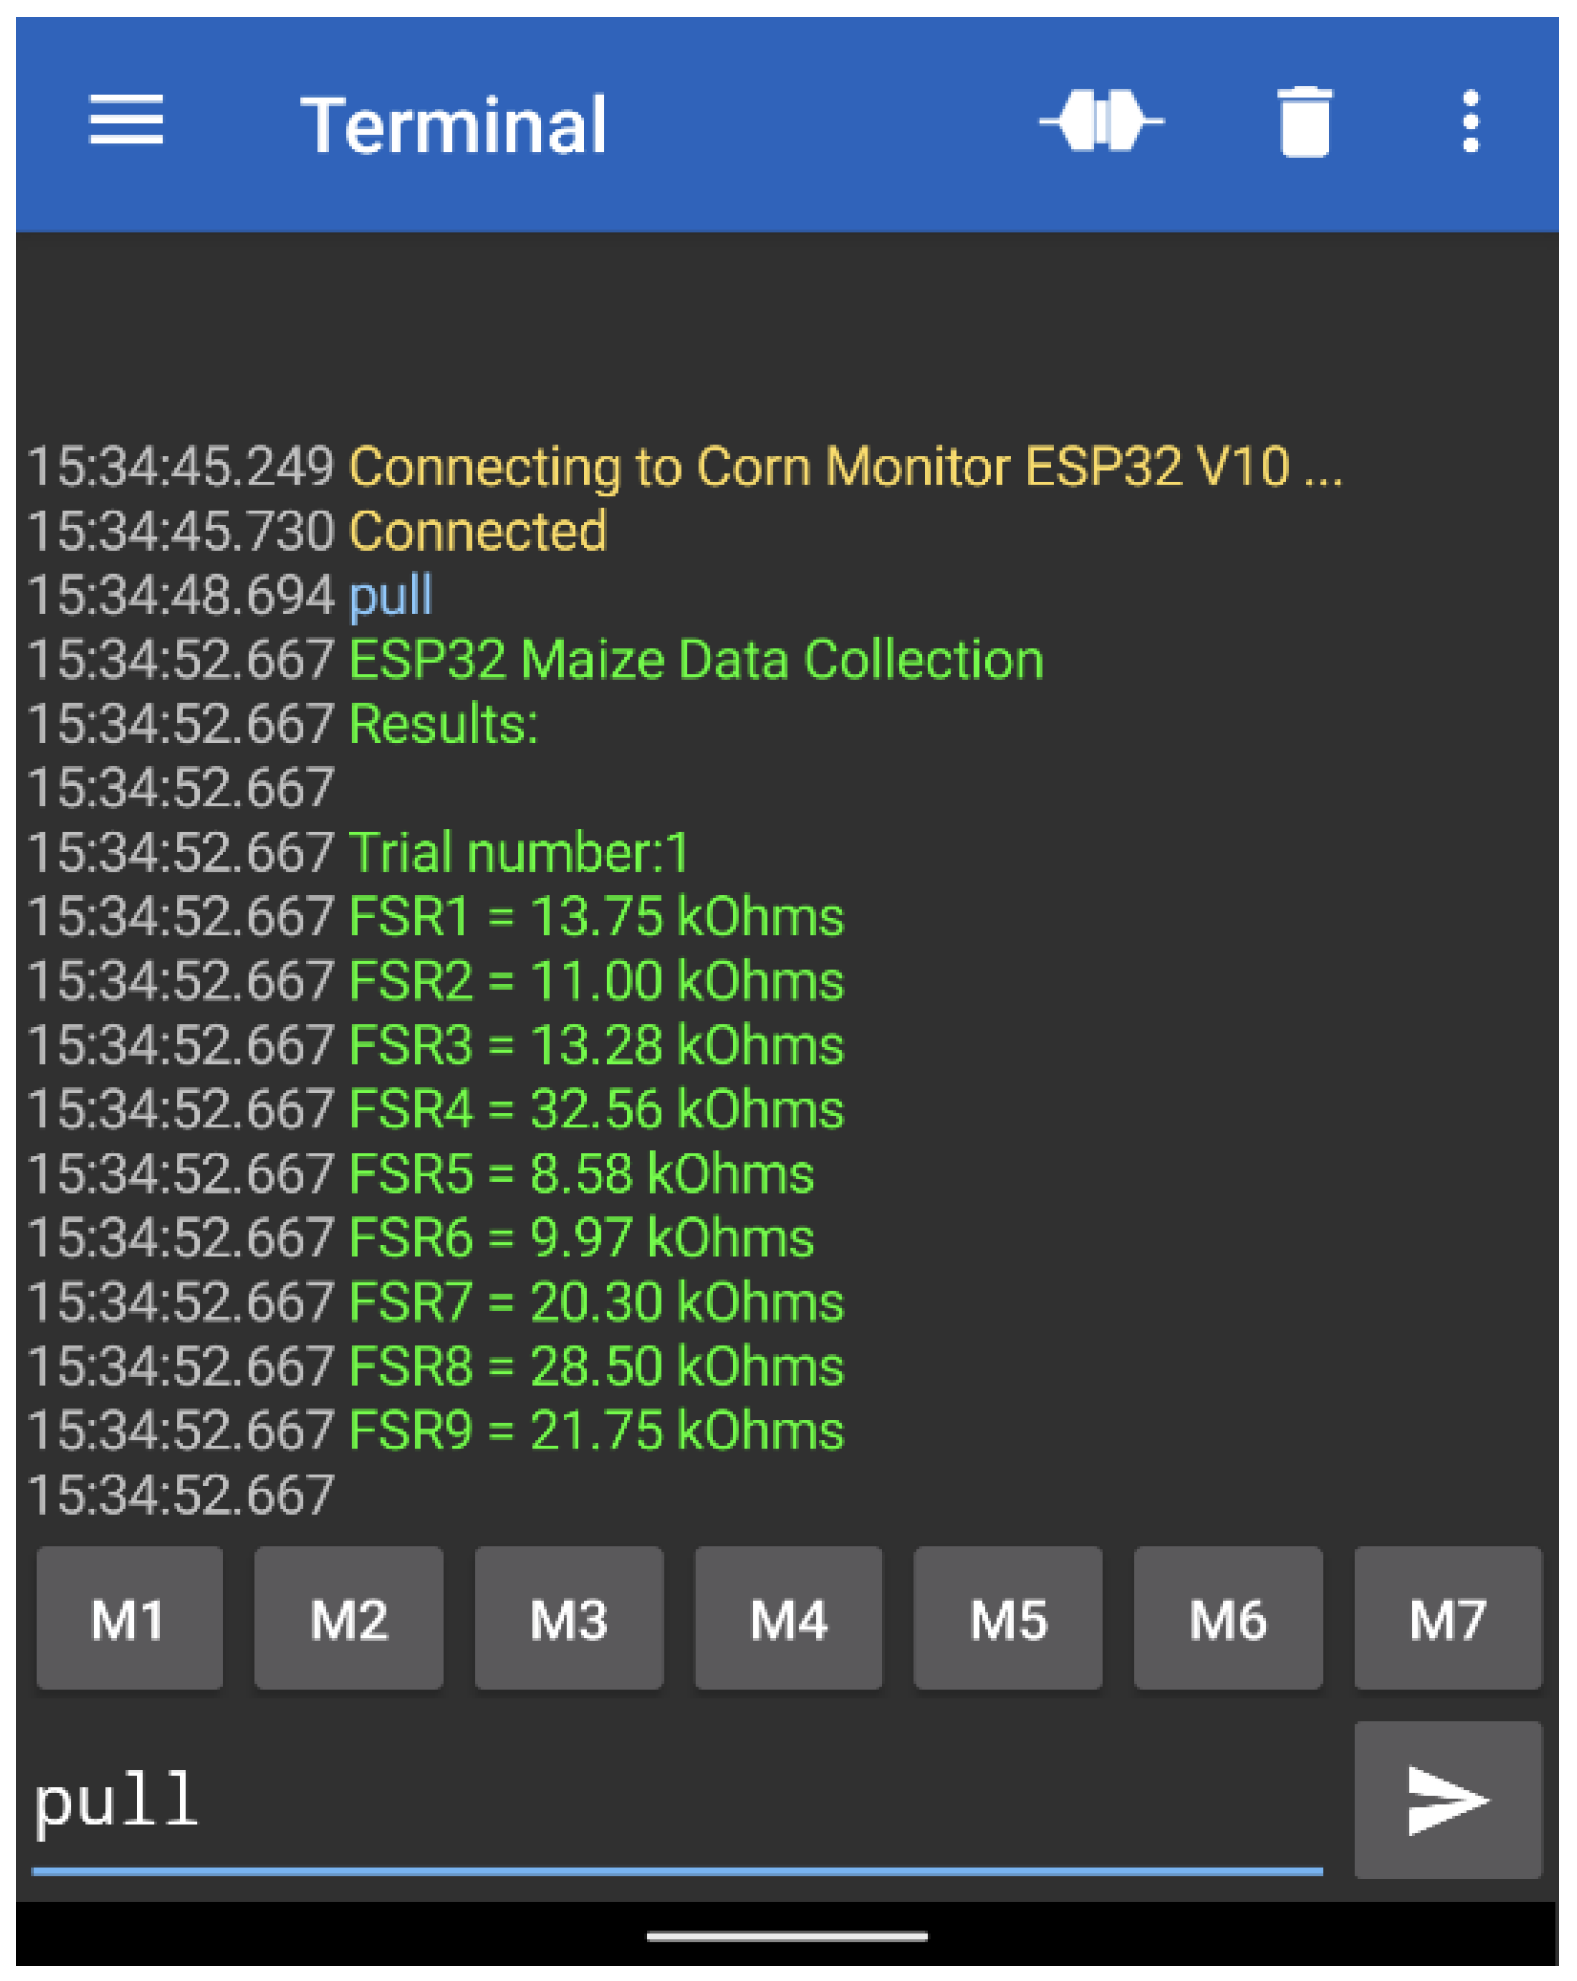
The data text file of measured FSR values can be accessed via a serial Bluetooth connection. A connection can be made using a smartphone or computer with Bluetooth capabilities. The ESP32 includes a built-in Bluetooth model, removing the necessity for an external Bluetooth transmitter. To establish a smartphone connection, the phone must have a “Serial Bluetooth Terminal” application installed. Once a Bluetooth connection is created through the terminal, the data from the text file can be transferred to the phone by sending the message “pull” from the phone to the system. The contents of the text file will then be displayed on the phone terminal screen as shown in
Figure 7. The data include the resistance values of each FSR at hour intervals.
The proposed system initially targets controlled lab experiments with a small number of seeds, which makes the Bluetooth connection appropriate for this test. In the future, the number of seed samples can be increased. The Bluetooth connection cannot be applicable for this goal due to its limited range. Instead, a wireless sensor network with a longer range is recommended to be utilized in order to collect data from a large number of systems [
19].
3. Probe Calibration
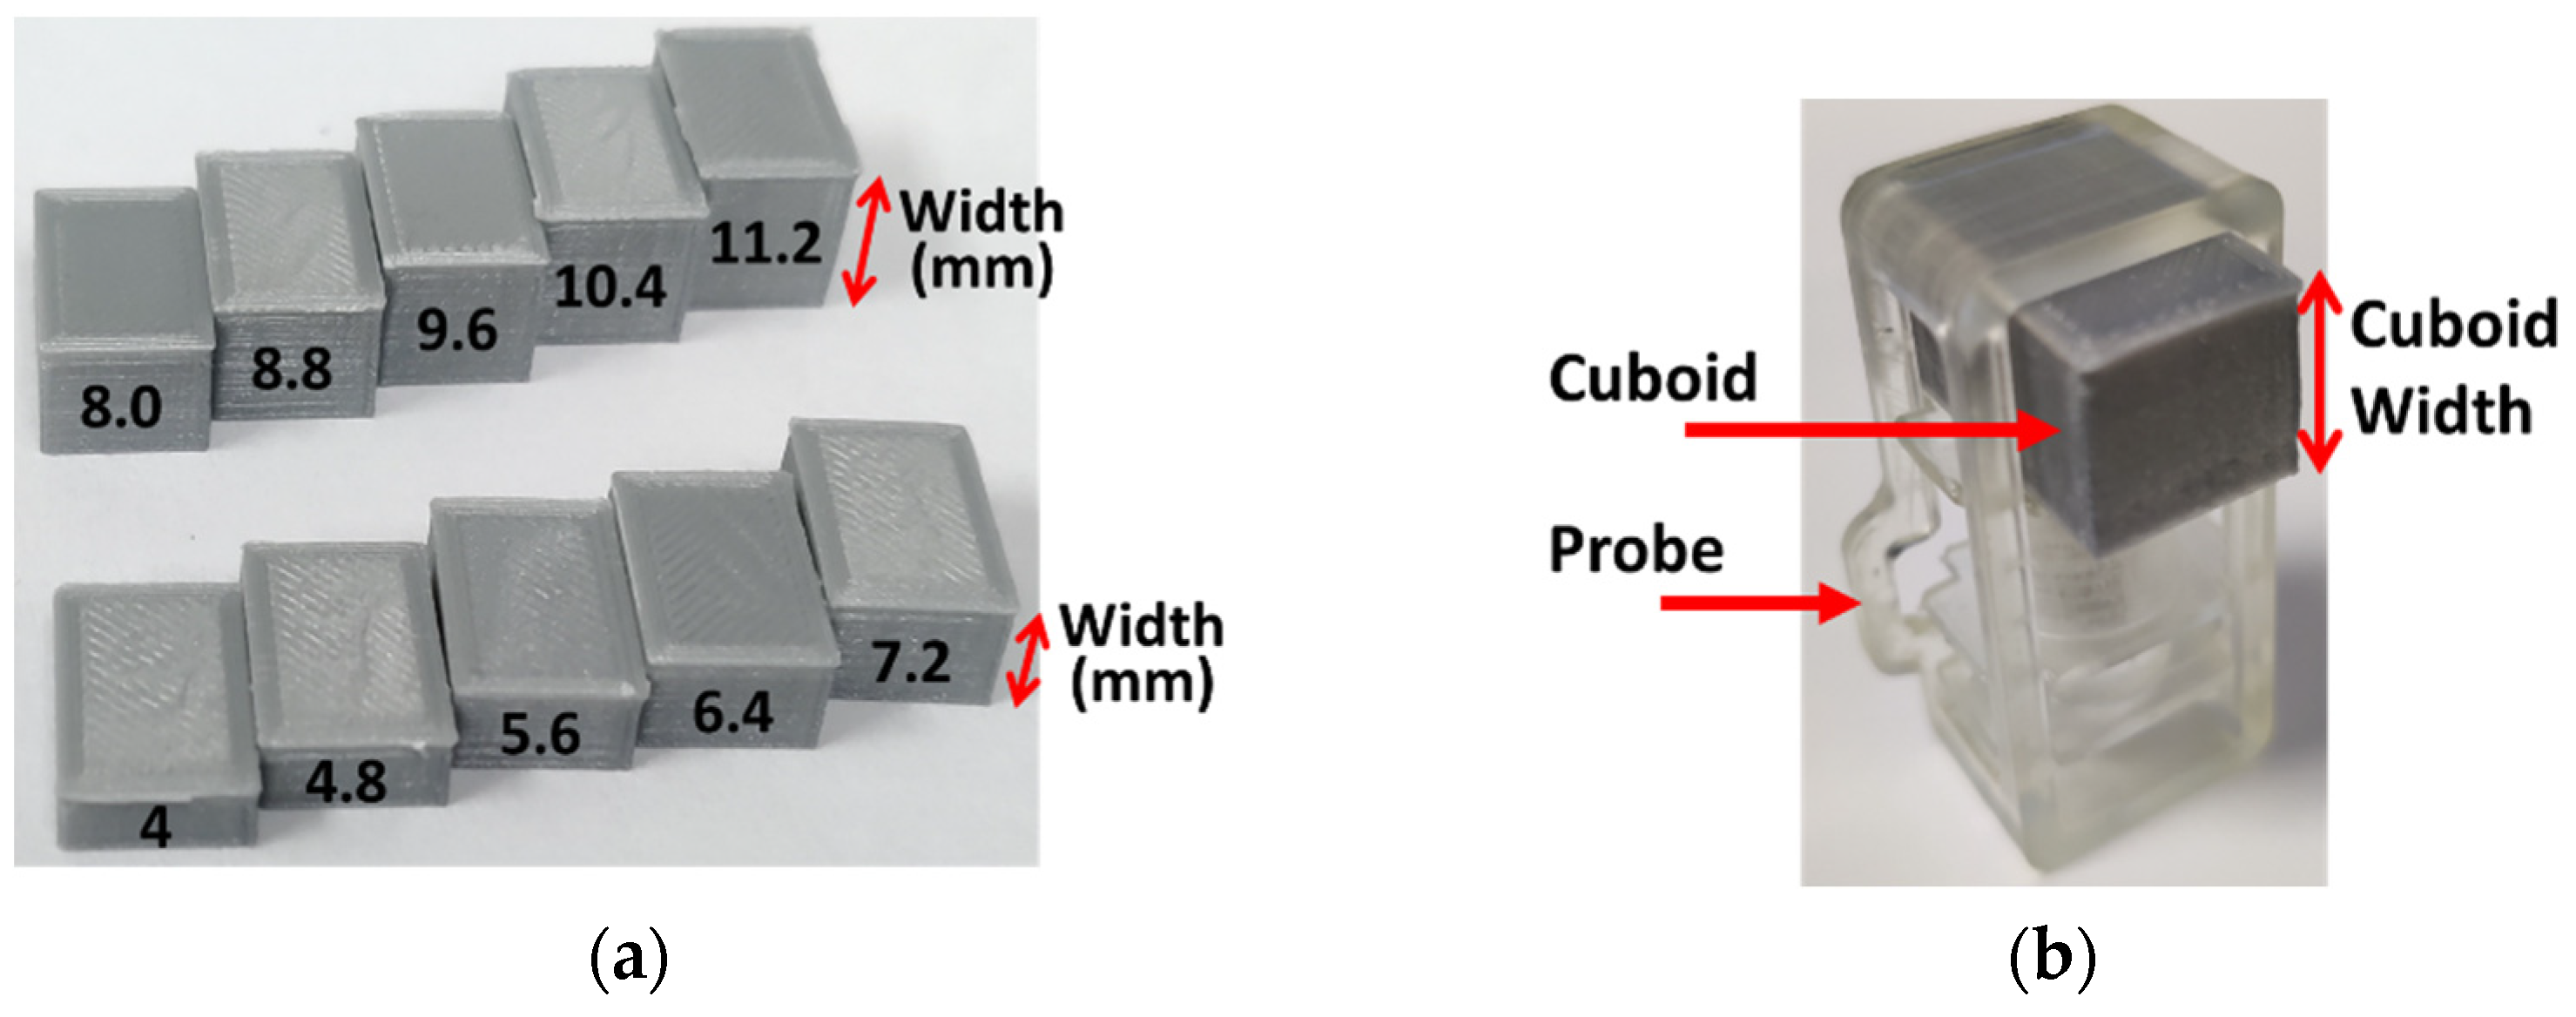
Before using the system for the first time, it is required to store the FSR values that correspond to different object’s sizes and draw a graph that represents the relation between FSR and size. Eventually, by utilizing the curve fitting technique, these graphs are used to get the measured seed width corresponding to each FSR value. The calibration must be implemented separately for each FSR with its specific probe. Cuboids with different widths (4–11.2 mm), shown in
Figure 8a, are 3D printed to be used in this calibration, by being placed inside the probes as shown in
Figure 8b. The cuboids are printed in an Ultimaker 2+ Extended 3D printer [
20] using Polylactic Acid (PLA) [
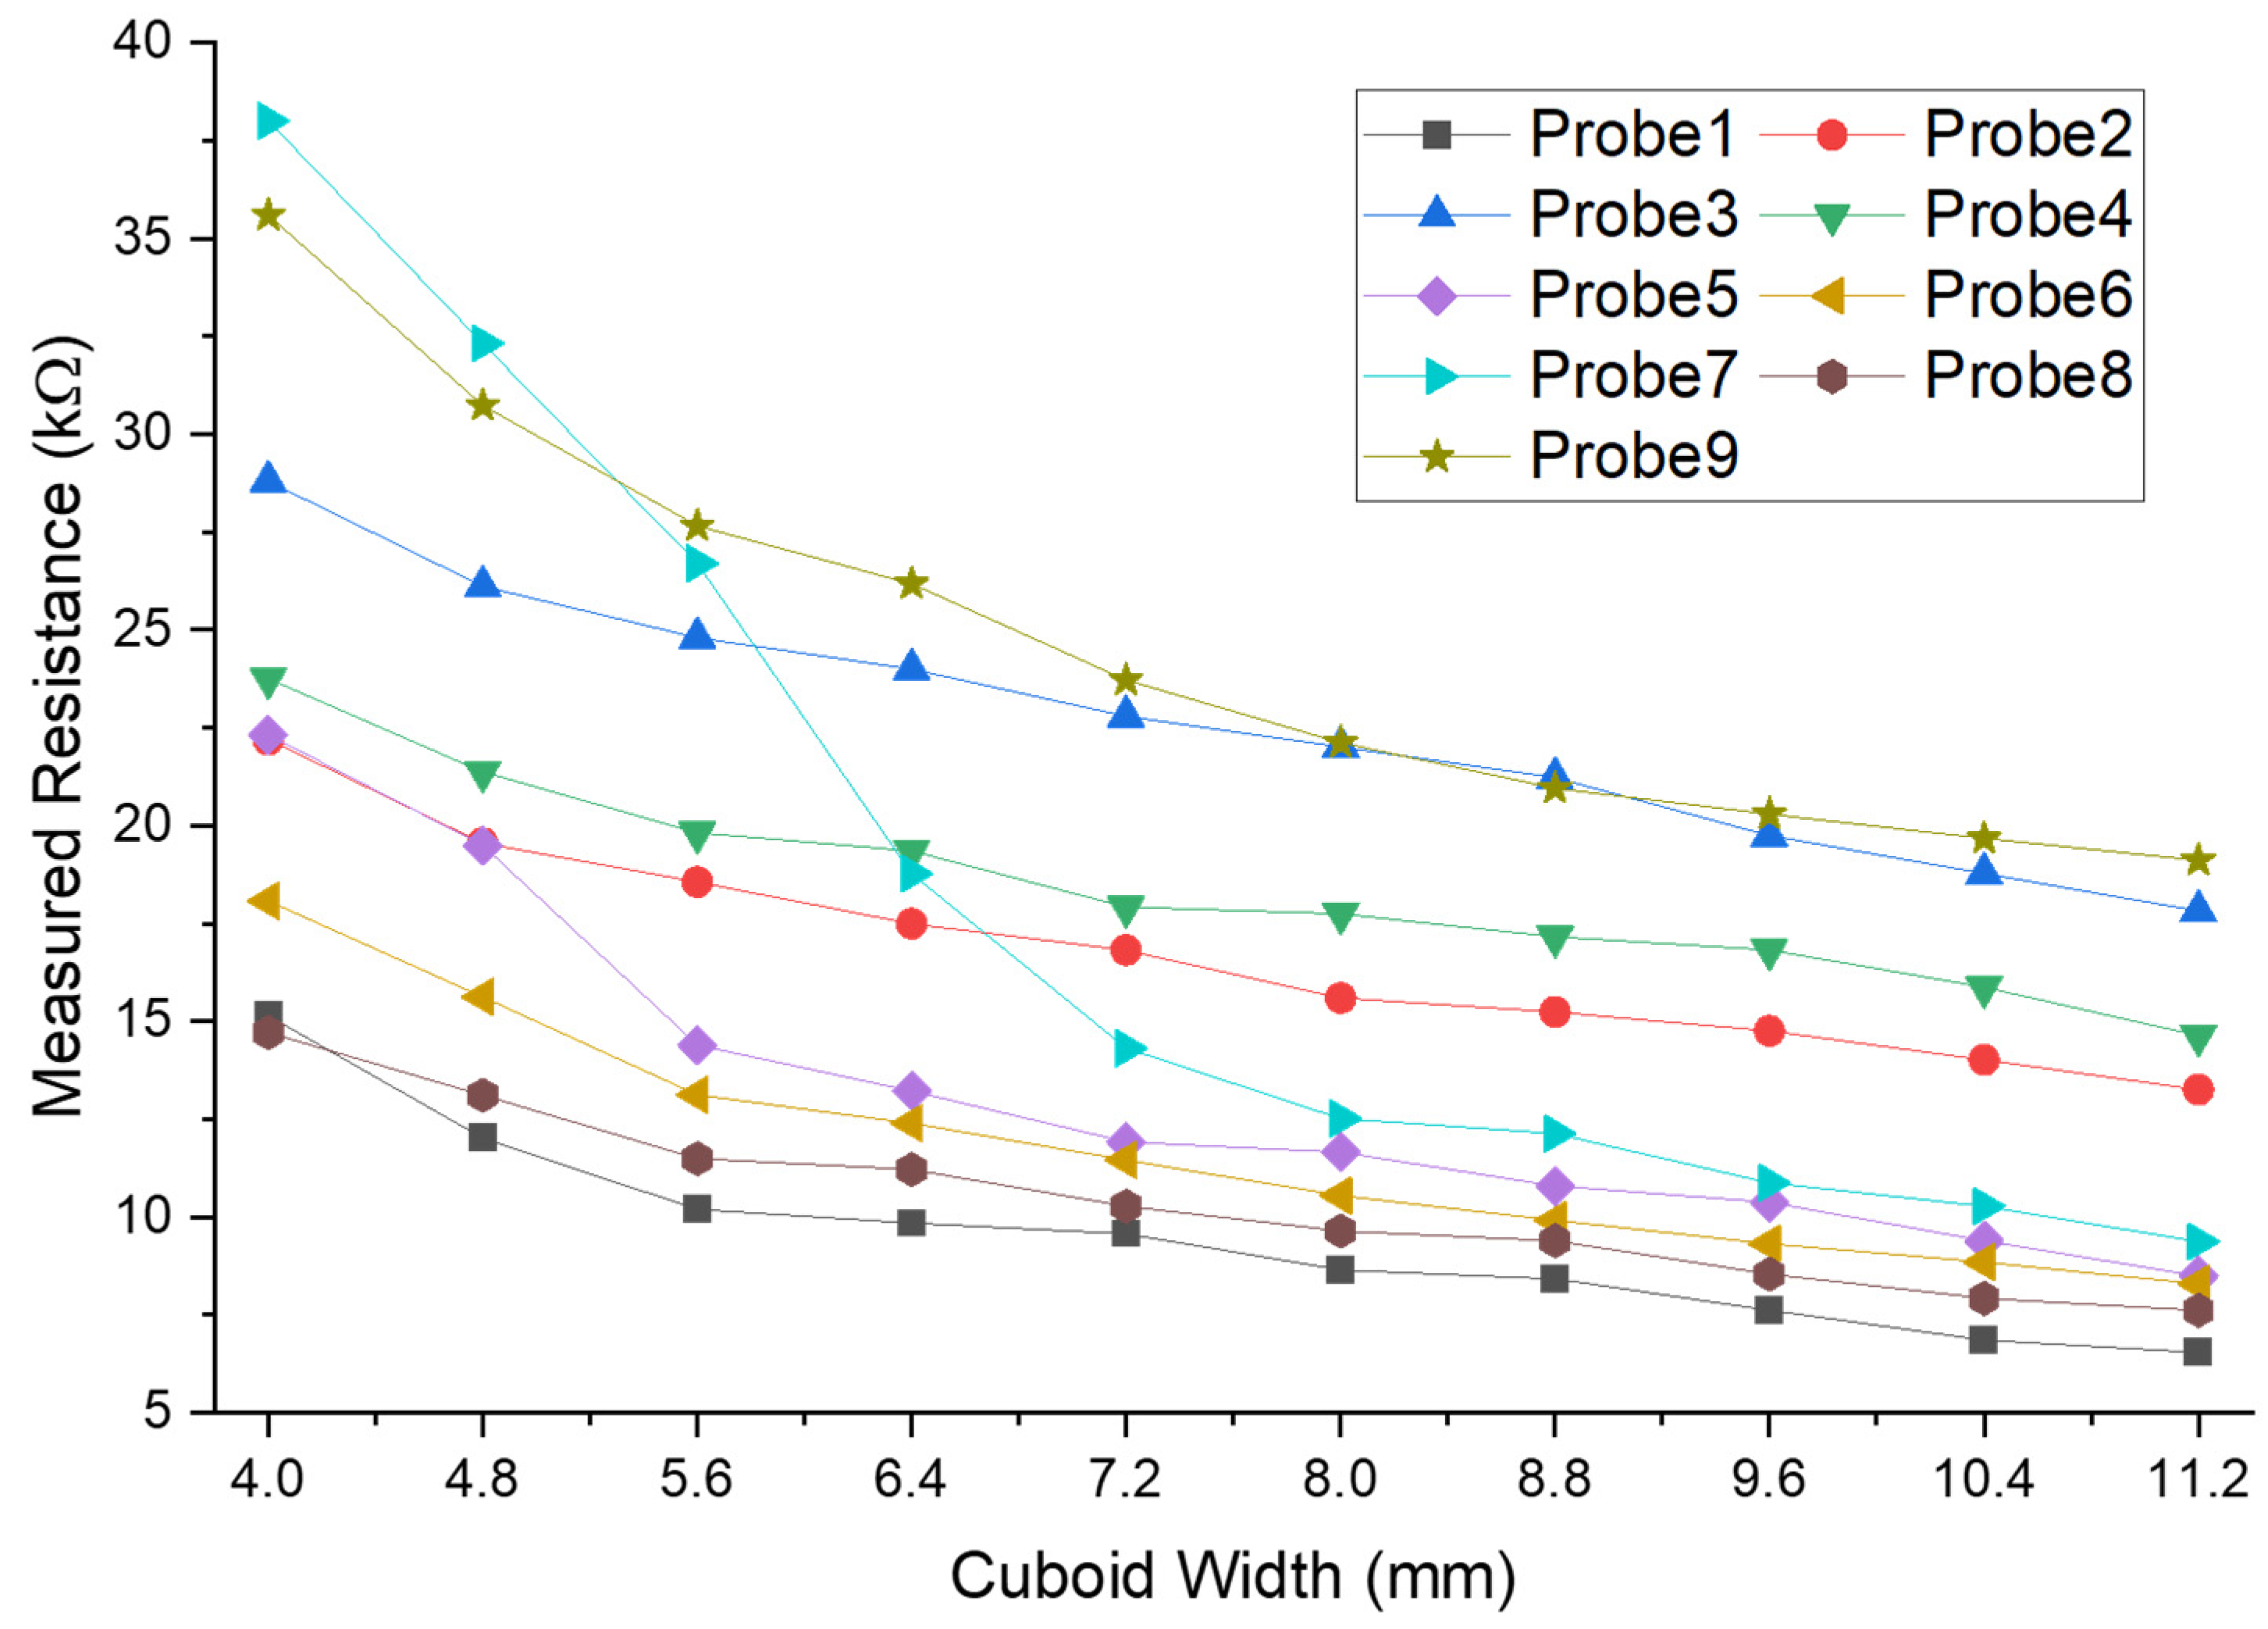
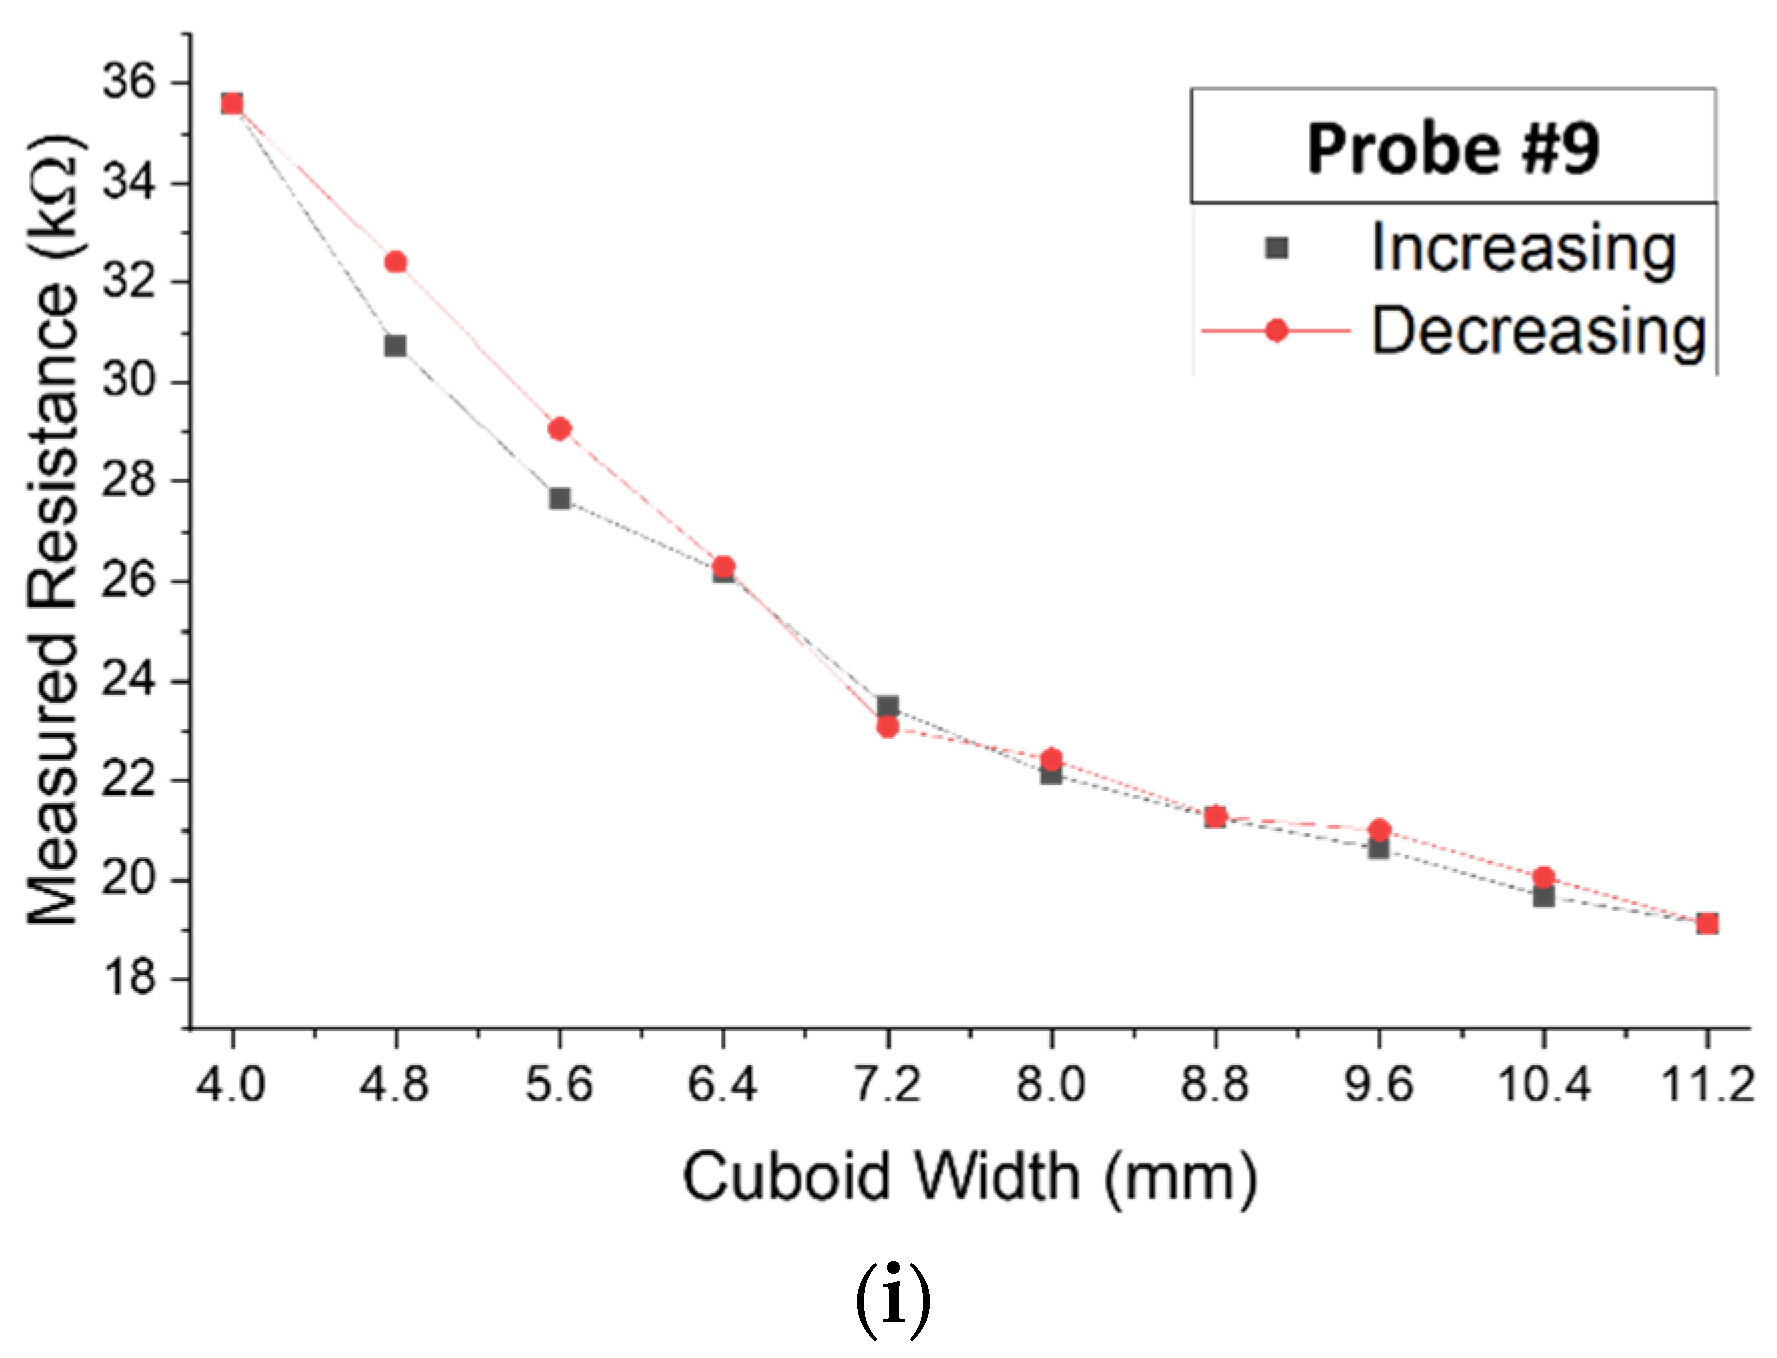
21] with 0.4 mm precision. The calibration charts for 9 probes are shown in
Figure 9. The difference between the measured resistances between probes at the same cuboid size comes from the variation between spring forces and the uncontrolled friction between the probe parts.
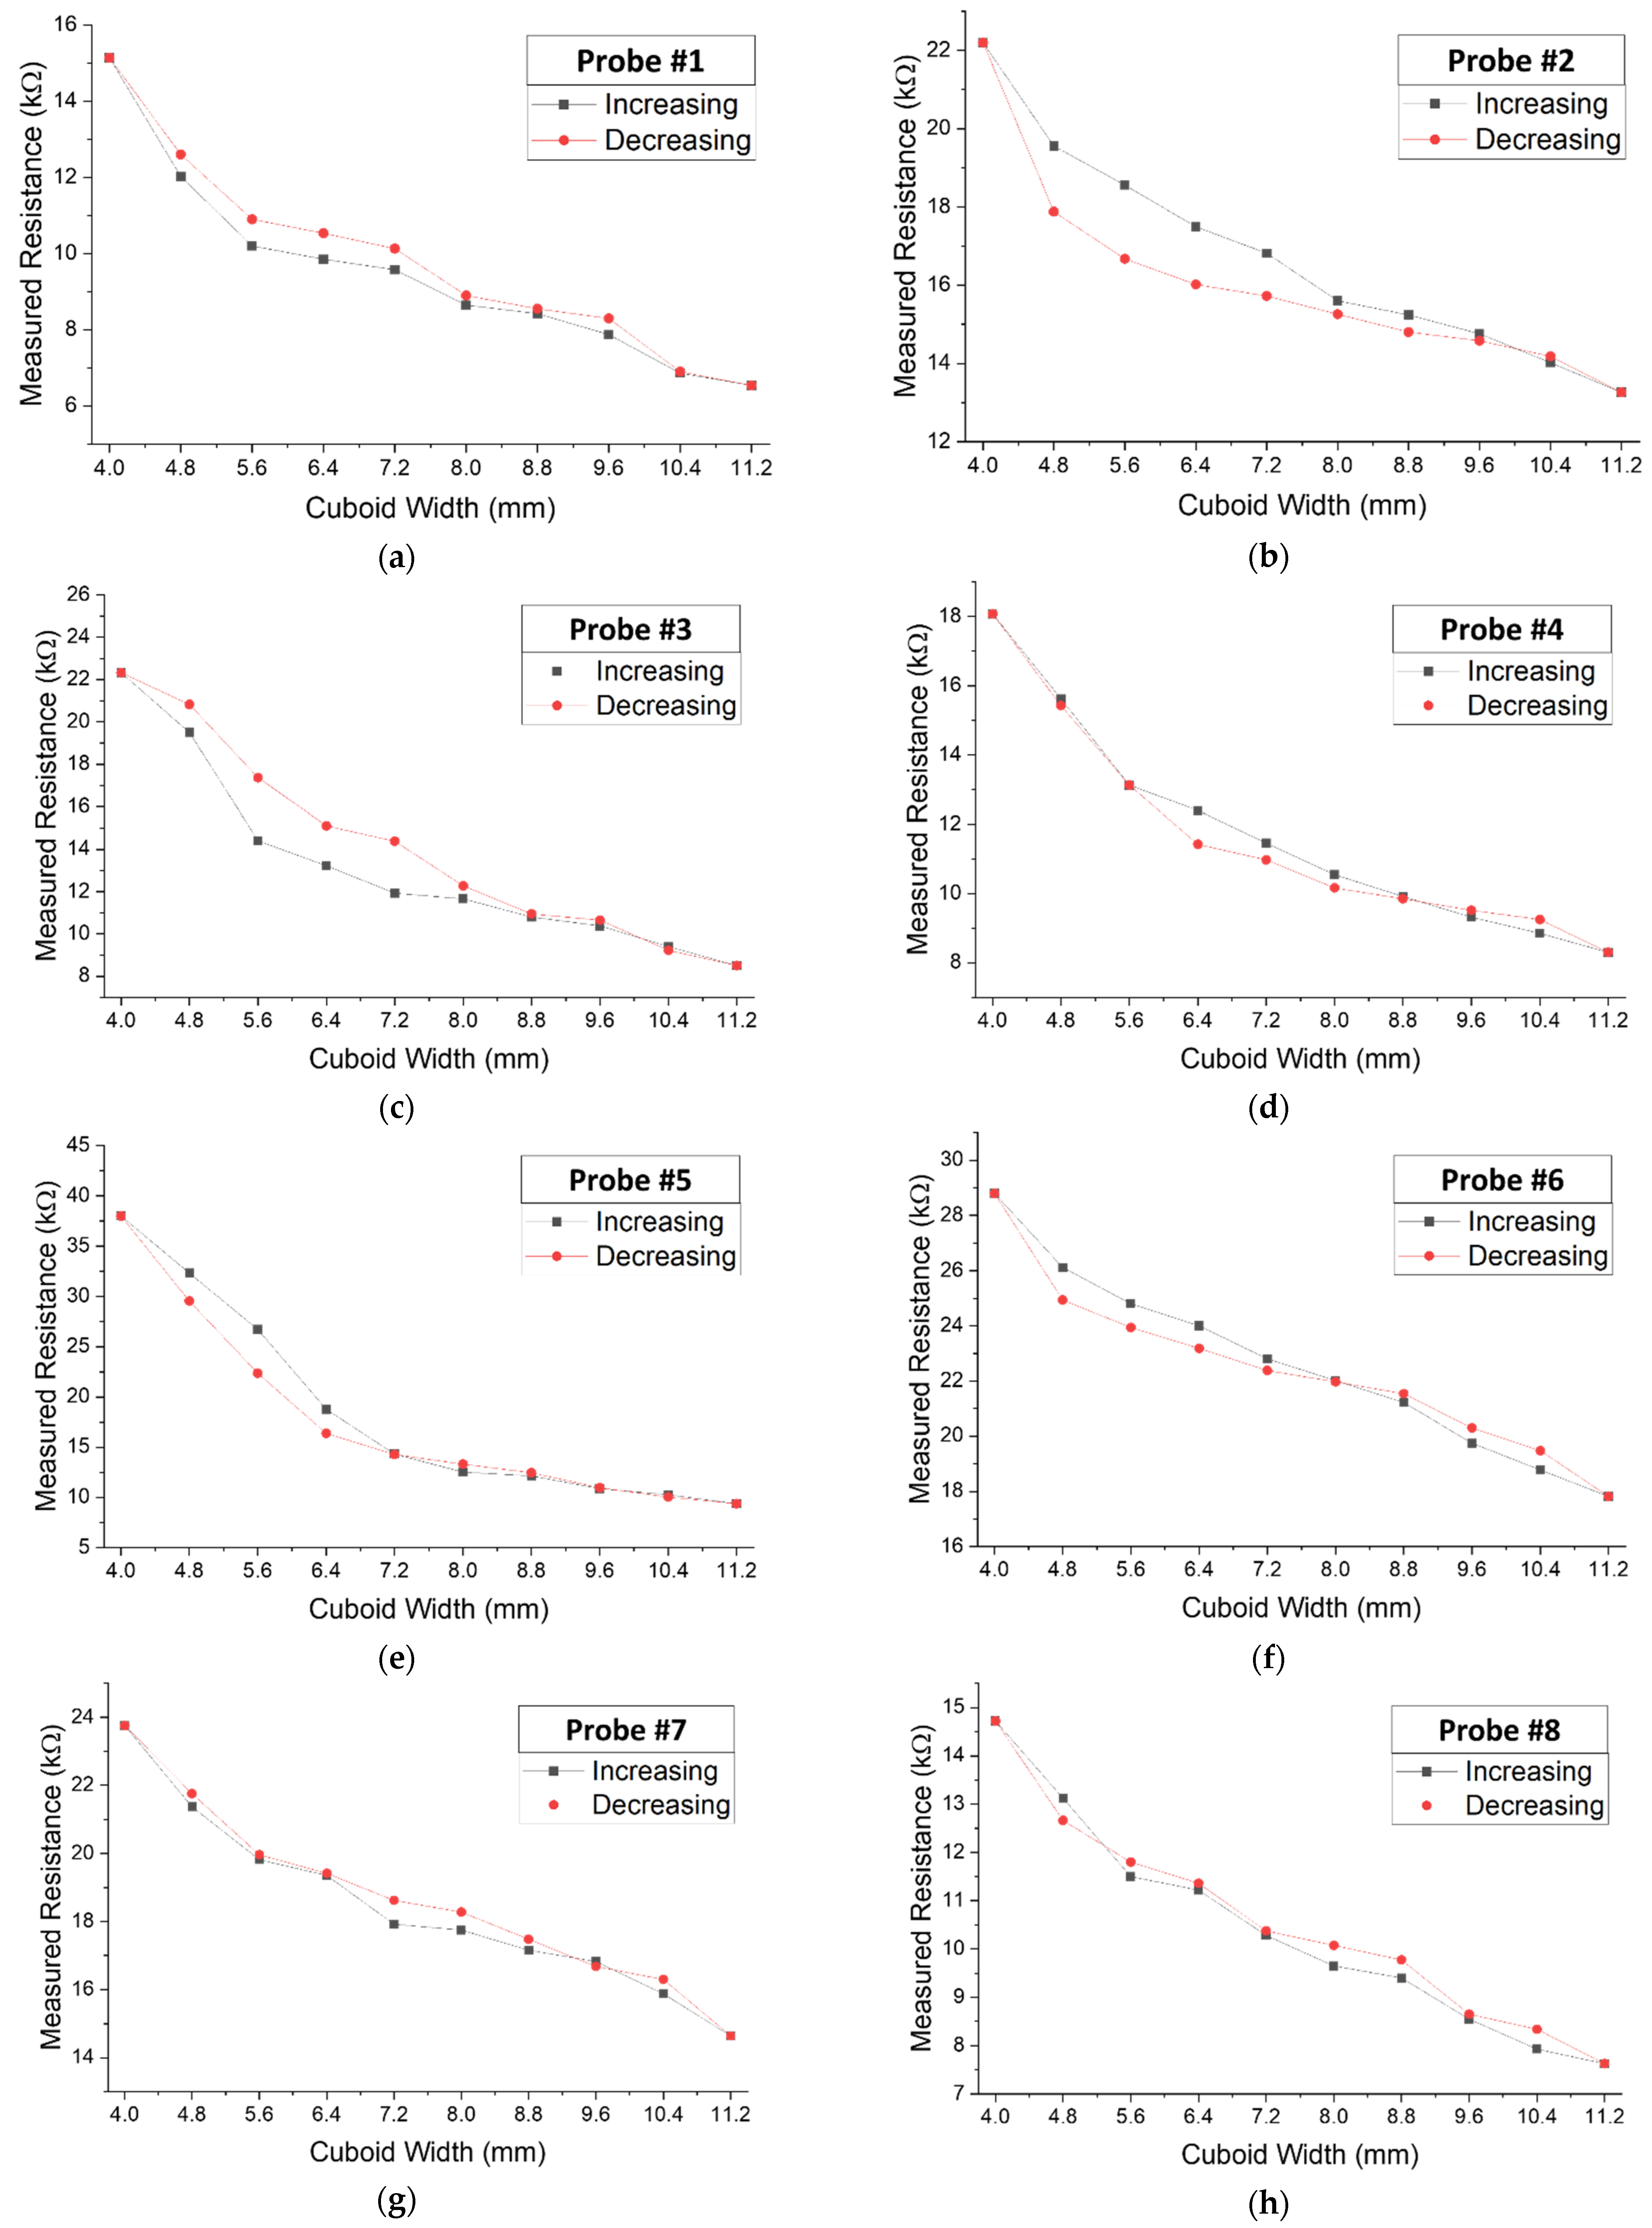
Figure 10 shows the measured resistance while increasing and decreasing the size of the cuboids. It shows hysteresis characteristics, but it should not degrade the accuracy of the measurements since the target system measures size of corn seeds which monotonically increases.
4. Results and Comparison
To show the improvement of the proposed circuit design, it is compared with three other conventional designs. All designs are implemented to measure three FSRs. The first design is straightforward since it uses a single FSR with a single constant resistor (R3) to construct a voltage divider [
13,
22,
23,
24], as shown in
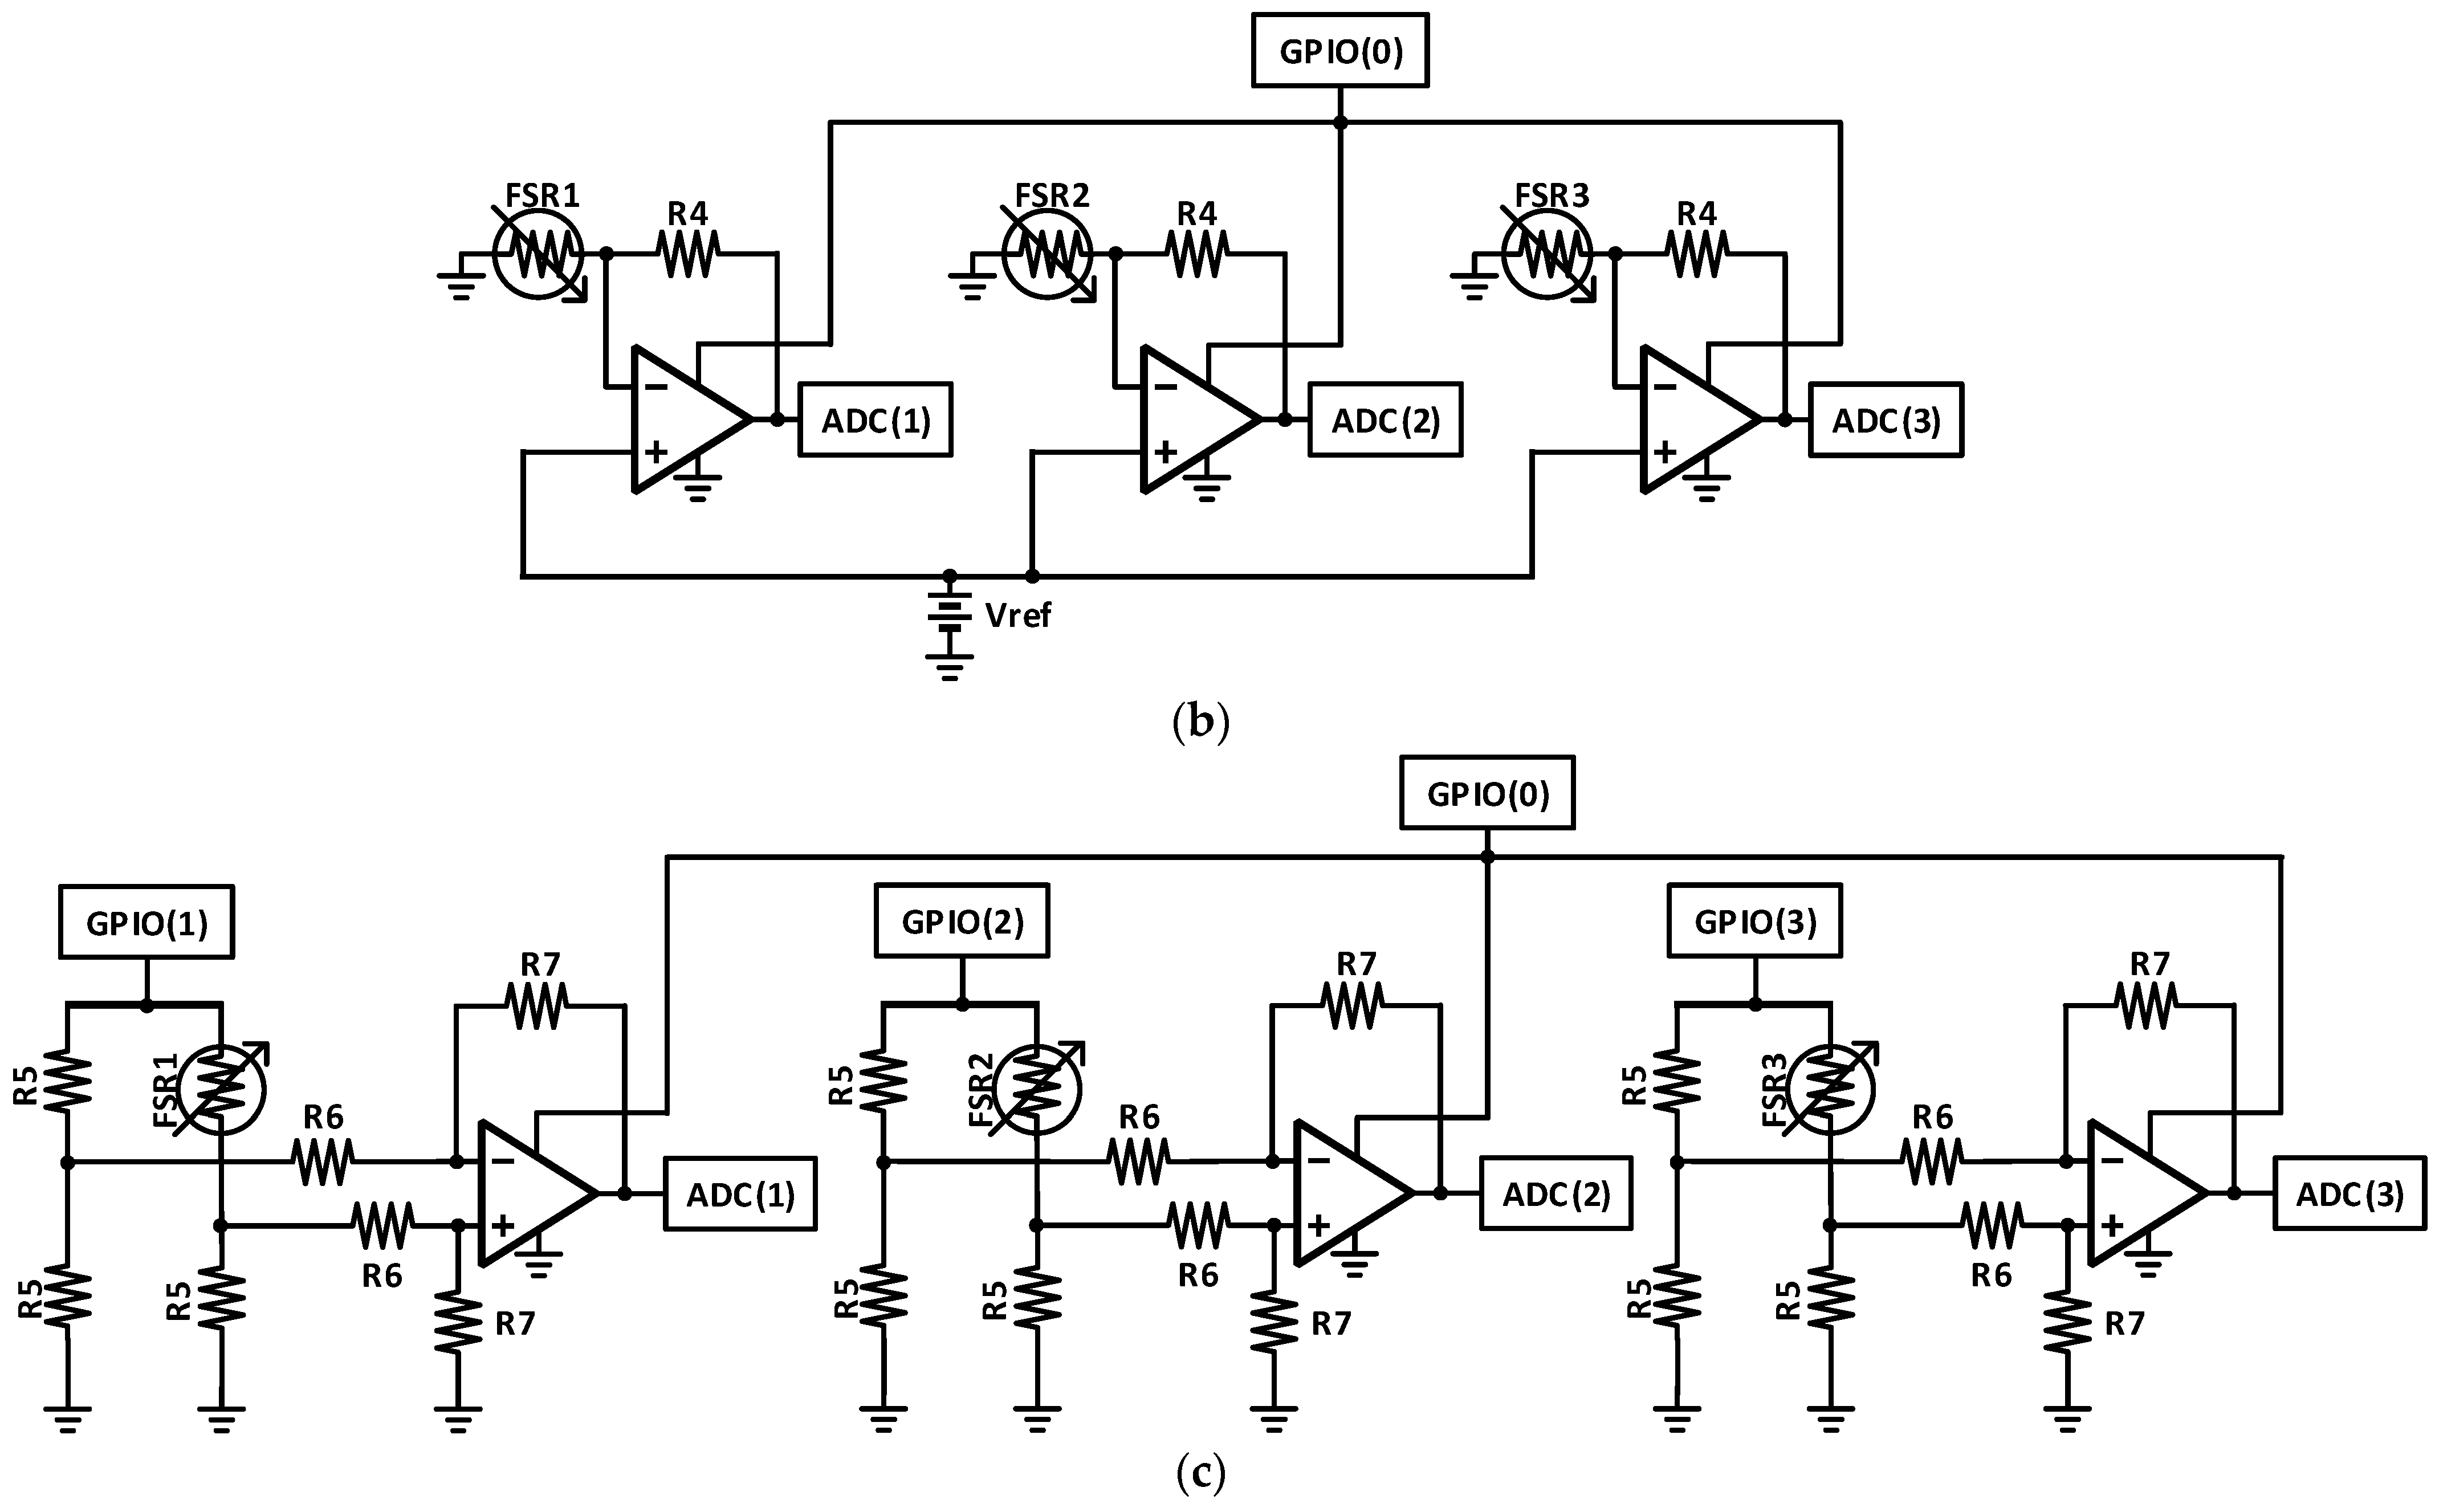
Figure 11a. The resistance of the FSR is linearly proportional to the voltage over it. The second design, shown in
Figure 11b, uses a reference voltage with a noninverting amplifier [
24]. The reference voltage is utilized as a constant noninverting input, while the FSR is connected as the input resistance for the noninverting amplifier. The gain of the amplifier changes with the FSR value (Av = 1 + R4/FSRn). Accordingly, the output value also changes with the FSR resistance. The third design, shown in
Figure 11c, uses a Wheatstone bridge [
25], which is commonly used for accurate sensors applications. The two outputs of the bridge are connected to a differential amplifier. For a fair comparison, all mentioned methods are powered using GPIO pins instead of direct VDD.
The comparison results of the proposed design and the other two conventional designs are presented in
Table 1 and
Figure 11. The Wheatstone bridge method shows the highest power consumption of 102.8 mW (excluding the power consumed in the ESP32 kit). On the other hand, the voltage divider method presents the lowest power consumption of 76.7 mW, followed by the proposed method with 78.48 mW. Although the proposed design shows a higher power in the measuring mode (one GPIO is high) than the voltage divider method, the measuring time is negligible compared to the idle time, making the average power nearly equal to the idle mode power. Moreover, the ESP32 stays in active mode (both idle and measuring) for only 5 min every hour to search for a Bluetooth connection, for the remaining 55 min of the hour the ESP32 goes to sleep mode.
The cost of the external components of the proposed method without an amplifier is the lowest as presented in
Table 1 for both 3 seeds and 15 seeds. However, adding an amplifier to the proposed method makes its price higher than the voltage divider method for a low number of seeds. By increasing the number of seeds to be measured, the cost of the proposed method with an amplifier starts to converge to the cost of the voltage divider method until it becomes better for many seeds. Additionally, as shown in
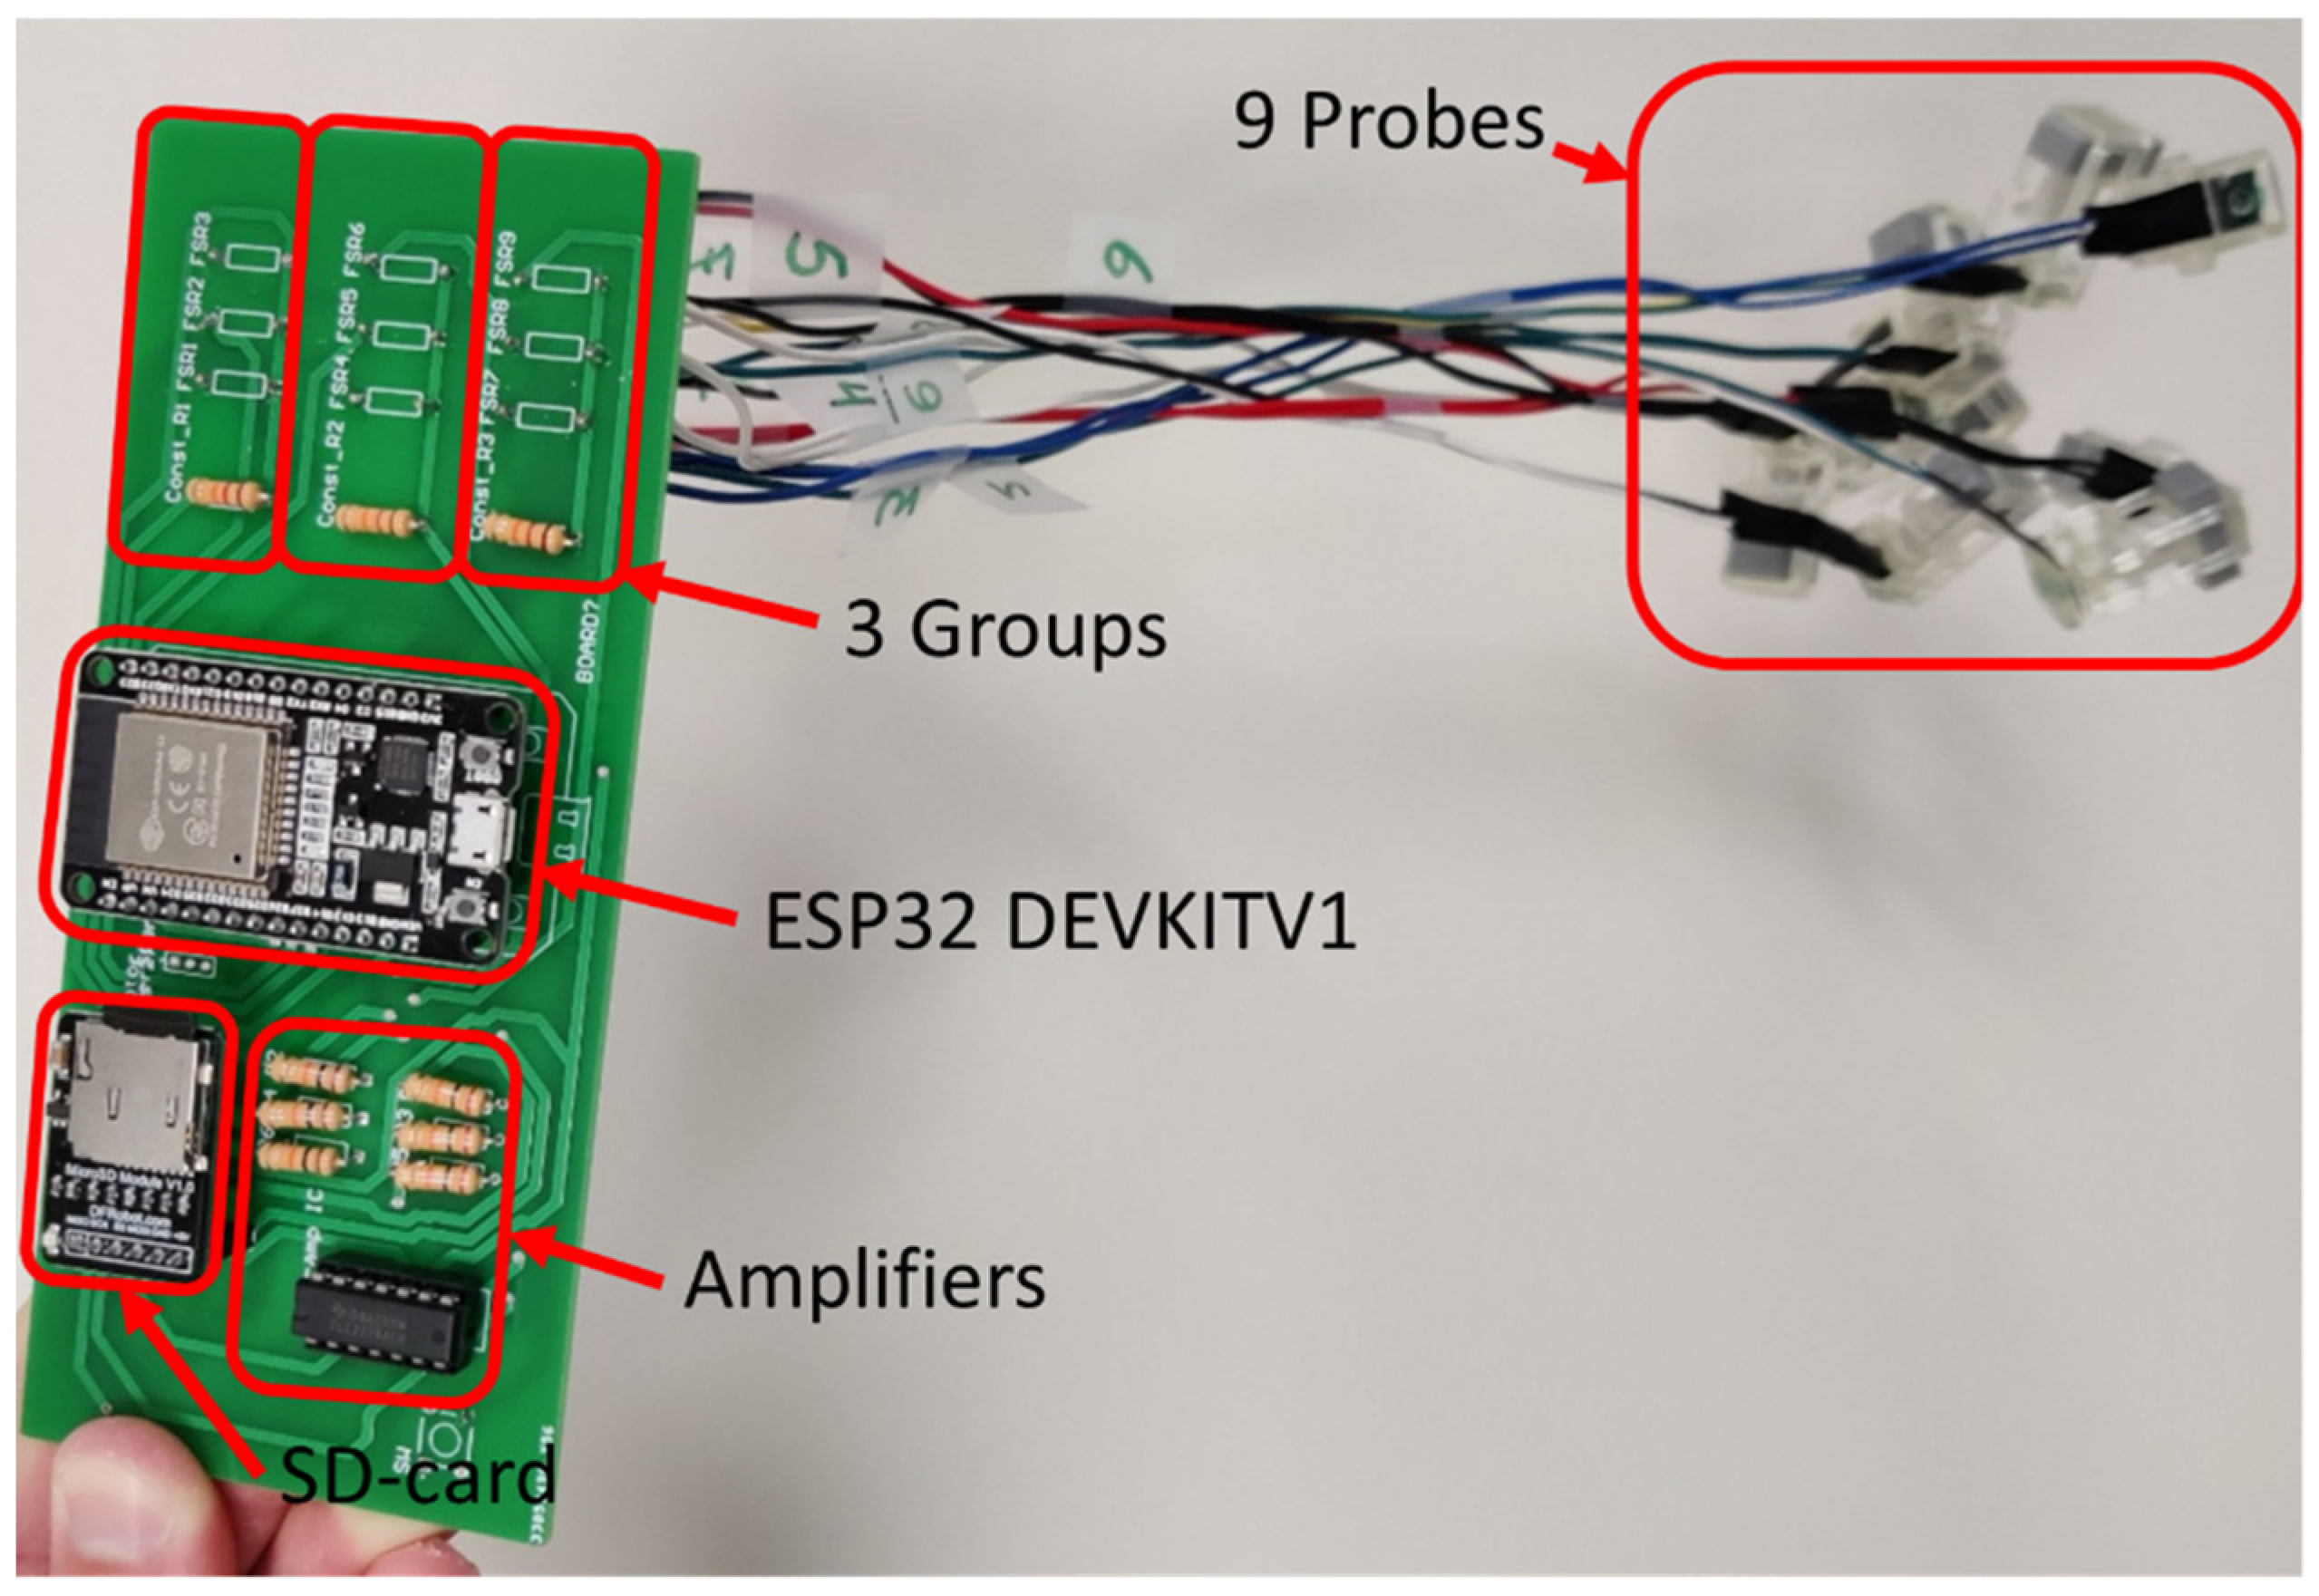
Table 1, the proposed method needs only one ADC channel to calculate the value of many seeds. If the number of seeds is very large, the proposed system can be divided into groups, each group using one ADC. A Printed Circuit Board (PCB) implementing three groups each group has three probes is shown in
Figure 12.
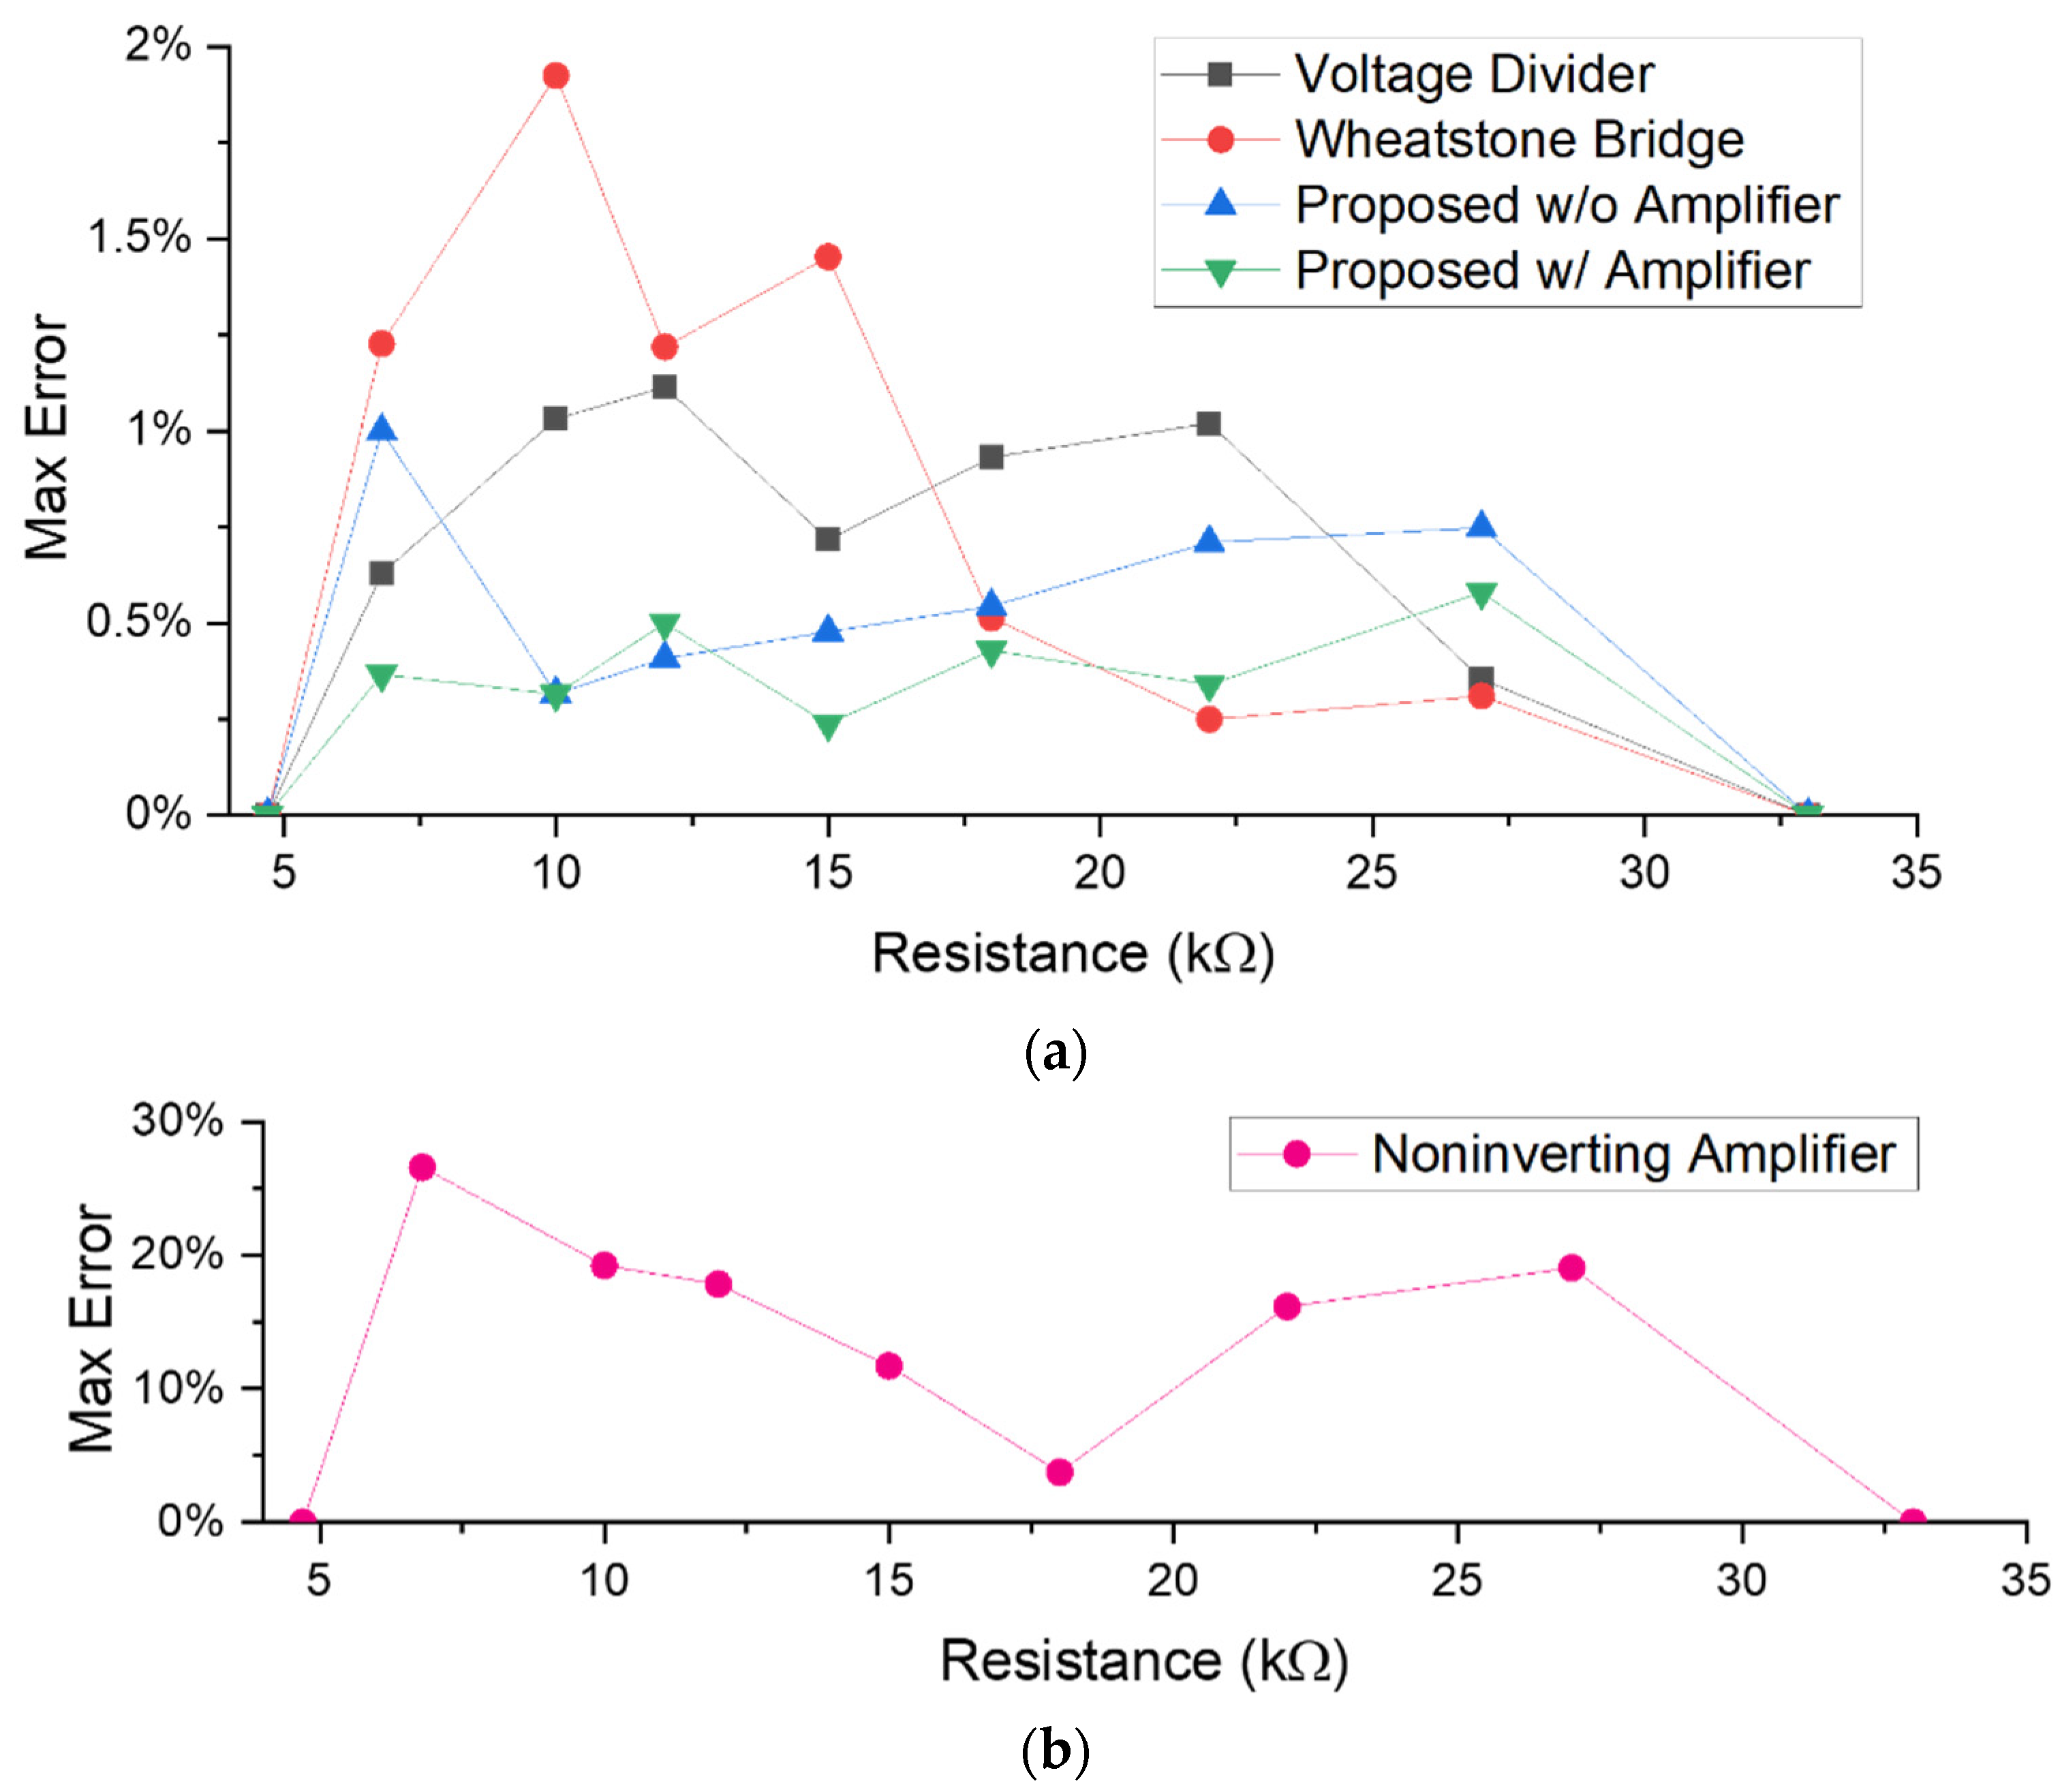
The accuracy is measured for each system with three probes. In the beginning, the theoretical expected digital code corresponding to some different resistances (e.g., 4.7, 6.8, 10, 12, 15, 18, 22, 27, and 33 kΩ) for each system is calculated. The digital code corresponds to two of these resistance values (4.7 and 33 kΩ) are used for two-points calibration that is applied to all other recorded digital values from the ADCs, which leads to a reduced error. The final error after calibration is calculated using Equation (2). The accuracy of the proposed method presents the lowest error for a wide range of FSR values as shown in
Figure 13. Additionally, the supply voltage insensitivity feature of the proposed design can keep the correct output even if the powering voltage has been changed.
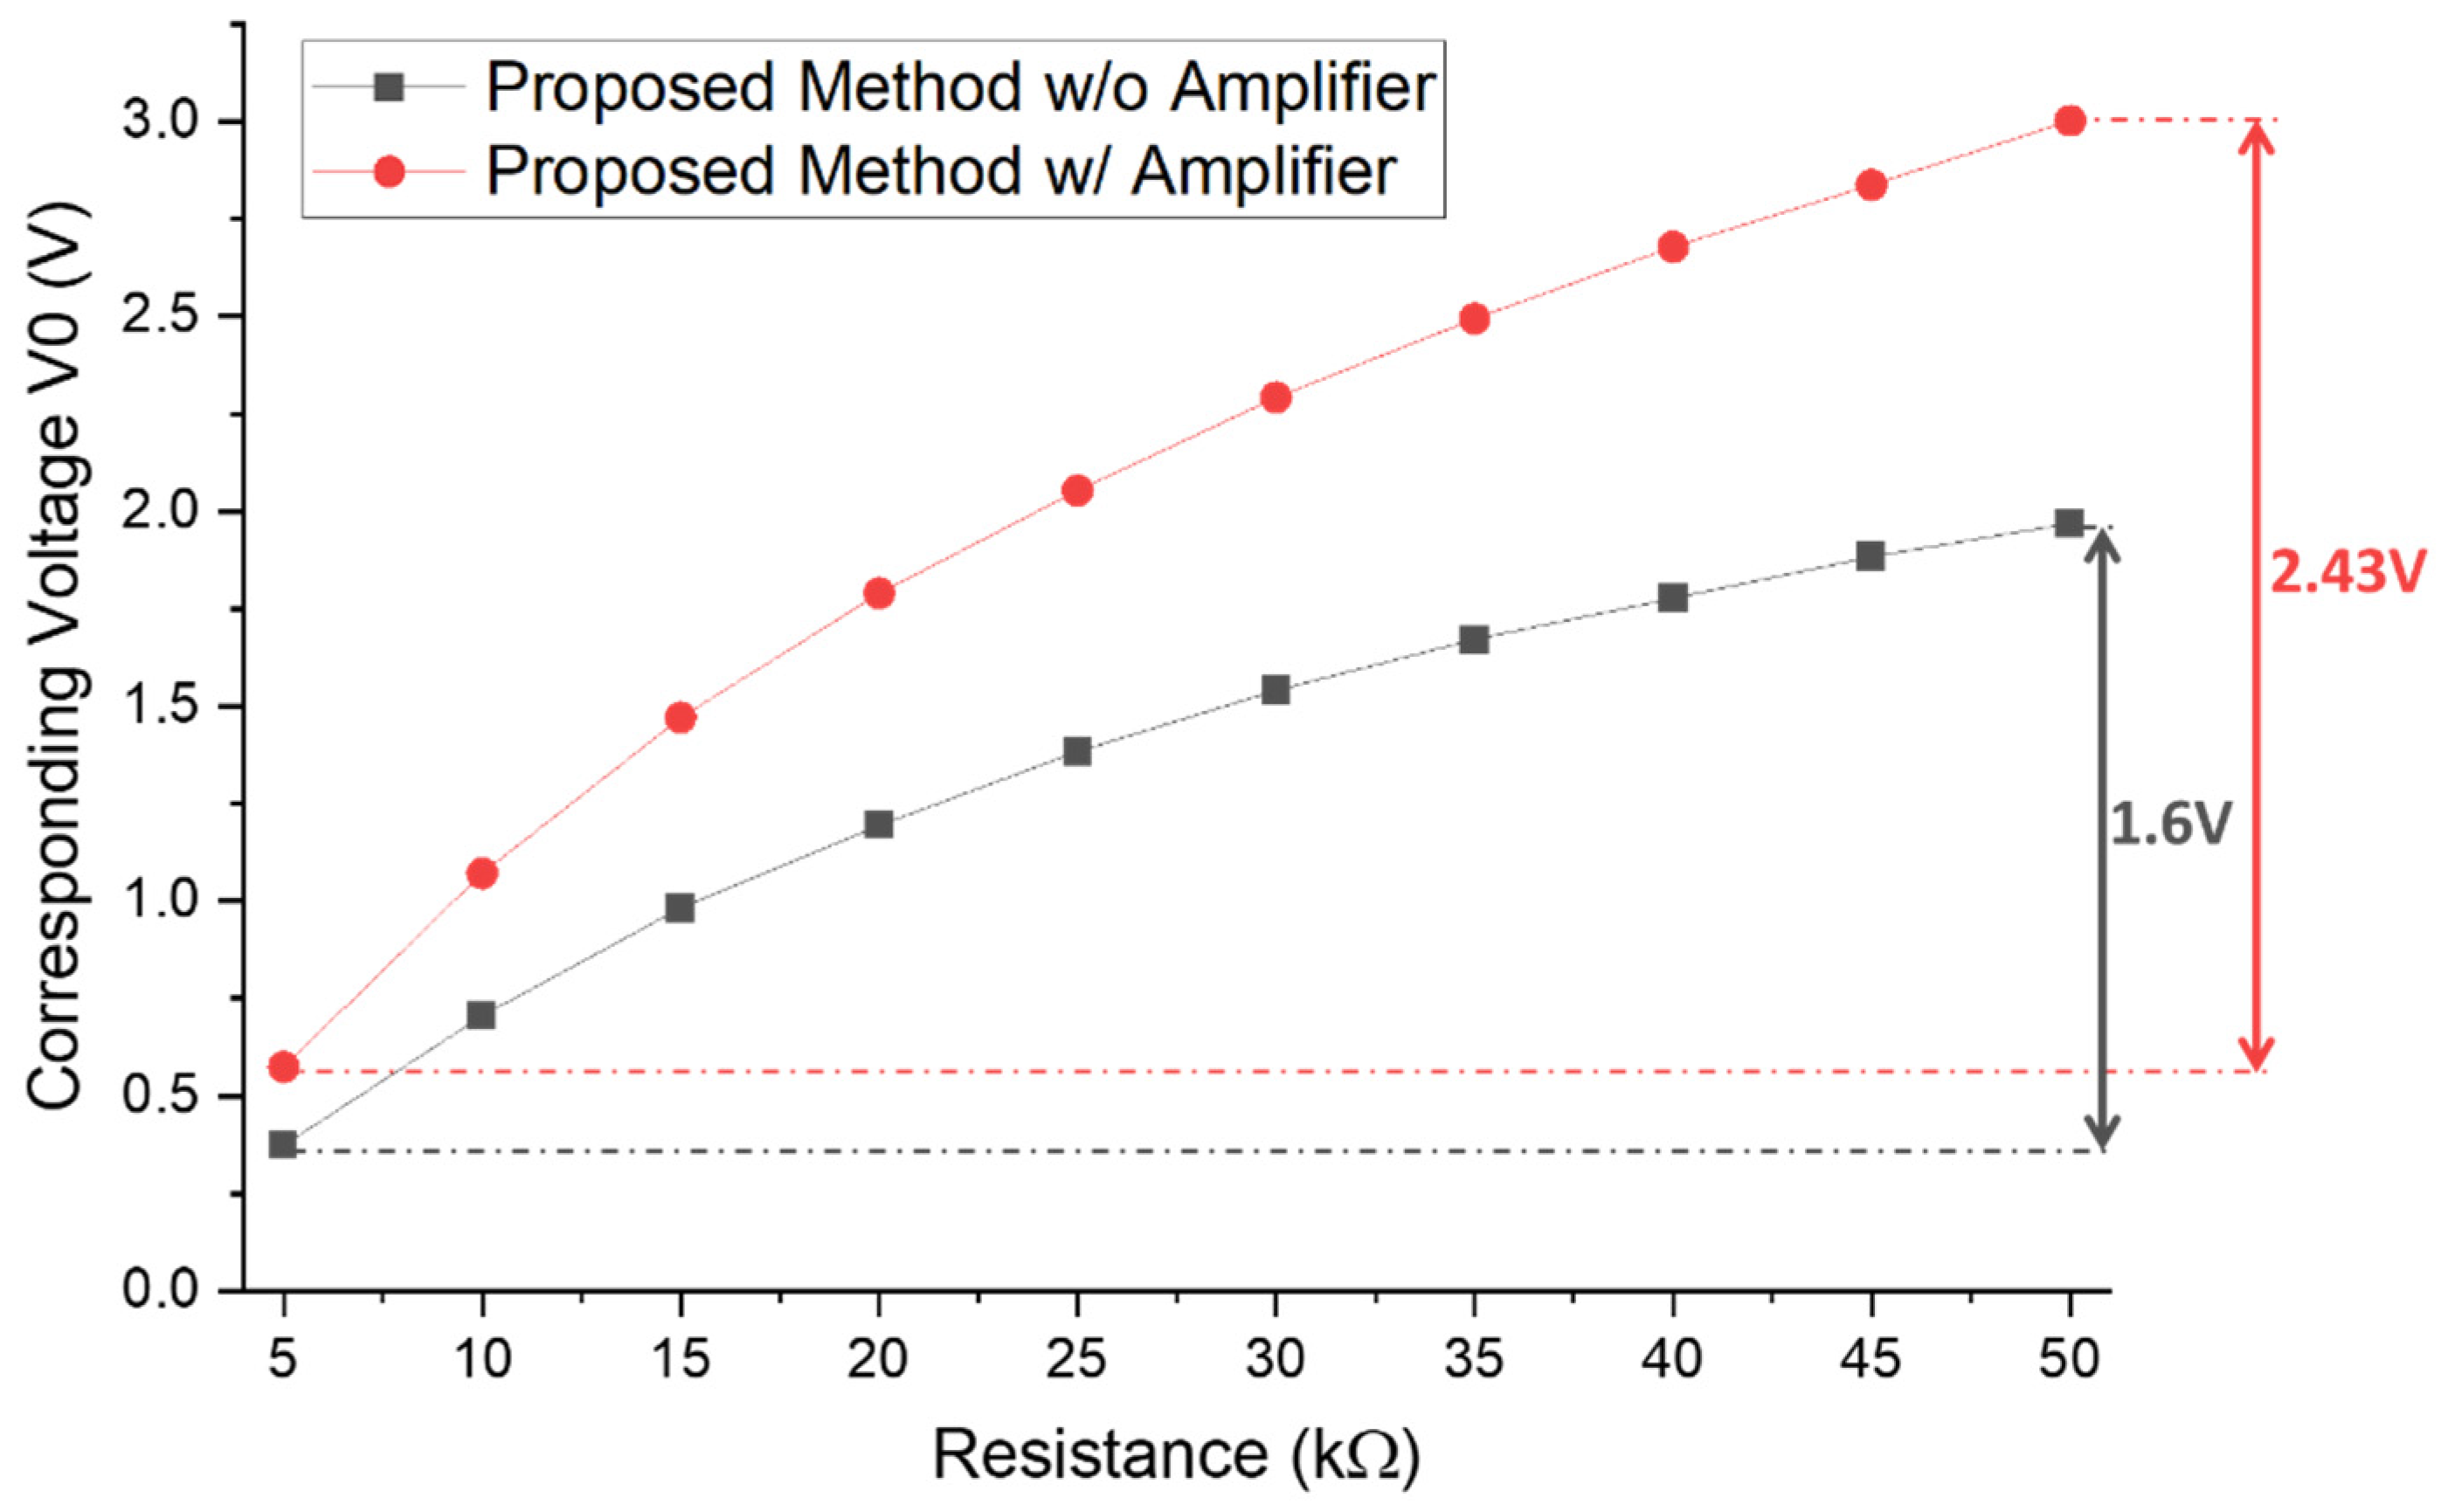
Adding an amplifier to the proposed method reduces the error for the measured resistance, as the measured voltage V0 read by the ADC (when the constant resistor R0 is connected to high) is stretched for a wider voltage range that gives more accurate readings. The stretching of the voltage range for FSR values from 5 kΩ to 50 kΩ is shown in
Figure 14, where the voltage range of the proposed method with an amplifier is stretched by ~1.5 times than that without an amplifier, which is equivalent to the applied amplifier gain.
Despite the promising test measurements of the proposed circuit. The utilizing of the system to record the real size of the corn seeds beneath the soil faces some difficulties that still need further investigation. These difficulties can be summarized in the following points:
The spring force changes with long compression time.
The FSR is sensitive to temperature change.
The position of the probe (vertical, horizontal, different angles) may affect the results.
The friction between probe parts is uncontrolled.
Some corn seeds become fragile due to water imbibition.
5. Conclusions and Future Work
A method to measure the size of the seeds underneath the soil or inside the water to track their imbibition is introduced with a new circuit design utilizing different GPIOs configurations. The circuit design shows a higher accuracy, lower power consumption, less cost, and fewer required ADC channels to be implemented compared to other conventional circuit designs. The new circuit introduced is distinguished to have a robust operation with insensitivity to the power supply voltage and the amplifier gain. The proposed idea of reshaping the circuit connections by reconfiguring GPIO pins can also be utilized for different sensing applications. Additionally, the proposed technique utilizing 3D-printed probes with FSRs introduces a promising and easy-to-implement concept to track the growing size of any object, such as corn seeds. Future work is still required to solve some issues with the friction between the probe parts and the sensitivity of the FSRs with the temperature. Additionally, to apply the concept of the proposed system for a large scale in the future, it may be required to utilize different connectivity with longer range such as wireless sensor networks rather than Bluetooth connection.


