1. Introduction
Cardiovascular disease is the number one cause of death worldwide [
1]. An electrocardiogram (ECG) registers the electrical activity of a heart, and it stands as a valuable diagnostic tool. However, in clinical routines, ECG analysis is performed as a visual inspection by a cardiologist, which is a tedious task, further aggravated in the case of long-term ECG. For instance, 24 h of Holter recordings contains around 100,000 heartbeats.
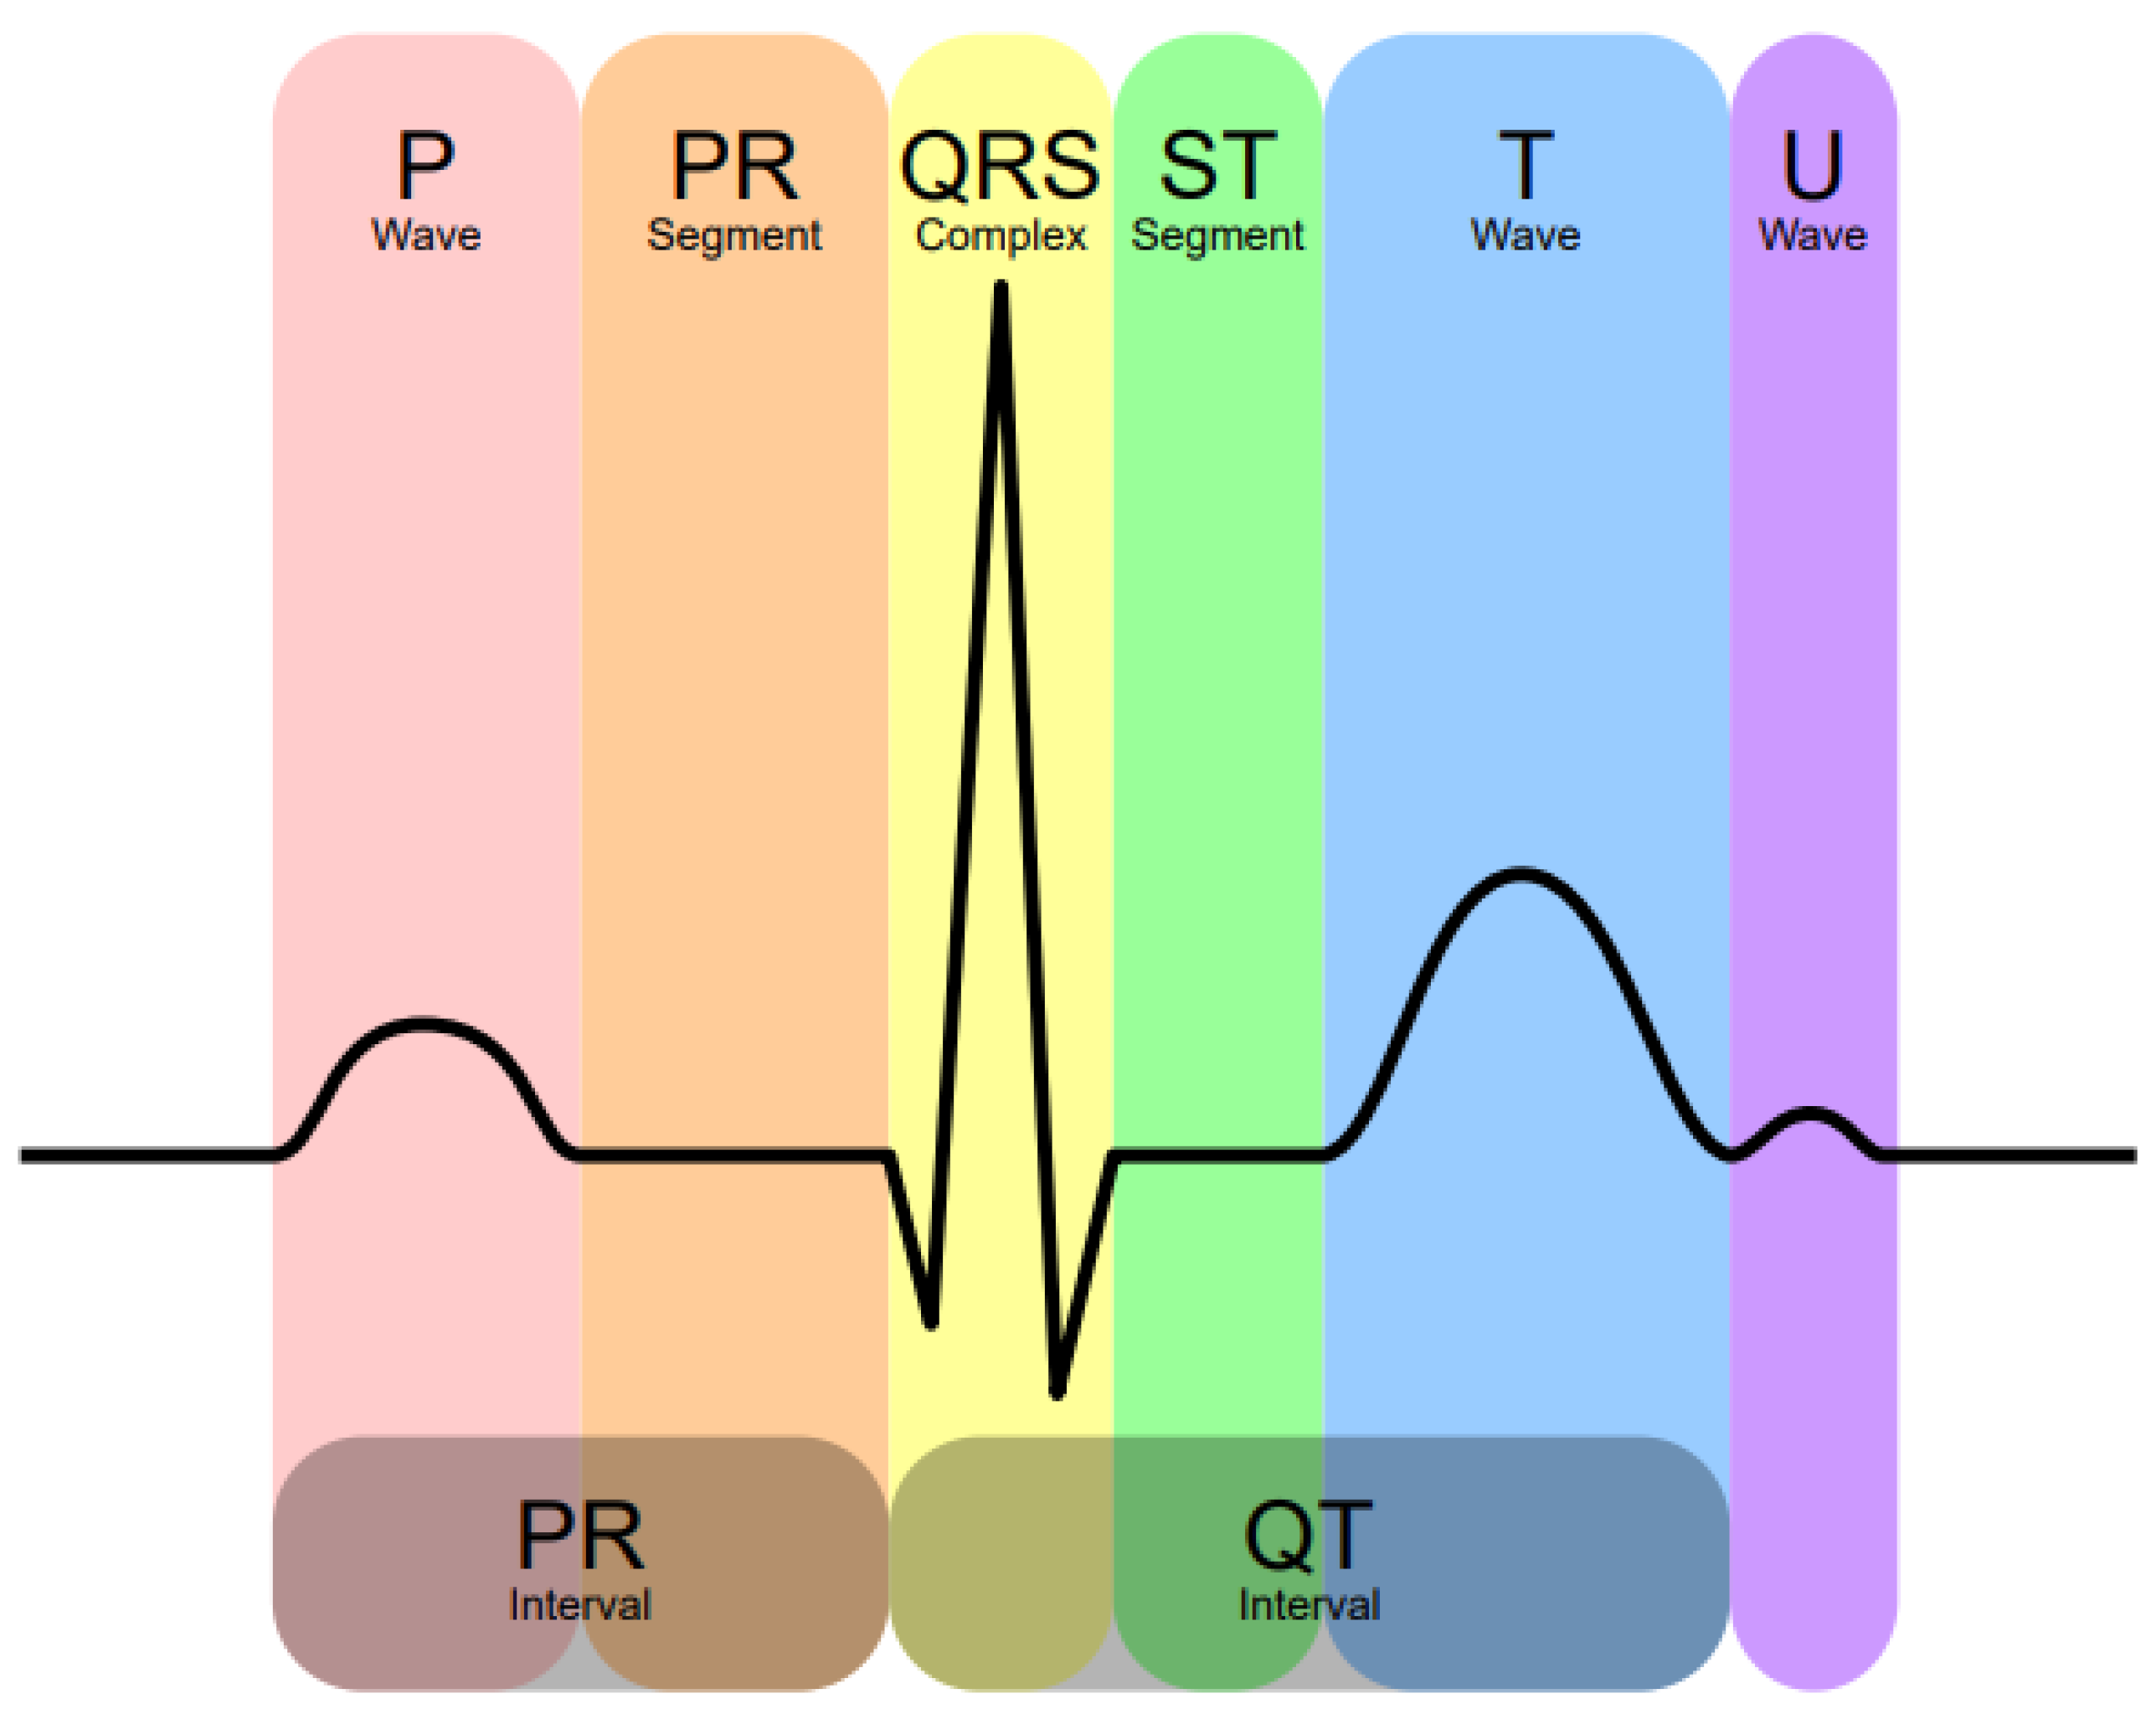
Figure 1 depicts the main components of the ECG, with the most important for diagnosis being the waves P, Q, R, S and T. The Q, R and S waves are normally studied together as the QRS complex. The P wave represents the moment when the auricles contract to send blood to the ventricles, and at the end of the PR segment, the ventricle is full. During the QRS complex, the ventricle expels their contents and are fully emptied at the end of the ST segment. The T wave indicates that the heart is at rest.
Developing efficient techniques to automate ECG analysis is instrumental in helping a cardiologist with their diagnosis. The detection of arrhythmias is of special interest [
2]. The QRS complexes of heartbeats can be successfully used to identify most arrhythmia types [
3,
4,
5]. The T wave does not contribute to the identification process [
6] and the P wave, even though it provides relevant information about arrhythmias, possesses a low signal-to-noise ratio (SNR), so it is not reliable [
7,
8].
ECG analysis starts with the detection and characterization of the beats [
9]. The detection of the QRS complex is carried out with a high accuracy; a 99.7% detection accuracy was reported in [
10]. As for the characterization of the beat, among the different methods [
6,
11,
12], the use of a function space based on Hermite polynomials has many advantages [
3,
10,
13]: dimensionality reduction, low noise sensitivity, etc. The ECG samples are fitted with a linear combination of basis functions, and the coefficients of this linear combination are used as features for representing heartbeats. As an example of the resulting dimension reduction, the 144-sample QRS complex obtained at a rate of 360 sps can be reasonably characterized with 6 or 7 parameters [
14]. Regarding the average classification error, values as small as
% are reported in [
15], thus supporting the development of new classifiers based on Hermite functions as well as hardware implementations able to provide high-quality real-time heartbeat analysis.
One disadvantage of the Hermite representation is that it is computationally demanding. There are some approaches addressing this problem. In [
16], graphics processing units (GPU) are used to accelerate the offline processing of Hermite fitting of heartbeats. The use of Field-Programmable Gate Array (FPGA) devices is supported in [
17]; in this paper, the results of an FPGA-based implementation aiming at wearable systems are presented. Reconfigurable devices (i.e., FPGA) allow for developing a custom architecture that can be adjusted to the different levels of computation performance and energy efficiency. Moreover, they can be used to prototype a system before being implemented as an application-specific integrated circuit (i.e., ASIC), which can achieve even better computation and electrical consumption performance. The developing times required for both FPGA and ASIC is quite long and complex in comparison with the traditional software approach (i.e., microprocessor-based or GPU-based), and high-level synthesis (HLS) tools have thrived in the last few years [
18,
19]. In this work, the HLS tool AHIR [
20,
21,
22] has been used. AHIR is an open-source alternative to proprietary products that allows us to generate RTL descriptions from C language with reduced development times.
The central contribution of this paper is the design and implementation of a novel hardware module able to characterize heartbeats in real time by means of Hermite functions. This module can be used as the input to systems to compress the ECG data as well as to classifiers. Despite the interest in producing hardware systems for real-time processing of ECG signals [
23,
24,
25,
26], to the best of our knowledge, this is the first time that Hermite function fitting with a complete preprocessing chain is implemented in hardware for ECG processing. The main contributions of this paper are as follows:
Novel hardware implementation of full processing chain for real-time ECG characterization based on Hermite functions;
Introduction to the AHIR HLS tool;
Implementation of the system in a low-cost FPGA-based board; and
On-board power consumption measurements.
The paper is organized as follows:
Section 2 elaborates on the Hermite fitting of heartbeats; in
Section 3, the AHIR tool is presented;
Section 4 describes the system implemented on an FPGA device; the implementation results are in
Section 5, and they are analysed in
Section 6; and, finally, the conclusions are drawn in
Section 7.
2. Estimation of the QRS Complex with Hermite Polynomials
As mentioned in
Section 1, QRS complexes are employed for arrhythmia detection and the use of Hermite functions allows us to reduce the number of dimensions involved in the ECG classification, without sacrificing accuracy [
3,
10] as well as enabling the transmission of ECG compressed data [
27]. Moreover, Hermite fitting representations are robust in the presence of noise.
The MIT-BIH arrhythmia database [
28] is used as a benchmark in this work. It contains 48 2-channel ECG recordings, sampled at a frequency of 360 Hz and with a duration of approximately 2000 beats (half an hour). Each beat has been manually annotated by at least two cardiologists, so it can be used to check the outcome of ECG automatic classification. The database includes an extended set of arrhythmias, and it has been extensively used in automatic arrhythmia classification [
4,
10,
29].
Prior to QRS characterization, the ECG signal must be processed to remove the base-line drift and high-frequency noise [
30]. The QRS complexes have a length of 70–100 ms; therefore, extracting a window of 200 ms around the peak (i.e., R wave) of the beat ensures that we acquire the complete complex while leaving the T and P waves out. The QRS window is expanded up to 400 ms by means of zero padding the extremes of the 200-ms window since the Hermite functions converge to zero in
. Thus, the QRS beat data used as an input to the Hermite polynomial approximation consists of a 144-sample vector
that can be estimated with a linear combination of
N Hermite basis functions
by means of coefficients
(Equation (
1)). In this work, we use
, which provides a good compromise between having a compact representation and having a good accuracy in the representation of the beat [
14].
The aim of the Hermite fitting is to find the approximation to the QRS complex
with the best minimum-mean-square-error (MMSE). The approximation of
is expressed as
with
where
is the
Hermite polynomial. The Hermite polynomials can be computed recursively as
The parameter
is a time-scaling factor in the polynomials that adjusts the width of the Hermite functions to the one of the actual QRS complexes. The maximum value of
for a given order
n is studied in [
3].
Give
, the orthogonality of the Hermite basis function allows us to find the optimal coefficient—those that minimize the square error—as
In order to find the best fit, the MMSE approximation for each
is obtained, and the one with the smallest value is kept. As a result, each heartbeat is represented by a set composed of the best
and the corresponding fit coefficients
and it is possible to use only these parameters to perform the morphological classification of the heartbeats [
3,
29].
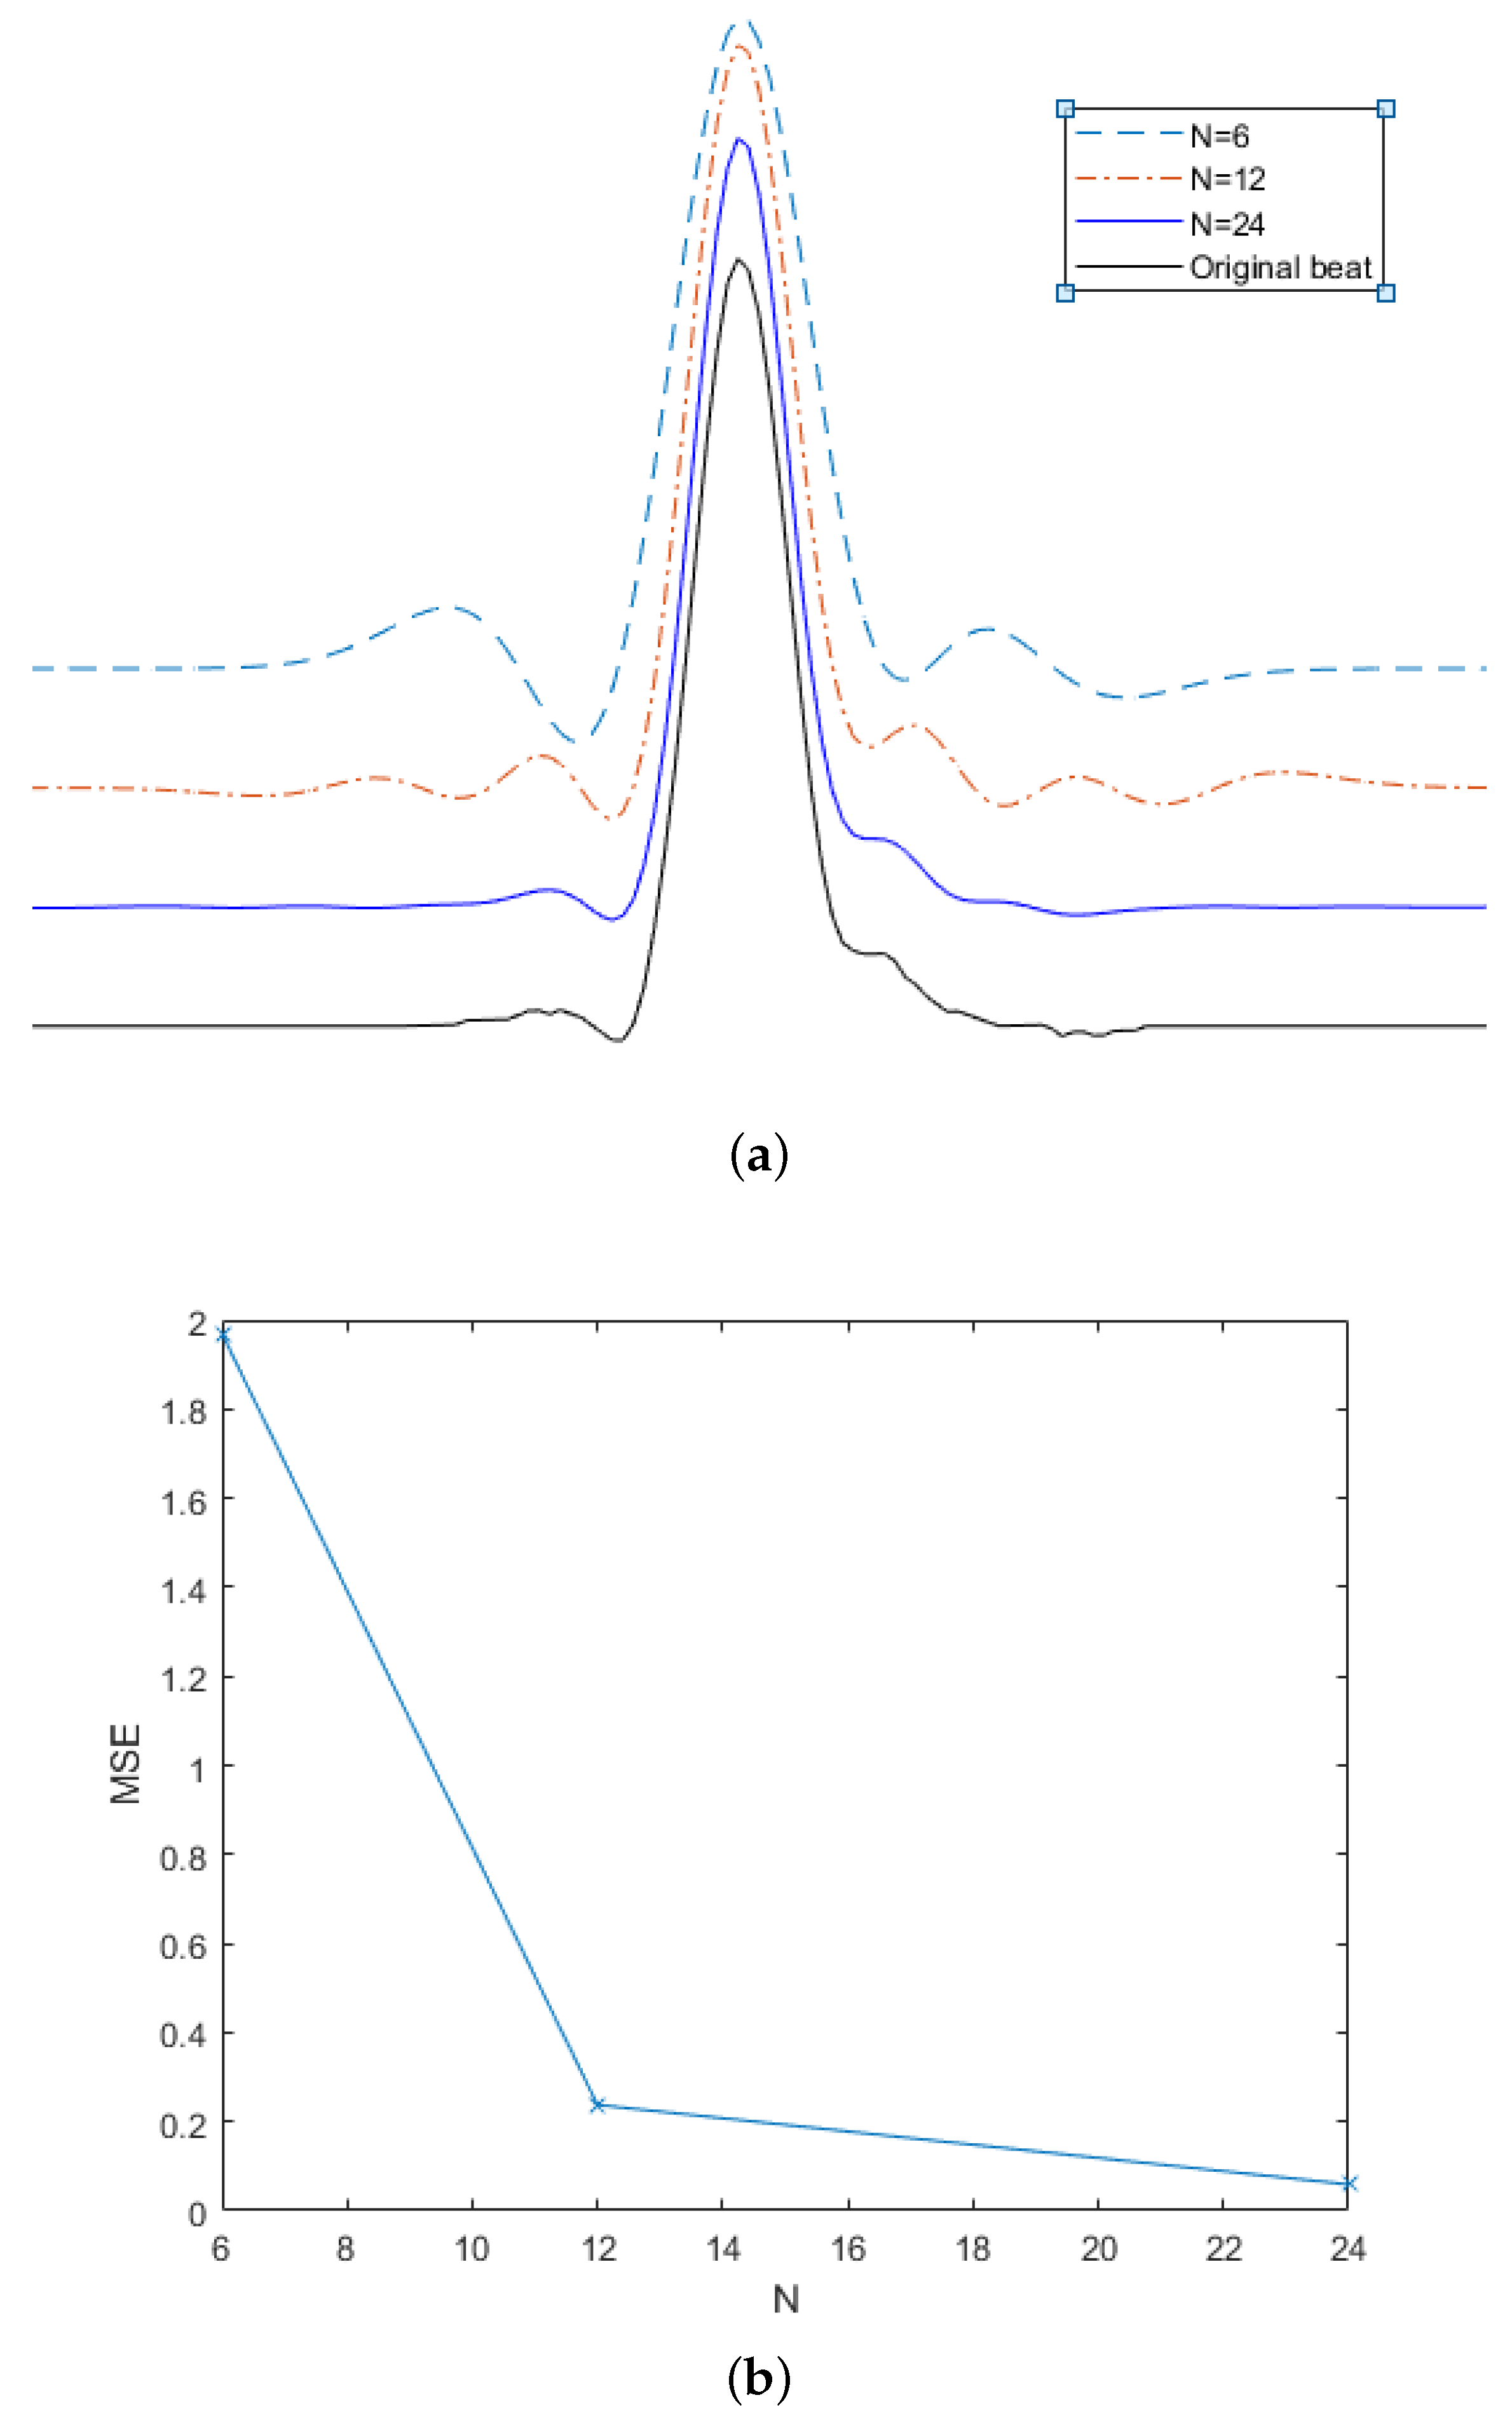
Figure 2 depicts the effect of increasing the number of Hermite function in the beat estimation.
Figure 2a shows the original beat (in black) and the estimation with
. It can be seen that, as long as the value of
N is increased, the estimation captures the variations of the heartbeat in more detail.
Figure 2b shows the decreasing trend of the minimum square error (MSE) for each estimation.
4. Implementation of the System
The analysis of an ECG signal received from a sensor goes through the following steps:
Initial signal filtering to remove noise and drift;
ECG beat recognition and identification of the QRS complex;
ECG beat feature extraction: this can be performed in various ways. We look at the use of Hermite polynomials for the same;
ECG classification: based on the beat features, classify the beat as normal or anomalous. This last step is not part of the current work.
We have implemented a signal chain that integrates the first three steps in the list above. Our main contribution is that we have built a custom hardware implementation of the entire signal flow up to Hermite classification, and demonstrated that sophisticated low power, real time ECG analysis is possible in hardware and that high level algorithm to hardware design techniques offer a practical pathway to such realizations.
The incoming ECG signal is assumed to be generated by an 11-bit ADC with a sampling rate of 360 Hz. For all experiments described in this report, we used 11-bit sampled data from the MIT arrhythmia reference database [
28]. The initial signal processing such as the band-pass filter characteristics and the algorithm for QRS detection have been well studied in the literature [
30]. The use of Hermite polynomials to extract features from the ECG signal has also been studied extensively [
3,
10,
29].
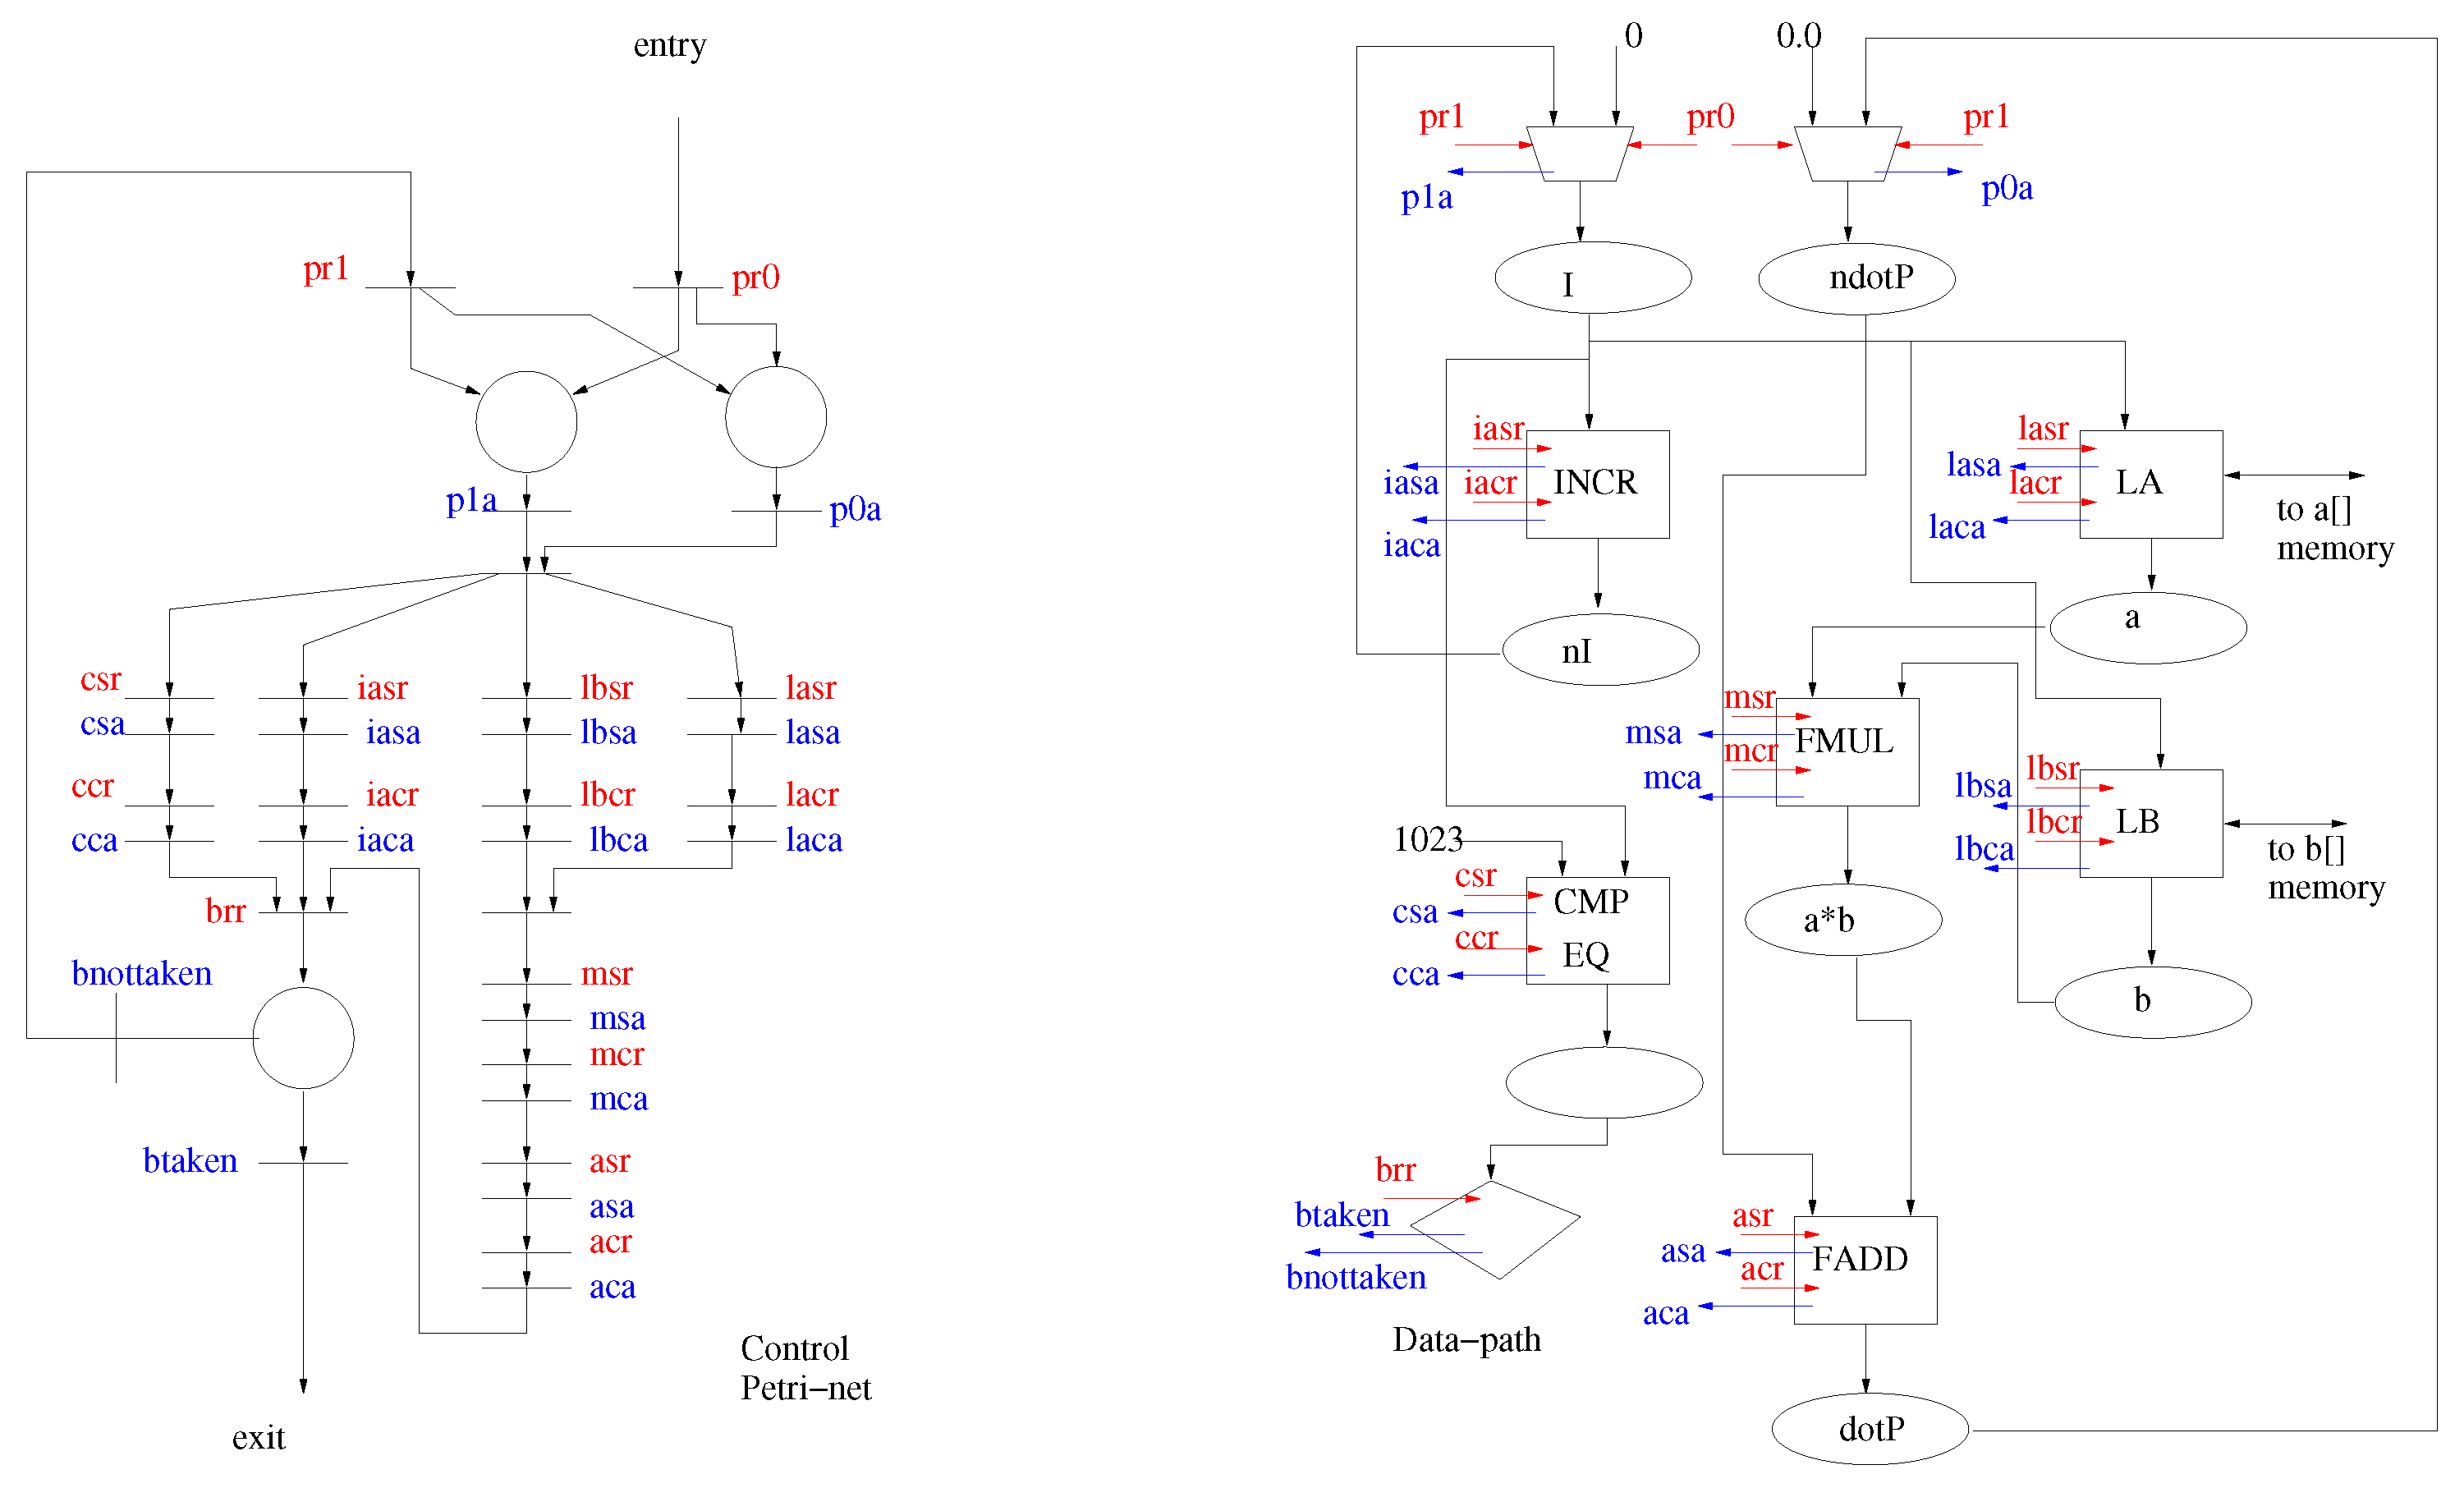
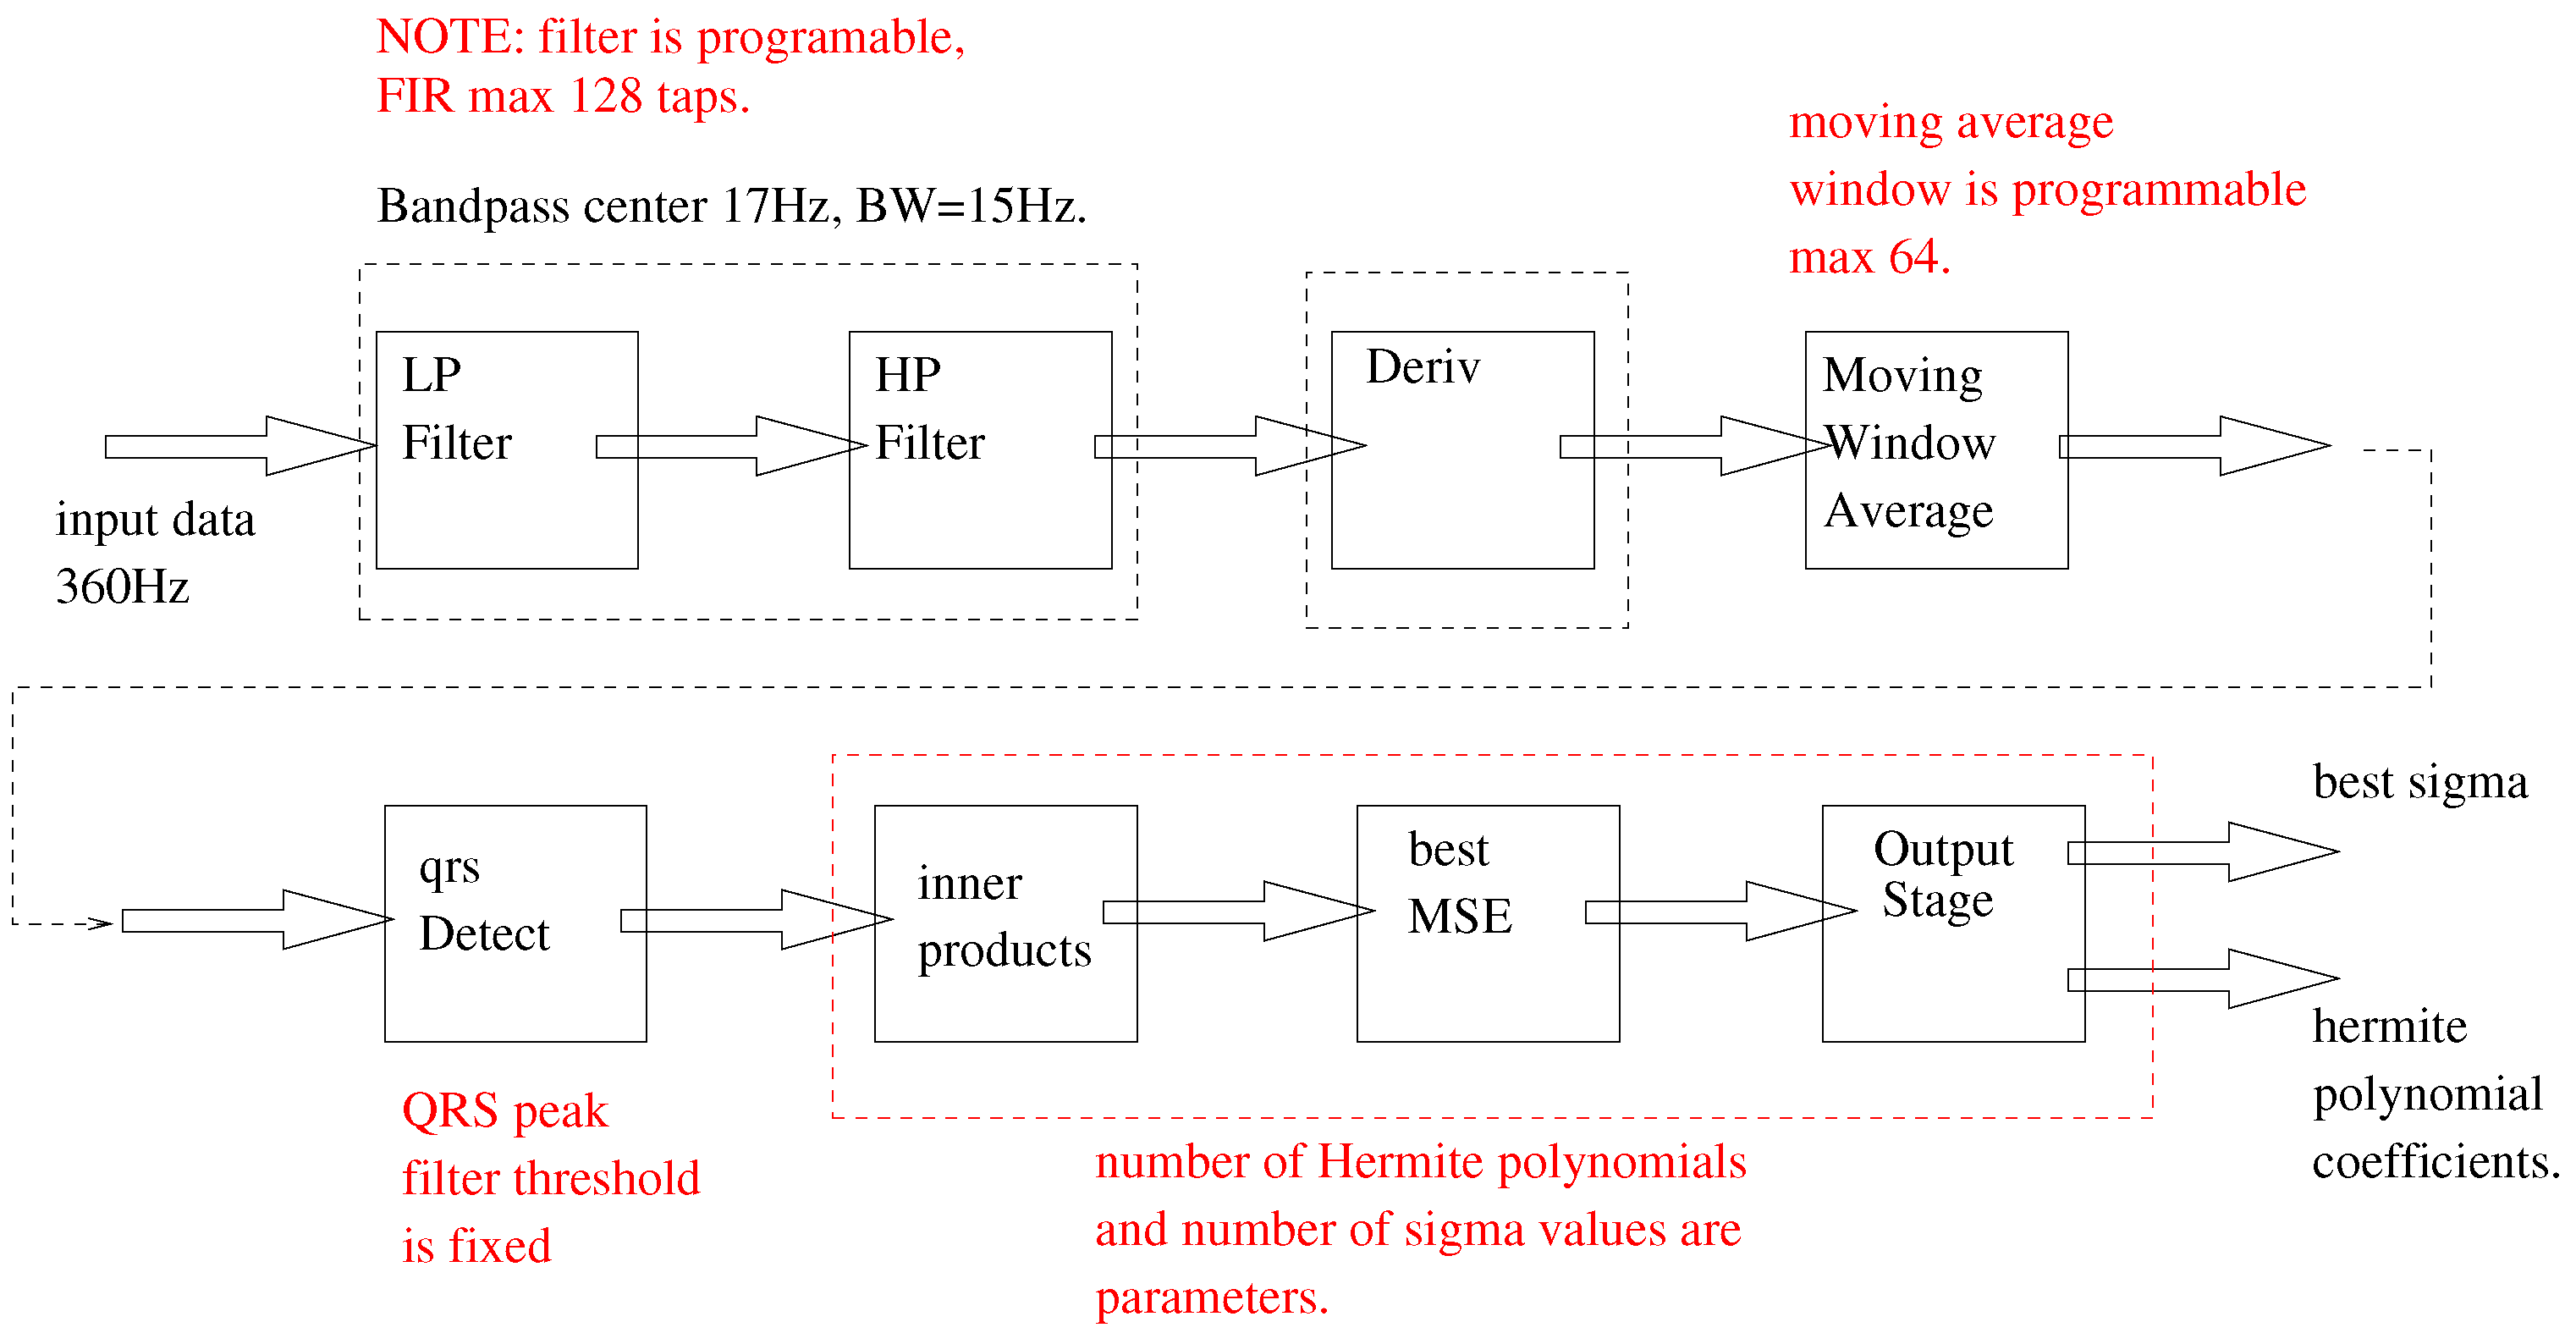
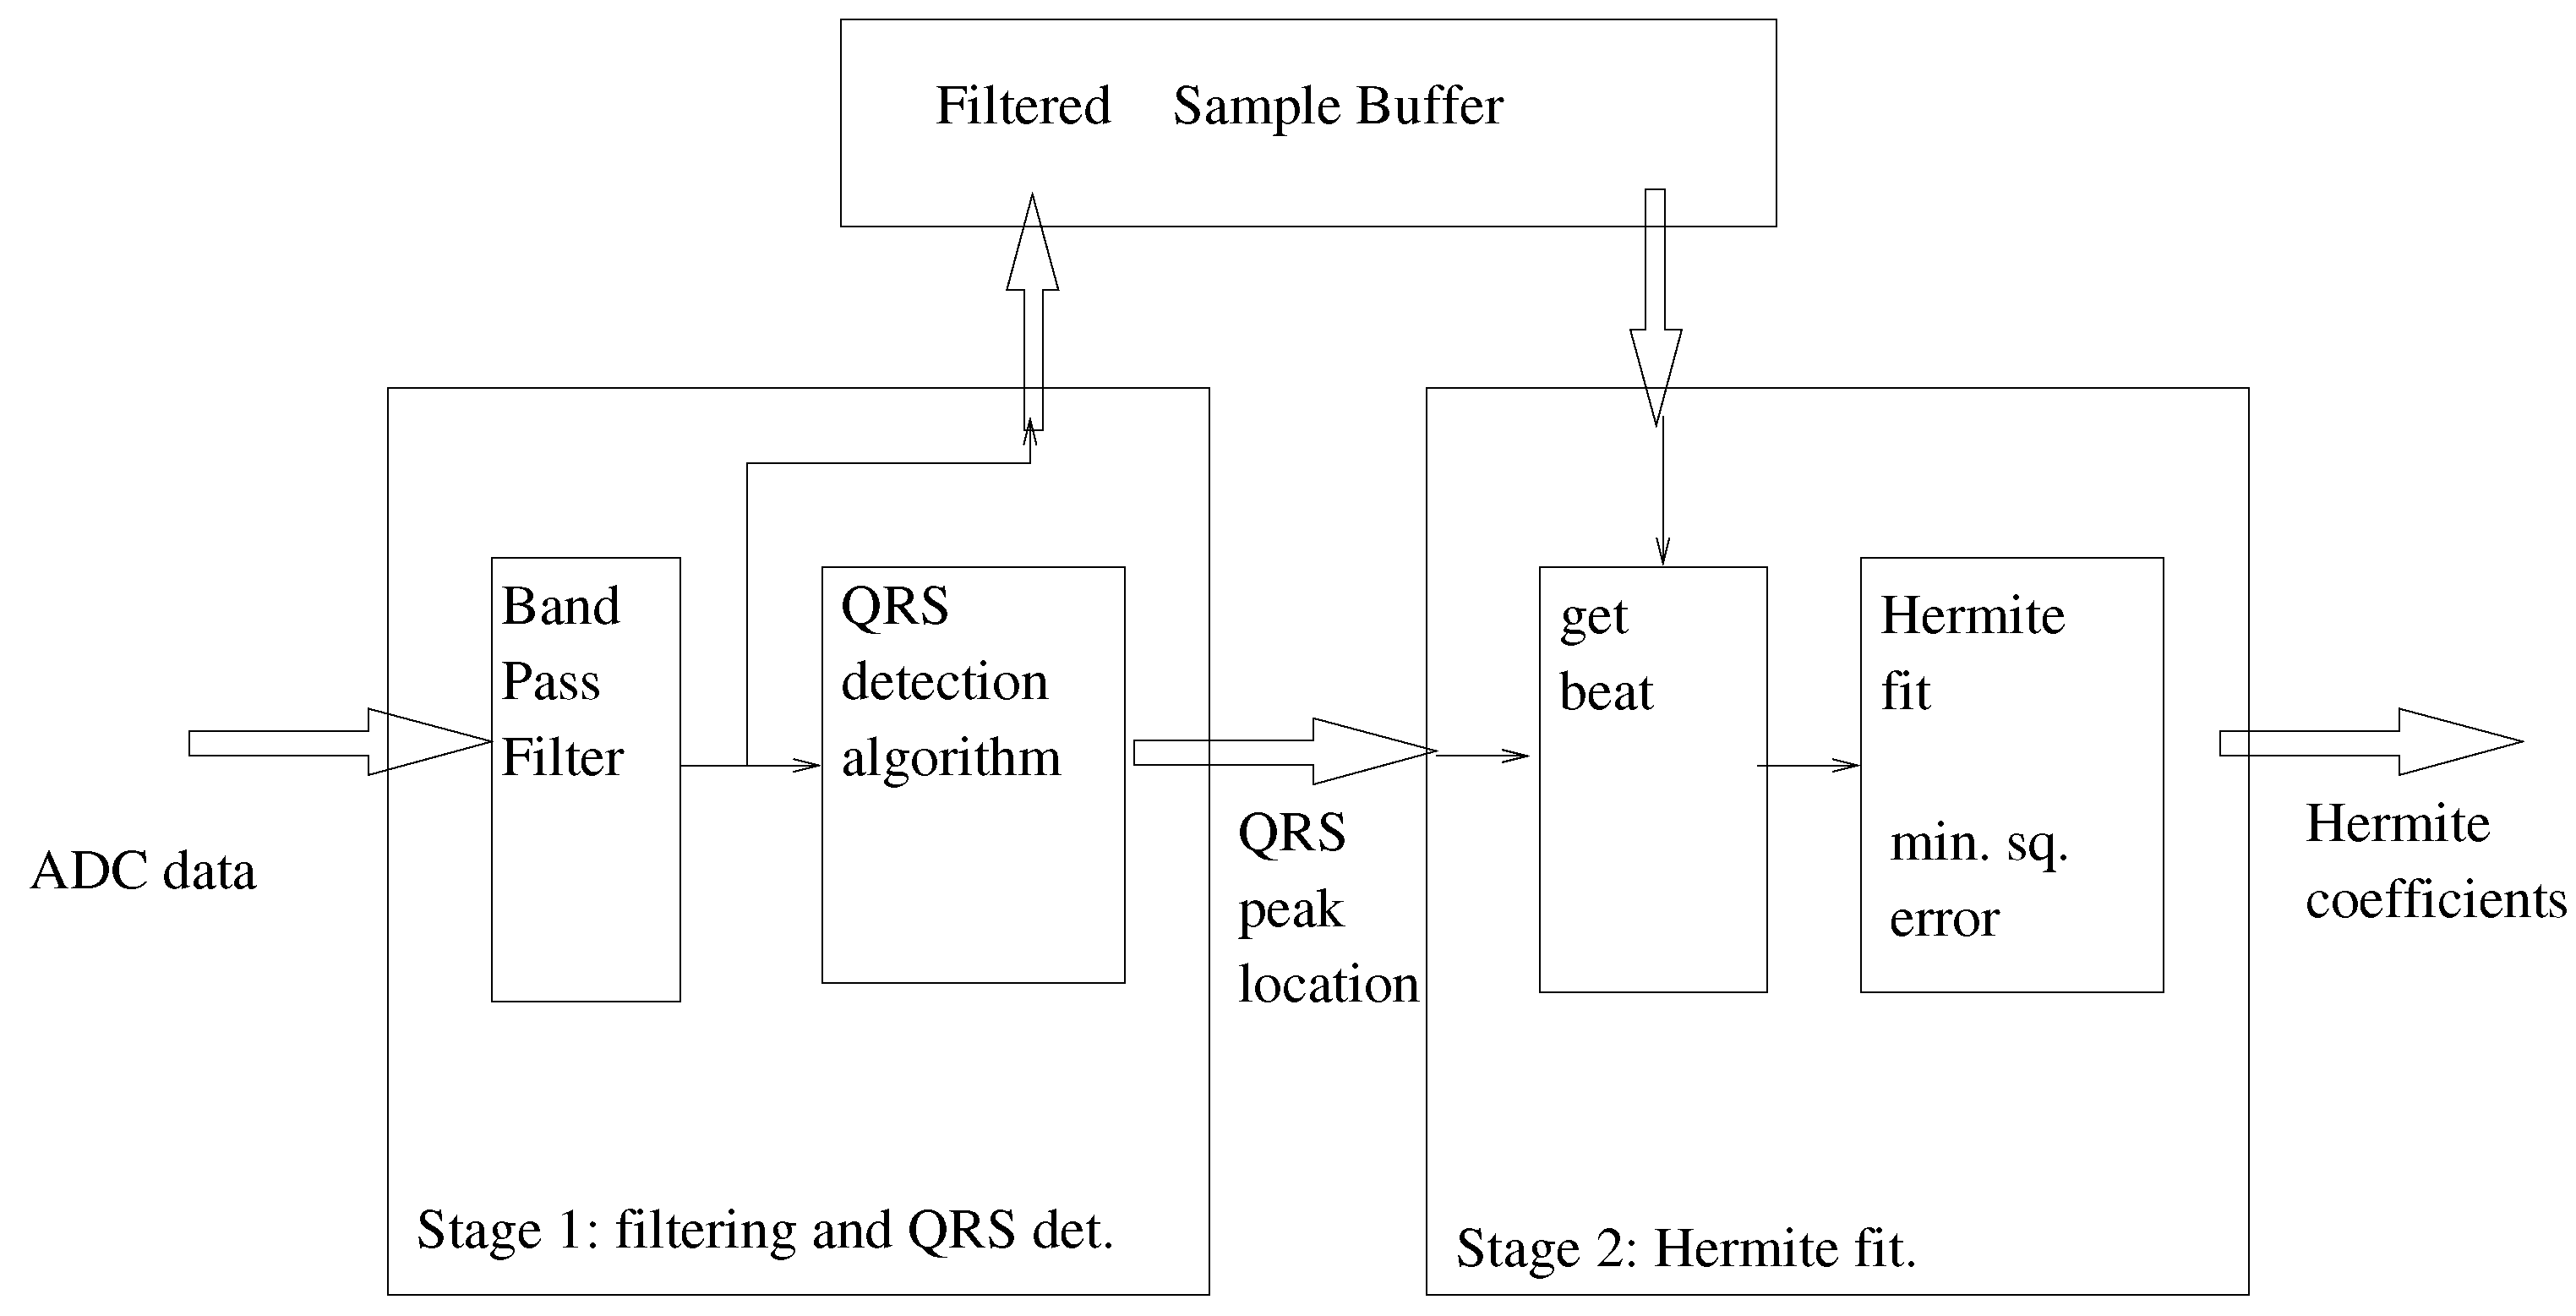
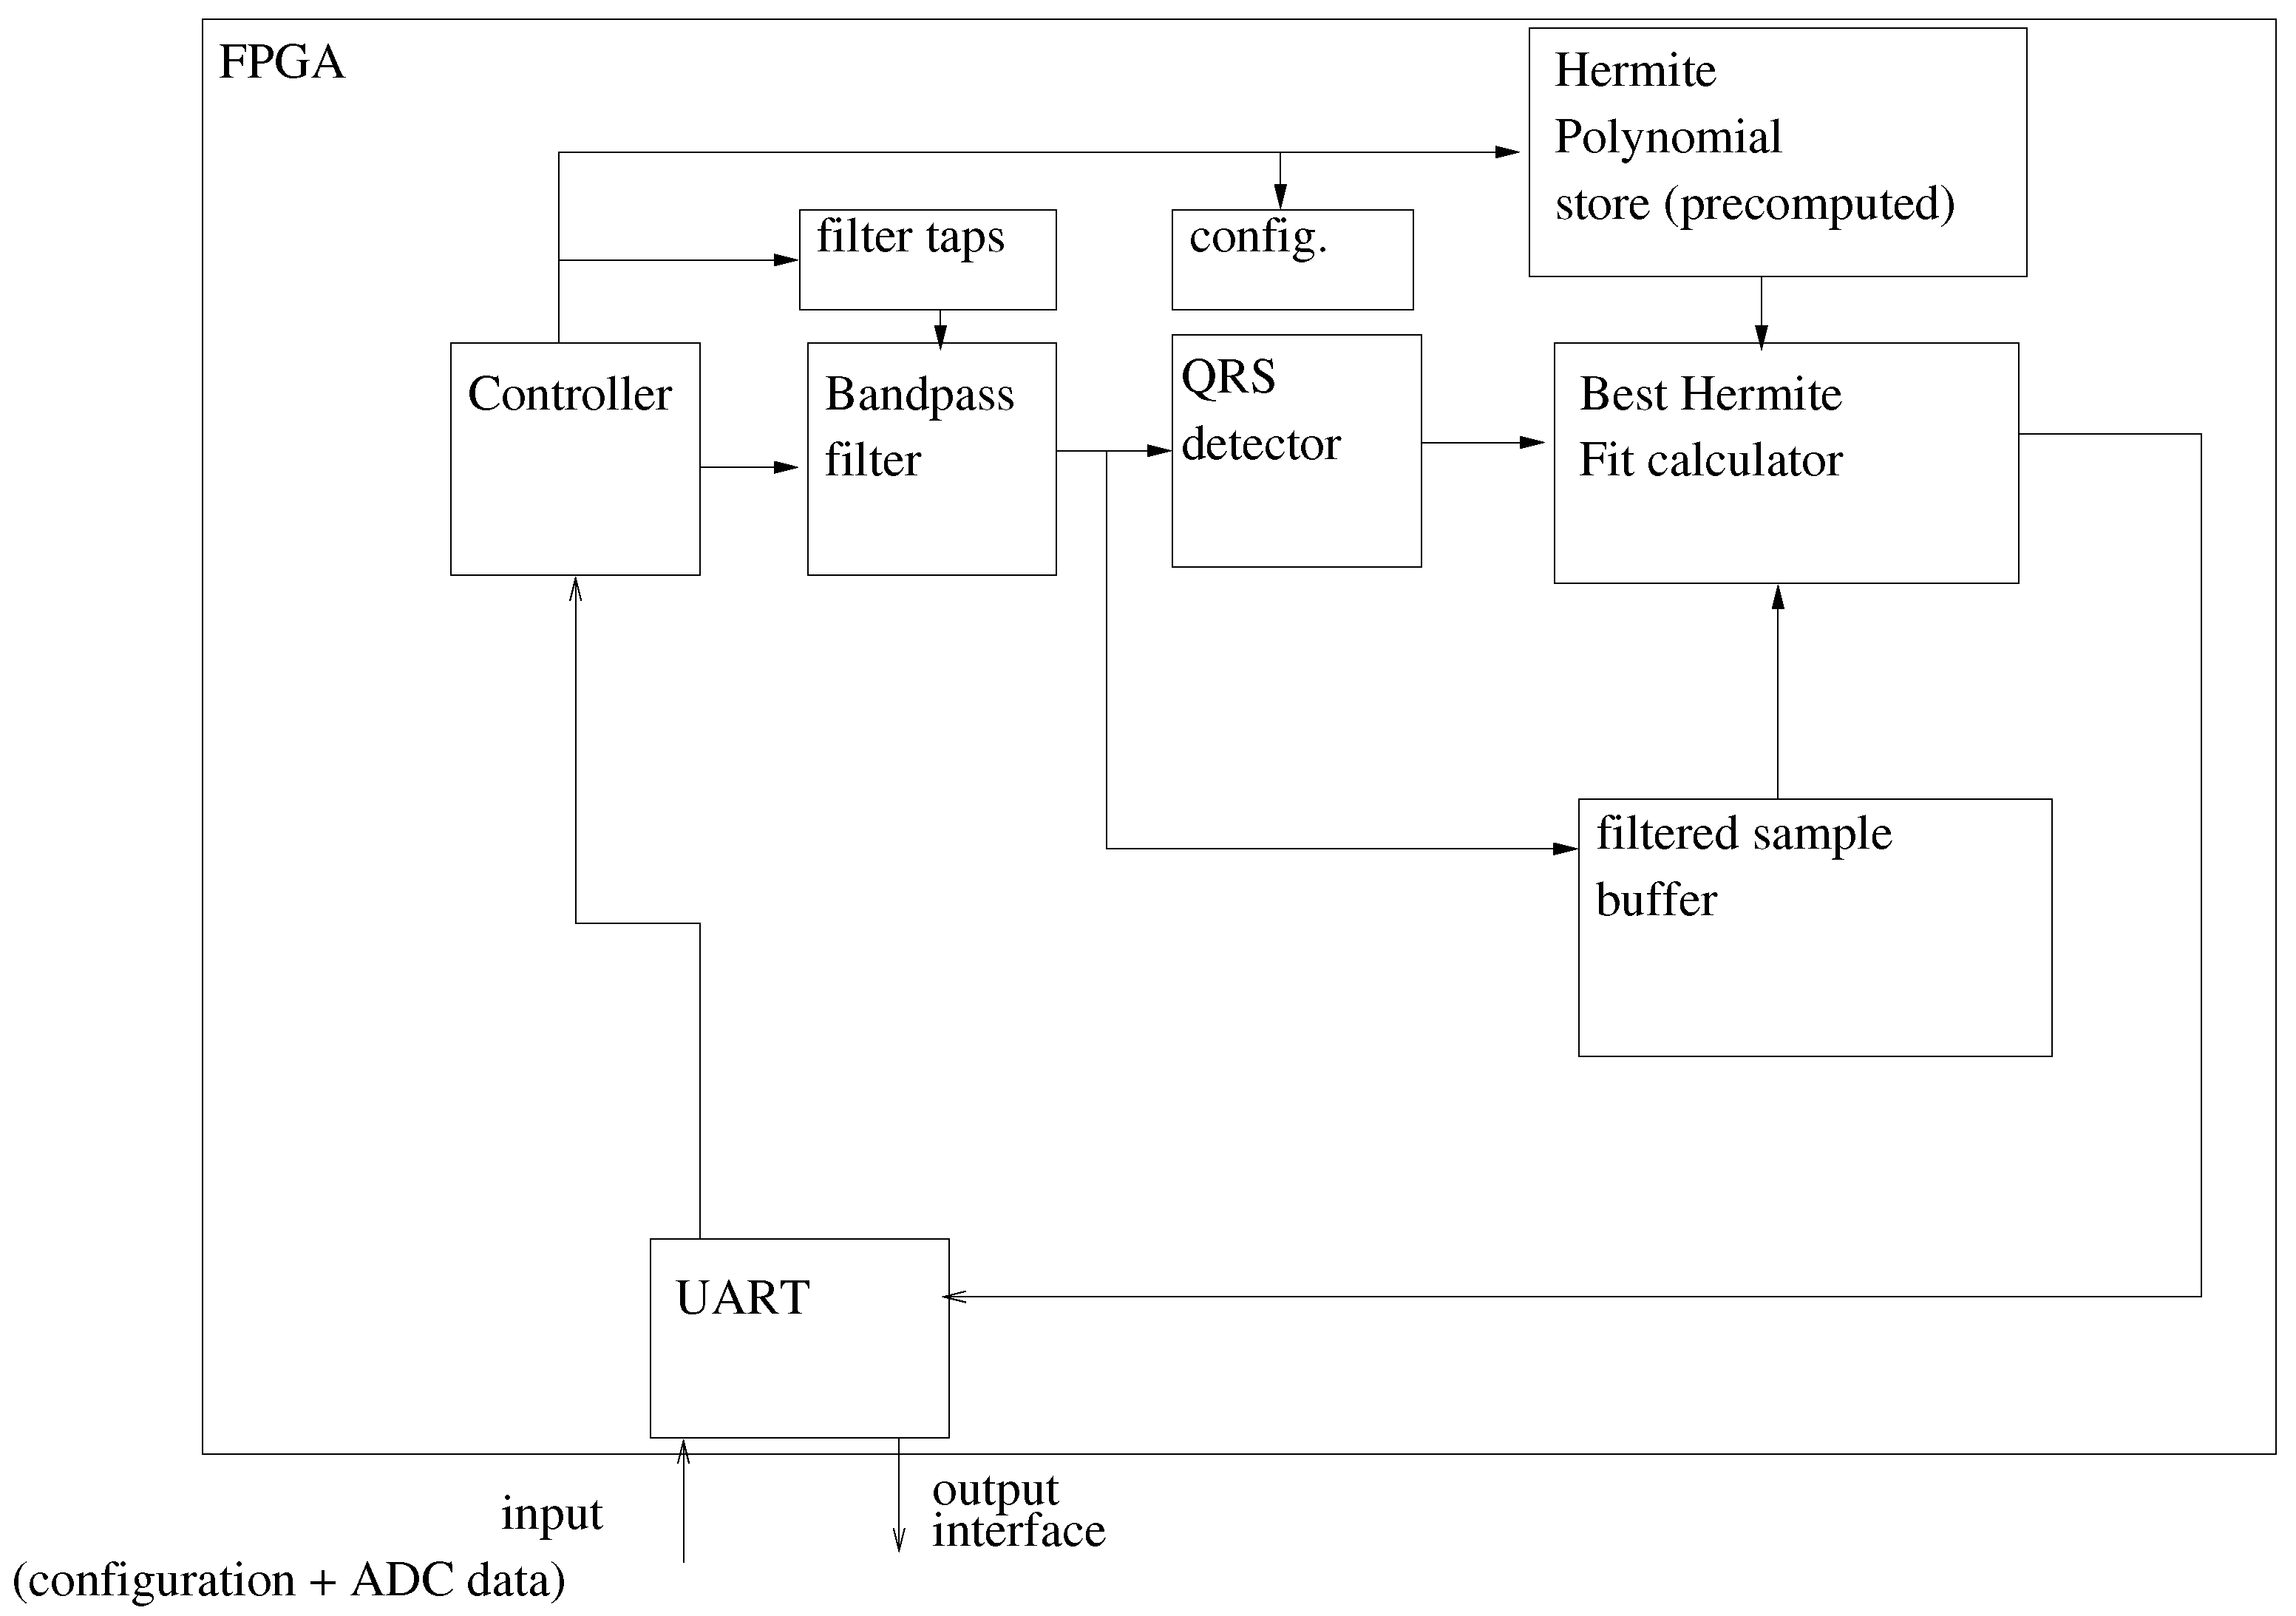
The entire signal chain is illustrated in
Figure 4. In our implementation, the signal chain is divided into two stages. The first stage (the front-end) is responsible for the signal filtering and the QRS peak detection. The second stage takes the identified beats and calculates a best Hermite-polynomial fit for the identified beat. We illustrate this division in
Figure 5. All the elements of the signal chain are explained in
Section 4.1 and
Section 4.2.
Section 4.3 elaborates on the final system architecture included the signal chain as well as the control block and communications interfaces.
4.1. Algorithmic Description of the First Stage
The first stage is responsible for the filtering and QRS peak detection, and the sequence followed is shown in
Listing 1.
Listing 1. First stage algorithm.
Listing 1. First stage algorithm.
void controllerDaemon ()
|
{
|
initializer();
|
uint32_t sample_index = 0;
|
while(1)
|
{
|
int32_t sample = getAdcSample();
|
int32_t filtered_sample =
|
applyBandPassFilter(sample);
|
// filtered results pushed into buffer (for use by Hermite
|
// fitter)
|
pushIntoFilteredResultBuffer(sample_index, filtered_sample);
|
int32_t derivative_sample =
|
applyDerivativeFilter(filtered_sample);
|
int32_t moving_average_sample =
|
applyMovingAverageFilter(derivative_sample);
|
int32_t qrs_peak =
|
applyQrsDetector(sample_index, moving_average_sample);
|
if(qrs_peak >= 0)
|
{
|
// correction by subtracting insertion delay.
|
corrected_qrs_peak = qrs_peak - inserted_qrs_delay;
|
sendToSecondStage(corrected_qrs_peak);
|
}
|
sample_index++;
|
}
|
}
|
4.1.1. The Band-Pass Filter
The bandpass filter used is a 99-tap FIR filter with 16-bit taps. The pass-band is set between 6 Hz and 28 Hz. The stop-band attenuation is chosen to be −40 dB. We acknowledge the use of an online filter design tool (
http://t-filter.engineerjs.com) [
31].
The band pass filter is programmable and can have a maximum of 128 16-bit taps. The implementation of the band-pass filter is shown in
Listing 2.
Listing 2. The band-pass filter.
Listing 2. The band-pass filter.
int32_t applyBandPassFilter(int32_t sample)
|
{
|
pushSample(wp, band_pass_filter);
|
int32_t ret_val = dotProduct(band_pass_filter);
|
return(ret_val);
|
}
|
4.1.2. The QRS Detection Algorithm
The QRS detection algorithm is implemented in three stages:
The band-pass filter outputs are sent through a derivative filter. This acts as a high pass filter that identifies the regions of rapid change (including the QRS complex);
The output of the derivative filter is rectified and integrated using a moving average filter with 32 taps. The strong peaks of the sequence generated by this moving average filter are expected be in correspondence with the peaks of the QRS complex;
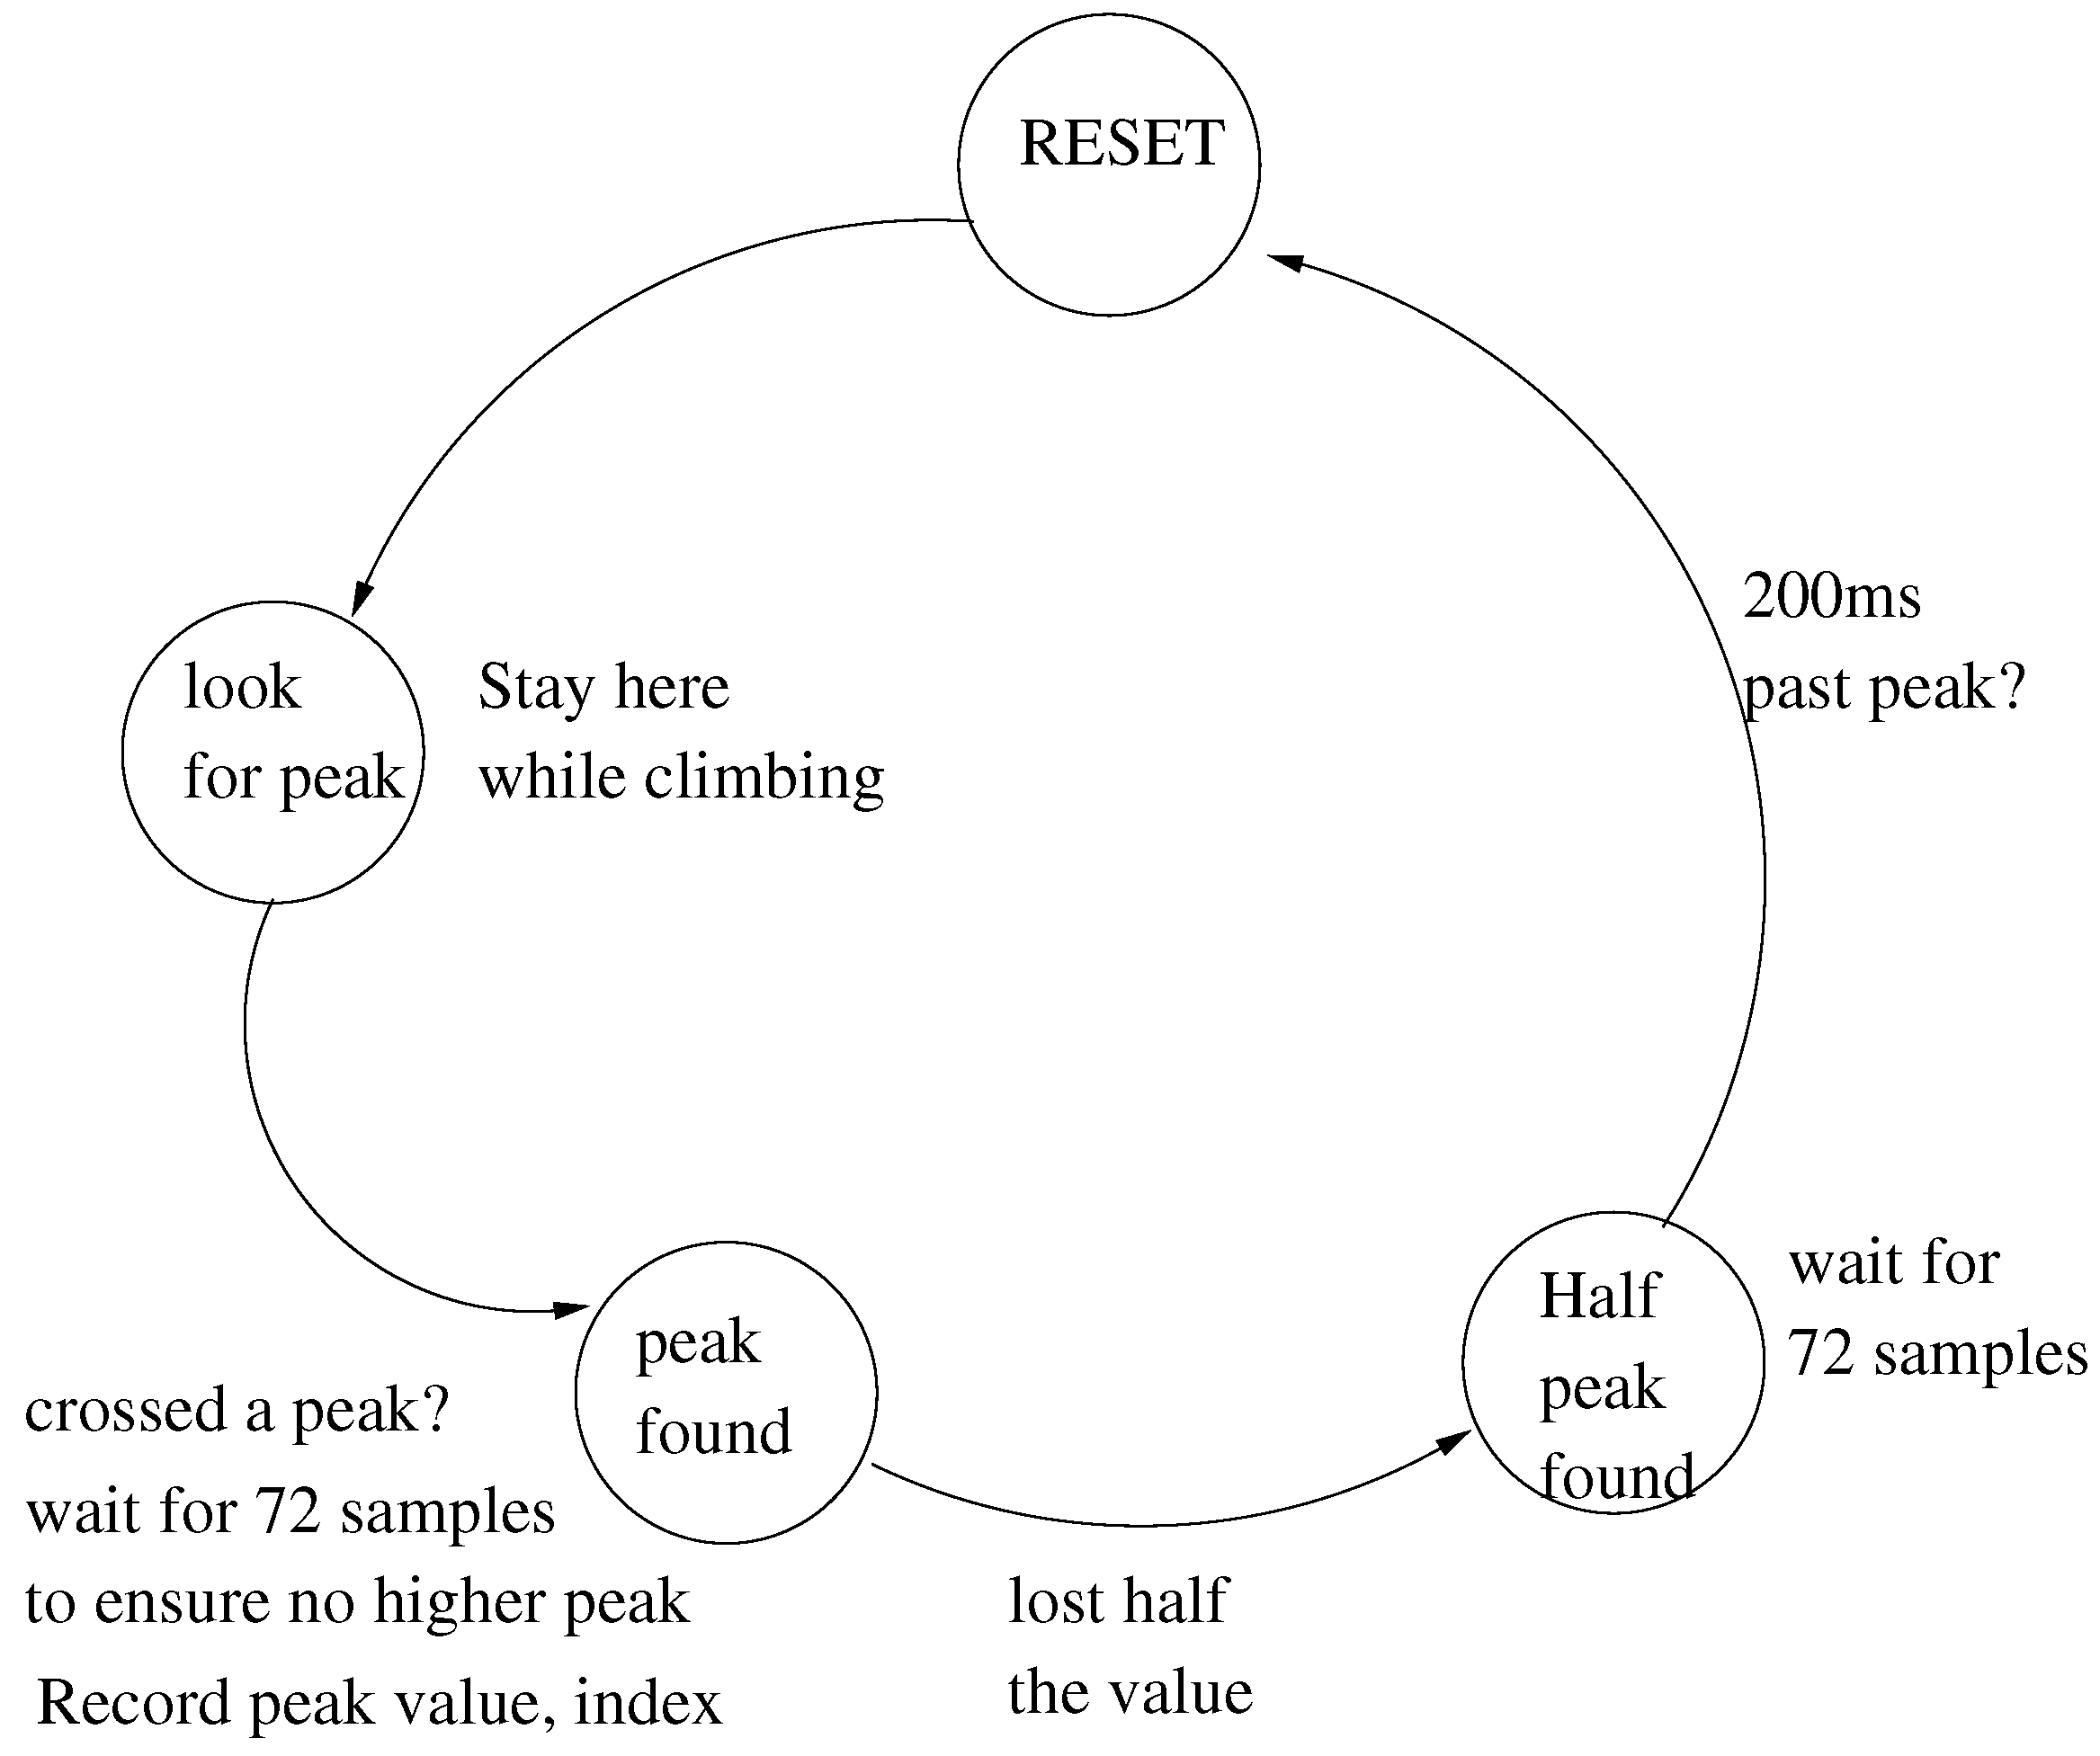
The output of the moving average filter is analysed by a threshold crossing state machine that attempts to identify the center peaks of the QRS complex.
The threshold crossing state machine is illustrated in
Figure 6.
For the sake of brevity, we do not present the entire C code of the finite state machine. However, a summary of the C code is shown in
Listing 3. The algorithm gives the position of the QRS peak, and the heartbeat for further analysis consists of 144 samples centered at this peak.
Listing 3. QRS peak detection FSM code outline.
Listing 3. QRS peak detection FSM code outline.
// single step of the QRS peak detection FSM.
|
int32_t applyQrsDetector(uint32_t time_step, int32_t sample)
|
{
|
int ret_val = −1;
|
switch(qrs_state.fsm_state) {
|
// depending on state, determine status
|
// and change state..
|
case RESET:
|
....
|
case LOOKINGFORPEAK:
|
.....
|
break;
|
case PROVISIONALPEAKFOUND:
|
.....
|
break;
|
case HALFPEAKFOUND:
|
.....
|
break;
|
default:
|
break;
|
}
|
return(ret_val);
|
}
|
4.2. The Second Stage: Calculation of Hermite Polynomial Fits
The first stage in the signal chain provides a QRS peak and a detected heartbeat (post band-pass filtering). Suppose
is the detected beat. The Hermite polynomial basis set consists of the first six Hermite polynomials and a scale factor
. The value of
ranges between a minimum value of
and
and is discretized into 10 values. Denote the Hermite polynomial with order
N and scale-factor
as
. We calculate the dot products
as
N varies from 1 to 6 and
varies as described above. The dot products are computed using single precision IEEE floating point arithmetic. The Hermite polynomial values are precomputed and stored in the hardware as tables.
The best fit is determined by the value of the scale factor
, which minimizes the mean square error
This value of
and the corresponding coefficients
are the features of the beat extracted by the Hermite fit. These values are used for further characterization of the beat as normal or anomalous [
10,
29].
The algorithm used for the second stage is shown in
Listing 4.
Listing 4. Second stage.
void hermiteFitterDaemon()
|
{
|
uint32_t beat_index = 0;
|
while(1)
|
{
|
// get the current beat from
|
// the filtered sample buffer.
|
getCurrentBeat();
|
// compute all the inner products.
|
ComputeInnerProducts();
|
// find the best fit.
|
computeMSE();
|
// report the best fit.
|
sendBestFitToOutput();
|
}
|
}
|
4.3. System Architecture
The system architecture follows the two stage approach described at the beginning of the section. The architecture is depicted in
Figure 7.
A UART is used to configure the system by downloading the pre-calculated Hermite polynomials, the filter coefficients, and some configuration parameters. In this case, there are sixty distinct Hermite polynomials, each with 144 samples, with each sample being coded in single precision IEEE floating point format (4 bytes per sample).
After the initial configuration, ECG samples are streamed to the hardware, and fit coefficients are extracted for every detected beat. The peak throughput and total latency in the signal chain are characterized.
5. Results
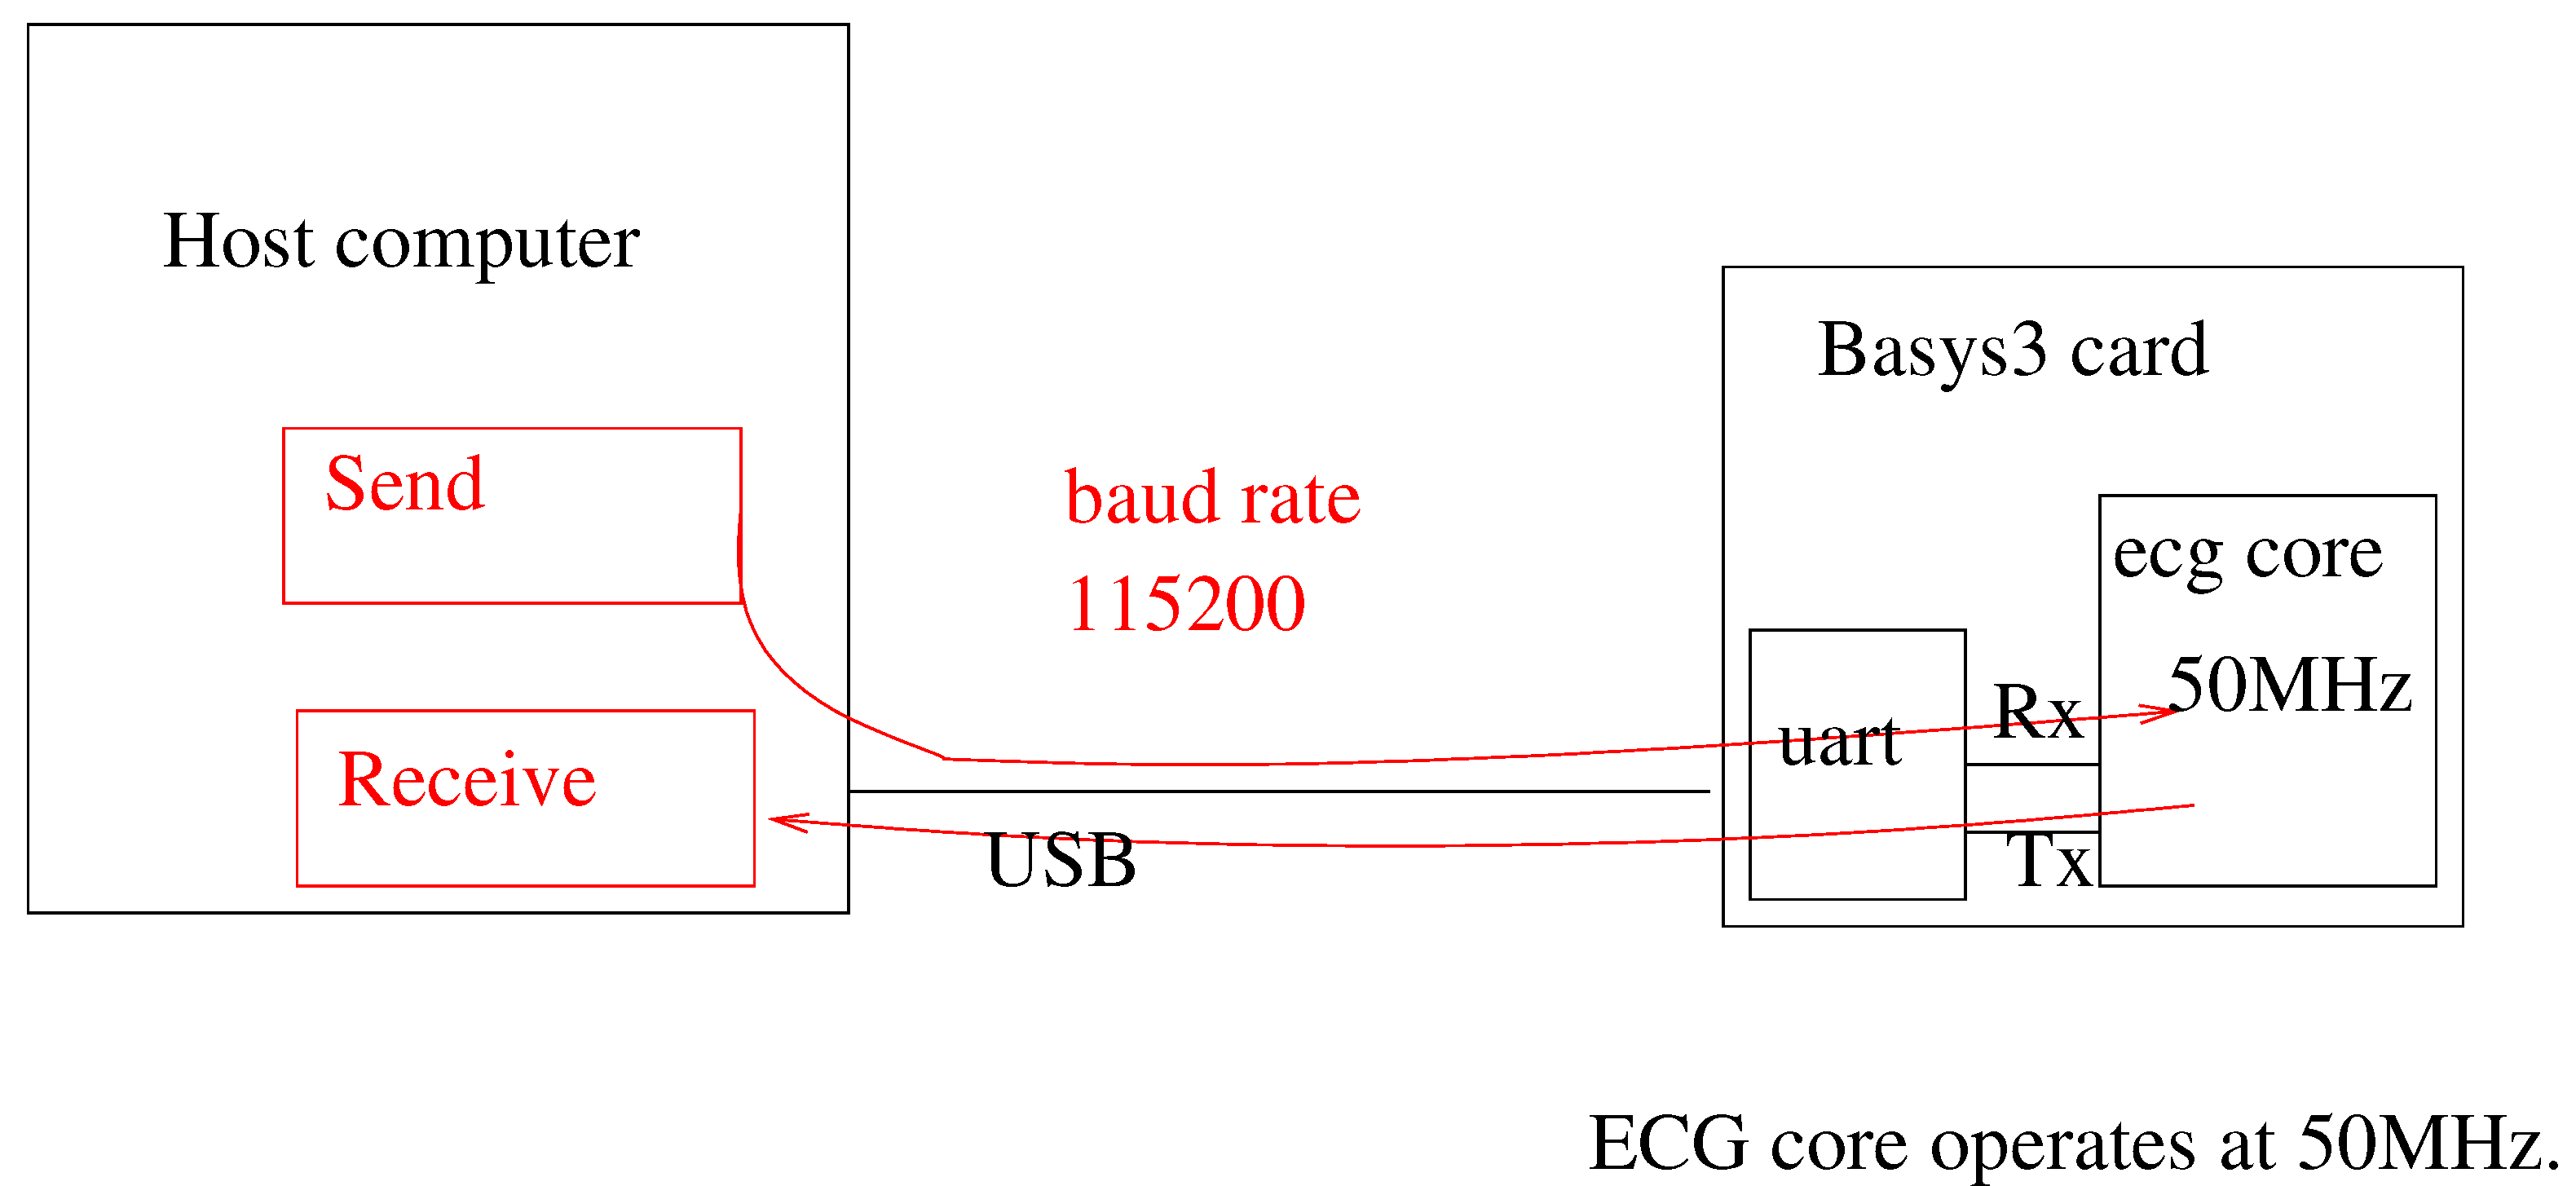
The Xilinx Artix 7 series FPGA xc7a35tcpg236 (Xilinx, San Jose, CA, USA) was used as the platform for the hardware implementation. In particular, we used the BASYS-3 FPGA board from Digilent (Pullman, WA, USA) [
32]. For synthesis, we used the Xilinx Vivado 2019.4 tools. The block diagram of the test setup is shown in
Figure 8. In this setup, the host computer first uses the UART to download the Hermite polynomial tables and the filter coefficients to the system. After this is performed, ADC samples are streamed to the FPGA over the UART at a baud rate of 115,200. The post Hermite fits and QRS peak locations are monitored by an application on the host computer. It must be stressed that AHIR allows for simulation of the system by using benchmarks written in C. During the simulation, it is possible to select if the simulation is using the compiled C files or if the hardware
functions are simulated by means of an HDL simulator (i.e., GHDL). In both cases, the input vectors are read from files and the output vectors are stored also in files, so it is possible to check the correctness of the hardware implementation.
For the overall system, we present the
The hardware utilization;
The latency through the signal chain;
The throughput through the signal chain;
The power dissipation in the system due to the computation activity; and
The reconstructed waveforms from the calculated Hermite polynomial fits.
The summary of resource utilization is shown in
Table 1. For these particular FPGA devices, the limiting factors are the look-up tables (LUT). Thus, devices with more logic resources are required if the order of the polynomial is to be increased.
To measure the latency in the entire signal chain, we timed the difference between the entry of the first byte of an ECG sample and the exit of the last byte of the Hermite characterization for the corresponding beat. For the throughput, we observed the maximum rate at which beat data could be supplied to the system. For a clock of 50 MHz, the latency and throughputs obtained were 0.82 s and 3 beats/s.
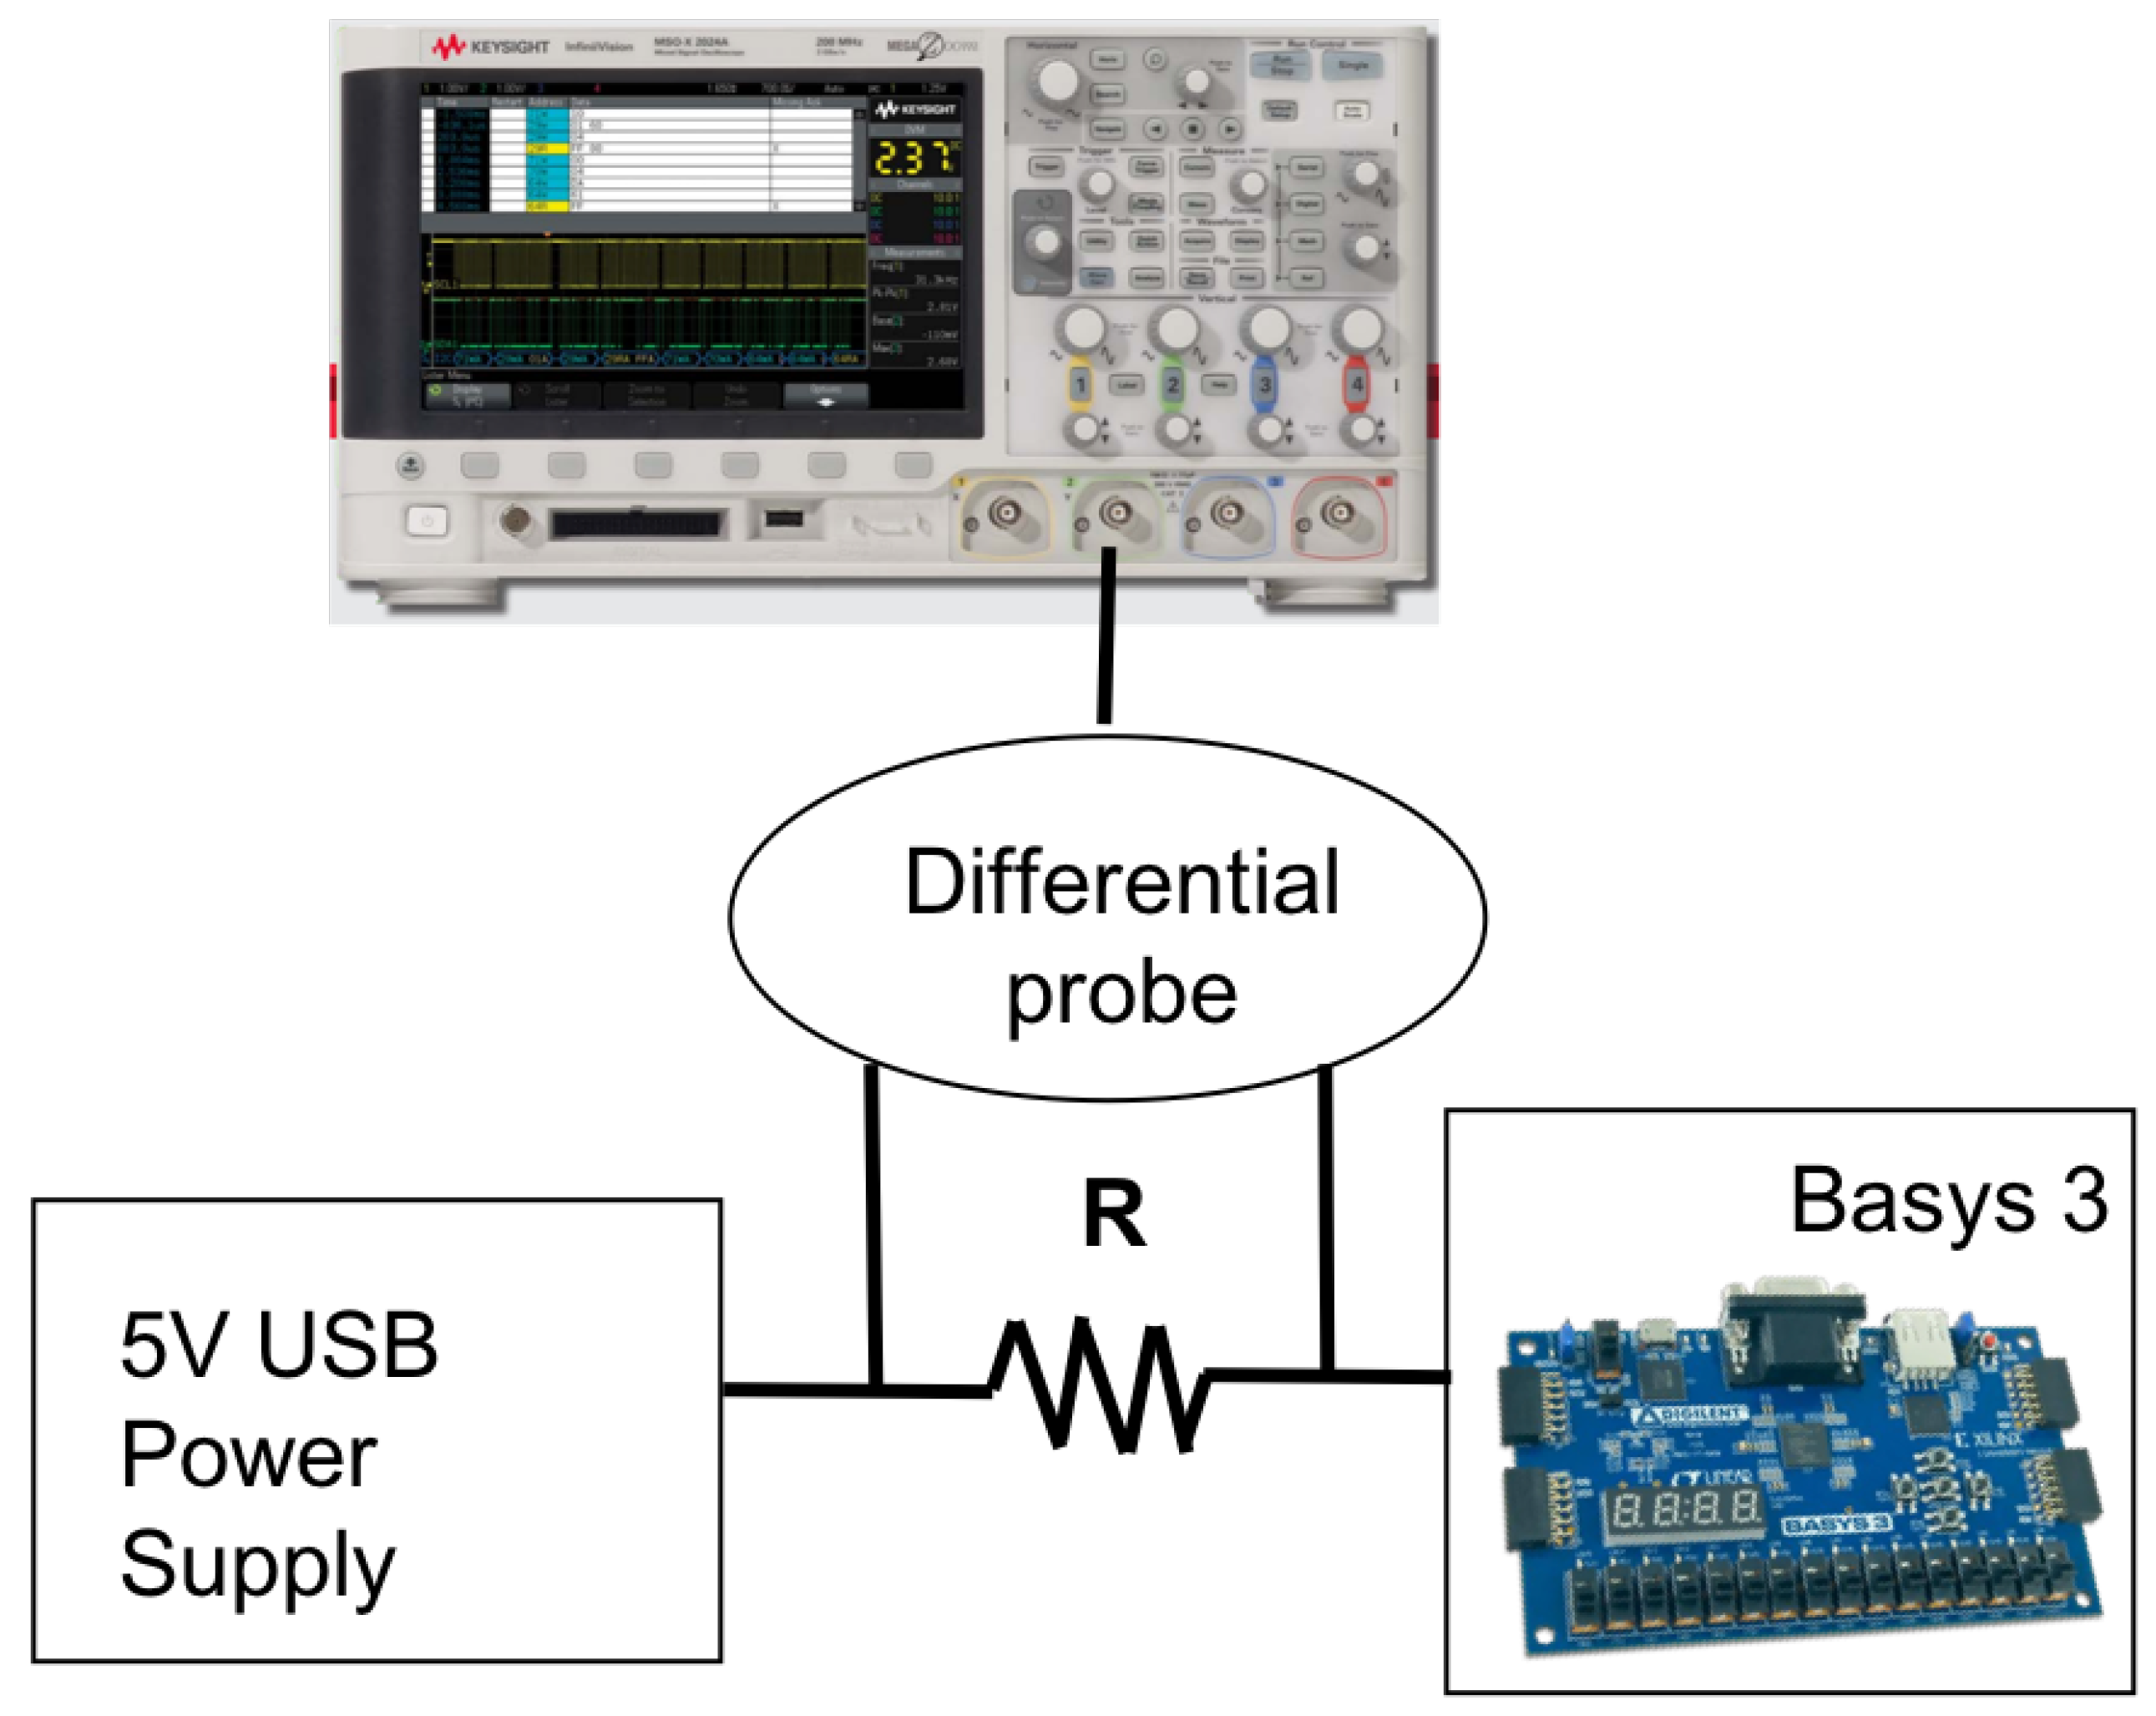
To characterize the power consumption, we observed the difference between the idle current drawn by the FPGA when it was quiescent (unprogrammed) and the current drawn by the FPGA during full speed (maximum throughput) operation. We use the power measurement setup presented in
Figure 9.
Basys 3 board features a jumper JP2 that is used as power source select and is located at the entrance of the power supply. It selects whether power supply comes from the USB cable or External power supply. In this work, we use USB power supply of 5 V. We add a shunt resistance over this jumper and use differential probe to measure the voltage over the shunt. Since the resistance is in series with the power supply, we are able to obtain the current that goes to the board from the power supply. By knowing the input voltage and input current, we obtain the power consumed by the board. The resistance value is chosen to ensure the correct functionality of the power supply regulators located on the Basys 3 board, as explained next.
Voltage regulator circuits create the required 3.3 V, 1.8 V and 1 V from the main power supply [
32]. A power supply of 1 V is used for an FPGA core; 1.8 V is used for an auxiliary FPGA supply and RAM memory; and 3.3 V is used for IO pins, USB connection, clocks, Flash, etc. Based on typical and maximum current values for each of these supplies, listed in [
32], we compute an approximate value for the shunt resistance. According to our estimates, the peak current values for the design should not exceed 80mA, and current demand on the other two supplies should not be extreme either. As a result, when maximum typical current values for the 1.8 V and 3.3 V (150 mA and 1.5 A, respectively) and 80 mA for the 1 V supply are assumed, an approximate value for the resistance is 0.52
. We use 0.47
for our measurements as a value that is close to the estimated one.
Since we are interested in the current consumed by the design only, we first measure the current when the FPGA is programmed and the application is running, i.e., data are sent and received. The measured current is 170.96 mA on average. Then, we subtract the current measured when the FPGA is programmed, but without any data traffic, that becomes 165.36 mA. By subtracting this current, we eliminate the current consumed by other parts of the board as well as the FPGA static current. Consequently, the proposed design consumes 5.6 mA on average. When this current is multiplied by the 5 V input voltage, it results in 28 mW of approximated FPGA dynamic power.
The results are summarized in
Table 2. The obtained latency and throughput fits real-time requirements, and the power consumption is low.
6. Discussion
The hardware implementation of automatic ECG analysis systems is essential for ambulant monitorization of patients, and there are several examples in the literature for both ASIC [
23,
24] and FPGA [
25,
26] implementations. However, to the best of our knowledge, there are no hardware implementations of ECG signal processors that apply the Hermite fit for beat compression or classifications. For example, the work in [
26] describes the implementation of another technique called Empirical Mode Decomposition applied to ECG signals in a Spartan 3E FPGA but does not report power, performance and area metrics. As for the detection performance, the overall accuracy reported is
%, while with Hermite functions, it is possible to achieve
%. The work in [
25] is a HW/SW co-design where the QRS complex extraction is implemented in an FPGA and is based on geometrical properties of a two-dimensional phase-space portrait of the ECG signal, while the beat classification is performed by Open Source ECG analysis software. The data are read from and written to the on-board DDR memory, while the data proposed in this work are sent and received by UART, corresponding to a more realistic case, since it could be easily replaced by an ADC interface. Additionally, the pre-processing and pre-partition are performed on the software in [
25], so a fair comparison with this work would be difficult to achieve. The authors reported a premature ventricular detection of
%, while with Hermite functions, it is possible to reach
%.
Preliminary results of the proposed design were presented in [
17]. Only the Hermite fit process was tackled in our previous work, so the pre-processing chain was neglected. A peak power consumption of 3 W was reported in contrast with the averaged power of 28 mW achieved in the current design. This new version of the circuit can be used to feed a hardware block to perform data compression or classification in real-time with a low power consumption.
The reported performance metrics are promising. The latency is close to a second, which is suitable given that heart rates are commonly between 1 and 2 beats/s; thus, the results of the first beat characterization appear after 1 or 2 beats. The throughput is around 3 beats/s, which covers heart rates of 180 beats/min, which is an extreme situation for a person. Finally, the power consumption is around 30 mW, which is a low value for an FPGA.
Summarizing, the results yield that the system is capable of real-time and low-power processing.
7. Conclusions
In this paper, we presented the design of an FPGA-based system able to perform real-time ECG characterization through Hermite polynomials. The AHIR HLS tool was used to perform the development and testing. The system was successfully implemented on a low-cost board with a latency of less than 1 s, a throughput of 3 beats/s and a power consumption around 28 mW. Hence, we demonstrated that complex low power, real-time ECG analysis is possible through high-level synthesis.
The current design can be easily modified and extended due to the flexibility provided by the AHIR set of tools. On one hand, the number of polynomials used in the estimation (i.e.,
N) can be increased to improve the accuracy of the estimations. Moreover, a clustering block to help in the classification process can be added [
10]. In any case, it is clear that a bigger FPGA device is necessary. Additionally, the throughput can be increased to consider higher heart rates, which involves increasing parallelism and, therefore, increasing the resources demand. All of these new ideas can be easily designed and tested with the HLS approach provided by AHIR.


 ,
, 

