
Impact of Novel Image Preprocessing Techniques on Retinal Vessel Segmentation

 , ,
, ,  , , , , ,
  , and
, and 
Abstract
:1. Introduction
- The presence of the central light reflex of the vessel.
- Uneven background illumination.
- False vessels near the optic disc’s edge are often detected.
- Thin vessels with little contrast are seen.
- Bifurcations, crossing areas, and the fusion of closely parallel vessels.
- As shown in the Figure 2, the emergence of diseases such as microaneurysms (AD), cotton patches, light and dark lesions, and exudates.
- Implementation of new preprocessing steps. These preprocessing steps are the most used with post-processing methods and give improved performance.
- Contrast analysis for observations of small vessels leads to improved segmentation and helps diagnose the level of disease.
- The preprocessing steps have improved the performance of existing methods based on conventional techniques.
- Preprocessing methods may improve the learning processing of methods based on machine learning techniques.
2. Related Work
3. Material and Methods
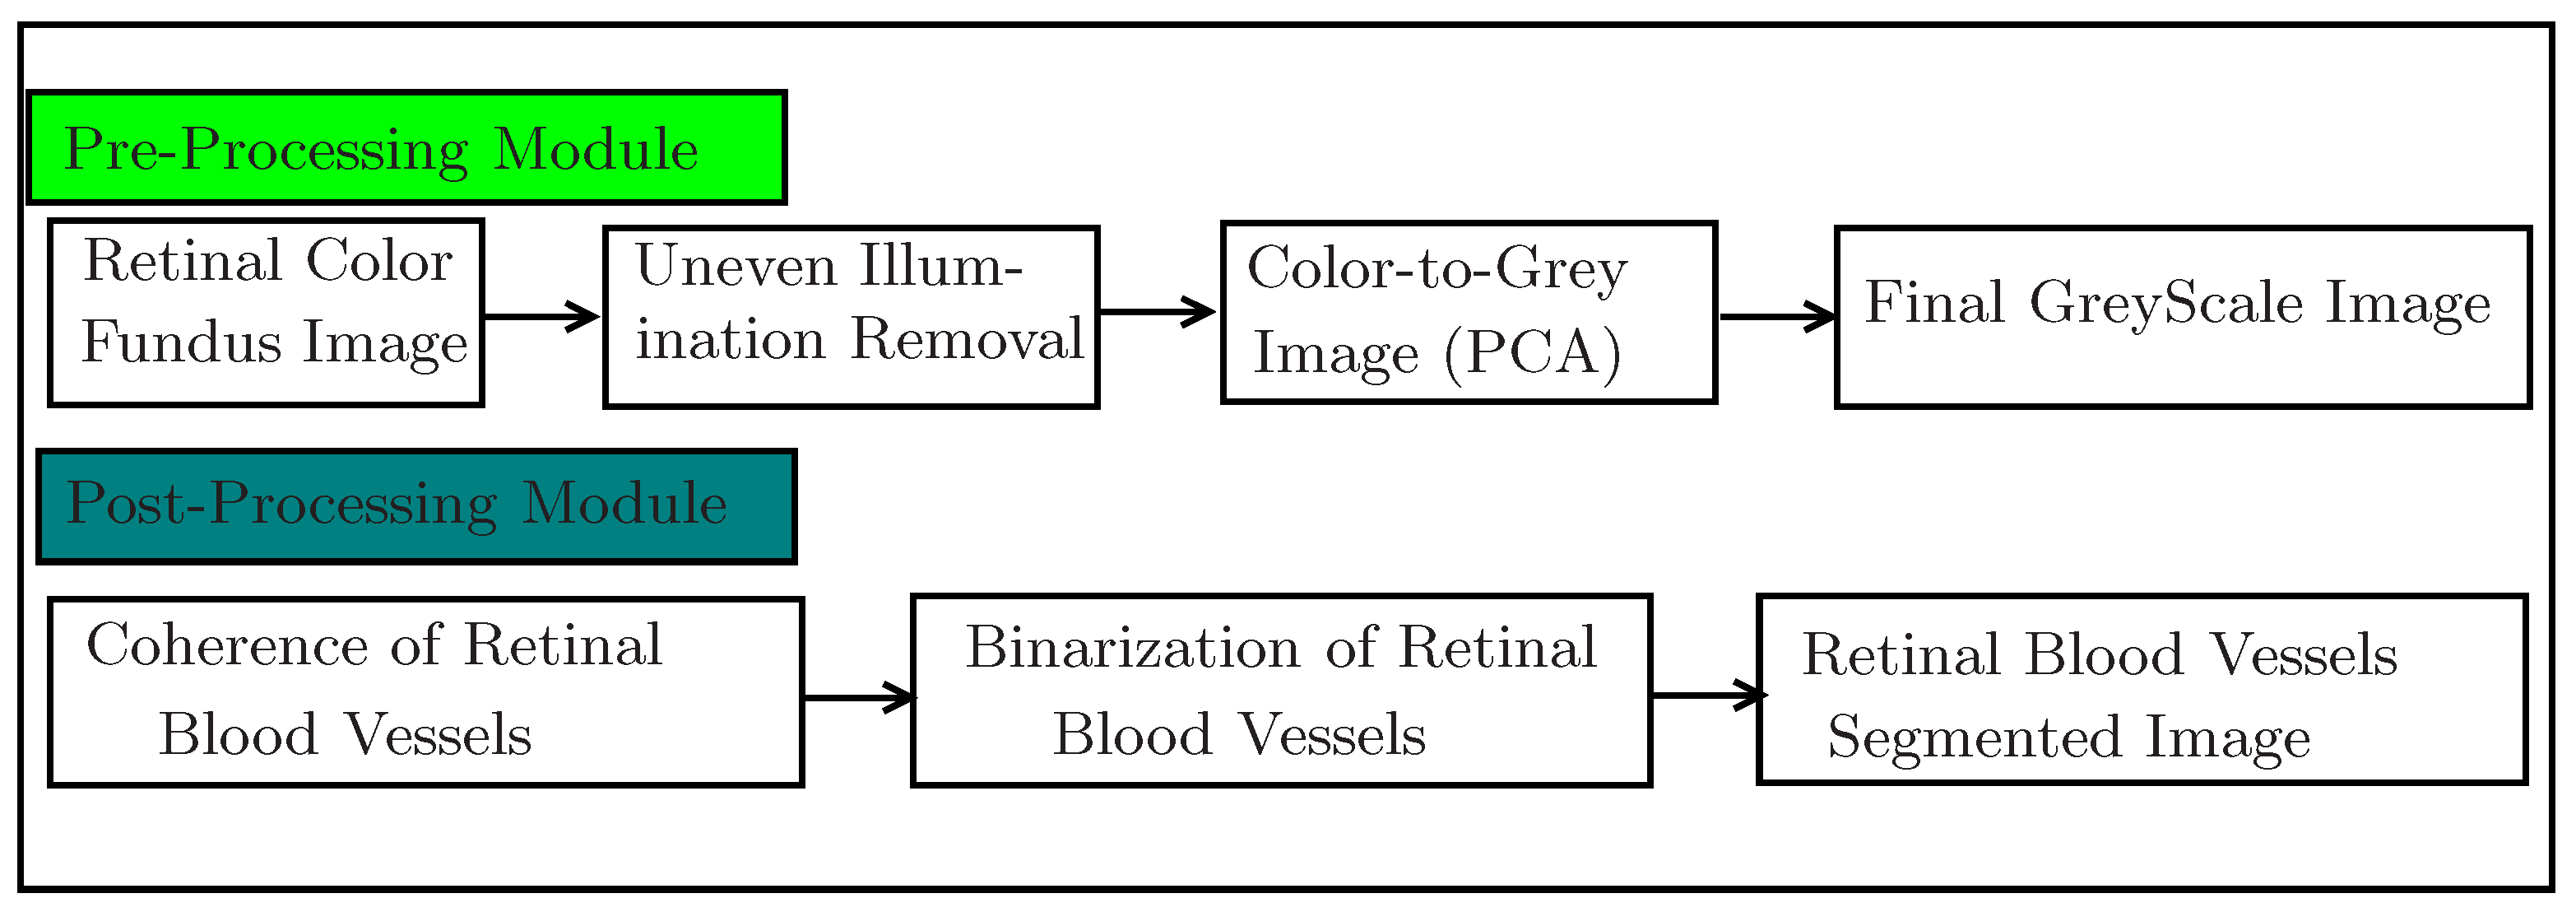
3.1. Pre-Processing Module
3.1.1. Processing Retinal Color Fundus Image
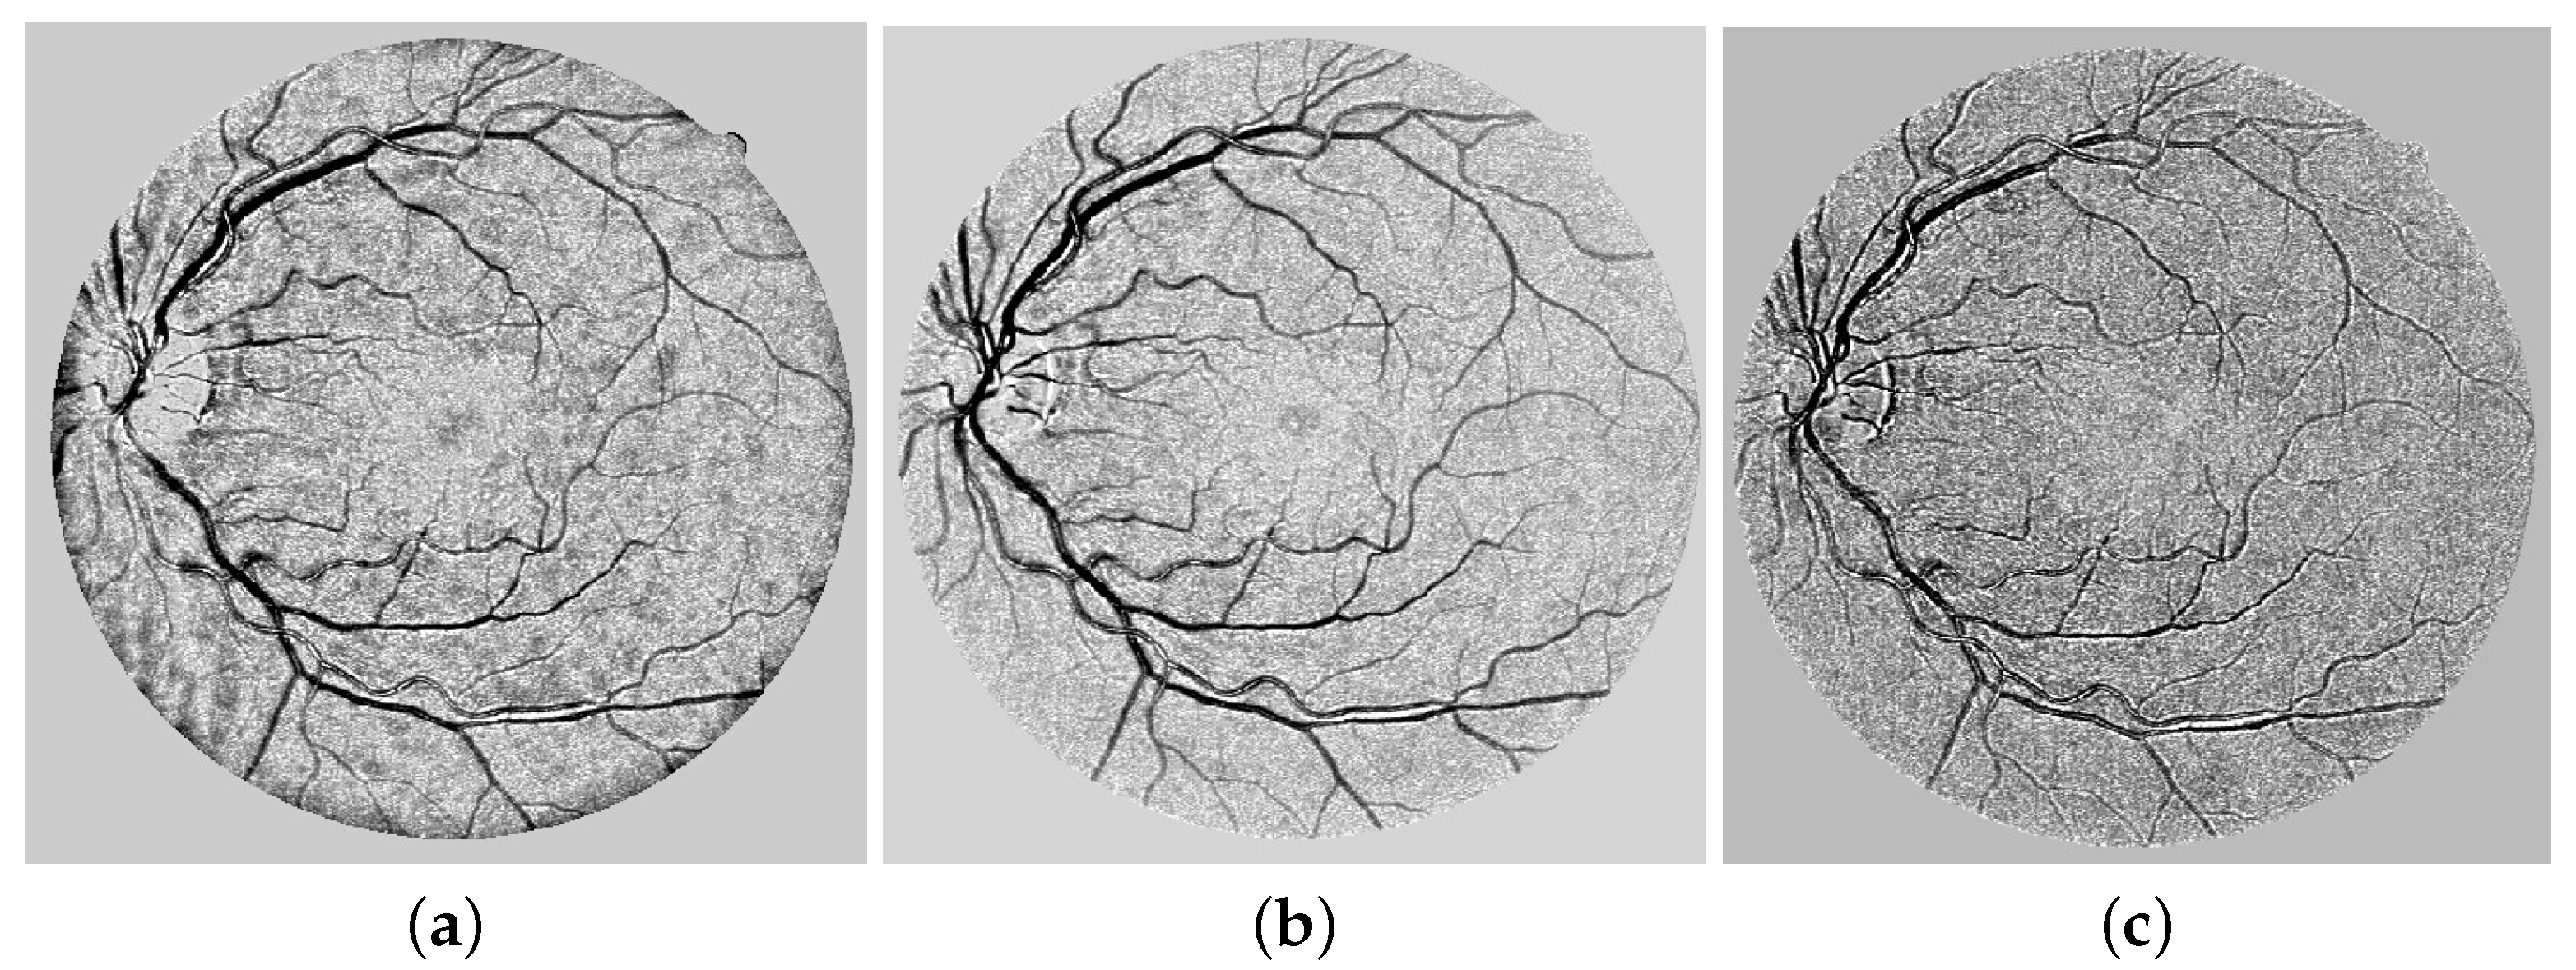
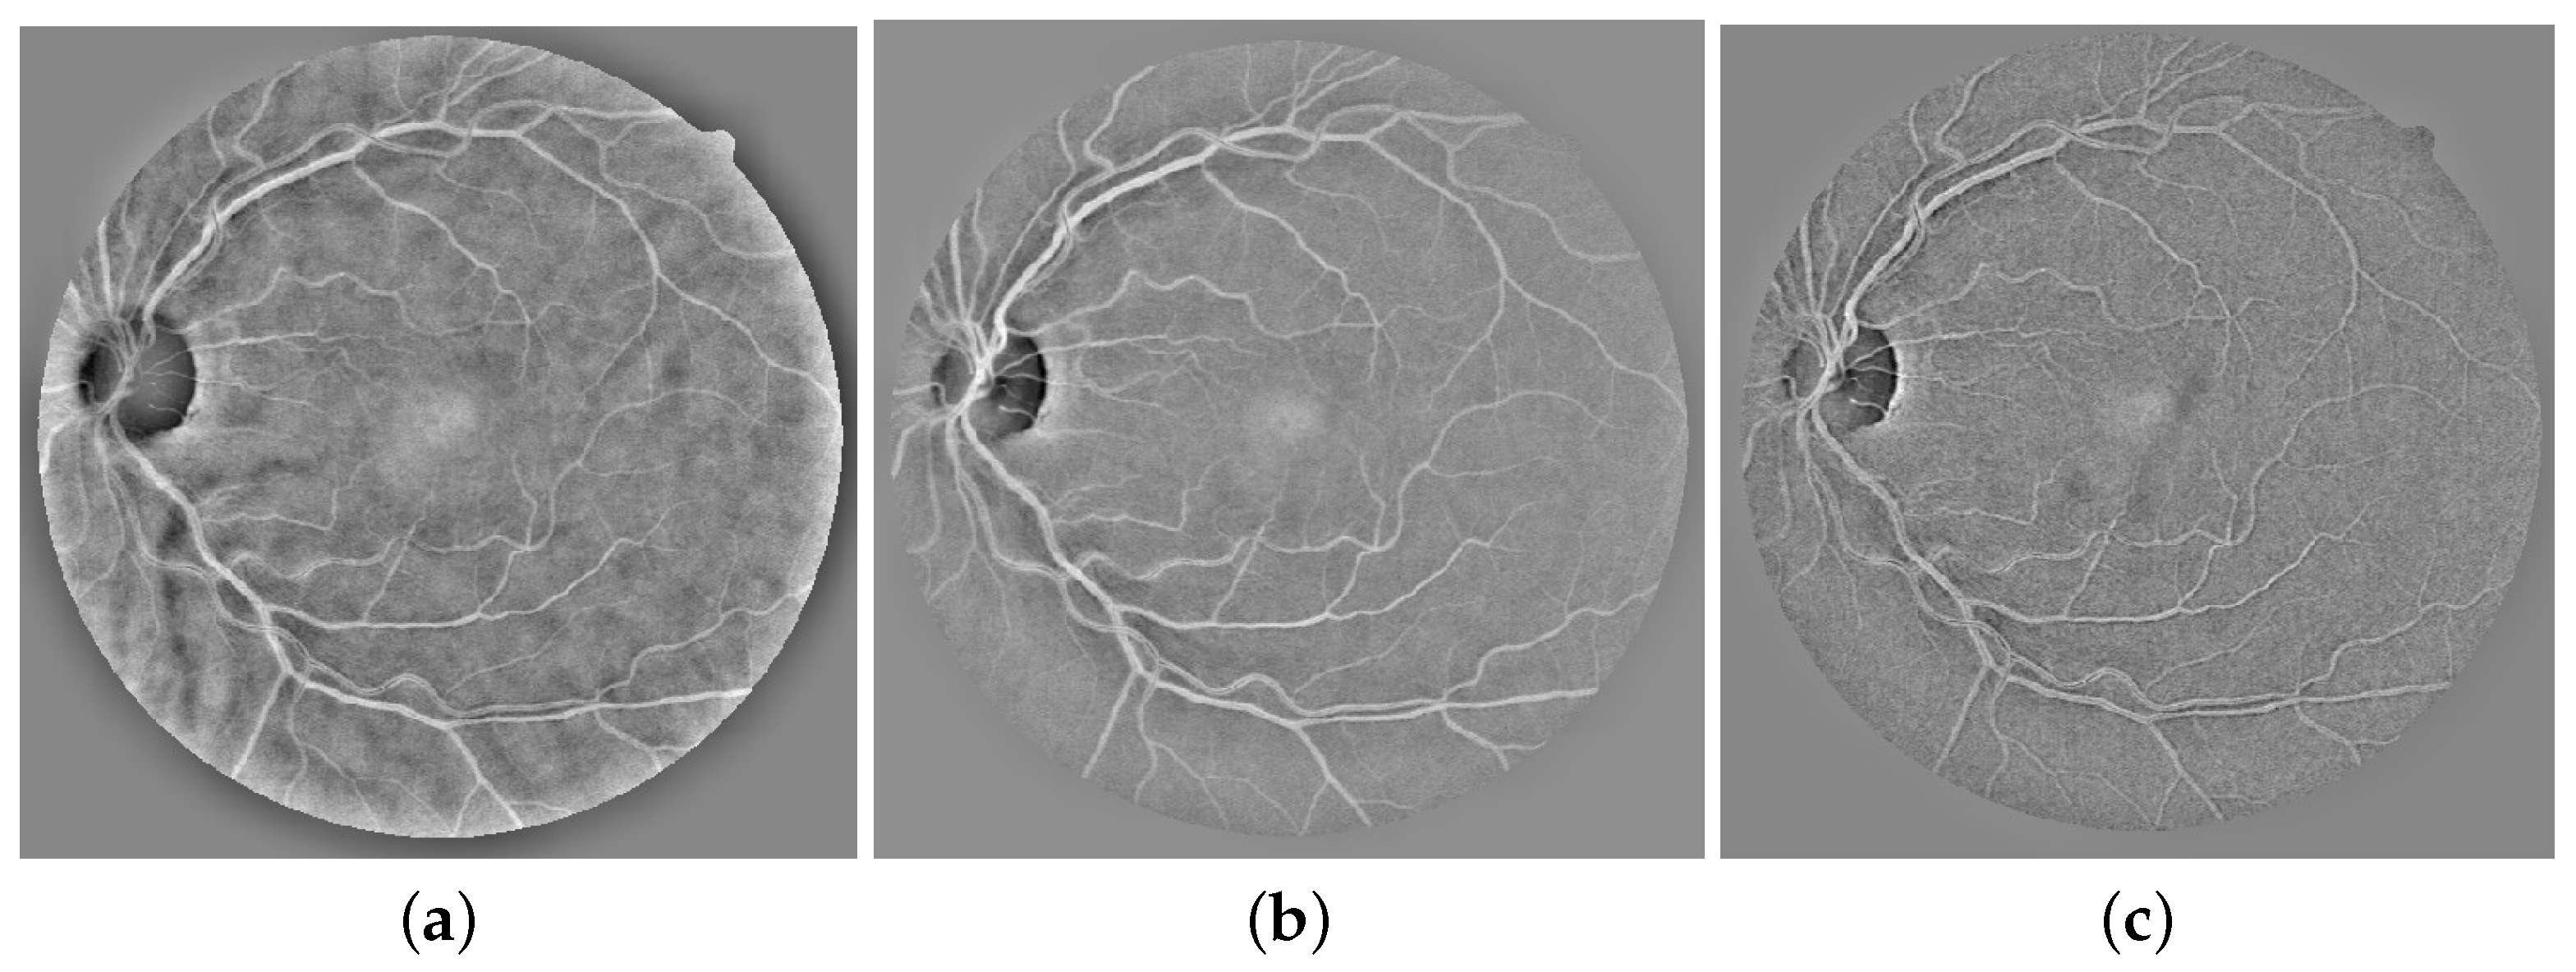
3.1.2. Uneven Illumination Removal or Background Homogenization
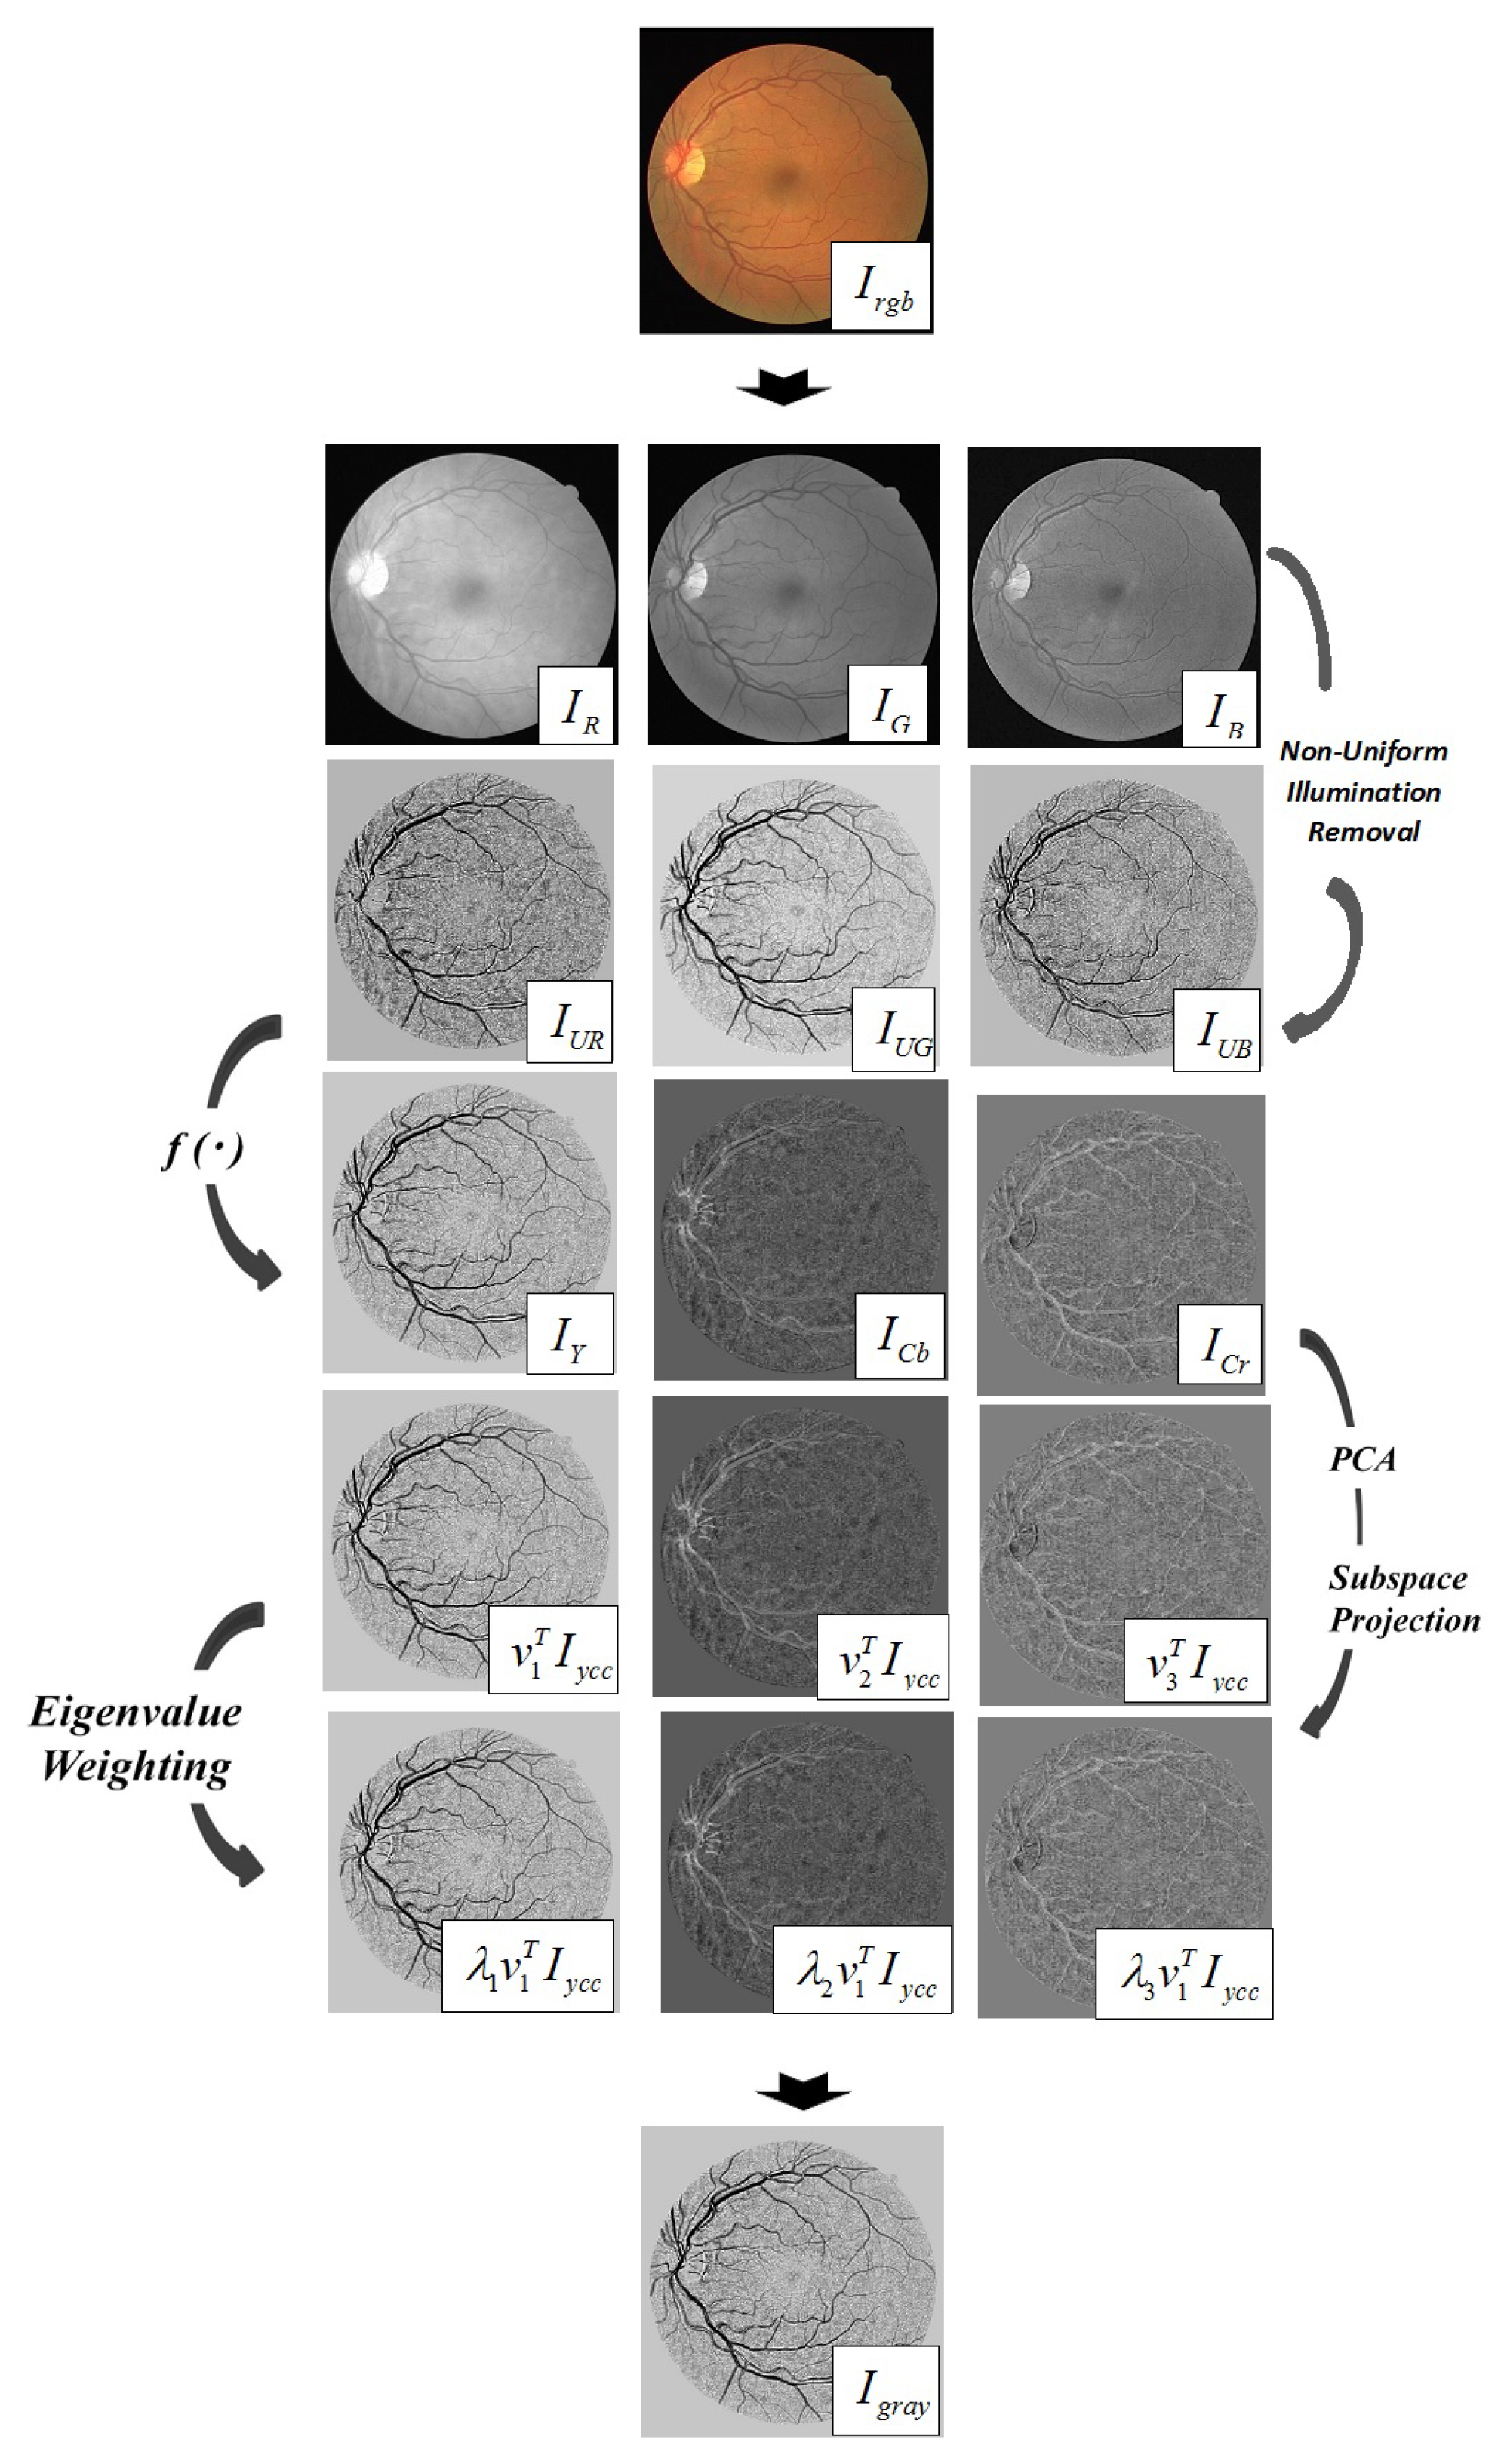
3.1.3. Converting a Colour (RGB) Image to a Single Greyscale Image
3.2. Post-Processing Model
3.2.1. Secnd-Order Gaussian Detector for Coherence of Vessels
3.2.2. Final Coherent Vessels: Anisotropic Oriented Diffusion Filter
- Calculate the second-moment matrix to every pixel in the vessel.
- Ensuring each Vessels pixel has its formation diffusion matrix.
- Calculate the intensity change for every vessel pixel as follows: .
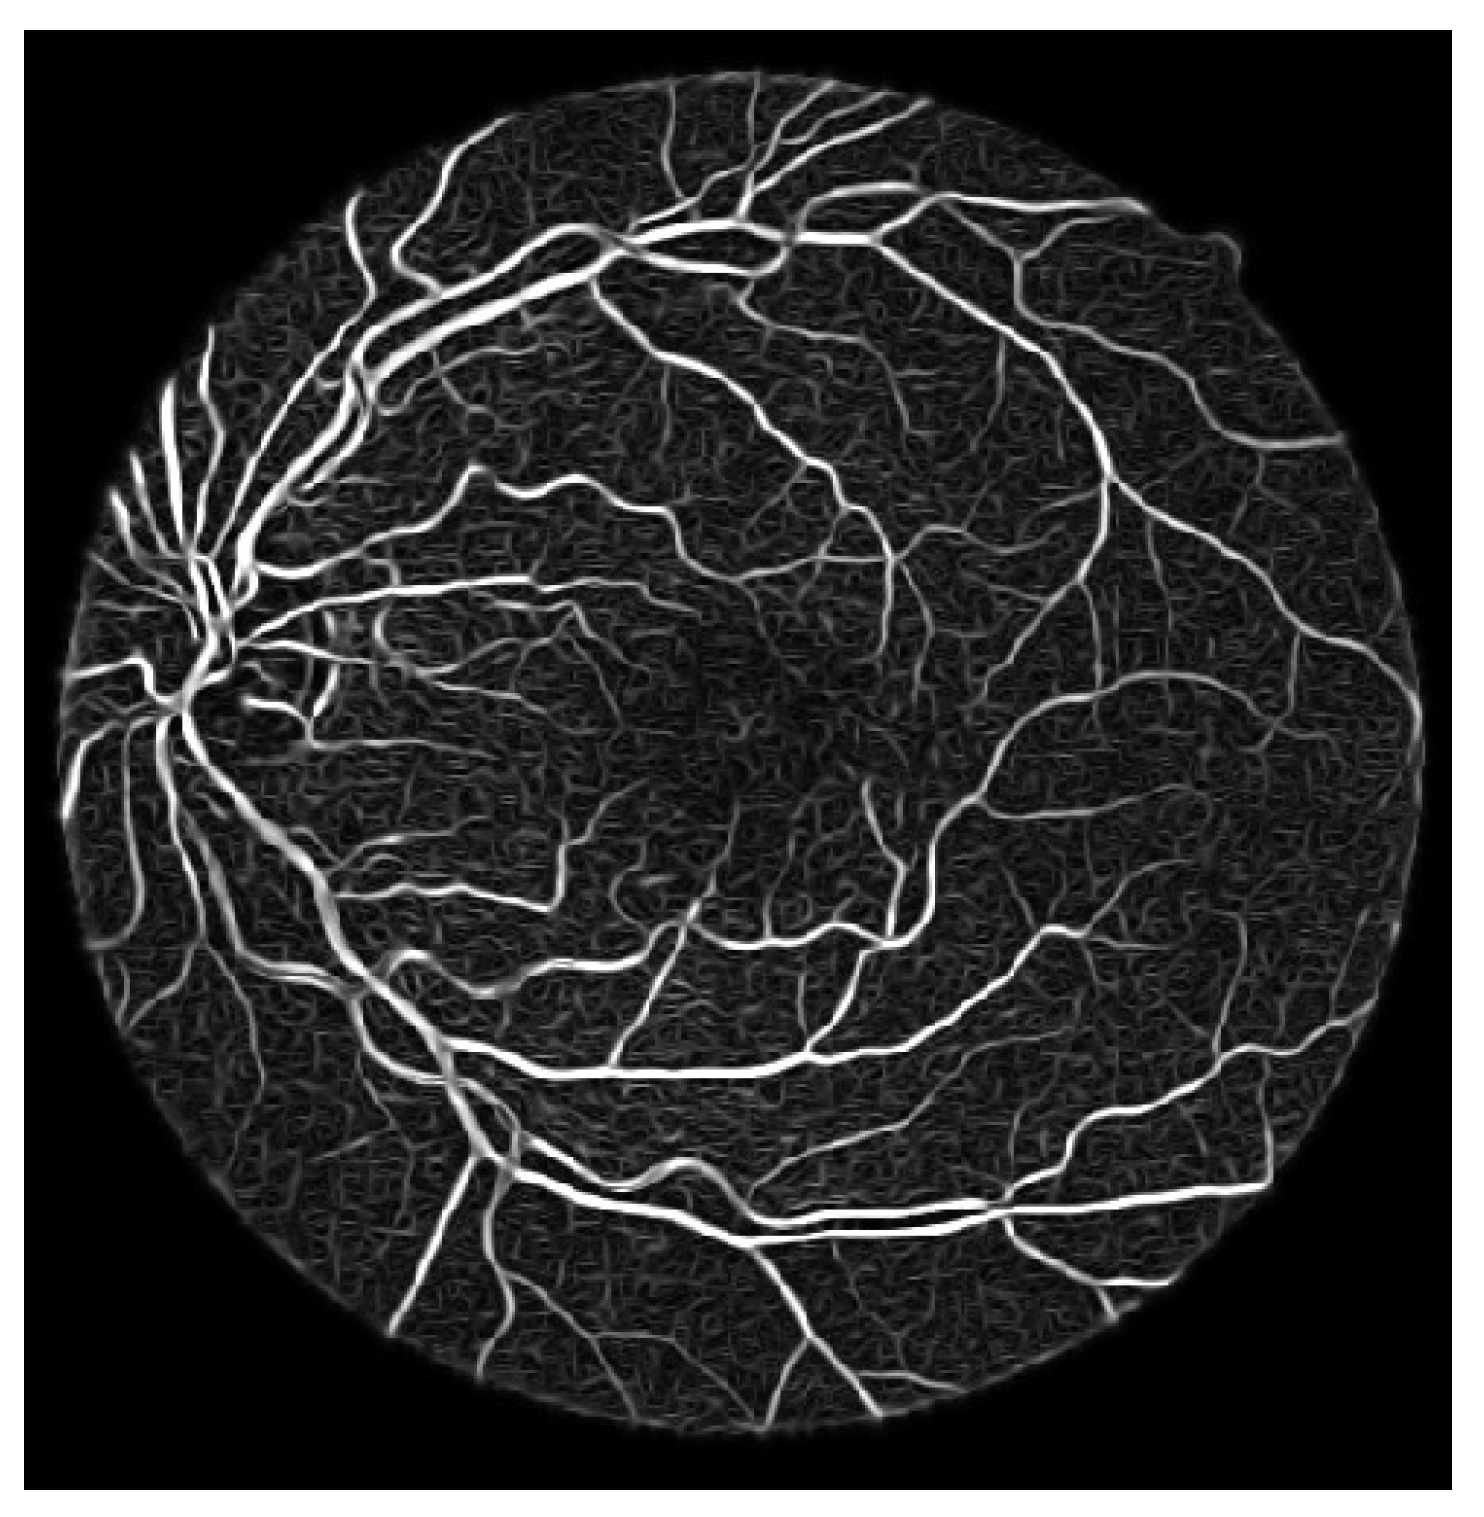
- Process the updated image based on the difference formula depicted equation below and achieved coherent vessels image as shown in Figure 11
3.2.3. Segmented Image
3.3. Overall Algorithm
- The first step manages the processing of the retinal color image and converts the retinal color images into three channels (RGB) and then converts each channel into greyscale images.
- The second step manages the removal of uneven illumination from each channel. Morphological operations and homomorphic filtering are tested to deal with irregular illuminations. Morphological operations gave better output images against homomorphic filtering.
- The third step is based on obtaining the image in greyscale. We used the PCA approach to convert the RGB retinal fundus images to a greyscale image.
- The fourth step is based on analyzing the normalization of vessels, especially tiny vessels, and it is an essential factor in increasing vessels’ sensitivity. The second-order detector is used to normalize the vessels, and there is still varying intensity of the vessels and broken ridges. This problem is addressed using anisotropic oriented diffusion filtering.
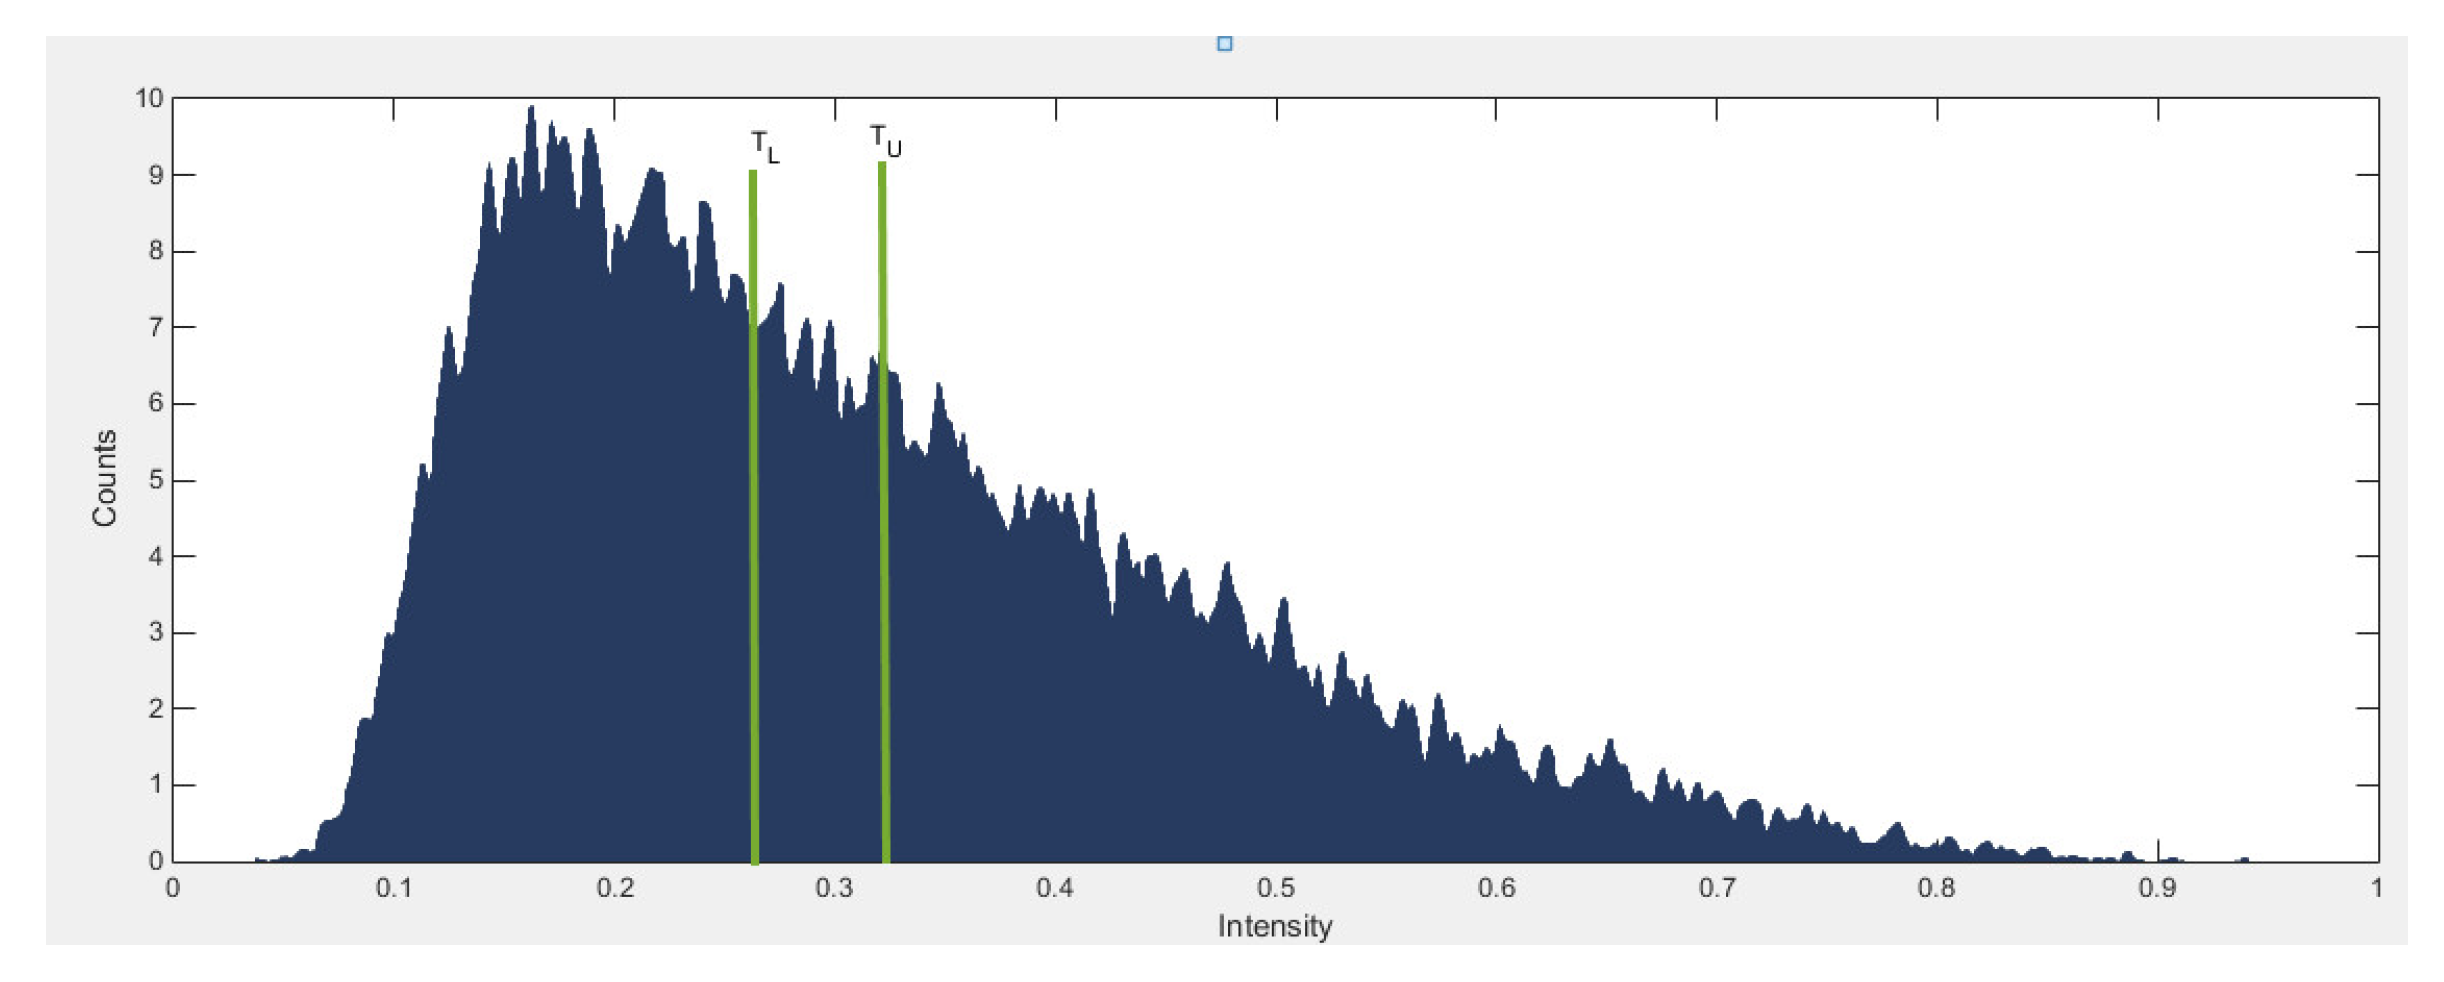
- A segmented image of the vasculature is achieved. The next step is to combine double thresholding with morphological image reconstruction methods.
3.4. Database and Measuring Parameters
4. Results and Discussion
4.1. Performance Analysis on Database: DRIVE and STARE Database
4.2. Impact of the Pre-Processing Module
4.3. Analysis on Challenging Images
4.4. Comparative Analysis
5. Conclusions
Author Contributions
Funding
Data Availability Statement
Acknowledgments
Conflicts of Interest
References
- Patton, N.; Aslam, T.; MacGillivray, T.; Patti, A.; Deary, I.J.; Dhillon, B. Retinal Vascular Image Analysis As A Potential Screening Tool For Cerebrovascular Disease: A: Rationale Based On Homology Between Cerebral And Retinal Microvasculatures. J. Anat. 2005, 206, 319–348. [Google Scholar] [CrossRef]
- Kanaide, H.; Ichiki, T.; Nishimura, J.; Hirano, K. Cellular Mechanism of Vasoconstriction Induced by Angiotensin II It Remains To Be Determined. Circ. Res. 2003, 1, 1089–1094. [Google Scholar]
- Grunkin, P.; Ersboll, M.; Madsen, B.; Larsen, K.; Christoffersen, M. Quantitative measurement of changes in retinal vessel diameter in ocular fundus images. Pattern Recogn. 2000, 21, 1215–1223. [Google Scholar]
- Heneghana, C.; Flynna, J.; O’Keefec, M.; Cahillc, M. Characterization of changes in blood vessel width and tortuosity in retinopathy of prematurity using image analysis. Med. Image Anal. 2002, 6, 407–429. [Google Scholar] [CrossRef]
- Fraza, M.; Remagninoa, P.; Hoppea, A.; Uyyanonvarab, B.; Rudnickac, A.; Owenc, C.; Barmana, S. Blood vessel segmentation methodologies in retinal images. A survey. Comput. Methods Programs Biomed. 2012, 108, 407–433. [Google Scholar] [CrossRef]
- Soomro, T.A.; Gao, J.; Khan, M.A.U.; Khan, T.M.; Paul, M. Role of Image Contrast Enhancement Technique for Ophthalmologist as Diagnostic Tool for Diabetic Retinopathy. In Proceedings of the International Conference on Digital Image Computing: Techniques and Applications (DICTA), Gold Coast, QLD, Australia, 30 November–2 December 2016; pp. 1–8. [Google Scholar] [CrossRef]
- Soomro, T.A.; Gao, J.; Khan, T.M.; Hani, A.F.M.; Khan, M.A.U.; Paul, M. Computerised Approaches for the Detection of Diabetic Retinopathy Using Retinal Fundus Images: A Survey. J. Pattern Anal. Appl. 2017, 20, 927–961. [Google Scholar] [CrossRef]
- Wang, J.J.; Liew, G.; Klein, R.; Rochtchina, E.; Knudtson, M.D.; Klein, B.E.; Wong, T.Y.; Burlutsky, G.; Mitchell, P. Retinal Vessel Diameter and Cardiovascular Mortality: Pooled Data Analysis From Two Older Populations. Eur. Heart J. 2007, 28, 1984–1992. [Google Scholar] [CrossRef] [PubMed]
- Hani, A.; Soomro, T.A. Non-invasive contrast enhancement for retinal fundus imaging. In Proceedings of the IEEE International Conference on Control System, Computing and Engineering (ICCSCE), Penang, Malaysia, 29 November–1 December 2013; Volume 1, pp. 197–202. [Google Scholar]
- Soomro, T.A.; Hani, A. Enhancement of colour fundus image and FFA image using RETICA. In Proceedings of the IEEE International Conference on Biomedical Engineering and Sciences (IECBES), Langkawi, Malaysia, 17–19 December 2012; Volume 1, pp. 831–836. [Google Scholar]
- Soomro, T.A. Non-Invasive Image Denoising and Contrast Enhancement Techniques for Retinal Fundus Images. Master’s Thesis, Electrical and Electronic Engineering Department, Universiti Teknologi Petronas (UTP), Seri Iskandar, Perak, 2014; pp. 1–175. [Google Scholar]
- Chaudhuri, S.; Chatterjee, S.; Katz, N.; Nelson, M.; Goldbaum, M. Detection of blood vessels in retinal images using two-dimensional matched filters. IEEE Trans. Med. Imaging 1989, 8, 263–269. [Google Scholar] [CrossRef] [Green Version]
- Hoover, A.; Kouznetsova, V.; Goldbaum, M. Locating blood vessels in retinal images by piecewise threshold probing of a matched filter response. IEEE Trans. Med. Imaging 2000, 19, 203–210. [Google Scholar] [CrossRef] [Green Version]
- Soomro, T.A.; Afifi, A.J.; Zheng, L.; Soomro, S.; Gao, J.; Hellwich, O.; Paul, M. Deep Learning Models for Retinal Blood Vessels Segmentation: A Review. IEEE Access 2019, 7, 71696–71717. [Google Scholar] [CrossRef]
- Pakter, H.M.; Ferlin, E.; Fuchs, S.C.; Maestri, M.K.; Moraes, R.S.; Nunes, G.; Moreira, L.B.; Gus, M.; Fuchs, F.D. Measuring Arteriolar-To-Venous Ratio in Retinal Photography of Patients with Hypertension: Development and Application of a New Semi-Automated Method. Am. J. Hypertens. 2005, 18, 417–421. [Google Scholar] [CrossRef] [PubMed] [Green Version]
- Wong, T.Y.; Knudtson, M.D.; Klein, R.; Klein, B.E.; Meuer, M.S.M.; Hubbard, L.D. Computer-assisted measurement of retinal vessel diameters in the Beaver Dam Eye Study: Methodology, correlation between eyes, and effect of refractive errors. J. Ophthalmol. 2004, 111, 1181–1190. [Google Scholar] [CrossRef] [PubMed]
- Soomro, T.A.; Afifi, A.J.; Gao, J.; Hellwich, O.; Zheng, L.; Paul, M. Strided fully convolutional neural network for boosting the sensitivity of retinal blood vessels segmentation. Expert Syst. Appl. 2019, 134, 36–52. [Google Scholar] [CrossRef]
- Kocevar, M.; Klampfer, S.; Chowdhury, A.; Kacic, Z. Low-Quality Fingerprint Image Enhancement on the Basis of Oriented Diffusion and Ridge Compensation. Elektron. Elektrotechnika 2014, 20, 49–54. [Google Scholar] [CrossRef]
- Soomro, T.A.; Gao, J.; Lihong, Z.; Afifi, A.J.; Soomro, S.; Paul, M. Retinal Blood Vessels Extraction of Challenging Images. In Data Mining. AusDM 2018. Communications in Computer and Information Science; Springer: Singapore, 2019; Volume 996. [Google Scholar]
- Soares, J.V.; Leandro, J.J.; Cesar, R.M.; Jelinek, H.F.; Cree, M.J. Retinal Vessel Segmentation Using the 2-D Gabor Wavelet and Supervised Classification. IEEE Trans. Med. Imaging 2006, 9, 1214–1222. [Google Scholar] [CrossRef] [Green Version]
- Soomro, T.A.; Afifi, A.J.; Ali Shah, A.; Soomro, S.; Baloch, G.A.; Zheng, L.; Yin, M.; Gao, J. Impact of Image Enhancement Technique on CNN Model for Retinal Blood Vessels Segmentation. IEEE Access 2019, 7, 158183–158197. [Google Scholar] [CrossRef]
- Lathen, G.; Jonasson, J.; Borga, M. Blood vessel segmentation using multi-scale quadrature filtering. Pattern Recognit. Lett. 2010, 31, 762–767. [Google Scholar] [CrossRef] [Green Version]
- Lesagea, D.; Angelini, E.D.; Bloch, I.; Funka-Leaa, G. A review of 3D Vessel Lumen Segmentation Techniques: Models, Features and Extraction Schemes. Med. Image Anal. 2009, 13, 819–845. [Google Scholar] [CrossRef]
- Sun, K.; Chen, Z.; Jiang, S. Local Morphology Fitting Active Contour for Automatic Vascular Segmentation. IEEE Trans. -Bio-Med Eng. 2012, 59, 464–473. [Google Scholar]
- Staal, J.; Abràmoff, M.D.; Niemeijer, M.; Viergever, M.A.; Van Ginneken, B. Ridge-based vessel segmentation in color images of the retina. IEEE Trans. Med. Imaging 2004, 23, 501–509. [Google Scholar] [CrossRef]
- Marin, D.; Aquino, A.; Gegundez-Arias, M.E.; Bravo, J.M. A New Supervised Method for Blood Vessel Segmentation in Retinal Images by Using Gray-Level and Moment Invariants-Based Features. IEEE Trans. Med. Imaging 2011, 30, 146–158. [Google Scholar] [CrossRef] [PubMed] [Green Version]
- Sinthanayothin, C.; Boyce, J.F.; Cook, H.L.; Williamson, T.H. Automated localisation of the optic disc, fovea, and retinal blood vessels from digital colour fundus images. Br. J. Ophthalmol. 1999, 83, 890–902. [Google Scholar] [CrossRef]
- Xinge, Y.; Qinmu, P.; Yuan, Y.; Yiu-ming, C.; Jiajia, L. Segmentation of Retinal Blood Vessels Using the Radial Projection and Semi-supervised Approach. Pattern Recognit. 2011, 44, 10–11. [Google Scholar]
- Ricci, E.; Perfetti, R. Retinal Blood Vessel Segmentation Using Line Operators and Support Vector Classification. IEEE Trans. Med. Imaging 2007, 26, 1357–1365. [Google Scholar] [CrossRef]
- Bankhead, P.; Scholfield, C.N.; McGeown, J.G.; Curtis, T.M. Fast retinal vessel detection and measurement using wavelets and edge location refinement. PLoS ONE 2012, 7, e32435. [Google Scholar] [CrossRef] [Green Version]
- Al-Diri, B.; Hunter, A.; Steel, D. An Active Contour Model for Segmenting and Measuring Retinal Vessels. IEEE Trans. Med. Imaging 2009, 28, 1488–1497. [Google Scholar] [CrossRef] [PubMed]
- Yin, X.; Ng, B.W.H.; He, J.; Zhang, Y.; Abbott, D. Accurate Image Analysis of the Retina Using Hessian Matrix and Binarisation of Thresholded Entropy with Application of Texture Mapping. PLoS ONE 2014, 9, e95943. [Google Scholar]
- Liskowski, P.; Krawiec, K. Segmenting Retinal Blood Vessels With Deep Neural Networks. IEEE Trans. Med. Imaging 2016, 35, 2369–2380. [Google Scholar] [CrossRef] [PubMed]
- Li, Q.; Feng, B.; Xie, L.; Liang, P.; Zhang, H.; Wang, T. A Cross-Modality Learning Approach for Vessel Segmentation in Retinal Images. IEEE Trans. Med. Imaging 2016, 35, 109–118. [Google Scholar] [CrossRef] [PubMed]
- Mendonca, A.; Campilho, A. Segmentation of retinal blood vessels by combining the detection of centerlines and morphological reconstruction. IEEE Trans. Med. Imaging 2006, 25, 1200–1213. [Google Scholar] [CrossRef]
- Martínez-Perez, M.E.; Hughes, A.D.; Stanton, A.V.; Thom, S.A.; Bharath, A.A.; Parker, K.H. Retinal blood vessel segmentation by means of scale-space analysis and region growing. In Medical Image Computing and Computer-Assisted Intervention; Springer: Berlin/Heidelberg, Germany, 1999. [Google Scholar]
- Martinez-Perez, M.E.; Hughes, A.D.; Thom, S.A.; Bharath, A.A. Segmentation of blood vessels from red-free and fluorescein retinal images. Med. Image Anal. 2007, 11, 47–61. [Google Scholar] [CrossRef] [PubMed]
- Azzopardia, G.; Strisciuglioa, N.; Ventob, M.; Petkova, N. Trainable COSFIRE filters for vessel delineation with application to retinal images. Med Image Anal. 2015, 19, 46–57. [Google Scholar] [CrossRef] [Green Version]
- Kanan, C.; Cottrell, G.W. Color-to-Grayscale: Does the Method Matter in Image Recognition? PLoS ONE 2012, 7, e29740. [Google Scholar]
- Fehrenbach, J.; Mirebeau, J.M. Sparse non-negative stencils for anisotropic diffusion. J. Math. Imag. Vis. 2014, 49, 123–147. [Google Scholar] [CrossRef] [Green Version]
- Hou, Y. Automatic Segmentation of Retinal Blood Vessels Based on Improved Multiscale Line Detection. J. Comput. Sci. Eng. 2014, 8, 119–128. [Google Scholar] [CrossRef] [Green Version]
- Nguyen, U.T.V.; Bhuiyan, A.; Park, L.A.F.; Ramamohanarao, K. An effective retinal blood vessel segmentation method using multi-scale line detection. Pattern Recognit. 2013, 46, 703–715. [Google Scholar] [CrossRef]
- Thangaraj, S.; Periyasamy, V.; Balaji, R. Retinal vessel segmentation using neural network. IET Image Process. 2018, 12, 669–678. [Google Scholar] [CrossRef]
- Lupas, C.A.; Tegolo, D.; Trucco, E. Retinal Vessel Segmentation Using AdaBoost. IEEE Trans. Inf. Technol. Biomed. 2010, 14, 1267–1274. [Google Scholar] [CrossRef]
- Palomera-Perez, M.A.; Martinez-Perez, M.E.; Benitez-Perez, H.; Ortega-Arjona, J.L. Parallel Multiscale Feature Extraction and Region Growing: Application in Retinal Blood Vessel Detection. IEEE Trans. Inf. Technol. Biomed. 2010, 14, 500–506. [Google Scholar] [CrossRef]
- Fraz, M.M.; Remagnino, P.; Hoppe, A.; Uyyanonvara, B.; Rudnicka, A.R.; Owen, C.G.; Barman, S.A. An ensemble classification-based approach applied to retinal blood vessel segmentation. IEEE Trans. Biomed. Eng. 2012, 59, 2538–2548. [Google Scholar] [CrossRef] [PubMed]
- Orlando, J.I.; Blaschko, M. Learning fully-connected CRFs for blood vessel segmentation in retinal images. In Medical Image Computing and Computer-Assisted Intervention; Springer: Cham, Switzerland, 2014; Volume 17, pp. 634–641. [Google Scholar]
- Roychowdhury, S.; Koozekanani, D.D.; Parhi, K.K. Blood Vessel Segmentation of Fundus Images by Major Vessel Extraction and Subimage Classification. IEEE J. Biomed. Health Inform. 2015, 19, 1118–1128. [Google Scholar] [PubMed]
- Melinscak, M.; Prentasic, P.; Loncaric, S. Retinal Vessel Segmentation Using Deep Neural Networks. In Proceedings of the 10th International Conference on Computer Vision Theory and Applications (VISAPP-2015), Berlin, Germany, 11–14 March 2015; pp. 577–582. [Google Scholar]
- Annunziata, R.; Garzelli, A.; Ballerini, L.; Mecocci, A.; Trucco, E. Leveraging Multiscale Hessian-Based Enhancement With a Novel Exudate Inpainting Technique for Retinal Vessel Segmentation. IEEE J. Biomed. Health Inform. 2016, 20, 1129–1138. [Google Scholar] [CrossRef] [PubMed]
- Zhao, Y.; Rada, L.; Chen, K.; Harding, S.P.; Zheng, Y. Automated Vessel Segmentation Using Infinite Perimeter Active Contour Model with Hybrid Region Information with Application to Retinal Images. IEEE Trans. Med. Imaging 2015, 34, 1797–1807. [Google Scholar] [CrossRef] [PubMed] [Green Version]
- Soomro, T.A.; Khan, M.A.U.; Gao, J.; Khan, T.M.; Paul, M.; Mir, N. Automatic Retinal Vessel Extraction Algorithm. In Proceedings of the International Conference on Digital Image Computing: Techniques and Applications (DICTA), Gold Coast, QLD, Australia, 30 November–2 December 2016; pp. 1–8. [Google Scholar] [CrossRef]
- Khan, T.M.; Khan, M.A.; Kong, Y.; Kittaneh, O. Stopping criterion for linear anisotropic image diffusion: A fingerprint image enhancement case. Eurasip J. Image Video Process. 2016, 2016, 1–20. [Google Scholar] [CrossRef] [Green Version]
- Zhang, J.; Dashtbozorg, B.; Bekkers, E.; Pluim, J.P.W.; Duits, R.; ter Haar Romeny, B.M. Robust Retinal Vessel Segmentation via Locally Adaptive Derivative Frames in Orientation Scores. IEEE Trans. Med. Imaging 2016, 35, 2631–2642. [Google Scholar] [CrossRef] [Green Version]
- Orlando, J.I.; Prokofyeva, E.; Blaschko, M.B. A Discriminatively Trained Fully Connected Conditional Random Field Model for Blood Vessel Segmentation in Fundus Images. IEEE Trans. Biomed. Eng. 2017, 64, 16–27. [Google Scholar] [CrossRef] [Green Version]
- Ngo, L.; Han, J. Multi-level deep neural network for efficient segmentation of blood vessels in fundus images. Electron. Lett. 2017, 53, 1096–1098. [Google Scholar] [CrossRef]
- Guo, Y.; Budak, U.; Sengur, A.; Smarandache, F. A Retinal Vessel Detection Approach Based on Shearlet Transform and Indeterminacy Filtering on Fundus Images. Symmetry 2017, 9, 10. [Google Scholar] [CrossRef] [Green Version]
- Biswal, B.; Pooja, T.; Subrahmanyam, N.B. Robust retinal blood vessel segmentation using line detectors with multiple masks. IET Image Process. 2018, 12, 389–399. [Google Scholar] [CrossRef]
- Soomro, T.A.; Khan, T.M.; Khan, M.A.; Gao, J.; Paul, M.; Zheng, L. Impact of ICA-Based Image Enhancement Technique on Retinal Blood Vessels Segmentation. IEEE Access 2018, 6, 3524–3538. [Google Scholar] [CrossRef]


| Database | Se | Sp | AC | AUC |
|---|---|---|---|---|
| DRIVE | 0.812 | 0.971 | 0.963 | 0.951 |
| STARE | 0.809 | 0.969 | 0.958 | 0.949 |
| Method | Without Pre-Processing | With Pre-Processing | ||||
|---|---|---|---|---|---|---|
| Database | Se | Sp | AC | Se | Sp | AC |
| DRIVE | 0.491 | 0.502 | 0.421 | 0.812 | 0.971 | 0.963 |
| STARE | 0.487 | 0.498 | 0.437 | 0.809 | 0.969 | 0.958 |
| Method | Performance of Method | With Pre-Processing | ||||||
|---|---|---|---|---|---|---|---|---|
| Database | Se | Sp | AC | AUC | Se | Sp | AC | AUC |
| Nguyen et al. [42] | - | - | 0.940 | - | 0.732 | 0.952 | 0.948 | 0.951 |
| Hou et al. [41] | 0.735 | 0.969 | 0.941 | - | 0.782 | 0.969 | 0.949 | 0.953 |
| Method | Performance of Method | With Pre-Processing | ||||||
|---|---|---|---|---|---|---|---|---|
| Database | Se | Sp | AC | AUC | Se | Sp | AC | AUC |
| Nguyen et al. [42] | - | - | 0.932 | - | 0.701 | 0.949 | 0.944 | 0.942 |
| Hou et al. [41] | 0.734 | 0.965 | 0.933 | - | 0.779 | 0.968 | 0.949 | 0.953 |
| Database | Se | Sp | AC | AUC |
|---|---|---|---|---|
| DRIVE | 0.812 | 0.959 | 0.962 | 0.945 |
| STARE | 0.809 | 0.962 | 0.968 | 0.952 |
| Database | DRIVE | STARE | ||||||
|---|---|---|---|---|---|---|---|---|
| Methods | Se | Sp | AC | AUC | Se | Sp | AC | AUC |
| Staal et al. [25] | - | - | 0.946 | - | - | - | 0.951 | - |
| Soares et al. [20] | - | - | 0.946 | - | - | - | 0.948 | - |
| Mendonca et al. [35] | 0.734 | 0.976 | 0.945 | 0.855 | 0.699 | 0.973 | 0.944 | 0.836 |
| Martinez-Perez et al. [37] | 0.724 | 0.965 | 0.934 | 0.845 | 0.750 | 0.956 | 0.941 | 0.853 |
| Al-Diri et al. [31] | 0.728 | 0.955 | - | 0.842 | 0.752 | 0.968 | - | 0.860 |
| Lupas et al. [44] | 0.720 | - | 0.959 | - | - | - | - | - |
| Palomera-Perez et al. [45] | 0.66 | 0.961 | 0.922 | 0.811 | 0.779 | 0.940 | 0.924 | 0.860 |
| Xinge et al. [28] | 0.741 | 0.975 | 0.943 | 0.858 | 0.726 | 0.975 | 0.949 | 0.851 |
| Marin et al. [26] | 0.706 | 0.980 | 0.945 | 0.843 | 0.694 | 0.981 | 0.952 | 0.838 |
| Fraz et al. [46] | 0.741 | 0.981 | 0.948 | 0.974 | 0.754 | 0.973 | 0.953 | 0.977 |
| Nguyen et al. [42] | - | - | 0.940 | - | - | - | 0.932 | - |
| Hou et al. [41] | 0.735 | 0.969 | 0.941 | 0.961 | 0.734 | 0.965 | 0.933 | 0.957 |
| Orlando et al. [47] | 0.785 | 0.967 | - | - | - | - | 0.951 | - |
| Yin et al. [32] | - | - | 0.947 | - | - | - | - | - |
| Roychowdhury et al. [48] | 0.725 | 0.983 | 0.952 | 0.962 | 0.772 | 0.973 | 0.951 | 0.969 |
| Melinscak et al. [49] | - | - | 0.946 | 0.974 | - | - | - | - |
| Annunziata et al. [50] | - | - | - | - | 0.713 | 0.984 | 0.956 | 0.965 |
| Li et al. [34] | 0.756 | 0.981 | 0.952 | 0.974 | 0.773 | 0.984 | 0.962 | 0.987 |
| Zhao et al. [51] | 0.716 | 0.978 | 0.944 | 0.848 | 0.776 | 0.954 | 0.943 | 0.865 |
| Soomro et al. [52] | 0.713 | 0.968 | 0.941 | 0.841 | 0.711 | 0.965 | 0.942 | 0.838 |
| Khan et al. [53] | 0.734 | 0.967 | 0.951 | 0.850 | 0.736 | 0.971 | 0.95 | 0.853 |
| Zhang et al. [54] | 0.743 | 0.976 | 0.947 | 0.952 | 0.767 | 0.976 | 0.954 | 0.961 |
| Orlando et al. [55] | 0.789 | 0.968 | - | - | 0.768 | 0.973 | - | - |
| Ngo et al. [56] | 0.746 | 0.984 | 0.953 | 0.975 | - | - | - | - |
| Guo et al [57] | - | - | - | 0.947 | - | - | - | 0.946 |
| Thangaraj et al [43] | 0.801 | 0.975 | 0.961 | 0.888 | 0.834 | 0.953 | 0.944 | 0.894 |
| Biswal et al. [58] | 0.71 | 0.97 | 0.95 | - | 0.70 | 0.97 | 0.95 | - |
| Soomro et al. [59] | 0.752 | 0.976 | 0.953 | - | 0.786 | 0.982 | 0.967 | - |
| Soomro et al. [19] | 0.745 | 0.962 | 0.948 | - | 0.784 | 0.976 | 0.951 | - |
| Proposed Method | 0.812 | 0.971 | 0.963 | 0.951 | 0.809 | 0.969 | 0.958 | 0.949 |
Publisher’s Note: MDPI stays neutral with regard to jurisdictional claims in published maps and institutional affiliations. |
© 2021 by the authors. Licensee MDPI, Basel, Switzerland. This article is an open access article distributed under the terms and conditions of the Creative Commons Attribution (CC BY) license (https://creativecommons.org/licenses/by/4.0/).
Share and Cite
Soomro, T.A.; Ali, A.; Jandan, N.A.; Afifi, A.J.; Irfan, M.; Alqhtani, S.; Glowacz, A.; Alqahtani, A.; Tadeusiewicz, R.; Kantoch, E.; et al. Impact of Novel Image Preprocessing Techniques on Retinal Vessel Segmentation. Electronics 2021, 10, 2297. https://doi.org/10.3390/electronics10182297
Soomro TA, Ali A, Jandan NA, Afifi AJ, Irfan M, Alqhtani S, Glowacz A, Alqahtani A, Tadeusiewicz R, Kantoch E, et al. Impact of Novel Image Preprocessing Techniques on Retinal Vessel Segmentation. Electronics. 2021; 10(18):2297. https://doi.org/10.3390/electronics10182297
Chicago/Turabian StyleSoomro, Toufique A., Ahmed Ali, Nisar Ahmed Jandan, Ahmed J. Afifi, Muhammad Irfan, Samar Alqhtani, Adam Glowacz, Ali Alqahtani, Ryszard Tadeusiewicz, Eliasz Kantoch, and et al. 2021. "Impact of Novel Image Preprocessing Techniques on Retinal Vessel Segmentation" Electronics 10, no. 18: 2297. https://doi.org/10.3390/electronics10182297
APA StyleSoomro, T. A., Ali, A., Jandan, N. A., Afifi, A. J., Irfan, M., Alqhtani, S., Glowacz, A., Alqahtani, A., Tadeusiewicz, R., Kantoch, E., & Zheng, L. (2021). Impact of Novel Image Preprocessing Techniques on Retinal Vessel Segmentation. Electronics, 10(18), 2297. https://doi.org/10.3390/electronics10182297