1. Introduction
Water quality directly affects the growth, development, reproduction, and survival of fish [
1]. Therefore, its monitoring is essential in aquaculture production facilities. The water quality assessment at most fish farm facilities is traditionally performed manually [
2], by the periodical manual collection of water samples which afterwards are analyzed in the lab or by in situ measurements with portable multiparameter probes [
3]. However, due to the usual long periodicity between measurements by both methods (e.g., less than once a day), they fail in one of their principal objectives, the fast detection of anomalous conditions that could compromise the growth, health, or even survival of fish. Moreover, monitoring water quality data more frequently and its analysis together with fish biomass and behavior could open new frontiers in fish growth and feed modelling.
Good water quality is essential to maintain a viable aquaculture production [
4]. Inadequate values of physiochemical parameters such as pH, temperature, dissolved oxygen (DO), and conductivity (CD), will directly affect fish health and growth [
3], and in the worst-case scenario will trigger mortality. For instance, a recent review analyzing key risk factors associated with tilapia mortality [
5] concluded that water physical parameters were one of the most prominent contribution factors of unusual mortalities. Moreover, any significant fast change in water physicochemical parameters will suppose stress for fish [
6]. Maintaining good and stable water quality in aquaculture facilities is essential to maximize production and to avoid fish losses [
6]. However, fast changes are relatively common [
7] and they can be sudden or outside the office hours of workers (such as a storm, rain after a fire upstream, blackwater events, fast cyanobacteria bloom, urban runoff or an upstream dam water release). Thus, the autonomous and continuous monitoring (sampling rate should be higher than total water change cycle in the facility) of water quality seems the first measure to increase the production and health of fish in these facilities.
Recently, with the advance of technology and the worldwide establishment of the Internet of Things (IoT), multiple solutions for real-time monitoring of water quality have arisen. It is possible to find, on the one hand, high-cost robust commercial solutions usually directed to industrial applications and, on the other hand, low-cost solutions based on open technology [
2,
4,
8,
9], that usually lack adaptability or robustness for real-world applications, failing to go beyond prototype phase [
10].
In general, freshwater aquaculture is a lagging area of IoT technology compared to other areas such as agriculture or coastal aquaculture [
2]. This seems a result of two main reasons: their lower contribution to the economy [
11], which diminishes the interest of technology companies, and their remote location, near clean freshwater sources.
The adoption of IoT technology in remote or rural areas has been slower than in those areas with a large population (
www.thingful.net, accessed on 20 July 2021). However, due to the inherent benefits of IoT in agro-industrial and environmental fields [
10], multiple initiatives are arising that aim to speed up its adoption. This is the case of
Smart Comunidad Rural Digital (
www.smartcrd.eu, accessed on 20 July 2021), an European Interreg project directed by the General Directorate of Telecommunications and Digital Transformation of the
Junta de Castilla y León (Spain), intending to implement IoT solutions in remote rural areas as well as in environmental fields. While generally high-cost close solutions lack interest in more isolated areas, this opens the door to advance in low-cost and open technological solutions.
The present research work is framed within the SmartCRD project and follows the aim of developing a robust, low-cost, modular, and market-ready multiparametric water quality probe based on open technology, together with the network required for the real-time monitoring and management of the water quality in a fish conservation aquaculture facility (installation date: 20 April 2021). The designed sensors, network, and management platform have been created considering the new trends and advances in IoT [
12], as well as, considering the open challenges on IoT in agricultural and environmental fields [
10]. Therefore, we believe that this work not only contributes to the development of an outdoors water quality monitoring sensor network, but also defines a robust solution that can be applied in multiple domains, making low-cost open sensorization more accessible to real-world applications.
Trends and Open Challenges
Water quality measurements are important in multiple domains: aquaculture, industrial applications, domestic water supply, irrigation, pollution, or environmental monitoring. Thus, there are multiple research works in the area of sensors and sensor network development for such purpose [
2,
4,
9,
13,
14,
15].
Table 1 summarizes recent examples of sensor networks developed for water quality measurements and their principal characteristics. In general, there is a lack of standardization among the proposed solutions. That is to say, they usually comprise specific solutions that are difficult to scale or apply to other domains, as well as, with a lack of robustness to be applied in real-world applications [
10], that is to say, they consist of lab prototypes that require more development to integrate them in a permanent installation. A solution to achieve a higher standardization and a greater degree of reusability and customization is the use of the most widely extended open and modular hardware (e.g., Raspberry Pi, Arduino, etc.) and programming languages (e.g., C, Python, PHP, Java, etc.), selecting those with higher intercompatibility. This allows achieving a module-oriented build, ensuring that the used components, scripts, and software will persist in time, can work with existing infrastructure, and will evolve, and thus, guaranteeing that our builds will naturally update reducing the future costs. Moreover, the all–in-one nature of open technology will systematically facilitate the customization, that is to say, the adaptation of the system and the addition of new components without the need of developing new solutions from scratch [
16]. Nonetheless, to achieve certified standards on an affordable price range, the sensing layer (i.e., module responsible for translating a change in the environment into a chemical or physical parameter) will still need to depend on the close-market-ready technology as certification is a costly process, but necessary to ensure that the measured parameters are the correct ones (the suite of pre-calibrated digital and certified sensors is immense and in most cases with an affordable price) and that a standard is followed. In the same way, to ensure robustness for field deployments, IoT solutions must be able to handle the expected climate variability [
10], by testing those conditions or using commercially available certified enclosures.
A recent review on smart fish farming solutions [
12] revealed that 96% of reviewed works used close commercial sensors. This corroborates that there is a gap that needs to be filled with regard to open and highly customizable solutions. Moreover, within the open solutions listed in the review (4% of the works), Arduino, ESP boards, and Raspberry Pi were the most mentioned platforms. Some of those platforms have already been for decades in the market and have been widely used in education, by hobbyists, in science, and even in the industry [
16,
17], which has produced an exponential growth on openly available resources [
16]. However, despite the clear potential of open technology to develop monitoring applications, there is still a perception barrier (that links open to worse) which usually limits the use of this technology. Moreover, those interested in adopting such solutions lack basic awareness of the application potential [
16].
Thus considering the above, and to showcase the potential of open solutions in IoT for environmental monitoring in real-world applications, in the following sections we present the detailed description of the
MS Quality (MS stands for
Modular Sensing,
www.gea-ecohidraulica.org/GEA_en/sensors.php, accessed on 20 July 2021), a field-ready IoT solution for water quality measurement and monitoring based in open technology and designed considering specific listed challenges and trends. Likewise,
MS Quality and the developed network performance are analyzed considering the collected data so far and, in the same way, the things learned during the performance of this work are examined and discussed (from designing to first real data management).
2. Materials and Methods
2.1. Study Site
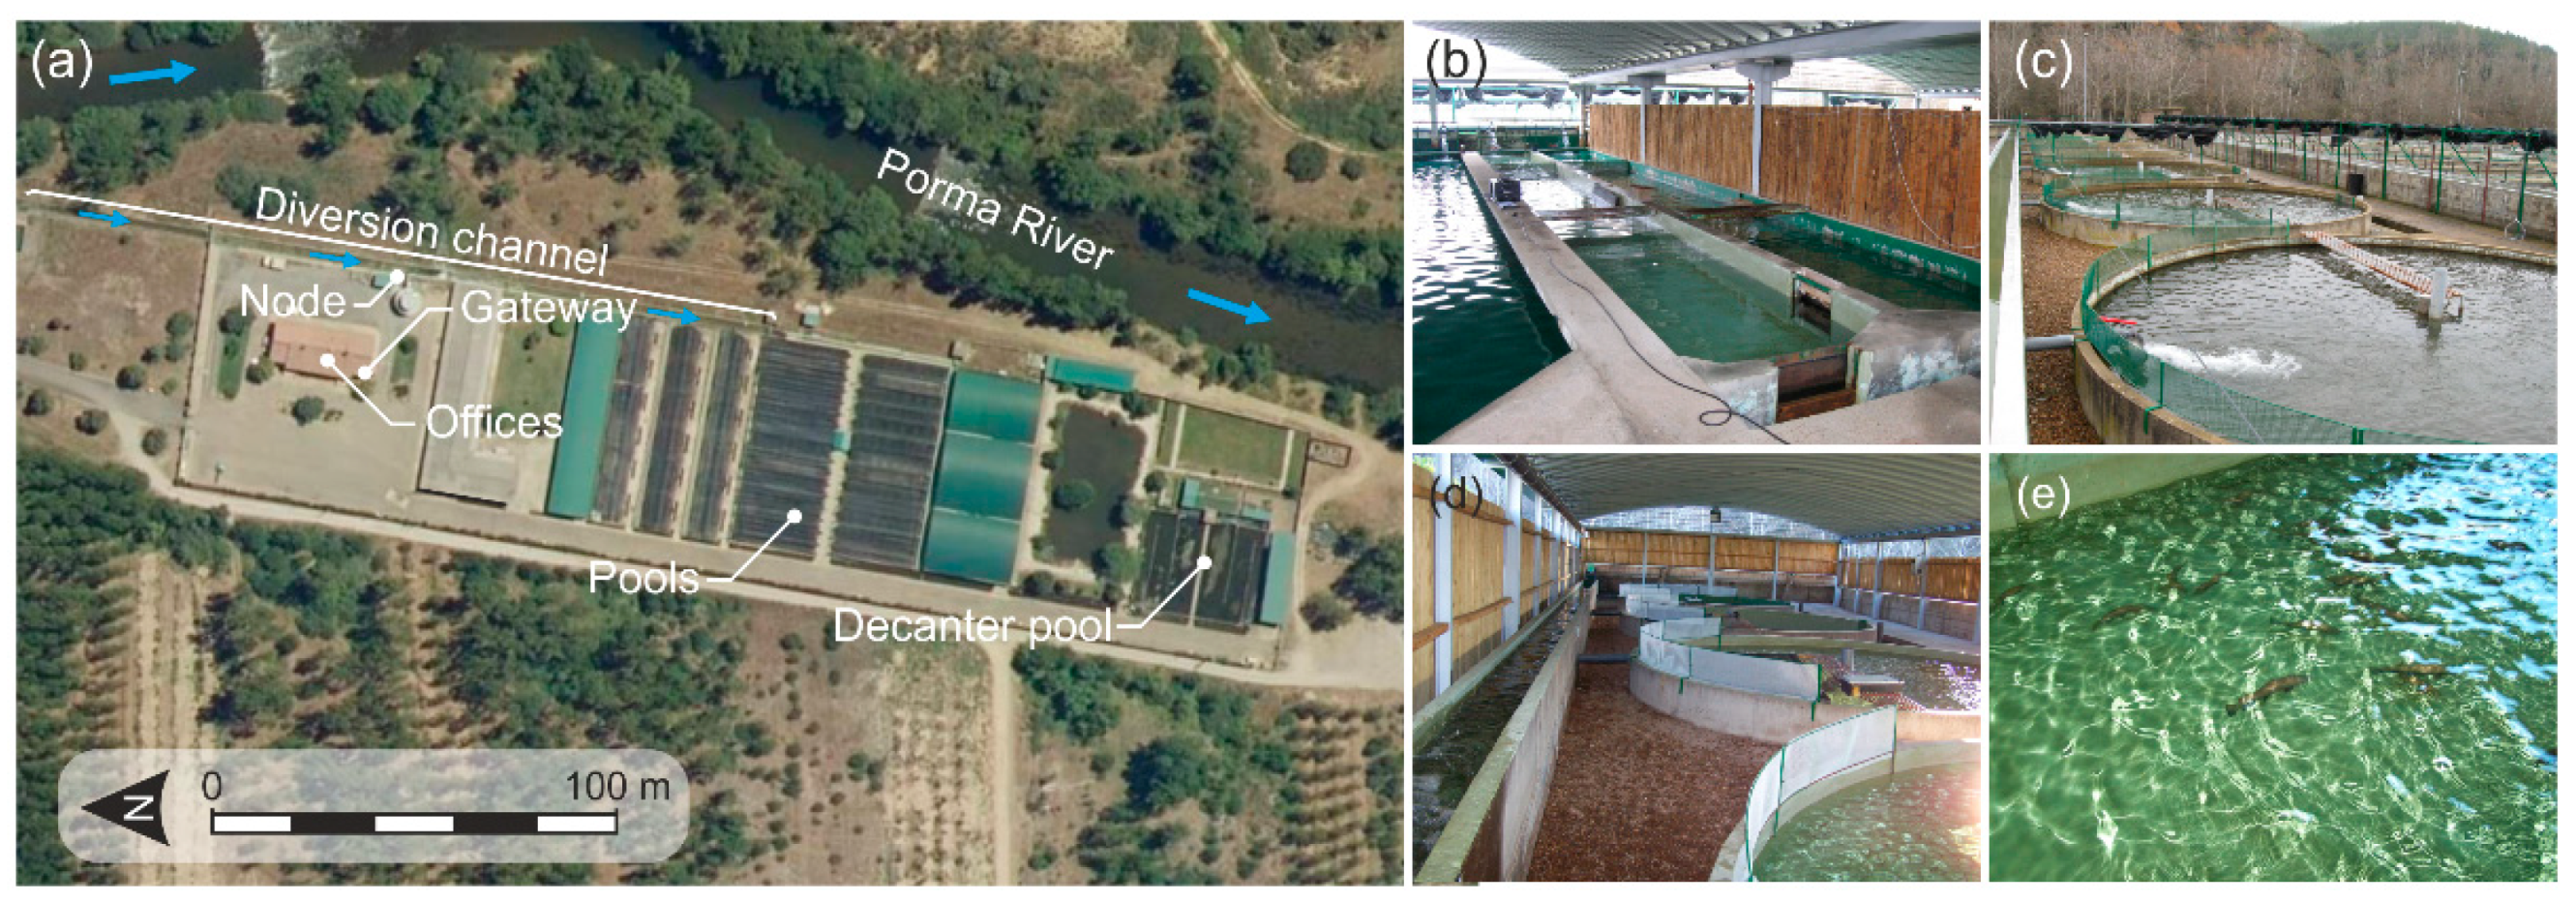
The developed network was implemented and tested at the Ichthyogenic Center of Vegas del Condado (Porma River, León, Spain–42°40′53.2″ N 5°21′24.3″ W). This center is a native brown trout (
Salmo trutta) genetic reservoir, which has the aim of produce and preserve genetic lineages adapted to Iberian climate (i.e., adapted to special conditions of hydrological variability of Mediterranean areas [
18]) for stocking in rivers and headwaters in possible events of major deaths. That is to say, the main purpose of this facility is conservation and not production per se. Nevertheless, the center has the common configuration of an open-air fish farming facility (
Figure 1). The water (0.8 m
3/s) is directly diverted from the Porma River through a diversion channel (2 × 1 m). This channel divides the incoming water into the different pools of the facility. Each pool contains fish of different age classes. After its tour, the water is poured into a decanter pool and, finally, released back into the river.
Until the installation of the sensor network (20 April 2021), water quality monitoring was performed in a laboratory, by manually collecting samples from the diversion channel periodically. Thus, the diversion channel was the monitoring target for the MS Quality. The network will be monitoring and managing the water quality for at least two years (20 April 2023) before reaching final conclusions on the improvement of daily fish farm management.
2.2. The Sensor Network
In the design phase of the sensor network, two types of design characteristics were defined: the mandatory ones, i.e., those fixed during the project definition (e.g., minimum number of parameters to be measured or minimum configuration capacity of the network) and, the free or optional ones, i.e., those with let designers the freedom to define and innovate (e.g., selection of the communication protocols, electronic design, additional functionalities, etc.). The fixed characteristics defined by the project promoters were:
A minimum sensing suite: pH, dissolved oxygen, water temperature, and conductivity.
Real-time configurable capability.
Minimum protection grade: IP65.
Online management platform with minimum functionalities: data storage capability, network configuration options, data visualization, analysis and downloading, status check, alarm programming, and notification manager.
Connectivity: compatible with RESTful API (used by the project promoters).
Security: guarantee of secure communications.
The network and management tools were designed considering those fixed constraints. However, the network was also designed to be used beyond the objective of this project and to ensure a high degree of compatibility with future use cases and intercompatibility with other protocols and technologies. That is to say, reusability, adaptability, and customizability were the main driven factors of the final design.
2.3. Hardware
The network is composed of a single node (
MS Quality) installed in the diversion channel of the fish farm (
Figure 1a) and a central gateway installed in the office of the fish farm managers (
Figure 1a). The gateway communicates with the node, collects the data, runs the algorithms, triggers the alarms, and communicates with (1) an online server (for data transmission and update configuration parameters), as well as, (2) with the infrastructure of data transmission of the promoters. That is to say, the system was designed to work in star network architecture, even if the hardware side is compatible with other architectures.
2.3.1. Node
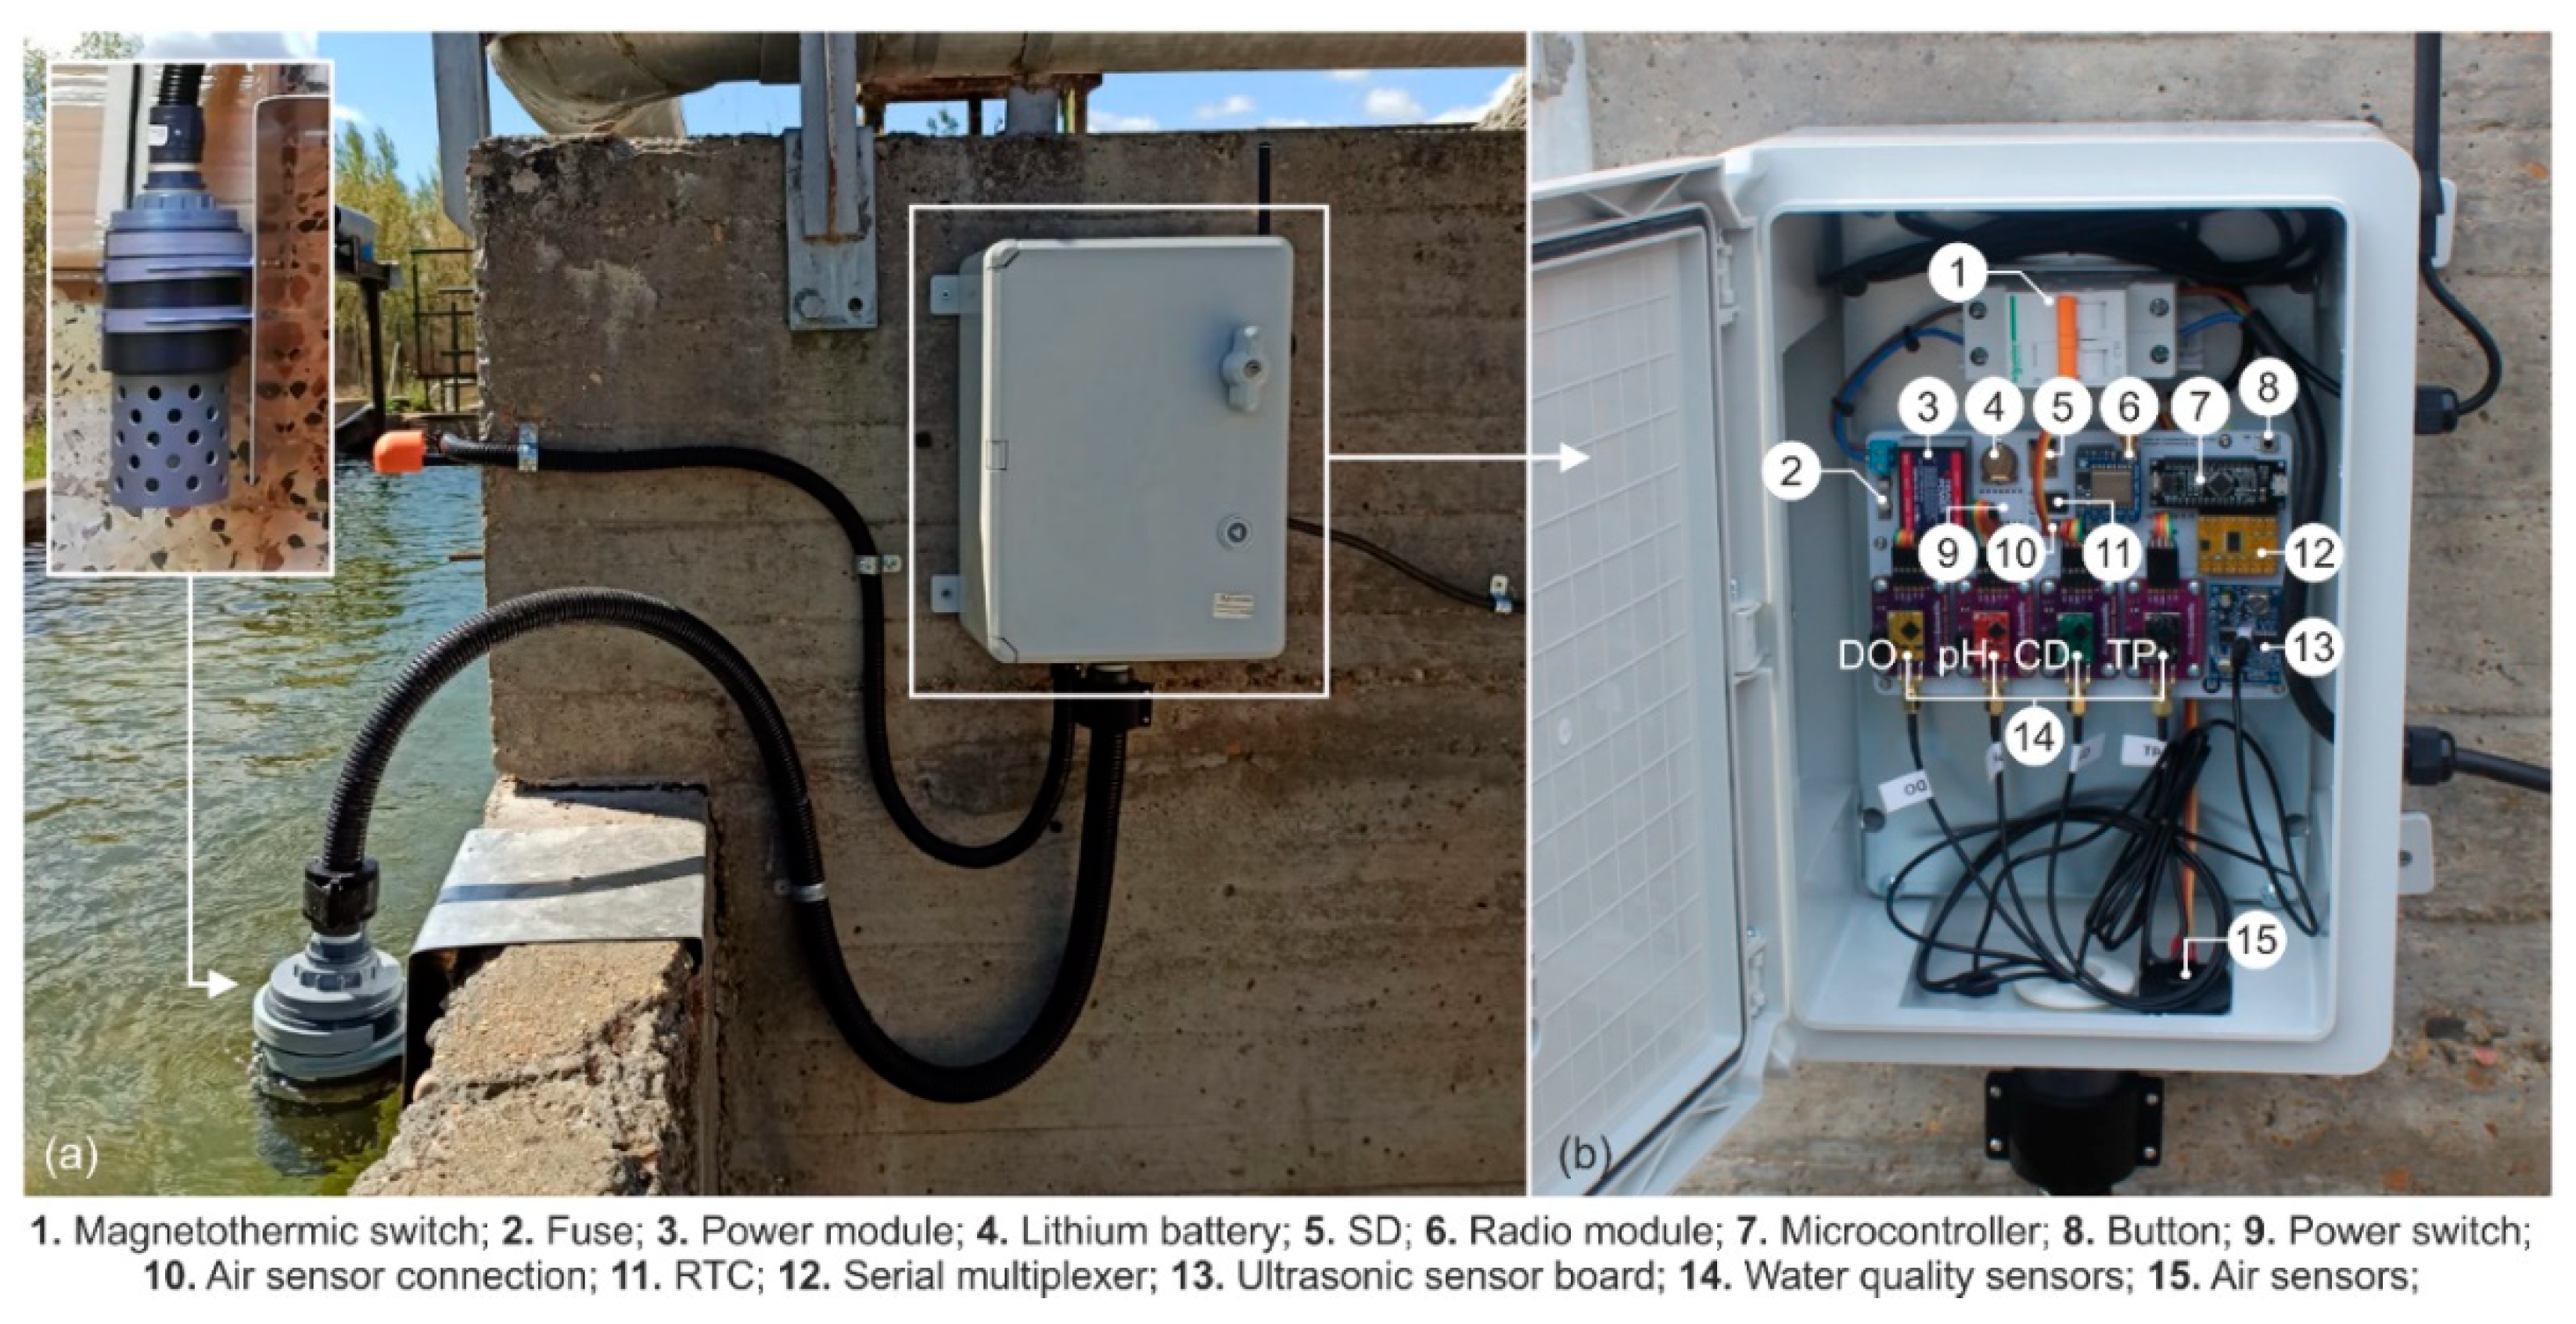
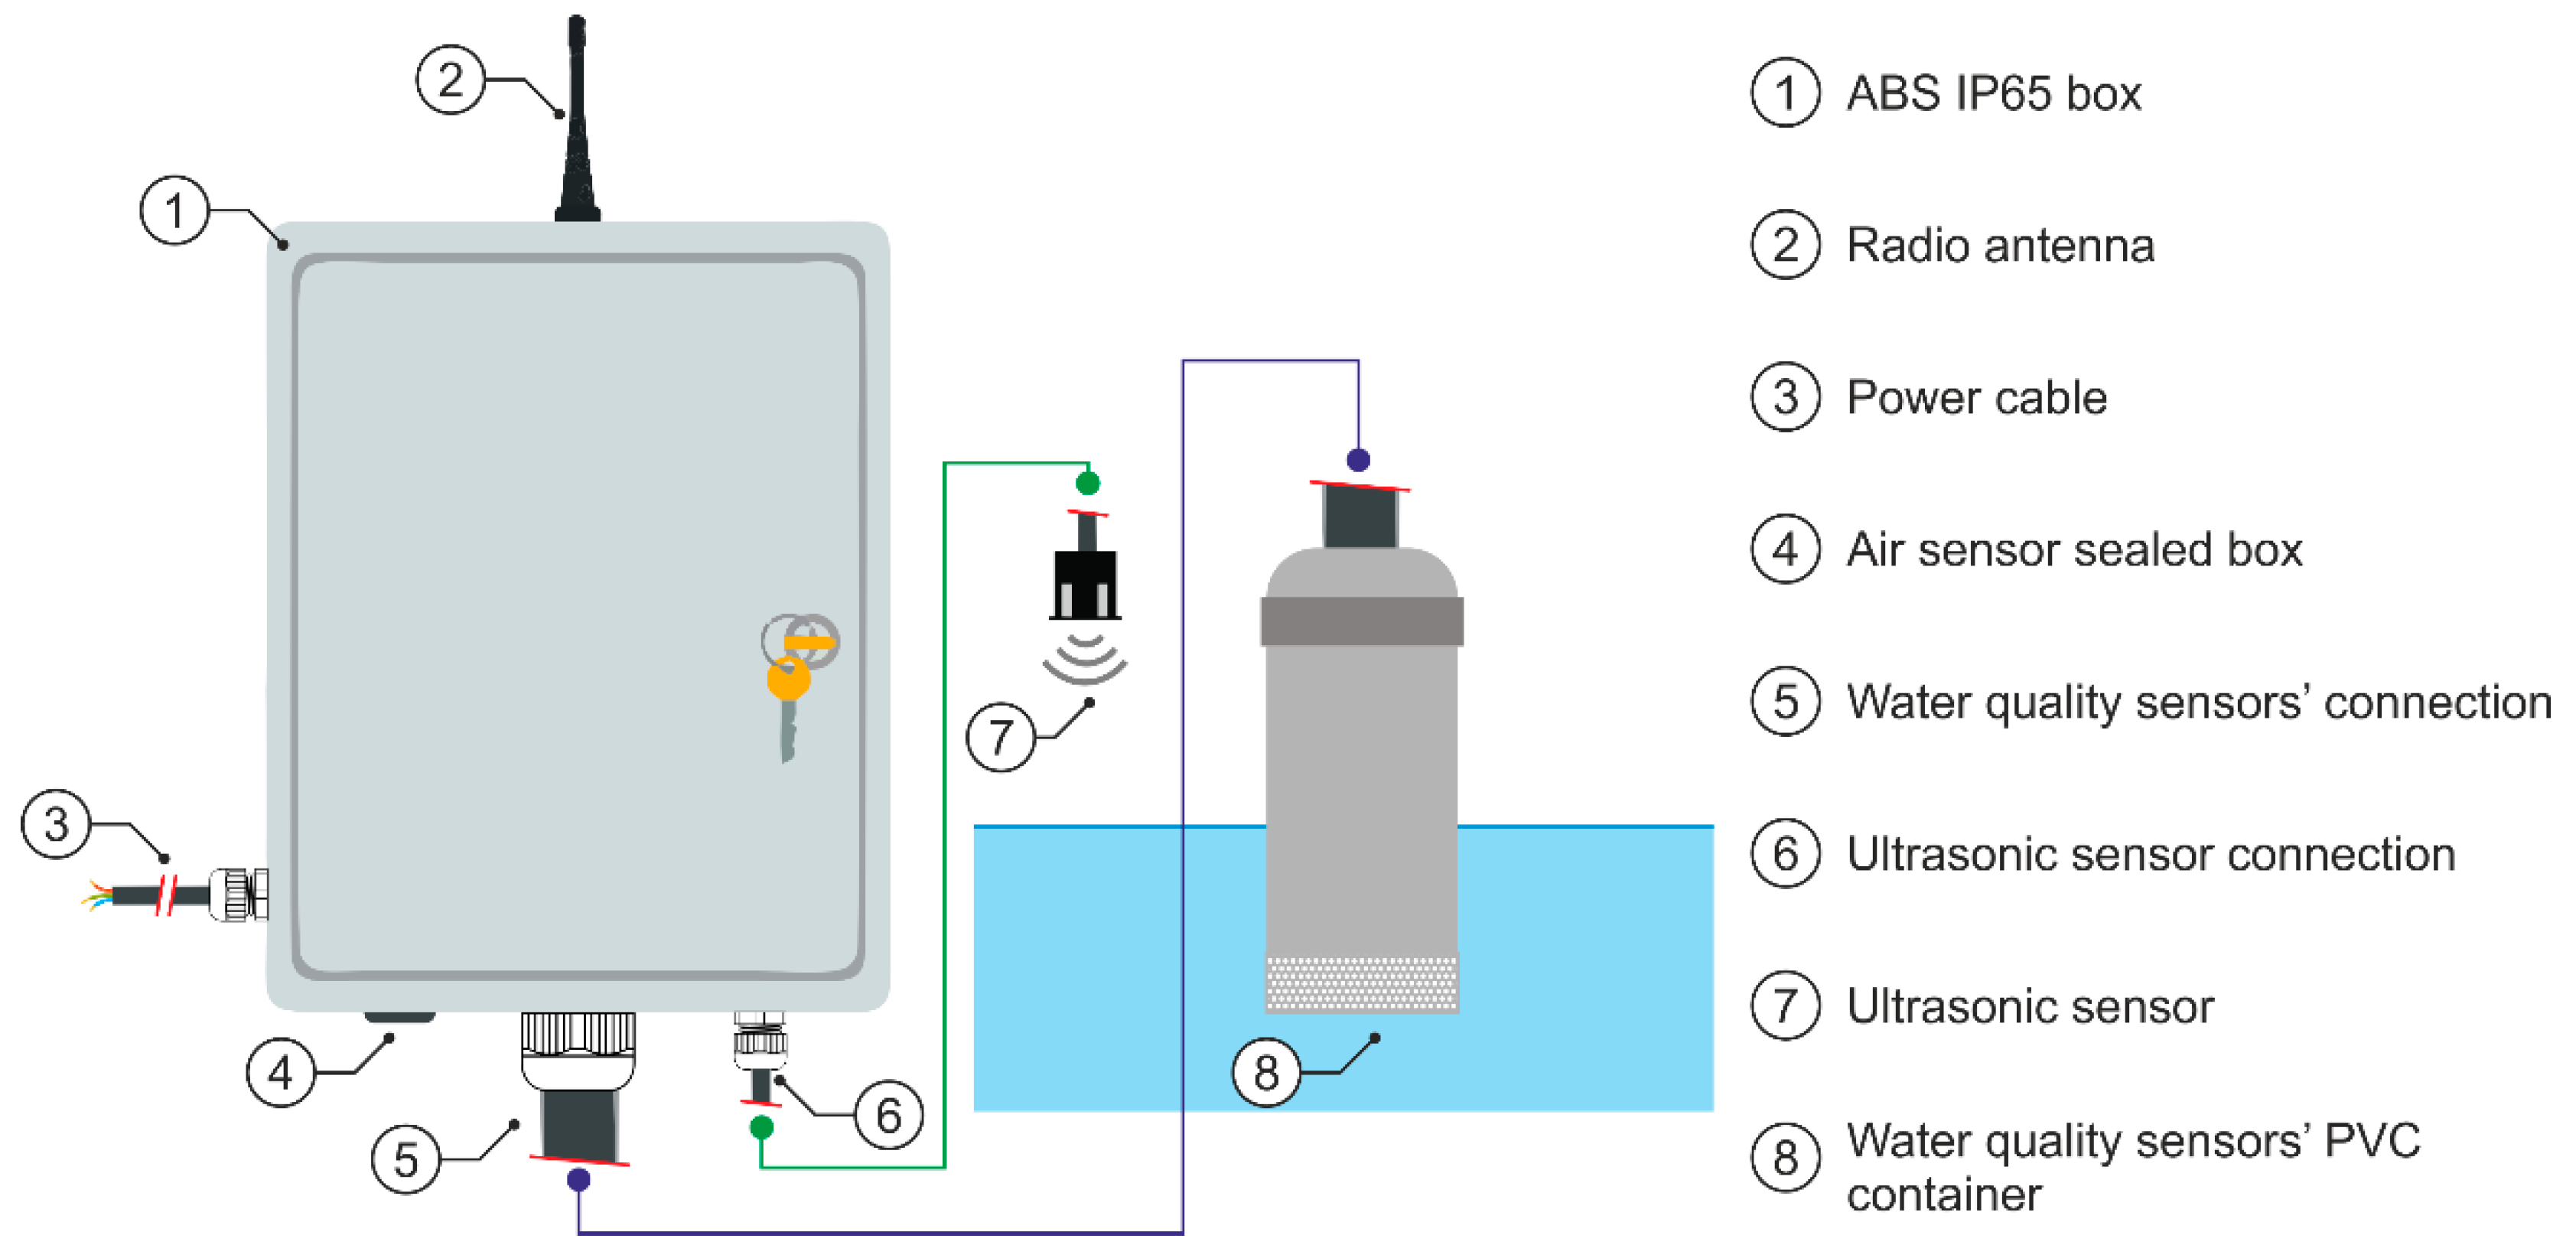
The node (
Figure 2), besides covering the listed fixed characteristics, presents other design features that make it versatile to cope with other potential uses such as standalone monitoring, alternative power management options (e.g., alternative power path to connect a solar power source when no power lines are available or for an uninterruptible power supply (UPS) when power cuts are frequent), or the incorporation of other sensors and communication platforms. Its main component (
Figure 3) consists of an Arduino compatible [
19] ATSAMD21G18 microcontroller (Atmel, San Jose, CA, USA) connected to a long range (LoRa) RFM95 radio module (Adafruit, New York, NY, USA) and a secure digital (SD) card via serial peripheral interface (SPI) connection, and a real-time clock (RTC, DS3231) via an inter-integrated circuit (I2C) connection (
Figure 3a). The SD card is auxiliary, it actuates as an independent storage unit (backup storage unit) for the collected data. When working in standalone conditions (i.e., without a gateway), the node can control its own ON/OFF cycles through RTC (real-time clock) alarms and an electronic power switch (Pololu 2808, Pololu, Las Vegas, NV, USA) (
Figure 3). All components are integrated into a printed circuit board protected in a certified watertight (IP65) acrylonitrile butadiene styrene (ABS) plastic box (350 × 250 × 150 mm). As there are multiple power points in the facility, the power is obtained from the general line (220 V AC 50 Hz) and converted to 5 V DC via a TRACO POWER AC/DC Power Module (TMPW 10, TRACO POWER, Baar, Switzerland). The RTC is independently powered by a CR1220 3V lithium battery (battery duration is estimated at least 5 years), to ensure correct timing in the node under possible power losses. Correct timing is fundamental for standalone performances as well as to store data in the SD card with correct timestamp.
The basic sensor suite (
Table 2) consists of certified pH, dissolved oxygen, water temperature, and conductivity sensors from Atlas Scientific (New York, NY, USA) connected to the microcontroller via serial port expander (serial multiplexer) of 8 channels (
www.atlas-scientific.com, accessed on 20 July 2021). Additionally, due to the multiple ports still available in the microcontroller and to augment the versatility of the node, the device has multiple additional factory-calibrated digital sensors such as an ultrasonic sensor (JSN-SR04T, DFROBOT, Shanghai, China) connected via two digital pin connections for water level monitoring, a barometric pressure sensor (BMP280, BOSCH, Gerlingen, Germany), and an air temperature and humidity sensor (SI7021, SILICON LABS, Austin, TX, USA), both connected via an I2C connection.
2.3.2. Gateway
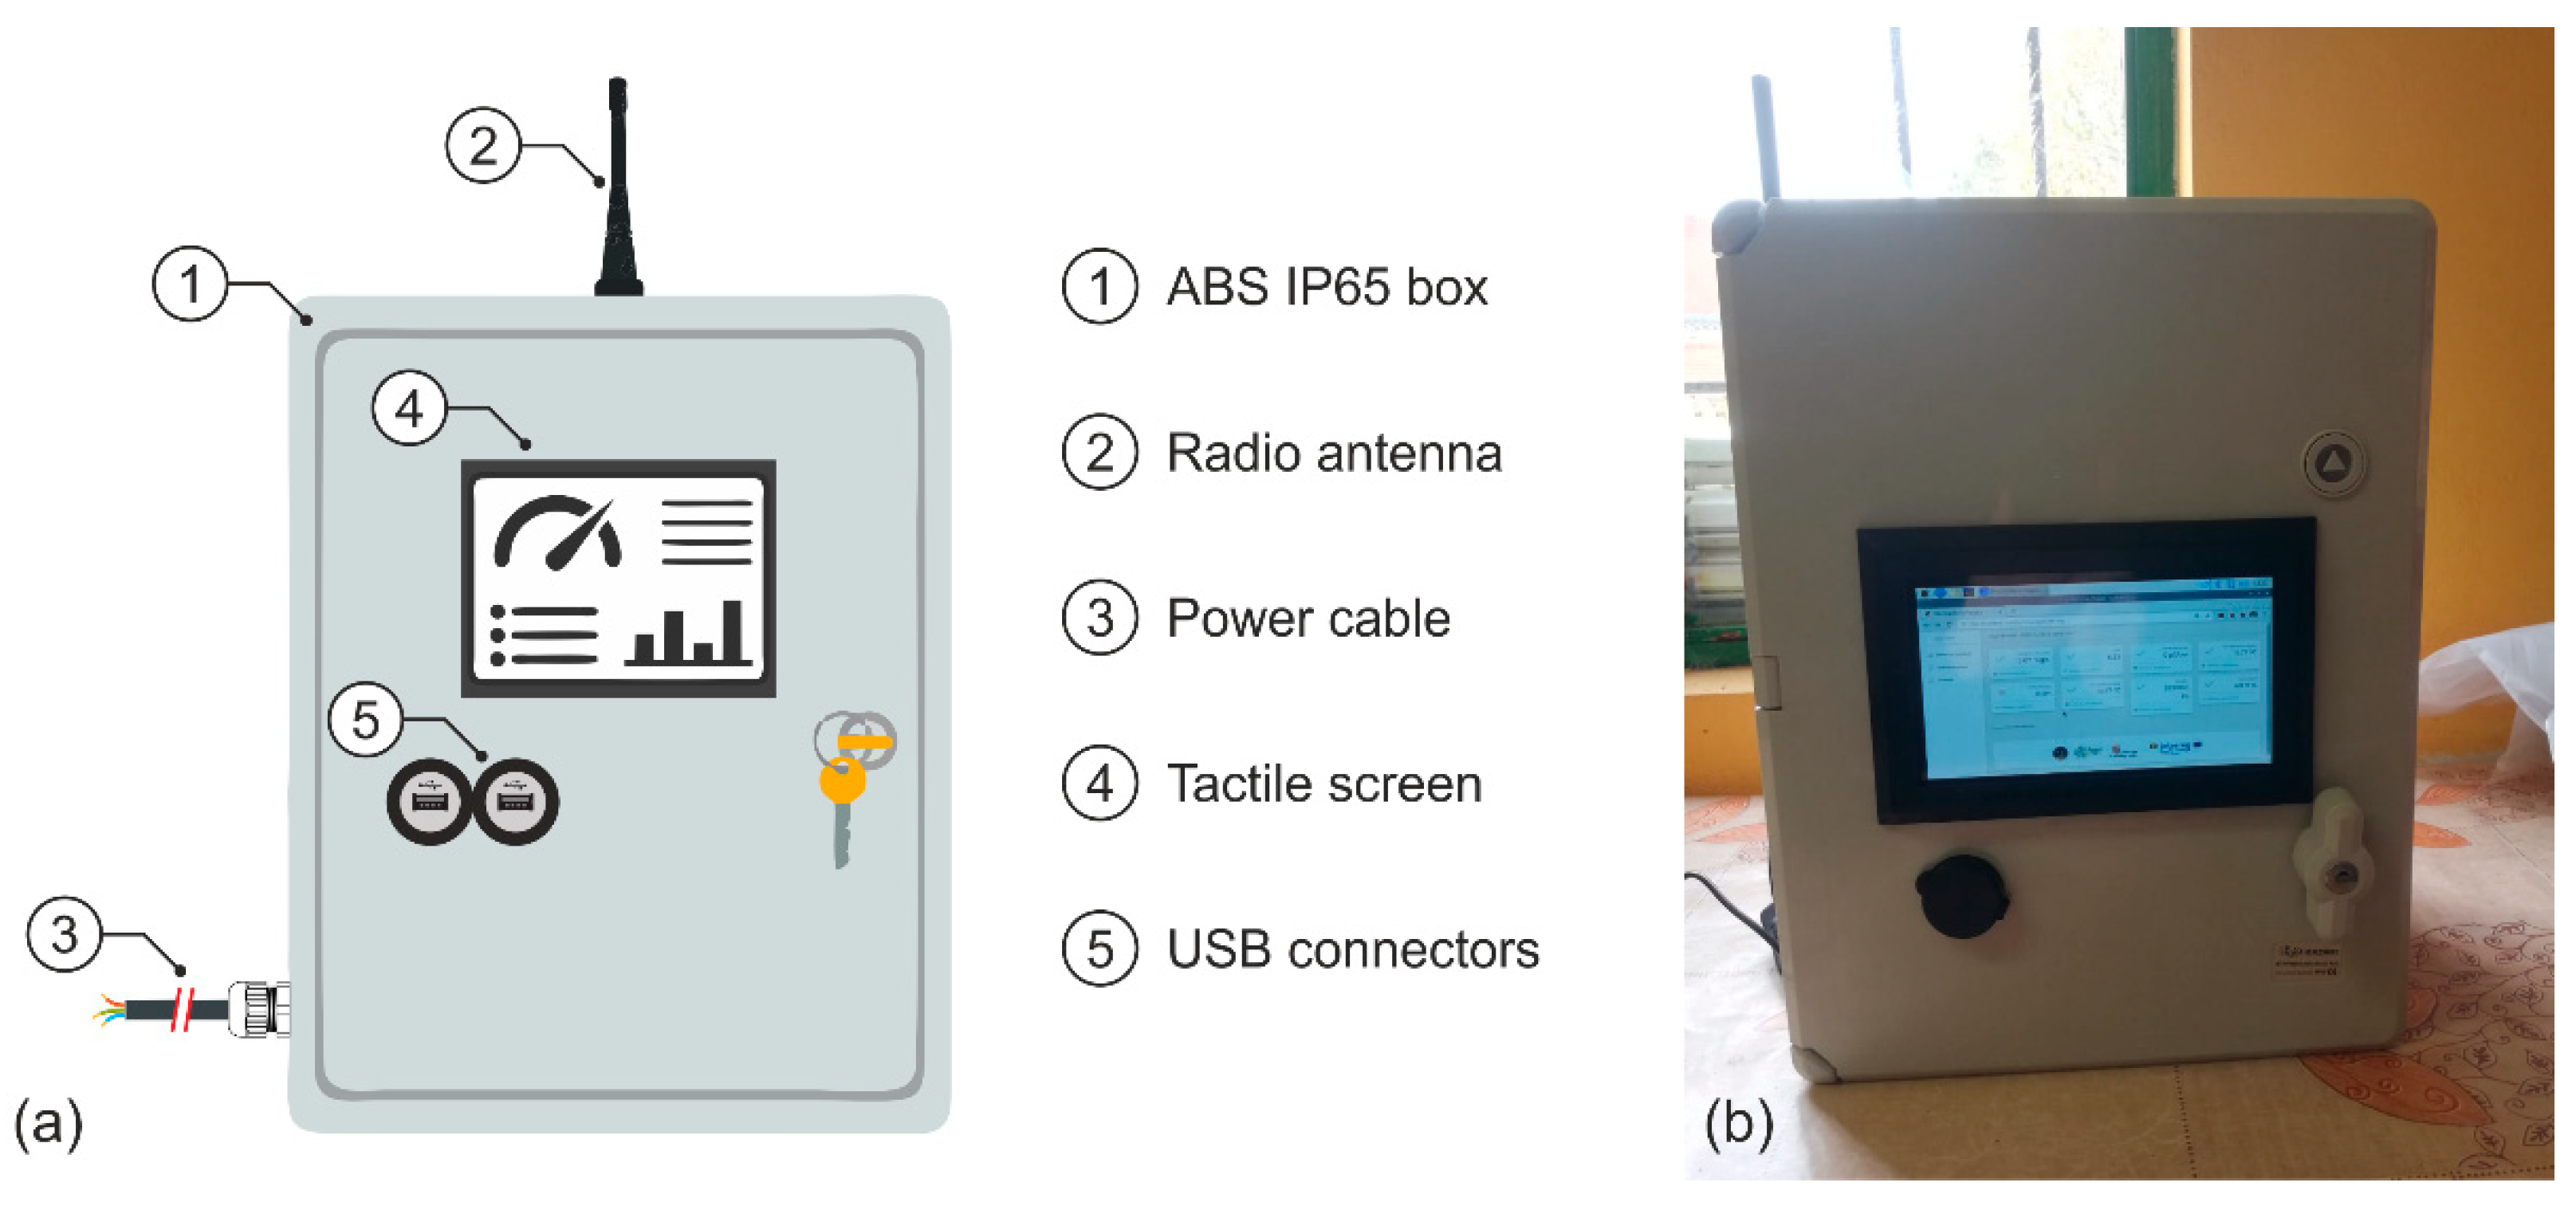
The gateway (
Figure 4) consists of a small single-board computer (Raspberry Pi 4) connected via serial to an ATMEL ATSAMD21G18 microcontroller with a LoRa RFM95 radio module and a 4G modem (E3372H-320, Huawei, Shenzhen, China). The modem was selected considering the compatibilities with the single board computer and its operating system. The Huawei E3372H-320 behaved as a plug-and-play high-speed 4G dongle (when 4G LTE not available: 2G/3G) and for the Raspberry Pi 4 and Raspberry Pi operating system (Raspbian GNU/Linux 10), no further provisioning or setup is required. In addition, the system has a 7-inch capacitive tactile screen (164.9 × 124.27 mm) that serves as a direct user interface for system managing and data visualization. This screen is connected via an HDMI connection and a USB for tactile feature recognition. The full system is powered by a USB-C type power supply (input: 100–240 V AC 50/60 Hz 0.5 A max; output: 5 V DC 3.0A). Even if the system is thought to be indoors at the office, all components are protected in a certified watertight (IP65) acrylonitrile butadiene styrene (ABS) plastic enclosure (400 × 300 × 220 mm).
2.4. Software
The ATSAMD21G18 microcontrollers (in the node and in the LoRa module of the gateway) are programmed in C using the Arduino integrated development environment (Arduino IDE) [
19]. The single board computer (Raspberry Pi) is running the Raspberry Pi operating system (Raspbian GNU/Linux 10) (
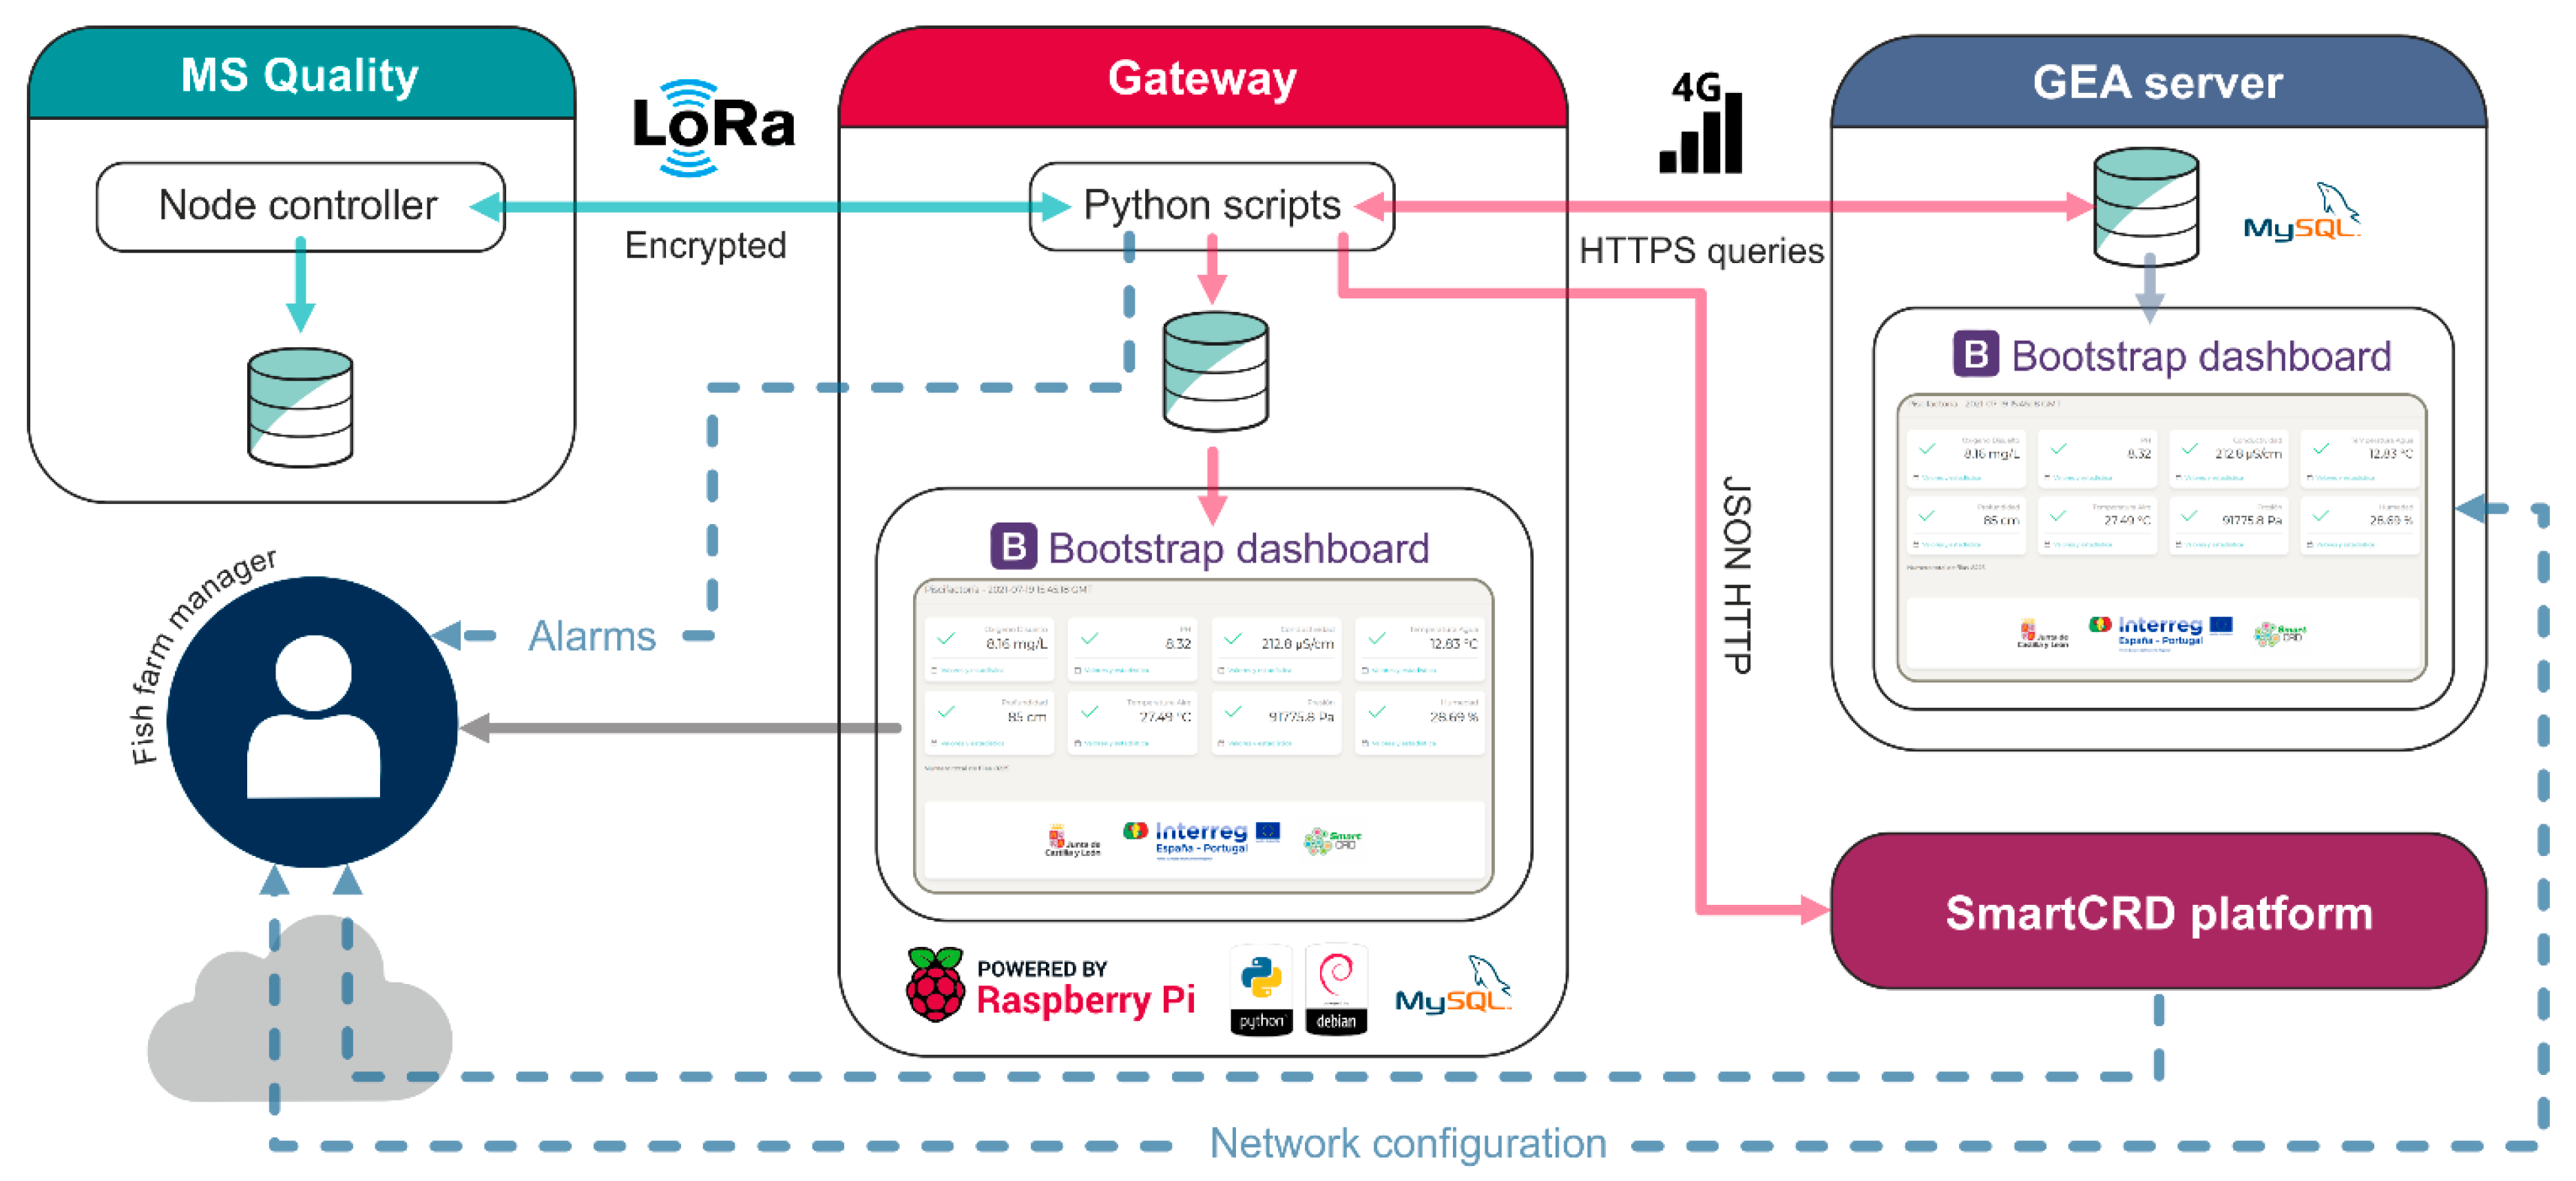
Figure 5). The developed code for the microcontroller allows bidirectional encrypted communication between nodes and the gateway. The node has its own address, which allows the gateway to identify and synchronize its transmission cycles (i.e., when there are more nodes, the gateway asks for data to each available individual address).
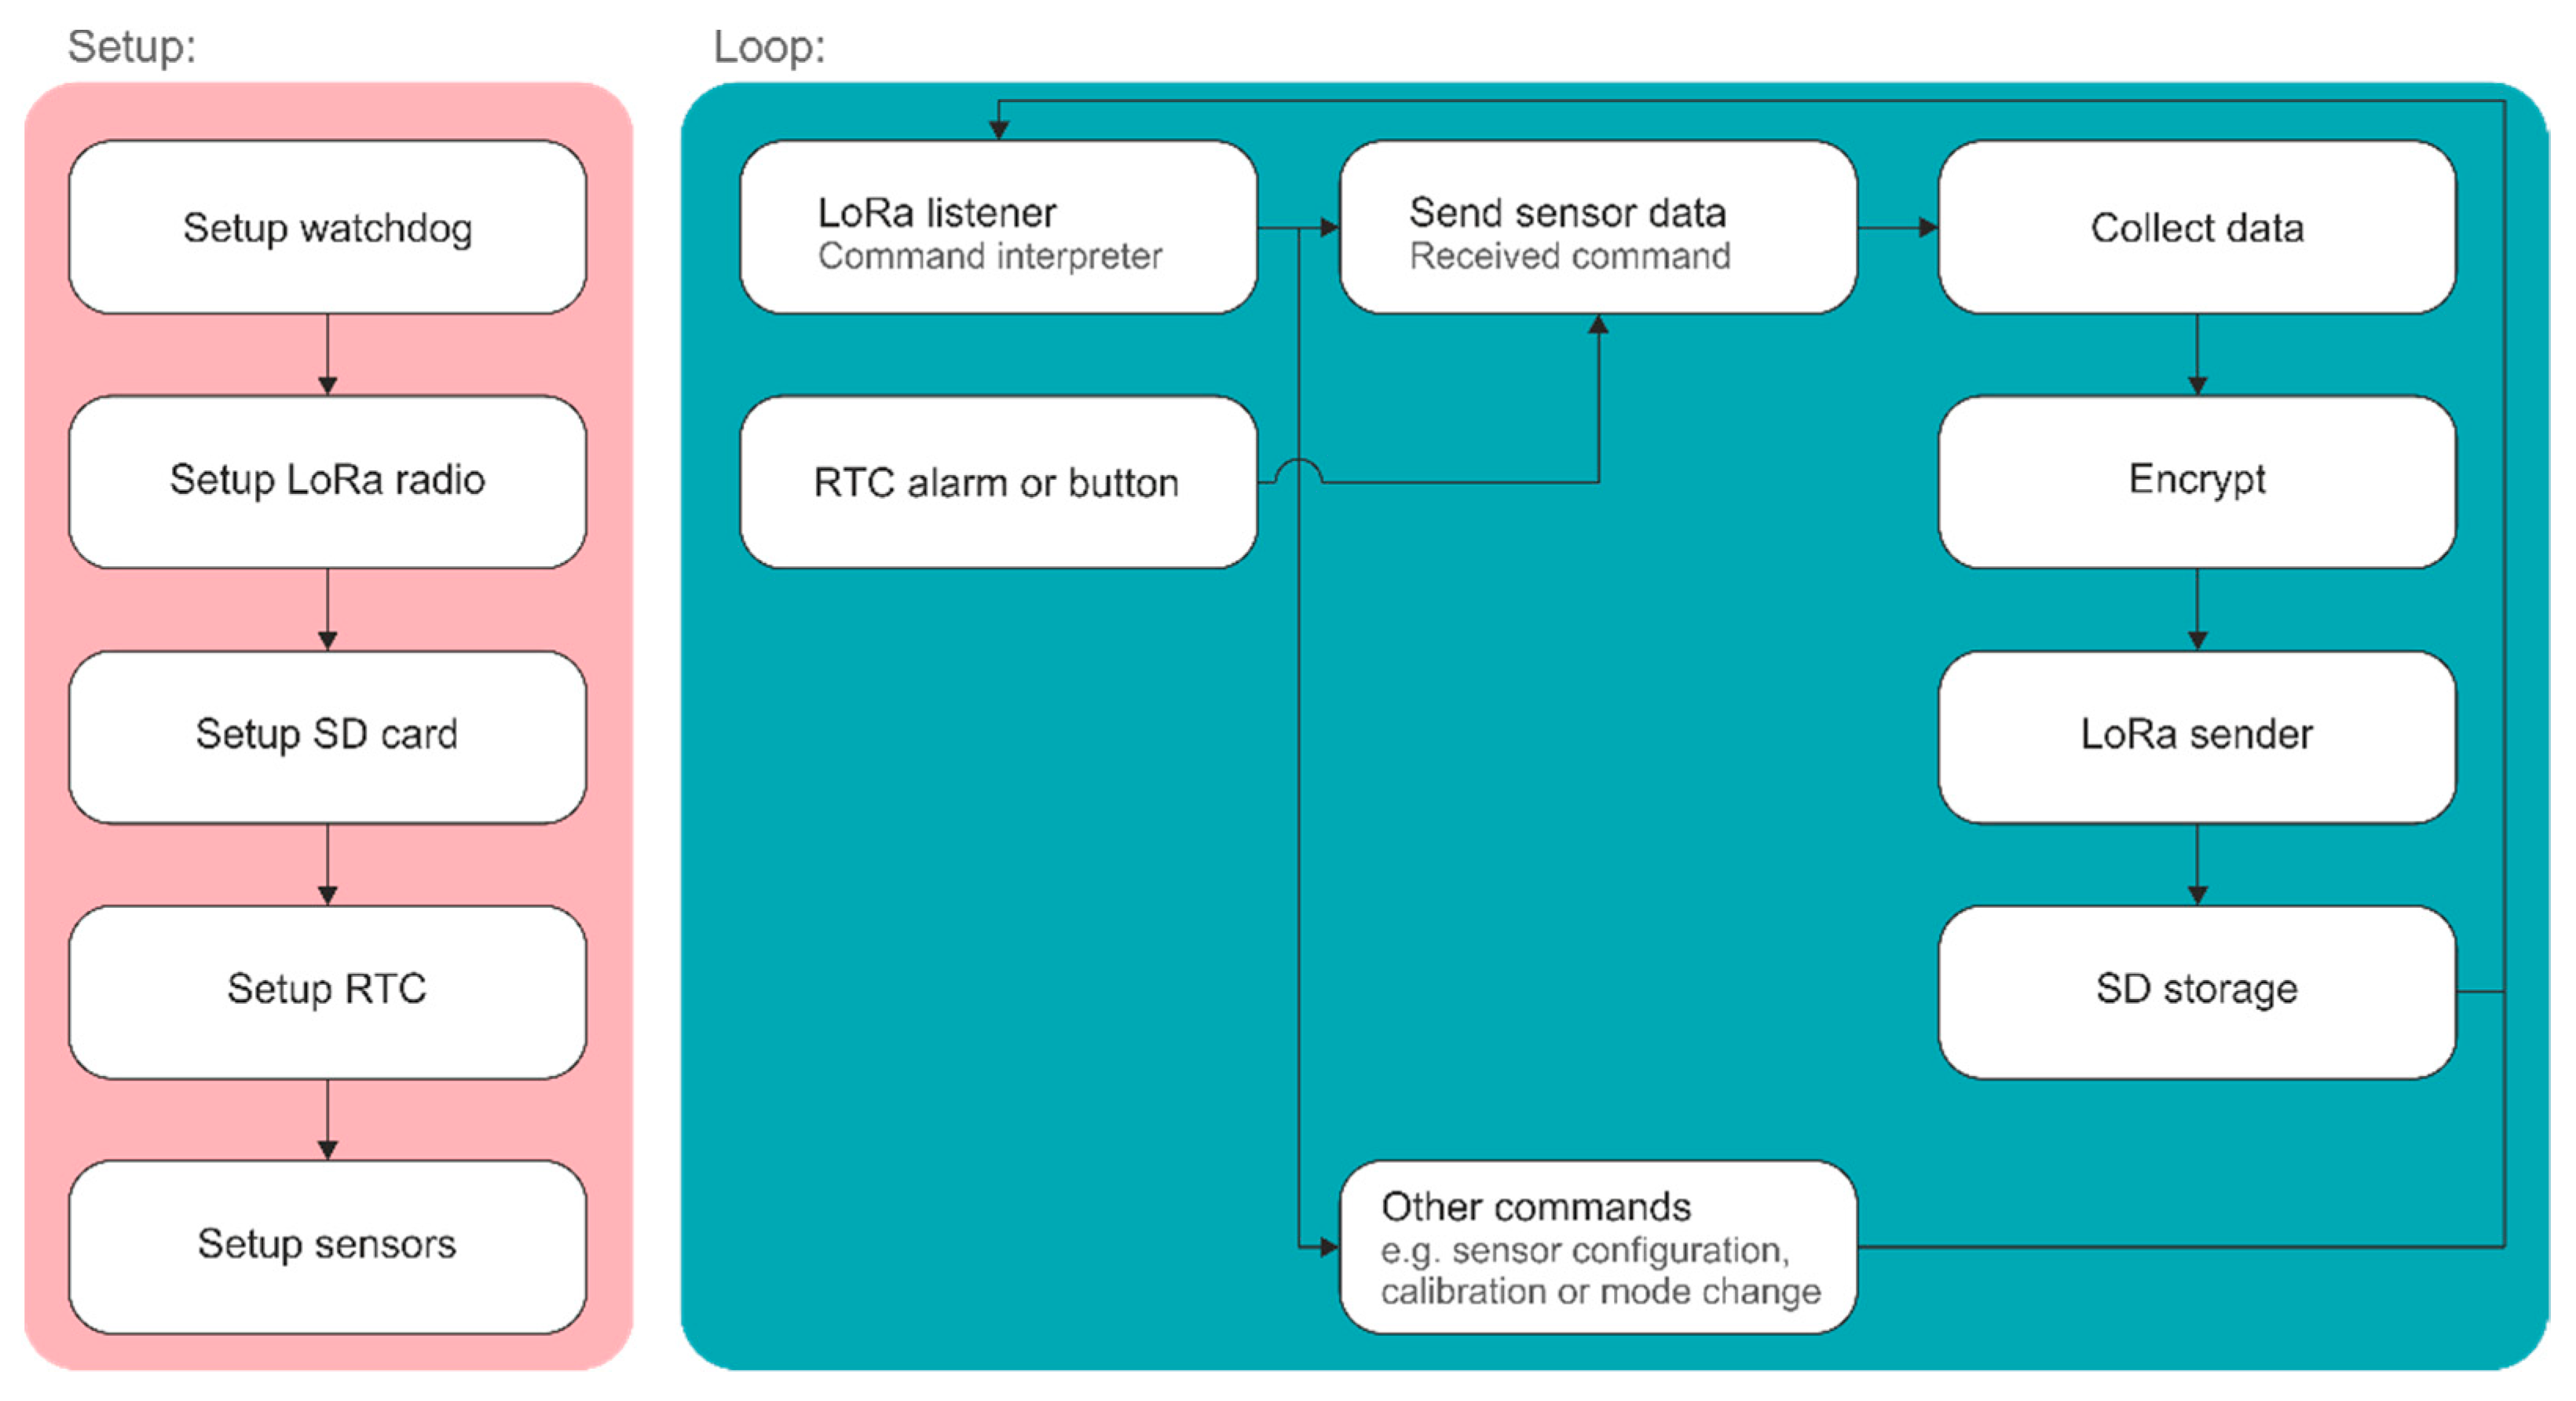
The node controller can interpret multiple commands or orders from the gateway, either the individual sensor data transmission and status check or the data transmission of all available sensors (
Figure 6). The suit of different tasks is easily scalable by modifying the source code of the node. Once the addressed node receives the order of sending data, it collects the data from the sensor(s), saves the information in its SD card, and transmits the encrypted information (simple XOR cipher with a random key longer than the message) to the gateway, which checks the integrity of the message by (a) ensuring the correct number of variables, (b) checking their values (inside sensor limits) and (c) detecting the presence of end-keyword before its processing. Once the message is validated, the gateway can schedule the node for the next message transmission (i.e., the node switches off until the next configurable RTC alarm) in those installation sites where there are power restrictions.
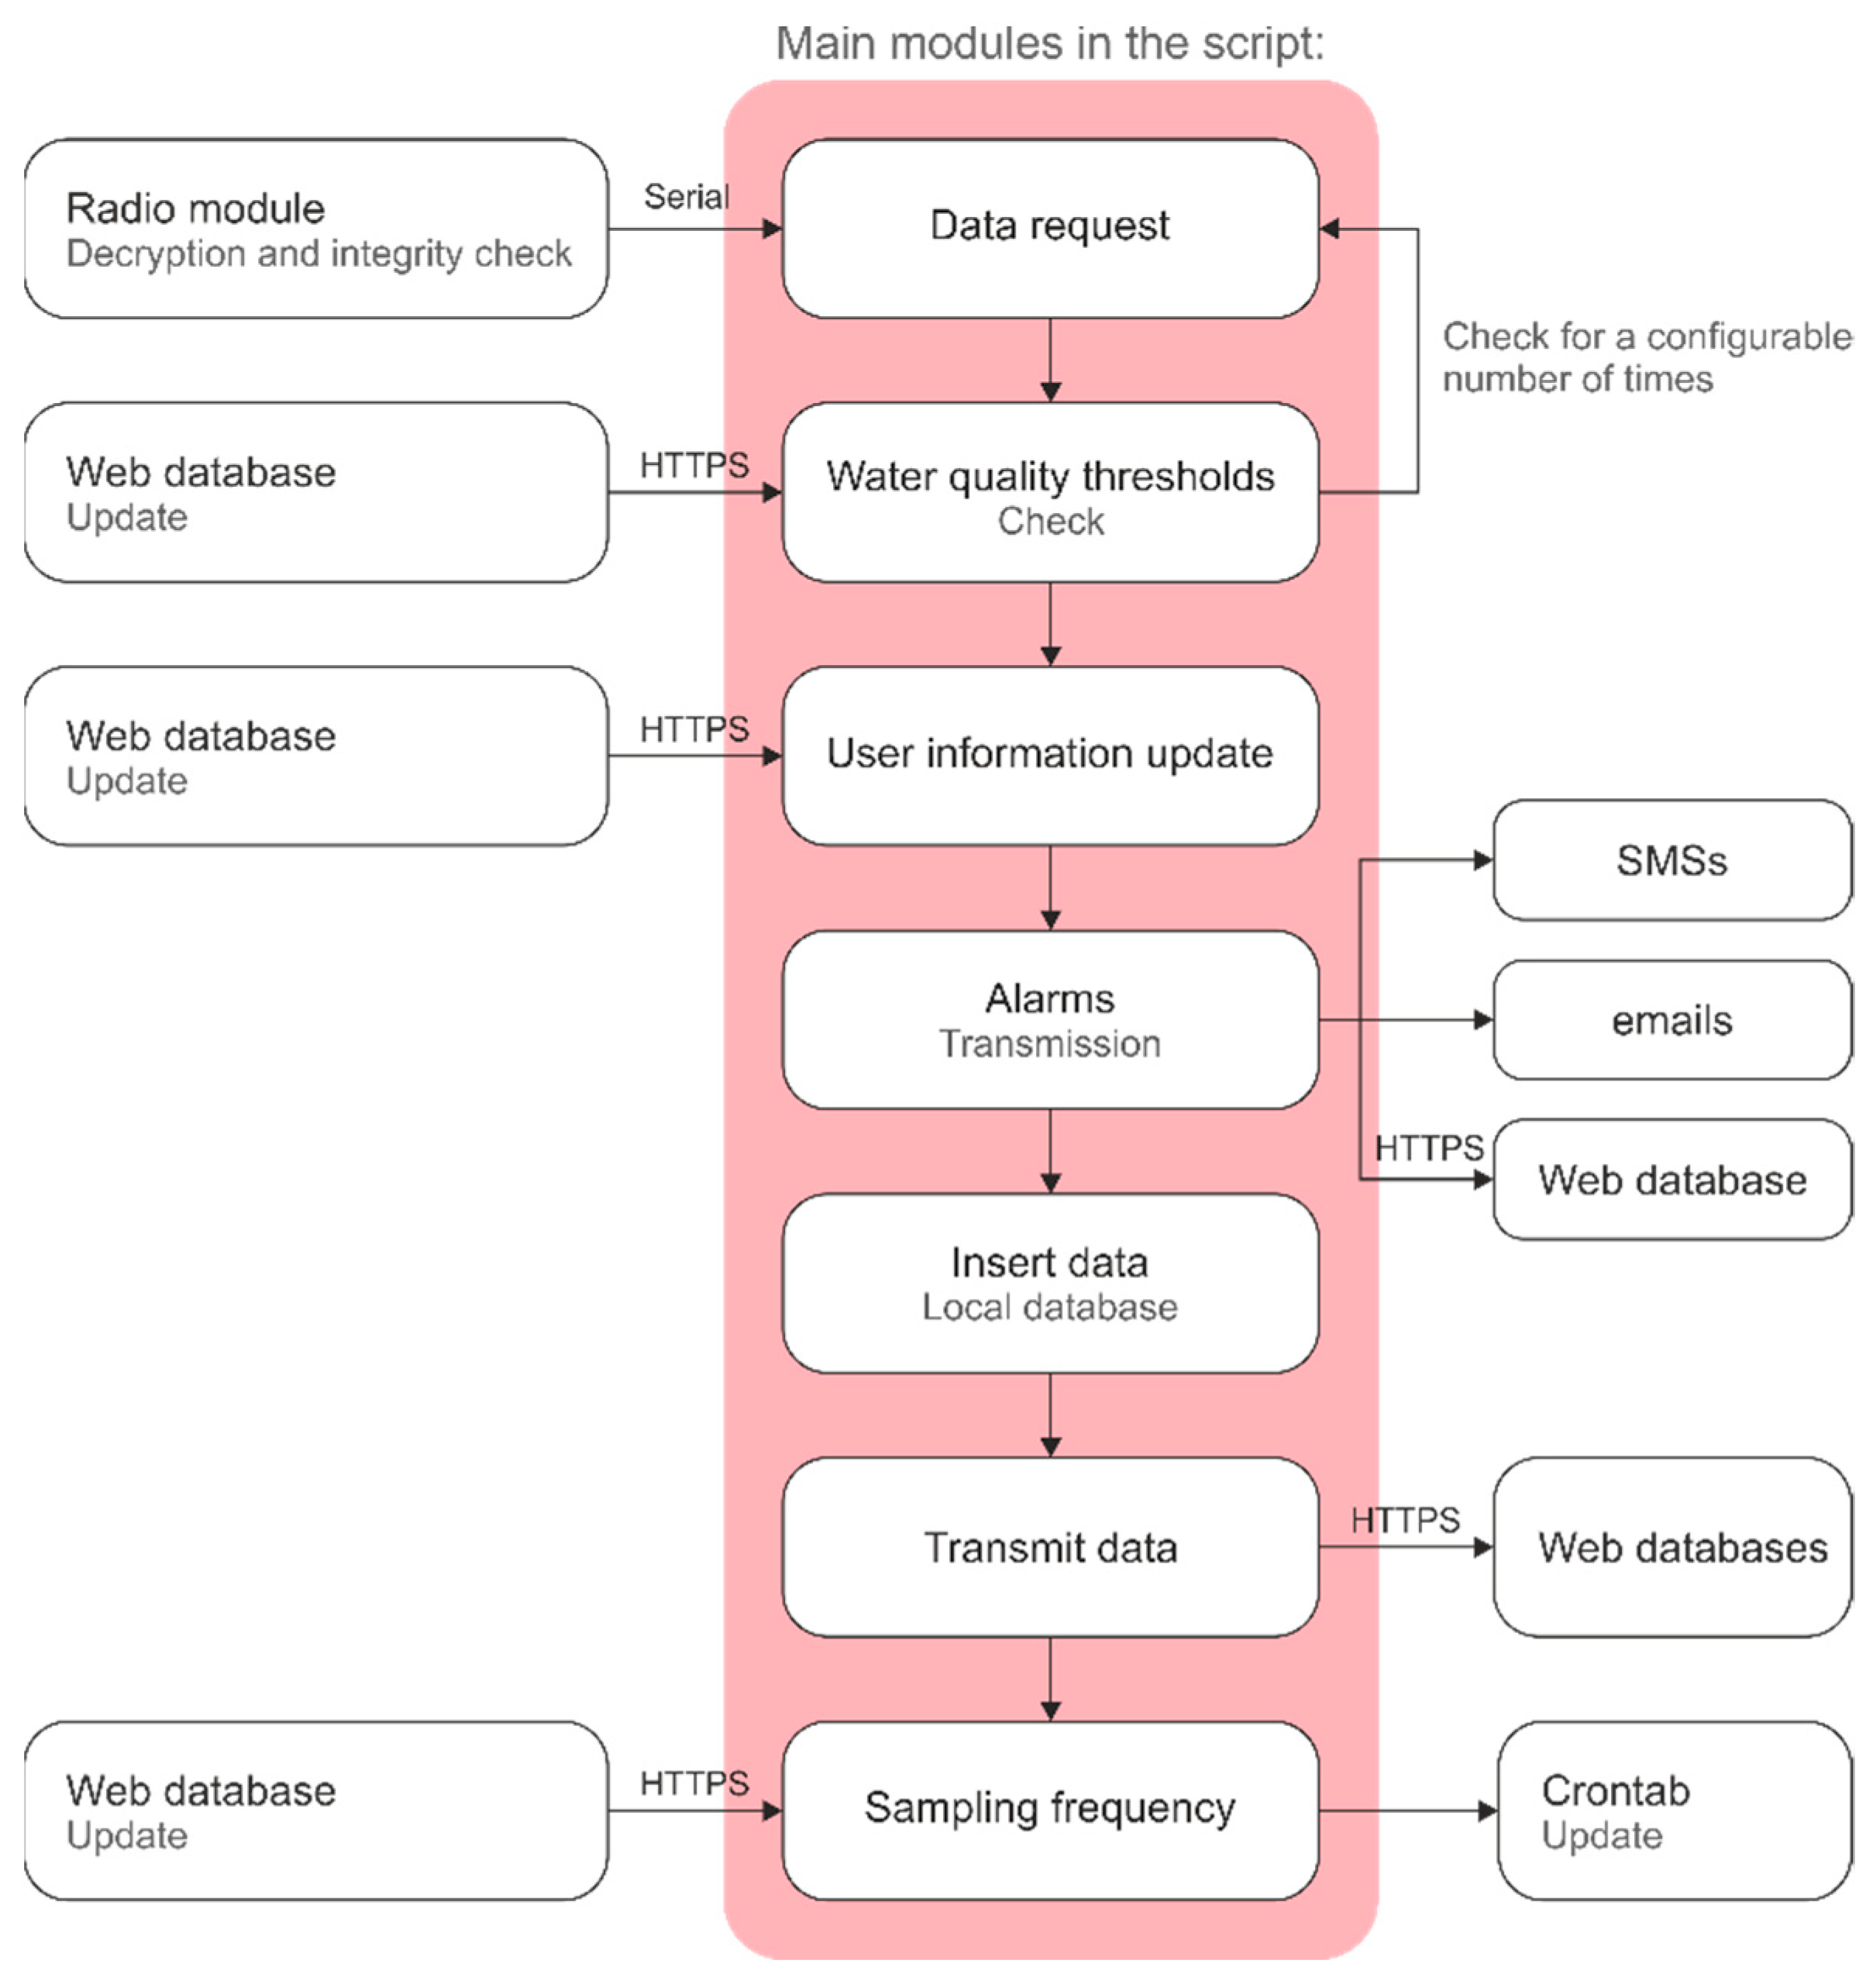
The gateway has two main functionalities: (1) it acts as a local server for the collected data (MySQL) and its visualization (a simplified local clone of the online management dashboard) and (2) it controls and manages the network performance using scheduled Python scripts. The main script of the gateway has the following sequential modules:
Collection of the new network configuration parameters from the online management platform through HTTPS queries (alarm limits, alarm contacts (emails and telephones), and sampling frequency).
Updates of configuration parameters.
Communication and data collection with each of the nodes listed in the database.
Checking of data thresholds to detect anomalous conditions and to send emails or SMS to the alarm contacts when necessary.
Saving data in the local database (MySQL).
Transmission of new data into the project promoters platform (RESTful API though JSON HTTP [
20]).
Transmission of new data into GEA (Grupo de Ecohidráulica Aplicada) research group online database server (MySQL) through HTTPS queries.
Change of the scripts’ schedule if a new sampling rate has been inserted (automatic update of Crontab interval).
The execution of the main script is automatically repeated using the UNIX Crontab utility. Likewise, the repetition frequency is recursively updated when managers change the data sampling rate in the online management platform. Although Cron can schedule multiple jobs (or scripts) at the same time, simultaneously for all practical purposes, if jobs use the same resources (for instance serial communication with the same radio) can generate conflicts in the system or unexpected delays. Therefore, to ensure no conflict between communication scripts, the designed architecture consists of a main modular and sequential script that controls the whole flow of the data collection and transmission (
Figure 7).
The modular distribution of the script allows to easily insert more functionalities, such as transmission to other platforms or additional configuration options of the network. Moreover, using the same architecture of script-based functioning, it is possible to implement in parallel more complex and not conflicting data processing functionalities (e.g., machine learning) due to the Pythons’ potential and Raspberry Pi’s increasing power over the years. For instance, another parallel script scheduled in Cron of the systems sends an alarm when a reboot event occurs and it automatically opens the dashboard of the gateway.
2.5. Management Platform
To visualize, download and manage the collected data, as well as, for the remote configuration of the network, an online management platform was developed (
https://gea-ecohidraulica.org/downloads/ScreenshotsDashboard.pdf, accessed on 20 July 2021). To avoid the need for mobile apps, the design was based on Bootstrap [
21] in combination with PHP and JavaScript functionalities. Bootstrap is a free and open-source front-end framework used to create responsive (device agnostic) websites and web apps. The platform with full functionalities is online while a simplified version of it behaves as a local dashboard in the gateway. The online platform is hosted by a provider without traffic limitations. Due to the nature of the project, access to the online dashboard is limited, therefore a massive traffic on it is not expected. Considering this, we tested up to 20 users working simultaneously without noticeable performance reduction. The local dashboard of the gateway is only accessible in situ or by admin remote access.
The access to the managing platform is secured with credentials (two types of users: observers or standard users and administrators). Once the user logs in, it visualizes all the real-time values of the monitored parameters, together with a colored symbol indicating the status of the variable (a red cross if the variable is out of the defined thresholds and a green tick otherwise). Below each parameter, the user can access the plot over time (day, week, month, all, or selected time range) and to a statistical summary of the selected time range. Data management is performed via PHP scripts that submit SQL queries to the online database and plots are generated with Chart.js, a free open-source JavaScript library for data visualization (
www.chartjs.org, accessed on 20 July 2021). Additional functionalities include, among others, data downloading, alarm configuration, and measure frequency configuration.
The alarm management is carried out at the edge layer (the gateway) and to date, it follows a simple logic. Once water quality data are collected, they are compared with the thresholds only if the water level is above the level of the water quality sensors. If the water is below only water levels’ threshold is checked (this usually indicates the existence of maintenance labors in the channel). The final aim, after collecting more data and managing patterns, is to change (or run in parallel) this algorithm by machine learning classification technics to implement lists of managing tasks according to specific patterns in the collected data, the Raspberry Pi based gateway, and Python language are excellent platforms for such purpose (e.g., [
22,
23,
24]).
2.6. Data Treatment and Validation
To showcase the performance of the network so far, a simple descriptive analysis of the data collected during the last two months (21 May 2021 to 21 July 2021) has been performed. For this, data were downloaded using the managing platform in a.csv file and analyzed in Matlab R2019a (MathWorks, Natick, MA, USA).
The evolution of each parameter over time was plotted to check for anomalies, detect management patterns, and the evolution of variables over time. This simple analysis allows to establish a starting point for the monitored data and to detect possible future anomalies or trends in the sensors (water quality sensors are sensitive devices that require frequent maintenance).
3. Results and Discussion
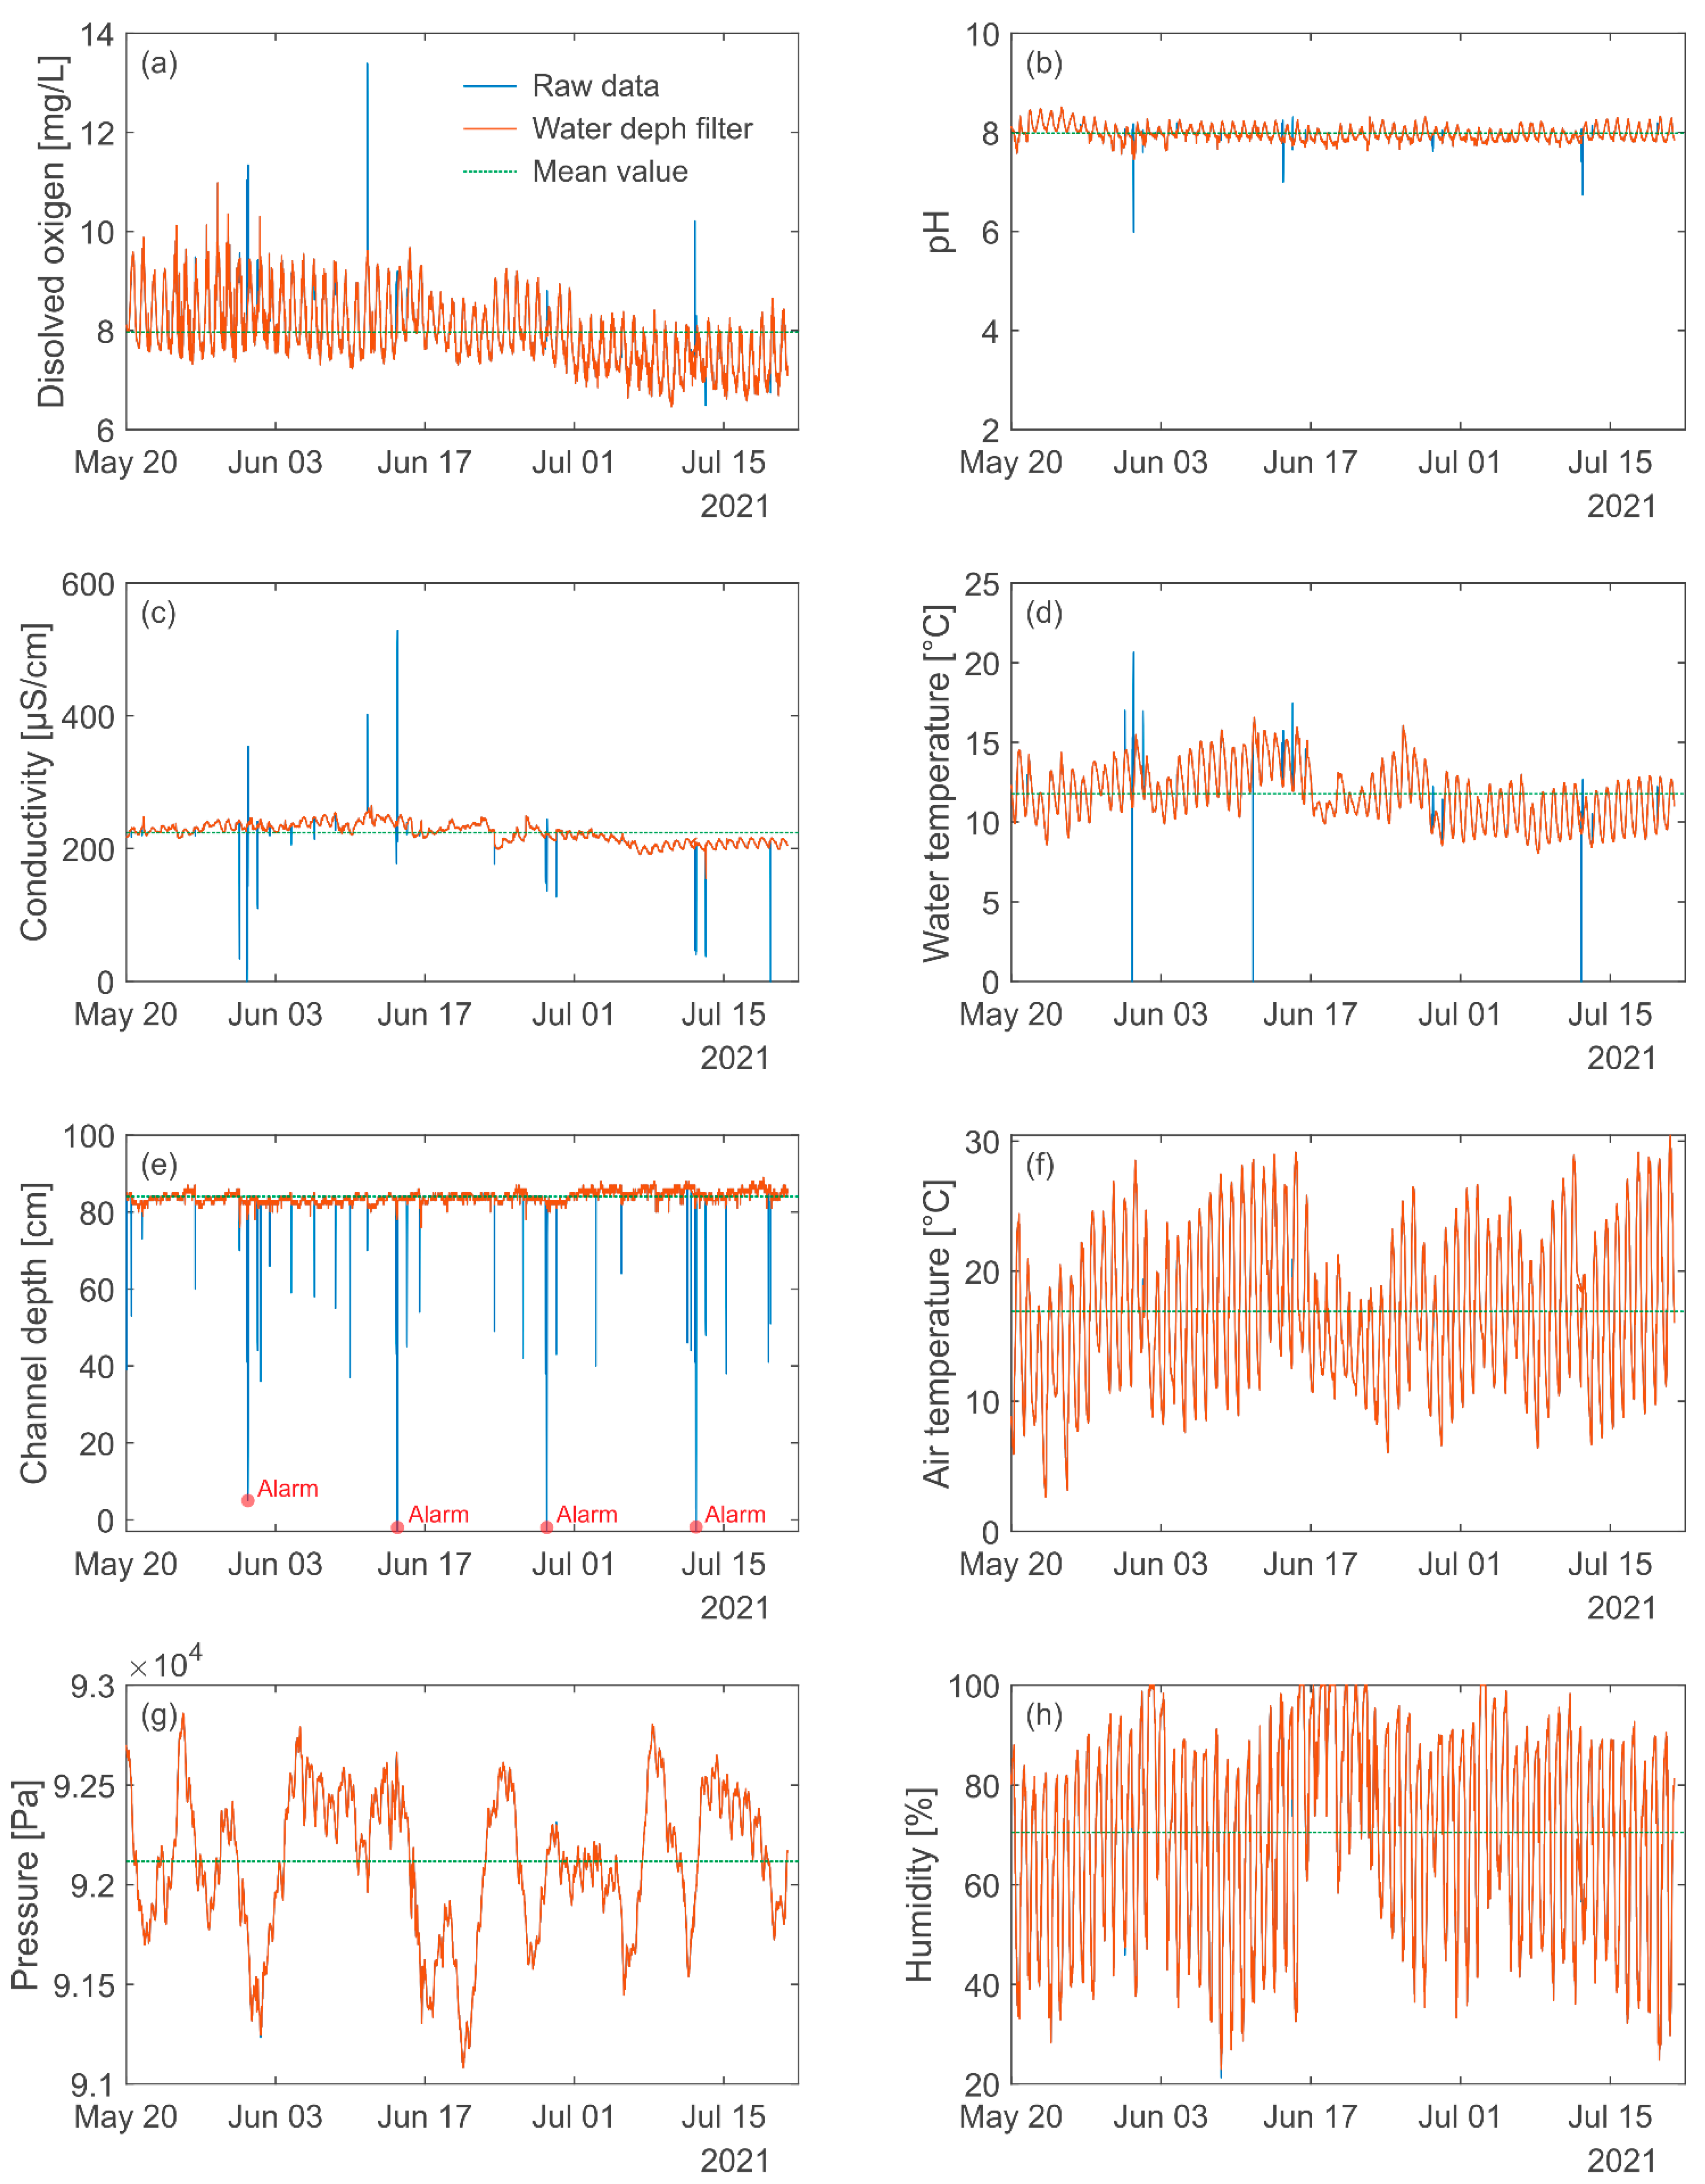
Since the installation, the network has been working correctly, although initially, in the alarm algorithm did not include the water depth as a parameter to be checked before triggering other alarms related to water quality parameters. It was assumed that the diversion channel was always filled. A severe decrease in water level exposes water quality sensors to air, triggering anomalous measurements, which could be outside the configured thresholds. This can be seen in the plot over time of different variables (
Figure 8), where anomalous peaks in water parameters can be observed when water depth decreases. Once the data is filtered considering those events (depth < 75 cm) peaks disappear and consequently all possible false alarms. Despite the possible testing in the laboratory, it is difficult to consider all the real-world conditioning factors. Thus, in most IoT projects, online adjustments in the initial working phase are required.
In a first view, the depth variations seem erratic. However, they agree with the managing routing of the diversion channel. Once every two weeks the channel is fully emptied, for cleaning and algae removal, and within the week, smaller emptyings are carried out for other maintenance purposes (e.g., pool entrance cleaning). As the water depth alarm is configured for full emptyings (depths < 30 cm (
Table 2)) those small deviations do not produce any alarm. Consequently, for the considered period only 4 depth alarms were triggered (
Figure 8e). As it was expected, air parameters were independent of these depth peaks, performing in accordance with the observed meteorological conditions and the daily cycles.
In addition, water quality parameters seem to have a slight downward trend, which may be explained by the beginning of the summer period. On the one hand, the environmental conditions (i.e., light, temperature) during summertime modify the biological activity in rivers [
25] and, on the other hand, during this season there are bottom outlet water releases in an upstream dam of the Porma River for crop field irrigation [
26], which may modify the physiochemical parameters of water. Special attention must be paid to these trends, as they could indicate the need for calibration. Water quality sensors are sensitive devices that require maintenance [
27], some will require cleaning (e.g., pH probe) and others replenish consumables (e.g., electrolyte solution in the dissolved oxygen probe). Thus, manufacturers recommend a calibration at least every year (the periodicity of maintenance and reporting for the project has been set every 6 months). Nevertheless, the pH sensor is usually the most sensitive one and no anomalous trends (just the natural daily cycles) have been observed yet for this variable. The familiarization with the seasonal cycles of monitored variables will give us the necessary clues to identify and classify different behaviors. As already stated, once more data of water quality and managing task procedure information are collected, a future objective of this project is to experiment on increasing functionalities, by trying to establish task alarms (including calibration) using the real-time collected data and machine learning (adding a trained model as a sequential module in the gateways script (
Figure 7)). Whichever the case, the observed values have been so far inside the optimum range for brown trout production [
28], and the network and the management platform are performing as expected.
The presented network has multiple differentiated characteristics when comparing to other developed networks (
Table 1) (e.g., extended online configurable parameters, three layers of storage, a Python configurable controller, hardware selection, etc.). However, many functionalities have not been implemented yet and could be important features for aquaculture facilities (such as the remote or autonomous control of actuator [
13,
14]).
In this sense, the selection of hardware components and software tools that was made allows the easy adaptation of the system or to incorporate new functionalities. For instance, the autonomous remote activation of different mechanical and electrical systems can be achieved by developing a node with an actuator (e.g., Arduino + Lora + actuator + power source) and inserting a new sequential module (to control the actuator according to collected variables) in main python script of the gateway (
Figure 7). The control software of the node will require the addition of alternative workflows for the command interpreter (
Figure 6). By doing so, the developed network could be turned into a SCADA system [
29]. In addition, the network also allows alternative or sequential communication options (e.g., MQTT) due to the available resources and libraries in Python.
The software and hardware design of the network has been driven by a modular principle to obtain a highly customizable network. For instance, we are successfully using a network with similar architecture to monitor consecutive water levels (five nodes) in a remote fishway without near power sources [
30]. This is achieved by powering the water-level nodes with a 6 V solar panel and the gateway by a 30 A regulator connected to a 12 V battery and a solar panel of 80 W. Thus the described modular architecture can be used as a backbone for other projects, not only increasing the number of nodes but also their nature, communication protocols, sensor suite, power source, algorithms or network architecture. Considering the correct performance of the online dashboard and its responsive behavior, a cheaper alternative design for the network could be the integration of the gateway into the node [
4,
13,
14]. That is to say, situating the Raspberry Pi board directly inside the node and connecting the node to the board via serial, generating an all-in-one system with a faster response time (current minimum response time is around 20 s) as the radio communication is much slower than serial. This would have reduced the material cost (screen, ABS box, or connectors) while maintaining functionalities, while possibly maintaining the coverage to connect with other future nodes. Nevertheless, material cost is not the main cost source when dealing with open technology, but the labor cost, which is contrary to close solutions but with the advantage of customizability. Only one of the selected references (
Table 1) defined its total material cost (250 USD [
4]); our material cost was greater (sensor suite cost ~1000 USD, IP65 certified boxes ~100 USD and other components ~350 USD) driven by the certified sensor suites, selected boxes and the additional functionalities (e.g., gateway, additional sensors, screen for data visualization, connectivity, etc.). Non-certified sensors or custom make sensors could be an interesting alternative to proof on concept validation but risky for real-world applications.
Regarding fault tolerance of the system, under a gateway failure, the node can continue collecting data and saving it to the SD card. Under a node failure, the gateway after a programmed time of attempts (default 2) will trigger a communication alarm during the data request (
Figure 6). Under a general failure, an independent listener, i.e., a single-board computer that checks autonomously every hour for the time-stamp of the last storage data on an online server, triggers an alarm when programmable time differences (default > 1 h) are detected. Likewise, it is still necessary to fully test the limits of the online dashboard, for instance, by doing flash crowd type traffic tests to check the maximum number of users for those installations with an openly accessible dashboard.
The presented network storages the information in three different layers: node, gateway, and online, which ensures that data are not lost. Considering this, it is possible to use it just as an autonomous water quality probe without the need for mobile connections (i.e., only the probe/node), allowing its application in multiple alternative study or pure monitoring cases. In this sense, the MS Quality or the network could be used for measuring water quality in wastewater releases to the river in remote areas (such as small populations that release wastewater without treatment but that generate an important impact in pristine environments [
31]), for discharge gauging (depth can be directed translated to discharge) and water quality management in hydraulic structures such as fishways [
32], or as a supplementary or complementary inexpensive device to work in synergy and to augment the national water quality networks (e.g., SAICA [
33]). That is to say, the here presented network is a cost-effective and tested customizable combination of technologies that could increase our ability for real-time management of our rivers, as well as, to ensure that water resources are used responsibly and optimally. In this sense, this work only shows the potential of the hardware platform developed and additional research works are required in order to demonstrate that this platform is able to handle advance algorithms for prediction or the management of aquaculture facilities.


