Article

Automated Memory Corruption Detection through Analysis of Static Variables and Dynamic Memory Usage

Department of Computer Science and Engineering, Ewha Womans University, Seoul 03760, Korea
*
Author to whom correspondence should be addressed.
Electronics 2021, 10(17), 2127; https://doi.org/10.3390/electronics10172127
Submission received: 21 May 2021 / Revised: 9 July 2021 / Accepted: 9 July 2021 / Published: 1 September 2021
(This article belongs to the Special Issue Software Verification and Validation for Embedded Systems—Volume 2)

Abstract

:
Various methods for memory fault detection have been developed through continuous study. However, many memory defects remain that are difficult to resolve. Memory corruption is one such defect, and can cause system crashes, making debugging important. However, the locations of the system crash and the actual source of the memory corruption often differ, which makes it difficult to solve these defects using the existing methods. In this paper, we propose a method that detects memory defects in which the location causing the defect is different from the actual location, providing useful information for debugging. This study presents a method for the real-time detection of memory defects in software based on data obtained through static and dynamic analysis. The data we used for memory defect analysis were (1) information of static global variables (data, address, size) derived through the analysis of executable binary files, and (2) dynamic memory usage information obtained by tracking memory-related functions that are called during the real-time execution of the process. We implemented the proposed method as a tool and applied it to applications running on the Linux. The results indicate the defect-detection efficacy of our tool for this application. Our method accurately detects defects with different cause and detected-fault locations, and also requires a very low overhead for fault detection.

1. Introduction

The data a process uses are stored in three types of memory space: stack, heap, and data. The stack is a memory area allocated or deallocated by the system, and its stores the local variables or parameters used by a function or within a block. The variables allocated to the stack are deallocated when a function call is completed, or when a function exits the block. The heap is the memory area to which dynamic memory is allocated or deallocated by the user (or developer). In this case, memory is allocated or deallocated via function calls, such as malloc()/free() in C/C++. The data area, similar to the stack area, is a memory area allocated or deallocated by the system. It stores global or static variables, which are allocated when a program starts and deallocated when the program terminates.
Memory corruption occurs when static or dynamic memory undergoes an unintentional change while the process is running [1]. Memory corruption can occur when said process attempts to use or release invalid memory, such as unallocated or uninitialized memory, or tries to access memory whose size exceeds the allocated amount. In addition to dynamic memory, memory corruption can occur because of static memory usage, as in the case of global and stack buffer overflows. Memory corruption can induce a program malfunction or system crash and therefore must be resolved. However, the resolution process is difficult for multiple reasons, detailed hereafter.
First, the location of the memory corruption source is often different from that of the actual failure. For example, if memory allocation fails, but the memory pointer is used without checking whether it is NULL, a crash occurs where the memory use function was called. In this case, the root cause of the crash is an allocation failure, but most memory defect-detection methods provide information only about the location where the crash occurred, so it is difficult to identify the cause of the defect.
Second, the causes and symptoms of memory corruption are nondeterministic. For example, memory allocation might fail because one of its parameters was incorrectly entered. However, memory allocation can also fail if an insufficient amount of memory is available in the system for allocation. Thus, it becomes difficult to determine the cause of the memory corruption given the nature of the process. Buffer overflow is another example in which nondeterministic symptoms arise post-memory corruption. If the overflowed memory area of a variable or pointer is a memory area that has previously been allocated to another variable, a crash does not occur. However, the program could still malfunction, either because the value that should be stored in the original memory area is limited, or because the value of the overflowed variable changes. Contrarily, if an overflow occurs in an unallocated memory area, a crash occurs. The problem is that one cannot determine whether the overflowed area has been allocated when a buffer overflow occurs. Therefore, different results can be generated when the same code is executed. Thus, because the causes or symptoms of memory corruption vary according to the system status, faults are not consistently reproduced, making these defects difficult to resolve.
Memory corruption can occur when either dynamic or static memory is used. A typical example is stack overflow, which occurs when memory is read or written in excess of the array size. Moreover, even if the memory is static, if the memory address is used as a memory pointer by prepending the address of the operator “&”, or if an array allocated as a global variable is used as a memory pointer, memory corruption can still occur in the same manner as in the case of dynamic memory. Therefore, an effective memory defect-detection method must cover both the static and dynamic memory areas in order to detect and resolve memory corruption.
Memory corruption-detection methods have been consistently studied for over 20 years. However, previous studies have not monitored the entire memory area of a process; thus, undetectable forms of memory corruption persist. Furthermore, even if defect-detection is performed across the entire memory area, memory corruption due to external factors, including external libraries employed by the process, cannot be detected [2]. Therefore, despite many years of research, memory corruption remains a challenging defect that requires resolution [3]. This is because the location of the memory corruption source is often different from that of the actual failure (result), creating difficulties in correlating the cause and effect of memory corruption. Moreover, the symptoms, such as memory corruption-induced crashes, are nondeterministic [4]; thus, it becomes difficult to reproduce them. This is another reason for the difficulty in overcoming memory corruption defects.
In our earlier study [5], static memory information (address and size) obtained via a pre-analysis of executable binary files and dynamic memory usage information obtained using the memory function hooking technique, were stored as information tags. In addition, the earlier method was capable of detecting memory corruption caused by static/dynamic memory usage before a system crash, using the information tag for real-time memory defect detection.
Our method exhibits high defect detection accuracy because it surveys both the dynamic and static memory usages to perform memory corruption detection, while having minimal overhead. Additionally, even if a system crash occurs, memory corruption can still be detected because the data required for defect-detection can be collected. Furthermore, information is provided for memory corruption debugging when the defect source and actual failure locations differ. We implemented the proposed method as a Linux-based automation tool, called a memory corruption detection tool (MCDT). Its remarkable performance has been demonstrated through an experiment, in which our method was compared with other well-known memory defect-detection tools.
This paper is organized as follows: Section 2 introduces existing studies related to memory corruption detection methods; Section 3 presents our proposed memory corruption detection method and the associated automation tool; Section 4 reports the validation experiment and results; finally, Section 5 presents the conclusion and future research.

2. Related Work

Many studies have been conducted to detect memory corruption. The existing studies can be classified as those that employ memory corruption detection using static analysis and those that employ dynamic memory corruption detection, which depends on whether the target program was executed.
Memory corruption detection that uses static analysis is performed by studying the source code or executable binary files. Previously, Xie et al. [4] proposed a memory corruption detection method in which the size of the variable or memory was determined through symbolic analysis, whereas Dor et al. [6] proposed a memory error detection method in which the pointer operation or string manipulation function was analyzed. However, the above-mentioned methods could not detect memory corruption in dynamic memory. Furthermore, because these methods were not executed in an actual runtime environment, the defect detection accuracy was significantly low.
The instrumentation technique has been used to detect dynamic memory corruption in many studies [7]. This adds a tracking code to the memory-related functions during compilation or at runtime, such that the information relevant to defect-detection can be collected when the memory-related function is called during execution. Their memory corruption detection accuracy was high because these studies were based on the actual execution of programs.
Tools including AddressSanitizer [2], Mudflap [8], and Frama-C/EACSL [9] use a method that employs a tracking code at the compilation time for memory defect-detection. The AddressSanitizer tool detects memory corruption by checking the validity of all the memory areas via shadow memory. This process memory usage increases with the shadow memory size, as the defect-detection covers all memory areas. However, the execution overhead will not be significant, because the algorithm for detecting the defects in the actual and shadow memories is optimized. Mudflap is a method for preventing defects, such as referencing a NULL pointer, buffer overflow, and memory leaks. It works by adding a protection code to the statements related to pointer usage in C/C++. The Frama-C/EACSL tool determines whether the source code satisfies the coding rules, and it can detect memory errors in the global variable, stack, and heap areas. However, Mudflap and the Frama-C/EACSL tool detect defects using the compile time instrumentation technique; therefore, one must recompile the program to add the code for defect-detection. Consequently, the executable binary file is changed and becomes different to the one that runs on the actual target. Furthermore, the binary footprint increases.
Purify [10], Memcheck [11], and the method of Vorobyov et al. [12] implement an executable tracking code for performing defect-detection during runtime. Purify can detect memory corruption in the dynamic memory, because the code that monitors memory validity is instrumented when the object code is created. However, the overhead here is significantly high because Purify monitors all memory access. Memcheck is an MCDT that runs in Valgrind, which is a virtual execution environment, rather than the actual execution environment. The process memory is managed via two stages of shadow memory and is used for memory corruption detection. Memcheck can detect memory corruption when accessing or deallocating uninitialized memory; however, similar to Purify, its execution overhead is high. Previously, Vorobyov et al. proposed a method that used shadow memory for the detection of transient memory errors. This method works by tracking the memory object and the pointer value while the program runs. However, this method only detects defects in dynamically allocated memory.
The shadow memory technique used by Memcheck, AddressSanitizer, Frama-C/EACSL, and Vorobyov et al. stores information from the memory areas used by a certain process in a separate area called shadow memory [12]. Whenever an operation, such as memory allocation, deallocation, or access, is performed, the related memory operation results are stored in the shadow memory and are used for memory defect-detection. Typically, the shadow memory stores information regarding the access validity and memory initialization, or the absence thereof. This information can be used to detect memory corruption, such as the accessing of invalid or uninitialized memory by the process. Such methods are advantageous because they can accurately evaluate the memory space’s status. However, the usage of shadow memory demands high additional memory, and suffers from significant performance overhead. Notably, the overhead corresponds to the location of the memory used by the process.
Our earlier study [5] involved a hybrid method that combines static analysis with dynamic defect-detection. The global variable and its size are assessed by analyzing the binary file of the memory defect-detection target. Then, the defects are detected via the dynamic monitoring of memory-related functions and the use of global variables. Since shadow memory stores only statically analyzed global variables and dynamically allocated and used memory, its memory overhead can be reduced compared to employing shadow memory for the entirety of the process’ memory.

3. Memory Corruption Detection

We propose a method of detecting memory corruption due to the usage of static/dynamic memory. The proposed method saves information regarding the usage of global and static variables stored in the data area and memory that is dynamically allocated to the heap area. The method then uses the saved information to perform real-time defect-detection.
As shown in Figure 1, our method analyzes the executable file (binary file) in the analysis process before detecting memory corruption, and stores the address and size of the static global variables in the information tag repository. Furthermore, while the target process of memory corruption detection is running, the execution of memory-related functions, such as malloc/memset/free, is monitored, dynamically updating the allocated/used/deallocated memory in the information tag repository, and memory corruption is detected through the information tag and execution log of memory-related functions.
In the case of local variables stored in the stack area, memory allocation and deallocation frequently occur and are managed by the system; thus, the memory usage information is not saved separately. However, the stack register can be used to check whether the memory being accessed or deallocated is in the stack area. Hence, the proposed method can be used to detect defects, such as access outside the stack area. As detailed in Table 1, we classified the memory defects into various categories based on the common weakness enumeration specification [13] and the existing memory defect classification [14]. The defects listed in Table 1 can cause memory corruption either directly or indirectly.
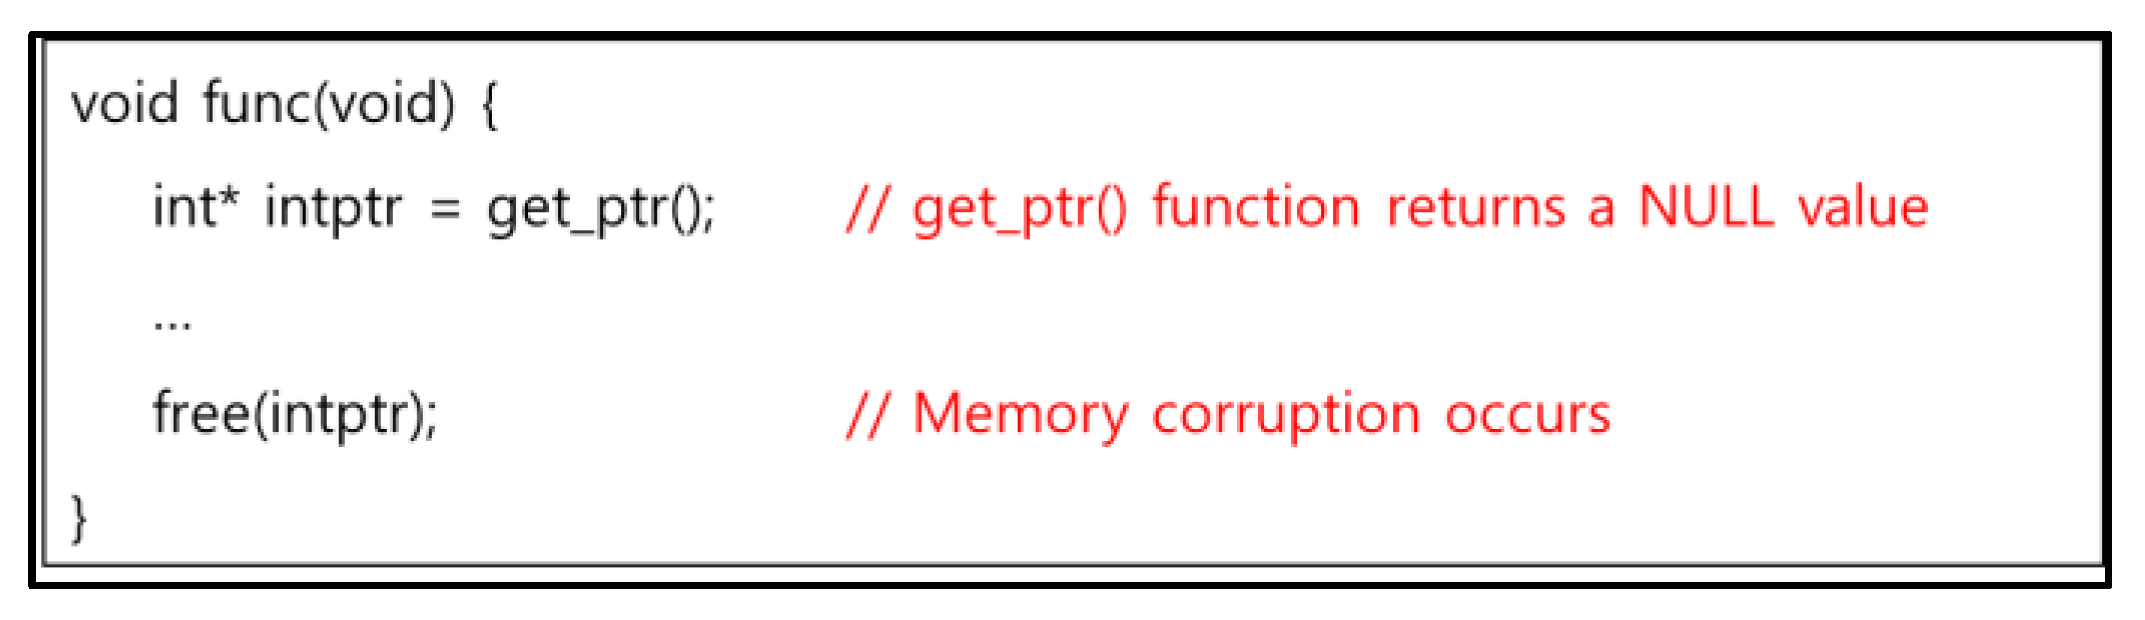
Although the result may vary depending on the C/C++ compiler type, the allocation of zero-size memory (M02) typically returns NULL, and the free() function does nothing when freeing a NULL pointer (M04). Conversely, these defects do not directly result in memory corruption. However, when NULL is returned because of an M02 defect, memory corruption can occur if the memory is accessed without checking whether the value is NULL. The location of the corruption is the function that accesses the memory. However, the memory corruption is caused by the memory-allocation function being called using a zero-size parameter. Hence, M02 is categorized as a defect.
Moreover, M04 is neither a defect nor the cause of a defect if the compiler adheres to the C language standard. However, if the compiler fails to adhere to the standard, memory corruption can occur depending on how the free() function has been implemented; hence, this case is categorized as a defect. Furthermore, in the case of dynamically allocated memory, the performance of the deallocation operation could result in memory corruption even if the compiler adheres to the standard, as one cannot determine whether the memory has a NULL value. For example, in the case of Linux GNU compiler collection (GCC), the free(NULL) statement is not included in the executable binary file. Thus, the statement does nothing. However, if the free() function does not know whether the value it is deallocating is NULL, as depicted in Figure 2, the deallocation operation is included in the executable binary file and results in memory corruption.
In this study, information tags, which represent a type of shadow memory, are used to collect information to detect memory defects. While a process is running, the information tags of the memory accessed upon calling memory-related functions are used in real-time memory defect-detection. Therefore, memory corruption detection becomes possible in cases of both static and dynamic memory.

3.1. Information Tagging

To detect memory defects in real time, information that can be used to determine the validity of the memory to be used must be available. Therefore, the shadow memory technique is used. The “information tag” data structure, which is depicted in Figure 3, is stored in the shadow memory. Information, including the memory address, allocation size, static/dynamic allocation flag, allocation function type, and deallocation flag, is saved in the information tags for real-time defect-detection. Furthermore, information regarding the function called to allocate or deallocate memory is stored in the information tags to analyze the cases in which the location of the defect is different from that of the actual defect.
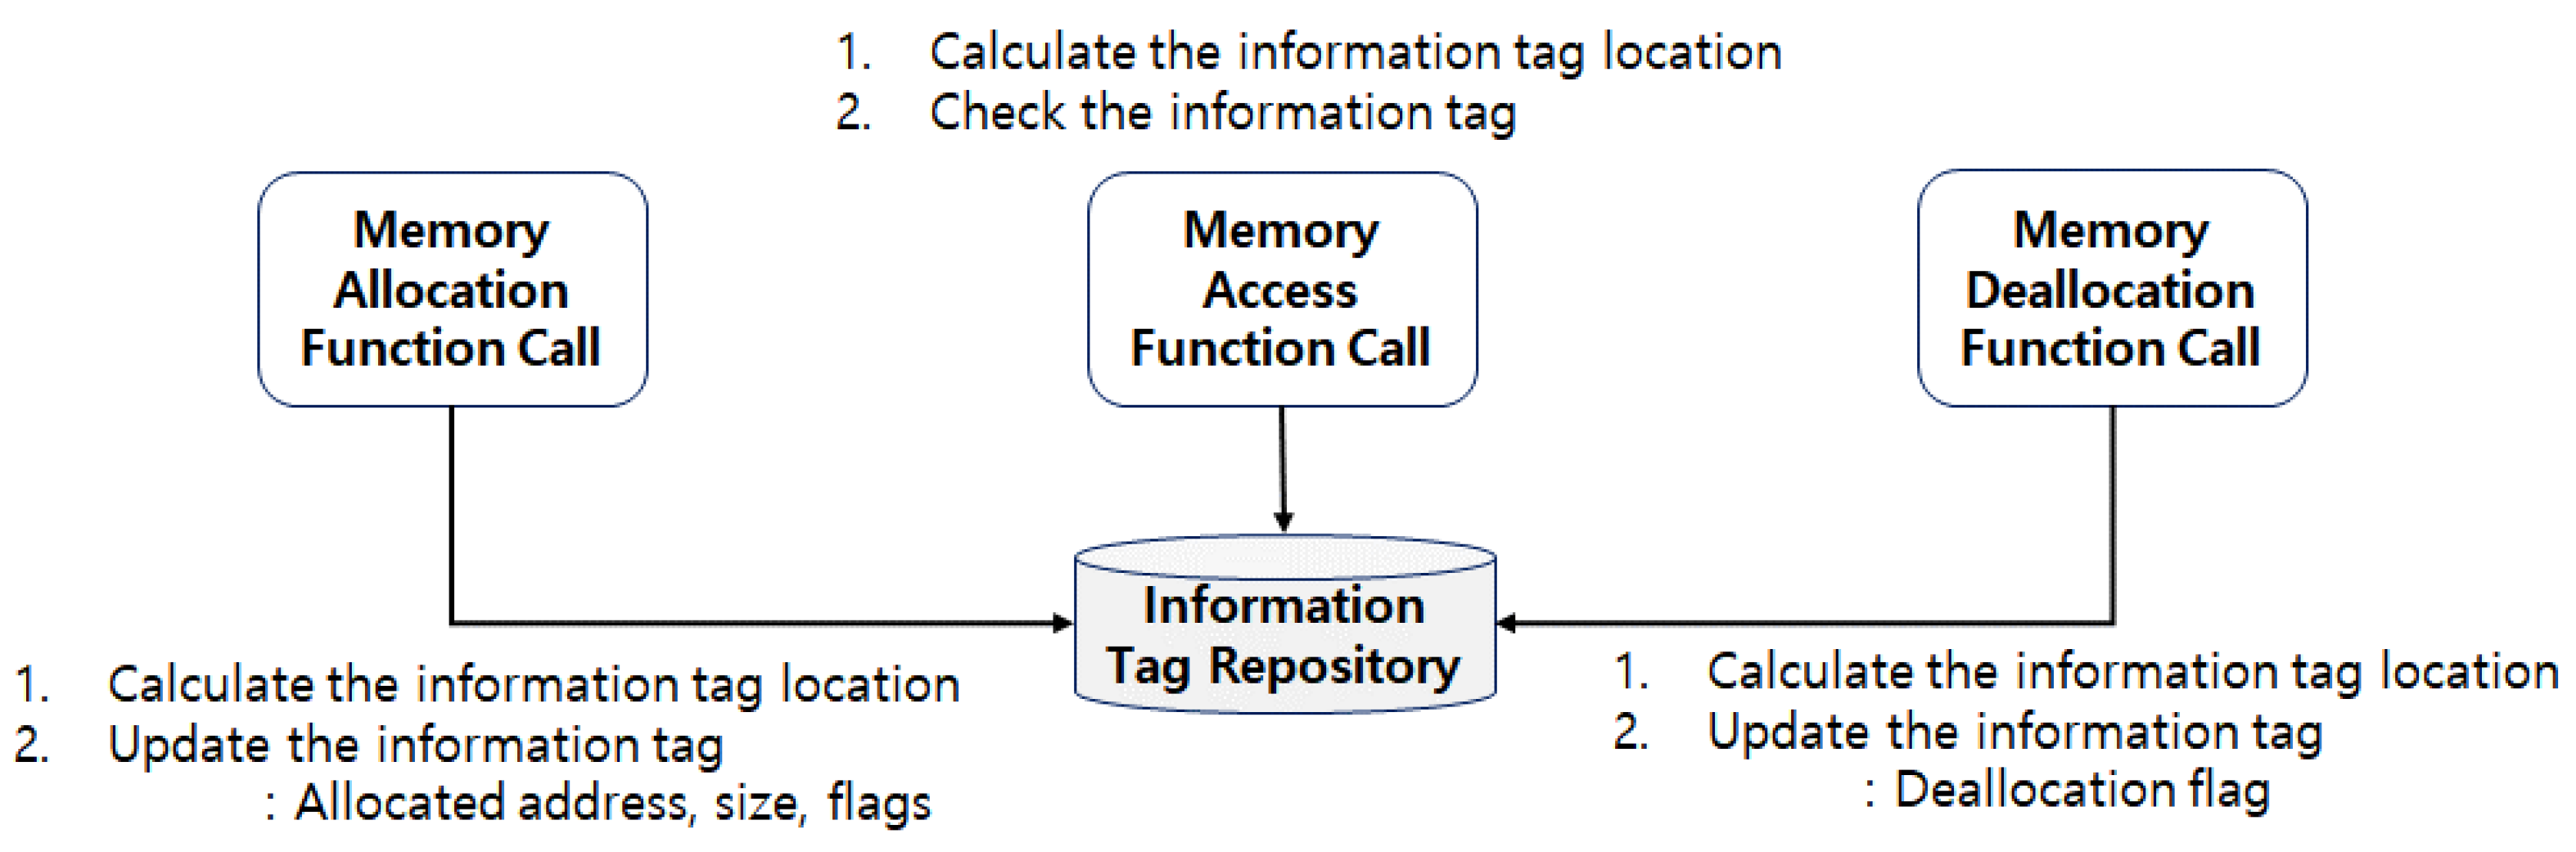
Once a function that dynamically allocates memory (memory allocation function) is called, the location to be stored in the information tag repository is computed based on the address of the allocated memory, as shown in Figure 4. Subsequently, the memory address allocated to the information tag location, the allocated size, the allocation function type, and the address that called the memory allocation function are stored. When the memory access function is called, the information tag location is computed using the address of the accessed memory, and the value of the information tag at the location is checked. If the information tag is not stored at the applicable location, it is possible to determine whether it is a case of random access to the dynamically allocated memory or of incorrect address access, by using the address and size of the adjacent information tag. When the memory deallocation function is called, the deallocation flag of the information tag of the memory address is set. Thereafter, the deallocation flag can be used to check whether the memory being accessed is deallocated memory.
To reduce the memory overhead due to the shadow memory, the entire virtual memory space of the process is not saved. Instead, only the static and global variables that were analyzed using the executable binary file and dynamically allocated information on the heap memory area are managed as information tags.
To further reduce the performance overhead, the following operation formula is used to map the information tags that correspond to the memory for performing detection:
S h a d o w M e m o r y A d d r e s s                             = ( N u m b e r O f G l o b a l V a r i a b l e s A n d S t a t i c V a r i a b l e s )                         + ( T a r g e t A d d r e s s H e a p S t a r t A d d r e s s )
The performance overhead is minimized by exploring the locations of the information tags of the current memory using only operations that use the number of static and global variables and the initial heap-memory address.

3.2. Real-Time Memory Defect-Detection

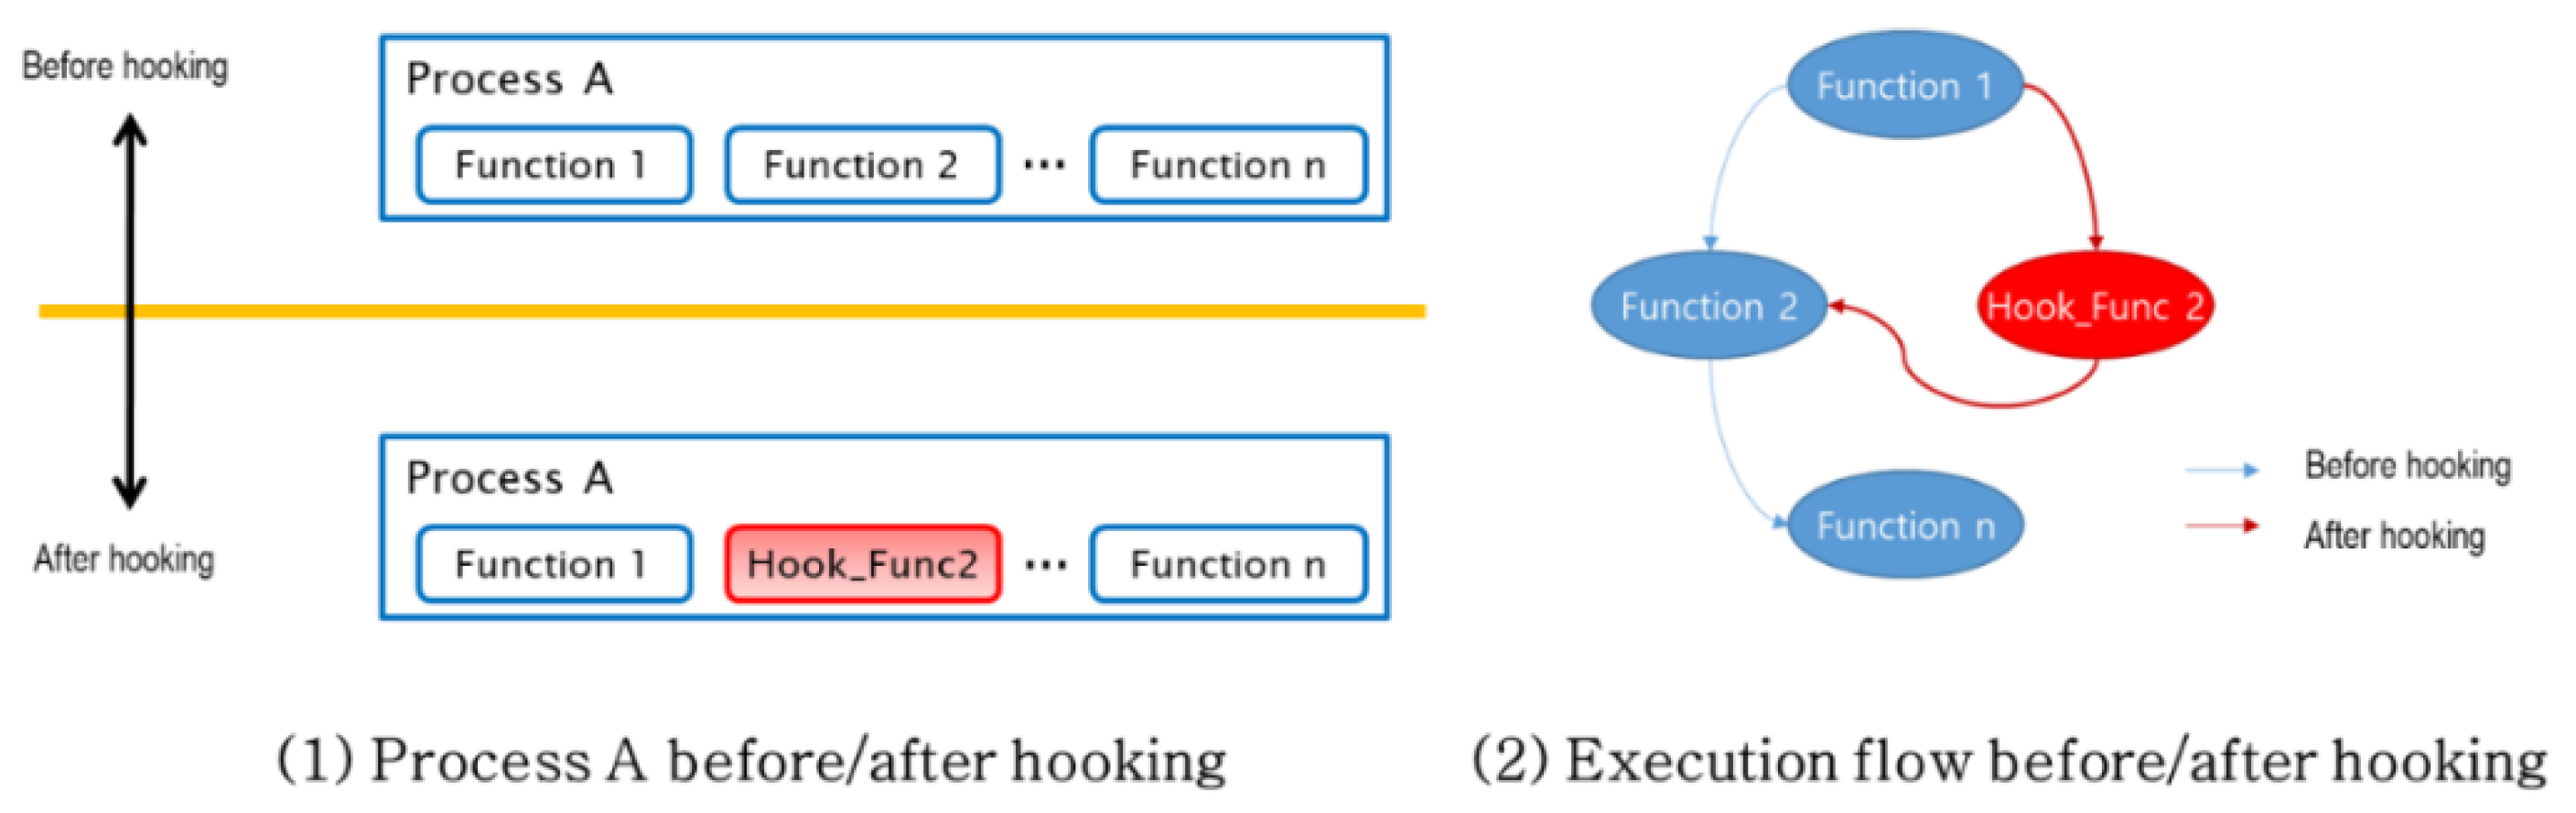
To monitor the memory usage of a process, the hooking of memory-related functions is used. As illustrated in Figure 5, hooking is a technique that intercepts the execution path during runtime, and it is useful for monitoring memory-related operations [15].
Once a memory-related function has been hooked, the hooked function is called each time a memory-related function is called. For example, after hooking Function 2, Hook_Func2 is run each time Function 2 is called. The hooked function uses information tags to detect defects in real time.
When allocating memory dynamically, the validity of the parameter of the memory allocation function is first verified, as depicted in Figure 6. If the parameter is valid, the original memory allocation function is called. Subsequently, the validity of the result is verified. The execution result of the memory allocation function is the memory address that it has been allocated. If this memory address value is valid, then the address and size of the allocated memory, the dynamic allocation flag, the allocation function type, and the address of the function called for memory allocation are saved in the information tag.
When deallocating memory, the address of the target memory is first compared with the stack-top address to determine whether the memory being accessed lies in the stack area. To reduce the overhead, either a local variable or a parameter stored in the stack area is saved as an information tag. Hence, the memory address can be compared with the stack-top address, instead of performing a validity check. If the accessed memory is not a part of the stack area, then the parameter value of the memory allocation function is verified first, as depicted in Figure 7. If the parameter value is valid, then the information tags are used to determine whether the parameter is a static variable. If the parameter is not a static variable and is the address of dynamically allocated memory, it is then determined whether the allocation and deallocation function pair matches either malloc()/free() or new()/delete(). If a match is found, the original memory deallocation function is called, and the released memory is updated in the information tag.
When accessing memory, similarly to the case of deallocating memory, the target memory address must be checked to verify whether it is part of the stack area. Subsequently, the process in Figure 8 is followed to determine whether a defect exists, and if it does, to identify the defect type. After verifying the validity of the parameter of the memory access function, the information tag of the target memory address is explored to determine whether this memory is accessible. If the middle part of the memory block is accessed, such as addr + n, then the address and size of the nearest information tag are used to verify the validity of the memory address. Even if the address can be accessed, if the access memory exceeds the limited size, this is considered an access defect that has deviated from the approved range.
To explain this concept using a specific example, Figure 9 presents a case in which a pointer, bufP, that was dynamically allocated via the malloc() function should have been released before the function exited. However, a global variable buf was incorrectly entered in the free() function. Assuming that the information about buf was previously saved in the information tag via binary analysis (the address is 0 × 00010070, and the size is 0 × 64), the real-time defect detection process verifies whether a defect exists by following the process depicted in Figure 6 when malloc() is first called. Line 4 in Figure 9 shows no problem is encountered with the parameter value of the memory allocation. Therefore, the original malloc() function is called. If the result is not a NULL value, the data are saved in the information tags, as listed in Table 2.
When the free() function is called on line 6, the target memory address for deallocation is returned as 0 × 10070, which is the address of buf. By exploring the information tags, the existence of a returned value is first verified. The allocation flag is checked because the address of buf was previously in the information tags. The value of the allocation flag for 0 × 10070 is 0 × 1, representing static allocation. Therefore, the defect in this case is determined to be the freeing of unallocated memory (M06).

3.3. Signal Hooking

Memory defects, including accessing unallocated memory (M10) or freeing previously deallocated memory (M05), result in a system crash. The information required to investigate defects, such as defect types, defect locations, function parameters, return values, and call stacks, may be lost if no action is performed at the time of the crash. Furthermore, when the location of the crash is different from that of the cause of the defect, the function–call relationship must be analyzed via the location of the crash and the previously collected defect information concerning the address of the accessed memory. Hence, the system status and call stack at the time of the crash must be collected. To detect defects without losing information when a system crashes, a signal handler, which is raised during the crash, is hooked.
When a system crashes, most operating systems create a signal linked to the cause, and the corresponding signal handler then executes the operation from the point at which the signal originated. Therefore, when the signal handler is hooked, the defect detection information is collected from the hooked signal handler; thus, the information is not lost. In the Linux system, the signals related to memory defects include SIGABRT, SIGBUS and SIGSEGV, as listed in Table 3.

3.4. Automated Tool

We implemented the proposed method as an MCDT that runs on an ARM-based Linux system. Currently, the MCDT is implemented on Linux kernel (v.4.14.37) and has been developed to run on ARM-based systems.
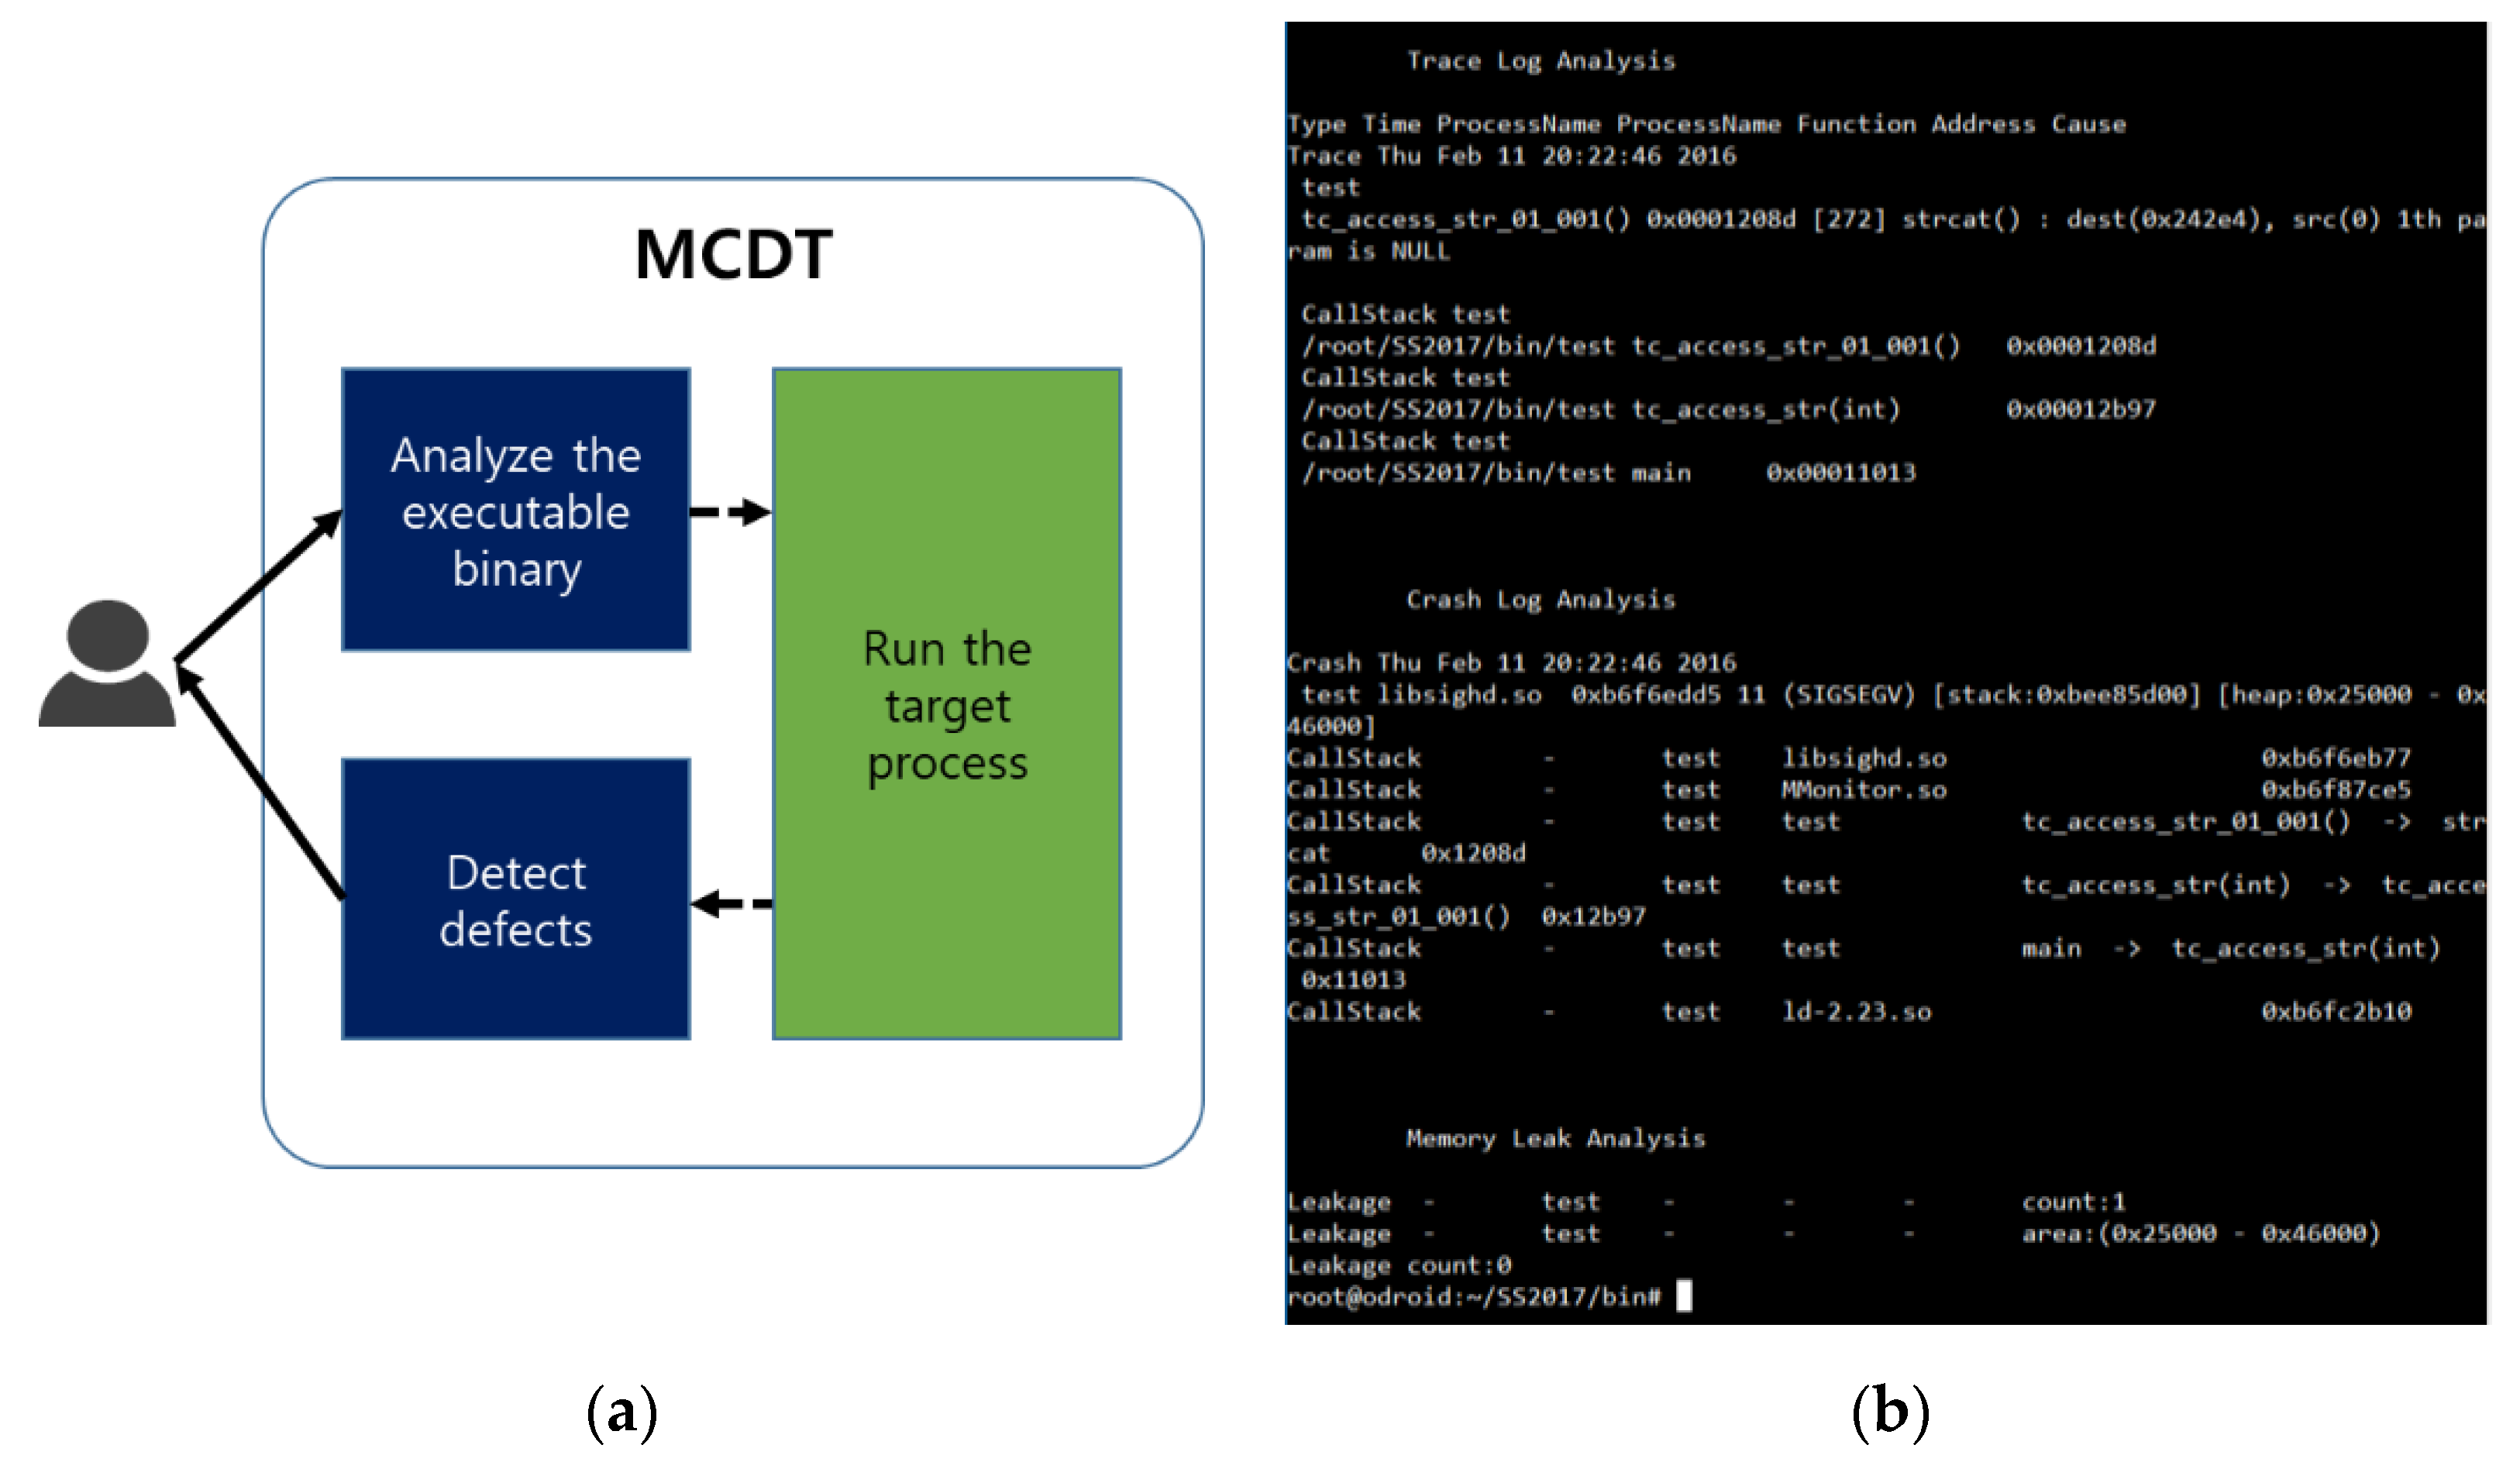
When a user inputs an executable file, the executable binary file is automatically analyzed, and the executable file is run along with the automation tool (Figure 10a). While the tool is running, it detects memory defects in real time and collects information. When the tool ends its operation (either normally or abnormally), it analyzes and reports the detected defects (Figure 10b).
In Figure 10b, the defect detected by the automation tool is an access defect of the deallocated memory. The tool not only detects this defect, but shows information on the process, the thread, and the function that accessed the deallocated memory, thereby providing information useful to the resolution of the defect.
As shown in Figure 11, the automation tool comprises four modules that are loaded into the Linux system. The role of each module is listed below.
  • The executable binary analysis module extracts static and global variables, which are stored in information tags, from the executable binary file, as mentioned in Section 3.1.
  • The defect detection module, using information tagging, detects defects using information tags each time a memory-related function is called by hooking memory-related functions, as mentioned in Section 3.2.
  • The crash monitoring module uses the signal-hooking technique (see Section 3.3) to hook signal handlers and collect defect detection information without losing data, even if the system crashes.
  • The result output module generates the results of the defects detected in real time after the target defect detection process has been completed.

4. Analysis

In this section, we analyze the effectiveness of our proposed method by experimentally comparing it with other methods.

4.1. Experiment Definition

4.1.1. Research Questions

The following research questions were employed to analyze the effectiveness of our proposed method.
RQ1. How effective is the proposed method in detecting memory corruption?
The proposed method detects memory defects that can result in memory corruption. We measure the effectiveness of memory detection methods using memory defect-detection accuracy. Our method’s effectiveness in detecting memory corruption is compared with that of other memory defect-detection tools. To that end, we employ applications with and without defects. For applications without defects, the experiment is conducted after adding defects to them that can induce memory corruption.
RQ2. Does the proposed method provide information regarding the cause of memory corruption defects where the location causing the fault differs from the location where the fault occurs?
Various memory defects can crash a system. Among these, the defects wherein the location of the crash is different from that of its cause are especially difficult to resolve. However, our proposed method can determine the cause of the defect even for these cases using real-time defect-detection. To demonstrate this capability, we analyze cases in which the location where the crash occurred differs from the location of the cause of the fault.
RQ3. How much overhead does the proposed method generate on the system?
Our method collects information for detecting faults during runtime. Hence, the runtime overhead of the proposed method needs to be considered. This research question examines the impact on the system of the memory and runtime overhead caused by the defect-detection module that uses information tagging.

4.1.2. Experimental Environment

The MCDT, as described in Section 3.4, was used for the experiment. The target test board for the MCDT was Odroid-XU4 [16], which is an ARM-based embedded board equipped with Ubuntu Linux kernel version 4.14.37. To analyze the effectiveness of the MCDT, we selected applications with and without defects, and experimented on each application. For the applications without any defects, memory defects were artificially included.
The ITC benchmark [17] is a defect detection benchmark program based on defects found in actual automotive software. Only 309 of its various memory-related defects were used in this experiment, as listed in Table 4. The memory defects in the ITC benchmark are grouped into 10 categories. Notably, these categories do not include the zero-size memory allocation defect (M02) or the memory allocation/deallocation mismatch defect (M07), the latter of which is a memory deallocation defect. The nonmemory defects in the ITC benchmark are either concurrency defects or defects caused by typecasting. These were excluded from the experiment because they are unrelated to memory.
To test all the types of memory defect defined in Table 1, the MiBench benchmark [18] was selected for the experiment. MiBench is a benchmark program for embedded systems, comprising 32 applications under six categories: automotive, consumer, office, network, security, and telecommunication. The MiBench applications we used for the experiment are listed in Table 4, excluding four applications that could not be ported to the ARM-based embedded board—the environment of the experiment—and thus could not be used in the experiment, as well as an application that did not use functions related to memory defects. The input datasets used in the experiment were the large input datasets from the two available input datasets (large and small) included in the benchmark.

4.1.3. Memory Corruption Detection Tools Used for Comparison

The tools used for comparison are listed in Table 5. Our proposed method is a dynamic memory corruption detection method. To conduct an objective comparative analysis of the effectiveness of the proposed method, we experimentally compared it with other memory defect detection tools: AddressSanitizer, Frama-C/EACSL, and Memcheck. These tools use shadow memory to detect defects. Particularly, AddressSanitizer and Frama-C/EACSL manage both stack and heap spaces by using shadow memory and are therefore appropriate for comparison with the proposed method in terms of effectiveness. Additionally, for cases in which the system crashed or aborted because of memory corruption, experiments were conducted to compare the proposed method with the basic memory dump mechanism, core dump.
In AddressSanitizer, the “-fsanitize=address” option is added when the target program for the experiment is compiled using GCC (Ubuntu/Linaro 7.3.0–16 ubuntu3) 7.3.0. When the built image is run, the AddressSanitizer tool is applied to the program. Frama-C/EACSL uses the plug-in E-ACSL included in Frama-C v20.0. Memcheck uses the tools included in Valgrind 3.13.0. In the case of core dump, a memory dump is collected after configuring the maximum size of the core file to be unlimited.

4.2. Experiment Design

Since the ITC benchmark previously contained defects, it was used for the experiment as is. However, defects were artificially added to MiBench. The tools for comparison and the proposed method were applied to the benchmark program. Then, the results were analyzed.

4.2.1. Defect Design

We analyzed the effectiveness of the tools using the ITC benchmark and MiBench. Since the former is used to detect static memory defects, it is not appropriate for dynamic memory defect-detection. Therefore, to objectively analyze the effectiveness of tools related to dynamic memory defect-detection, a memory mutation technique was applied to add defects to the latter. Said memory mutation operators were derived using the methods of Wu et al. [19] and Shahriar et al. [20], and are shown in Table 6. Additionally, common weakness enumeration was applied. The mutation operators for memory allocation and deallocation were derived from the work by Wu et al., and those for memory access were derived from Shahriar et al.
In the case of the MAL_001 operator, the memory function call is replaced with −1; it is therefore not appropriate for use in detecting memory defects in real time via function hooking. However, because accessing or deallocating the corresponding memory address can result in a crash, this operator was included in the list of mutation operators. Among the memory access mutation operators, that which injects the defect of accessing memory outside the allocated area (M11) and that which injects the defect of collision with the memory space of another variable (M12) are the same. Whether a collision occurred at the time of defect injection cannot be determined in the case of dynamic memory allocation, because the memory is allocated either continuously or discontinuously, depending on the system.
Of the 18 mutation operators, those that can be applied to memory-related function calls were used to create the mutants of MiBench. One mutation operator was applied at a time. After applying the mutation operators to the target programs of the experiment, 1189 mutants were created (Table 7). However, 206 mutants could not be compiled; hence, they were excluded from the experiment. Additionally, 199 mutants corresponded to dead code not used by the application and were also excluded. Furthermore, equivalent mutants were not created. Consequently, 784 mutants were used in the experiment.

4.2.2. Experimental Measurements

The effectiveness of the defect detection method presented in RQ1 was measured using the defect-detection rate and defect-cause accuracy. The defect-detection rate is provided by the benchmark program. Alternatively, it can be calculated by the ratio of defects detected by each tool to the total number of defects that were artificially included. The defect-cause accuracy confirms whether the causes cited by each tool match the actual causes of the defects.
D e f e c t D e t e c t i o n   R a t e = N u m b e r O f D e f e c t D e t e c t e d T o t a l N u m b e r O f I n j e c t e d M e m o r y D e f e c t s × 100
D e f e c t C a u s e   A c c u r a c y = N u m b e r O f D e f e c t s T h a t C o m p l e t e l y M a t c h T h e A c t u a l D e f e c t s N u m b e r O f D e f e c t s D e t e c t e d × 100
Regarding RQ2, which addresses whether the cause of the defect was accurately provided, the defect-detection rate and defect-cause accuracy of each tool were assessed for cases in which a crash occurred.

4.3. Results

4.3.1. RQ1: How Effective Is the Proposed Method in Detecting Memory Corruption?

Figure 12a illustrates the defect-detection rate of each tool and the number of defects detected by each tool, for the ITC benchmark and MiBench applications, respectively. The MCDT identified 768 out of the 1093 defects and achieved a 70.27% defect-detection rate. AddressSanitizer and Memcheck exhibited defect-detection rates of 58.19% and 56.45%, respectively. The MCDT achieved a higher defect-detection rate than these tools. In the case of Frama-C/EACSL, 778 defects were detected, demonstrating a 71.18% defect-detection rate. However, the ITC benchmark, which was the target of the defect-detection, contained static memory defects, and Frama-C/EACSL also contained static memory defects. Thus, many defects in the ITC benchmark were detected. In the case of MiBench, Frama-C/EACSL achieved the same defect-detection results as AddressSanitizer. Memcheck and AddressSanitizer detected defects when a dynamic memory function was called. However, the ITC benchmark contained many static memory defects, such as allowing index access that exceeded the size of the buffer without calling the dynamic memory function. Therefore, the defect-detection rates of tools other than Frama-C/EACSL were for the ITC benchmark. The MCDT uses static variables to determine a defect; however, the defect–decision process is not executed if a dynamic memory function is not called.
In Figure 13a, the number of detected defects shown in Figure 12a is subdivided by the number of defects detected per memory defect type. The values inside the parentheses beneath each memory defect on the x-axis represent the total number of defects used in the experiment. The label on each bar of the graph indicates the number of defects detected using the tool. Excluding memory-leak (M03) defects, the MCDT detected the highest number of defects.
In particular, MCDT detected more defects related to memory access than other tools. For example, in the case of the out-of-bounds (collision) (M11) defect type, 14 to 16 more defects were detected by MCDT than any other tools, except Frama-C/EACSL. AddressSanitizer determined that if dynamic memory was allocated contiguously, the memory area accessed was valid, even if one variable accessed the memory space of another variable. Therefore, it failed to detect the defects. Memcheck contains information regarding the size of the dynamically allocated memory. However, if the middle part (addr1 + n) of a certain memory block is accessed first, as in memcpy (addr1 + n, addr2), the defect cannot be detected even if an overflow occurs, because the memory size of addr2 is greater than that of addr1 + n. However, in the case of the MCDT, the starting address and size of the memory can be obtained using the information tags, even if the middle part of the memory block is accessed first. Hence, the MCDT can determine whether the memory area outside the allocated range is being accessed.
As regards out-of-bounds (Collision O) defects (M11), most of the defects Frama-C/EACSL detected were added when accessing the buffer using local variables in the ITC benchmark. Thus, they were only detected in the case of the static defect-detection tool Frama-C/EACSL. Since other tools, including the MCDT, dynamically detect defects, their defect-detection rates were low.
As regards out-of-bounds (Collision X) (M12) defects, both the MCDT and AddressSanitizer detected the same number of defects. Memcheck, however, detected only 19 defects, which is only approximately 30% of the amount detected by the other tools. This could be because the MCDT can detect defects in the dynamically allocated memory and the memory space in which static variables are stored.
As regards memory-leak (M03) defects, the MCDT detected 18, while Memcheck detected 25 defects. The MCDT detected fewer defects than Memcheck because the former did not detect those that were added in the lame application of MiBench. Here, a memory leak occurred in the library used by the lame application, although the application itself did not have memory leaks. Moreover, the MCDT manages dynamically allocated memory information using information tags. However, here, the MCDT was designed to only use information tags to manage dynamic memory when memory-related functions were called within the application, as mentioned in Section 4.1.2. Therefore, the dynamic memory allocation/deallocation as determined by the library, which was used by the lame application, was not monitored; thus, the related defects could not be detected.
Figure 12b depicts the defect-cause accuracy of each tool. As depicted in Figure 12a, the MCDT accurately cited causes for 610 of the 768 defects it detected, and its defect-cause accuracy was 79.43%, which is higher than that of the other two tools. Although Frama-C/EACSL detected 778 defects, it only provided the exact causes of 494. AddressSanitizer and Memcheck provided accurate causes for 325 and 485 defects, respectively. The defect-cause accuracy percentages of Frama-C/EACSL, AddressSanitizer, and Memcheck were 63.5%, 51.10% and 78.61%, respectively.
Figure 13b illustrates the number of defects for which the cause was accurately determined. Compared to the other tools, the MCDT provided accurate causes for more defects in all the categories of memory defects, except for the following two: accessing unallocated memory (M10) and out-of-bounds (Collision X) (M12). In particular, the defect-cause accuracy of the MCDT was high for defects such as memory allocation failure (M01), wherein the location of the memory corruption is different from that of the actual cause. If the memory allocation function fails to allocate memory and returns a NULL value, this does not directly corrupt the memory. However, if an attempt to access the memory is prevented due to failure, then the memory becomes corrupted. When this type of memory corruption occurred, the two tools detected its location, whereas the MCDT identified that the memory allocation function call had failed even before the memory was corrupted. Thus, the cause of the defect could be accurately analyzed using the MCDT.
As regards the accessing unallocated memory (M10) and out-of-bounds (Collision X) (M12) defects, the MCDT provided fewer accurate causes compared to AddressSanitizer. This is because AddressSanitizer checks the validity of the memory addresses across the entire memory space, whereas the MCDT only performs a validity check on the dynamically allocated heap space and the memory space for static variables.

4.3.2. RQ2: Does the Proposed Method Provide Information Regarding the Cause of Memory Corruption Defects when the Location That Causes the Fault Is Different from the Location at which the Fault Occurs?

The memory corruption faults that we aim to detect are highly likely to cause system crashes. Additionally, the defect-detection rate and defect-cause accuracy had to be compared because the probability of a crash occurring at a different location from that of the cause of the defect is high. Frama-C/EACSL was excluded from the analysis of RQ2 because is a static memory defect-detection tool.
Figure 14a compares the defect-detection rate of each tool for defects that caused a crash. Of the 468 total crash defects, the MCDT detected 461, with a 98.5% defect-detection rate. AddressSanitizer, Memcheck, and Coredump detected 428, 444, and 441 defects, with defect-detection rates of 91.45%, 94.87%, and 94.23%, respectively. Figure 15a depicts the number of defects detected for each memory defect category.
Figure 14b displays the defect-cause accuracy of each tool. Figure 14a shows that the MCDT provided accurate causes for 420 out of the 461 detected defects, and its defect-cause accuracy was 91.11%. AddressSanitizer, Memcheck, and Coredump provided accurate causes for 187, 384, and 337 defects, with defect-cause accuracies of 43.69%, 86.49%, and 76.42%, respectively. Among the three tools, the MCDT provided accurate causes for the most defects. Figure 15b indicates that the MCDT accurately determined the causes of either the same number of defects or more, compared to the other tools, for each memory defect category. Contrary to the results of RQ1, the defect-detection rate and defect-cause accuracy of the MCDT were higher than those of the other tools. Since the other tools only collect information when a crash defect is detected, the causes they provide are less accurate than those provided by the proposed method.

4.3.3. RQ3: How Much Overhead Does the Proposed Method Generate on the System?

The MCDT collects information for defect-detection during runtime. However, if a significant proportion of resources, such as the central processing unit (CPU) and memory, are occupied by the defect-detection tool, such as in the MCDT, the program may run slowly, or the memory may become insufficient. Therefore, one must measure the effect on the system by measuring the runtime overhead of the proposed method (i.e., the memory and runtime overhead caused by the real-time fault-detection module with information tagging). We experimentally compared the MCDT with AddressSanitizer, Frama-C/EACSL and Memcheck in terms of memory overhead and overhead while monitoring performance by applying a dataset to the MiBench benchmark program.
To analyze the performance overhead, we measured the performance-delay rate of the system, the memory overhead, and the rate of increase in the code size:
P e r f o r m a n c e D e l a y   R a t e = P r o g r a m R u n T i m e W h e n T o o l s H a v e B e e n A p p l i e d P r o g r a m R u n T i m e P r o g r a m R u n T i m e × 100
M e m o r y   O v e r h e a d = H e a p U s a g e W h e n T o o l s H a v e B e e n A p p l i e d H e a p U s a g e W i t h o u t T o o l s H e a p U s a g e W i t h o u t T o o l s
R a t e   o f   I n c r e a s e   i n   C o d e   S i z e = P r o g r a m C o d e S i z e W h e n T o o l s H a v e B e e n A p p l i e d P r o g r a m C o d e S i z e P r o g r a m C o d e S i z e
Table 8 summarizes the test environment and performance overhead of each tool assessed in this experiment. Regarding the performance-delay rate, in the case of Memcheck, a separate Valgrind virtual machine must be running. Hence, Memcheck is a heavyweight method with a significant performance overhead. AddressSanitizer had a monitoring performance overhead of 26.7%, while that of the MCDT was 6.67%.
Regarding memory overhead, because the three tools, except the MCDT, use shadow memory as the overall memory of a program, the memory overhead incurred during the operation increased from 2.48 to 5.95 times the original overhead. In the case of the MCDT, the amount of memory used for static variables is calculated through binary analysis, and the shadow memory is used only for the heap area of dynamic memory; therefore, its memory overhead increase is approximately 2.1 times the original overhead. Frama-C/EACSL and AddressSanitizer express memory allocation/deallocation, heap, stack, etc., as a flag to optimize the usage of shadow memory. Despite the additional storage, the MCDT had the lowest memory overhead.
Regarding the rate of increase in code size, because AddressSanitizer operates by changing the executable binary file to detect defects, the size of the executable binary file increases by 215.74 times its original size. Similarly, in Memcheck, the defect-detection code is implemented, and the size of the executable binary file increases 12.7-fold. However, our method adds a defect-detection agent of only approximately 86 kB to the file size, without modifying the executable binary file. Since the proposed method does not increase the size of the executable binary file, it is very lightweight. In the case of Frama-C/EACSL, the code size is not changed because it is a static analysis tool.

4.3.4. Limitations of the Experiment

The method proposed in this study detects memory corruption by analyzing static variables and dynamic memory usage. By considering the performance of the tools, the dynamic memory usage information stored in the information tags was limited to the dynamic memory used by the application itself in our experimental environment. However, the dynamic memory used by the library, which is called within the application, can be monitored by increasing the storage size of the information tags. Hence, the defect-detection rate and defect-cause accuracy can be improved. However, the size of the information tags must be limited, given the performance overhead of the tool. Therefore, an analysis to determine the appropriate size of the information tags must be performed.

5. Conclusions

Memory corruption defects remain difficult to detect or debug, because, if only the part of the memory used by a process is monitored when memory corruption occurs, then it becomes difficult to detect the defect or analyze its cause. Therefore, to detect memory corruption, the entire memory space used by the process must be monitored. However, this increases the performance overhead; thus, it is challenging to apply this approach in a real environment. Additionally, the location of the memory corruption and that of its cause often differ, which is another reason why memory corruption issues are challenging to resolve.
We proposed an automated method of detecting memory corruption by analyzing static variables and dynamic memory usage. The proposed method was implemented as an automation tool called the MCDT, and it was experimentally compared with other tools. The results demonstrate the accuracy of the MCDT in detecting defects and analyzing their causes, as well as its excellent performance. The proposed method used the “information tag” data structure to manage the global and static variables of the remaining data space after excluding the stack space from the memory space used by the process, while using dynamic memory in the heap space, to detect defects. The performance overhead was reduced by not monitoring the entire memory space of the process. However, the dynamically and statically allocated memory was monitored to increase the accuracy of both defect-detection and cause-analysis. Additionally, the signal-hooking technique was applied, meaning defect information could be collected without data loss, even if a crash occurred.
We plan to conduct further studies to expand the static memory used for defect-detection to the entire static memory area, and to study static variables.

Author Contributions

J.P. and B.C. contributed to the design and implementation of the research, to the analysis of the results and to the writing of the manuscript. Y.K. partially contributed to the experiments stated above, as well as review, writing and editing. B.C. supervised the findings of this work. All authors have read and agreed to the published version of the manuscript.

Funding

This research received no external funding.

Acknowledgments

This research was partially supported by the MSIT (Ministry of Science and ICT), Korea, under the ITRC (Information Technology Research Center) support program (IITP-2021-2017-0-01628) supervised by the IITP (Institute for Information and Communications Technology Promotion).

Conflicts of Interest

The authors declare no conflict of interest.

References

  1. Xu, J.; Mu, D.; Chen, P.; Xing, X.; Wang, P.; Liu, P. Credal: Towards locating a memory corruption vulnerability with your core dump. In Proceedings of the 2016 ACM SIGSAC Conference on Computer and Communications Security, New York, NY, USA, 24 October 2016; pp. 529–540. [Google Scholar] [CrossRef]
  2. Konstantin, S.; Derek, B.; Alexander, P.; Dmitry, V. AddressSanitizer: A Fast Address Sanity Checker. In Proceedings of the 2012 USENIX Annual Technical Conference, Boston, MA, USA, 13–15 June 2012; pp. 309–318. [Google Scholar]
  3. Qin, F.; Lu, S.; Zhou, Y. SafeMem: Exploiting ECC-Memory for Detecting Memory Leaks and Memory Corruption During Production Runs. In Proceedings of the 11th International Symposium on High-Performance Computer Architecture, Institute of Electrical and Electronics Engineers (IEEE), San Francisco, CA, USA, 12–16 February 2005; pp. 291–302. [Google Scholar]
  4. Xie, Y.; Chou, A.; Engler, D. ARCHER: Using symbolic, path sensitive analysis to detect memory access errors. In Proceedings of the 9th European Software Engineering Conference Held Jointly with 11th ACM SIGSOFT International Symposium on Foundations of Software Engineering (ESEC/FSE-11), New York, NY, USA, 1–5 September 2003; pp. 327–336. [Google Scholar] [CrossRef]
  5. Park, J.; Park, C.; Choi, B.; Chang, G. Memory Corruption Detecting Method Using Static Variables and Dynamic Memory Usage. In Proceedings of the 40th ICSE2018 ACM/IEEE 13th Workshop on Automated Software Testing, Gothenburg, Sweden, 28–29 May 2018; pp. 46–52. [Google Scholar] [CrossRef]
  6. Dor, N.; Rodeh, M.; Sagiv, M. Detecting memory errors via static pointer analysis (preliminary experience). In Proceedings of the 1998 ACM SIGPLAN SIGSOFT Workshop on Program Analysis for Software Tools and Engineering (PASTE ’98), New York, NY, USA, 16 June 1998; pp. 27–34. [Google Scholar] [CrossRef]
  7. Zhao, Q.; Rabbah, R.; Amarasinghe, S.; Rudolph, L.; Wong, W.-F. How to do a million watchpoints: Efficient debugging using dynamic instrumentation. In Proceedings of the International Conference on Compiler Construction, Berlin/Heidelberg, Germany, 29 March–6 April 2008; pp. 147–162. [Google Scholar] [CrossRef] [Green Version]
  8. Eigler, F.C. Mudflap: Pointer use checking for C/C++. In Proceedings of the First Annual GCC Developers’ Summit, Ottawa, ON, Canada, 25–27 May 2003; pp. 57–70. [Google Scholar]
  9. Kosmatov, V.; Jakobsson, S. Runtime Detection of Temporal Memory Errors, LNCS; Springer: Berlin/Heidelberg, Germany, 2017; Volume 10548, pp. 294–311. [Google Scholar]
  10. Hastings, R.; Joyce, B. Purify: Fast detection of memory leaks and access errors. In Proceedings of the Winter 1992 USENIX Conference, Usenix Association, Monterey, CA, USA, 22 November 1991; pp. 125–138. [Google Scholar]
  11. Nethercote, N.; Seward, J. How to shadow every byte of memory used by a program. In Proceedings of the 3rd International Conference on Virtual Execution Environments (VEE ’07), New York, NY, USA, 13 June 2007; pp. 65–74. [Google Scholar] [CrossRef] [Green Version]
  12. Vorobyov, K.; Signoles, J.; Kosmatov, N. Shadow state encoding for efficient monitoring of block-level properties. In Proceedings of the 2017 ACM SIGPLAN International Symposium on Memory Management, New York, NY, USA, 18 June 2017; pp. 47–58. [Google Scholar] [CrossRef]
  13. CWE. A Community-Developed List of Common Software Security Weaknesses. 2018. Available online: https://cwe.mitre.org/index.html (accessed on 20 May 2021).
  14. Luecke, G.R.; Coyle, J.; Hoekstra, J.; Kraeva, M.; Li, Y.; Taborskaia, O.; Wang, Y. A survey of systems for detecting serial run-time errors. Concurr. Comput. Pract. Exp. 2006, 18, 1885–1907. [Google Scholar] [CrossRef]
  15. Seo, J.; Choi, B.; Yang, S. A profiling method by PCB hooking and its application for memory fault detection in embedded system operational test. Inf. Softw. Technol. 2011, 53, 106–119. [Google Scholar] [CrossRef]
  16. ODROID-XU4. 2017. Available online: http://www.hardkernel.com/ (accessed on 20 May 2021).
  17. ITC-benchmarks. Static Analysis Benchmarks from Toyota ITC. 2018. Available online: https://github.com/regehr/itc-benchmarks (accessed on 20 May 2021).
  18. Guthaus, M.R.; Ringenberg, J.S.; Ernst, D.; Austin, T.M.; Mudge, T.; Brown, R.B. MiBench: A free, commercially representative embedded benchmark suite. In Proceedings of the Fourth Annual IEEE International Workshop on Workload Characterization, WWC-4 (Cat. No.01EX538), Austin, TX, USA, 2 December 2001; pp. 3–14. [Google Scholar] [CrossRef]
  19. Wu, F.; Nanavati, J.; Harman, M.; Jia, Y.; Krinke, J. Memory mutation testing. Inf. Softw. Technol. 2017, 81, 97–111. [Google Scholar] [CrossRef]
  20. Shahriar, H.; Zulkernine, M. Mutation-based Testing of Buffer Overflow Vulnerabilities. In Proceedings of the Computer Software and Applications (COMSAC’08) 32nd Annual IEEE International, Turku, Finland, 28 July–1 August 2008; pp. 979–984. [Google Scholar] [CrossRef]
Figure 1. Overview of memory corruption detection.
Electronics 10 02127 g001
Figure 2. Example of memory corruption due to NULL pointer deallocation.
Electronics 10 02127 g002
Figure 3. Information tag.
Electronics 10 02127 g003
Figure 4. Management of information tag.
Electronics 10 02127 g004
Figure 5. Conceptual diagram of hooking.
Electronics 10 02127 g005
Figure 6. Real-time defect-detection: memory allocation.
Electronics 10 02127 g006
Figure 7. Real-time defect-detection: memory deallocation.
Electronics 10 02127 g007
Figure 8. Real-time defect-detection: memory access.
Electronics 10 02127 g008
Figure 9. Conceptual diagram of hooking.
Electronics 10 02127 g009
Figure 10. Use of the tool (memory corruption detection tool); (a) automation of defect-detection; (b) tool execution window.
Electronics 10 02127 g010
Figure 11. Conceptual diagram of hooking.
Electronics 10 02127 g011
Figure 12. Effectiveness of memory defect-detection; (a) defect-detection rate; (b) defect-cause accuracy.
Electronics 10 02127 g012
Figure 13. Number of defects detected per memory defect type; (a) number of defects detected; (b) number of defects for which the cause was accurately analyzed.
Electronics 10 02127 g013aElectronics 10 02127 g013b
Figure 14. Effectiveness of detecting memory defects when a crash occurred; (a) defect-detection rate; (b) defect-cause accuracy.
Electronics 10 02127 g014
Figure 15. (a) Number of defects detected; (b) number of defects for which the cause was accurately analyzed.
Electronics 10 02127 g015aElectronics 10 02127 g015b
Table 1. Memory defect categories.
CategoryDefectsDefect ID
Memory allocationMemory allocation failureM01
Allocating zero-size memoryM02
Memory leakM03
Memory deallocationFreeing a NULL pointerM04
Freeing previously deallocated memoryM05
Freeing unallocated memoryM06
Allocation/deallocation mismatchM07
Memory accessAccessing a NULL pointerM08
Accessing deallocated memoryM09
Accessing unallocated memoryM10
Collision with the memory space of another variable while accessing the memory space outside the allocated areaM11
No collision with the memory space of another variable while accessing the memory space outside the allocated areaM12
Table 2. Information tags after performing the malloc() function in Figure 9.
AddressSizeAllocation FlagAllocation Function TypeDeallocation FlagAllocation CallerDeallocation Caller
0 × 000100700 × 640 × 10 × 00 × 00 × 000000000 × 00000000
0 × 000240970 × 40 × 00 × 00 × 00 × 000118c10 × 00000000
Table 3. Memory-related signals.
Signal NameDefault ActionDescriptionCrash Information
SIGABRTCore dumpAbnormal abort signalCall stack, memory map
SIGBUSCore dumpBus errorCall stack, open file information, memory map
SIGSEGVCore dumpReferencing incorrect memoryCall stack, memory map
Table 4. Benchmark program.
Benchmark ProgramApplicationLOCInput DatasetsNumber of DefectsCrash OccurrenceMemory Defect
ITC Benchmarkmemory_allocation_failure715-167M01
memory_leak556180M03
free_null_pointer585149M04
double_free2381212M05
free_nondynamic_allocated_memory3001616M06
null_pointer3861715M08
invalid_memory_access672171M09
uninit_memory_access477152M10
uninit_pointer452161
buffer_overrun_dynamic690321M11, M12
buffer_underrun_dynamic865393
deletion_of_data_structure_sentinel6930
littlemem_st350114
overrun_st932543
st_overflow25077
st_underrun26373
underrun_st239130
ow_memory6220M12
Subtotal 30984
MiBenchAutomotiveBasicmath192Large
Input datasets
52Injected defects (See Table 5)
Qsort10042
Susan21228043
ConsumerJpeg30,5792820
Lame16,697446208
OfficeStringsearch31972816
NetworkDijkstra34885
Patricia542248
SecurityBlowfish enc.167252
Sha241136
Telecomm.FFT3286033
GSM enc.6578339
Subtotal 784384
Total 1093468
Table 5. Memory corruption detection tools for comparison.
ToolVersionNote
AddressSanitizerGCC 7.3.0-
Frama-C/EACSLFrama-C v20.0-
MemcheckValgrind 3.13.0-
Core dumpUbuntu Linux 4.14.37Executes only when the system crashes
Table 6. Memory mutation operators.
Defect IDMutation IDDescription
M01MAL_001Replace the memory allocation function call with −1 (−1 is the value returned by the related function if the allocation fails)
MAL_002Replace the parameter of the memory allocation function with −1
M02MAL_003Change the size requested by the memory allocation function to 0
M03MAL_004Remove the memory deallocation function
M04MDA_001Replace the parameter of the memory deallocation function with NULL
M05MDA_002Call the memory deallocation function twice
M06MDA_003Append −1 to the parameter of the memory deallocation function
MDA_004Enter the address of a global variable for the parameter of the memory deallocation function
MDA_005Enter the address of a local variable for the parameter of the memory deallocation function
M07MDA_006Replace the memory allocation function with the alloca() function
MDA_007Change the free() function to the delete() function
MDA_008Change the delete() function to the free() function
M08MAC_001Replace the parameter of the memory access function with NULL
M09MAC_002Call the memory deallocation function before calling the memory access function
M10MAC_003Append −1 to the parameter of the memory access function
M11MAC_004Increment the size accessed by the memory access function by 1
MAC_005Remove the \0 character from the character string memory
MAC_006Change the function starting with strn to a function starting with str
M12MAC_004Increment the size accessed by the memory access function by 1
MAC_005Remove the \0 character from the character string memory
MAC_006Change the function starting with strn to a function starting with str
Table 7. Number of mutants per MiBench application.
ApplicationBasicmathQsortSusanJpegLameStringsearchDijkstraPatriciaBlowfishShaFFTGsmTotal
Mutation
Operator
MAL_001009413118006244
MAL_002009413118006244
MAL_003002412119006742
MAL_004009413218006245
MDA_001002412119006742
MDA_002002412119006742
MDA_003002412119006742
MDA_0040000010000607
MDA_0050000010000607
MDA_006009413118006244
MDA_0070000010000607
MDA_0080000010000607
MAC_00122130179110027222240
MAC_002221301539000010180
MAC_00322100179110027122236
MAC_00410100759001515107
MAC_005000091100001021
MAC_006000021900001132
Total7690327167386851979861189
Uncompiled2210417000000180206
Uncalled0000100450440613199
Runnable Total548028446288245136083784
Table 8. System overhead.
Comparison CategoryCoredumpMemcheckAddress-SanitizerFrama-C/EACSLMCDT
Test environmentTarget scopeSystem (crash program)1 Program1 Program1 ProgramSystem (multi-programs)
HardwareN/AN/AN/AN/AN/A
SoftwareN/AVirtual MachineN/AN/AN/A
Performance overheadPerformance-delay rate-AVG 360%AVG 26.7%AVG 1900%AVG 6.67%
Memory overhead 5.95 times4.22 times2.48 times2.1 times
Rate of increase in code size-AVG 12.7 timesAVG 215.74 times--
Publisher’s Note: MDPI stays neutral with regard to jurisdictional claims in published maps and institutional affiliations.

