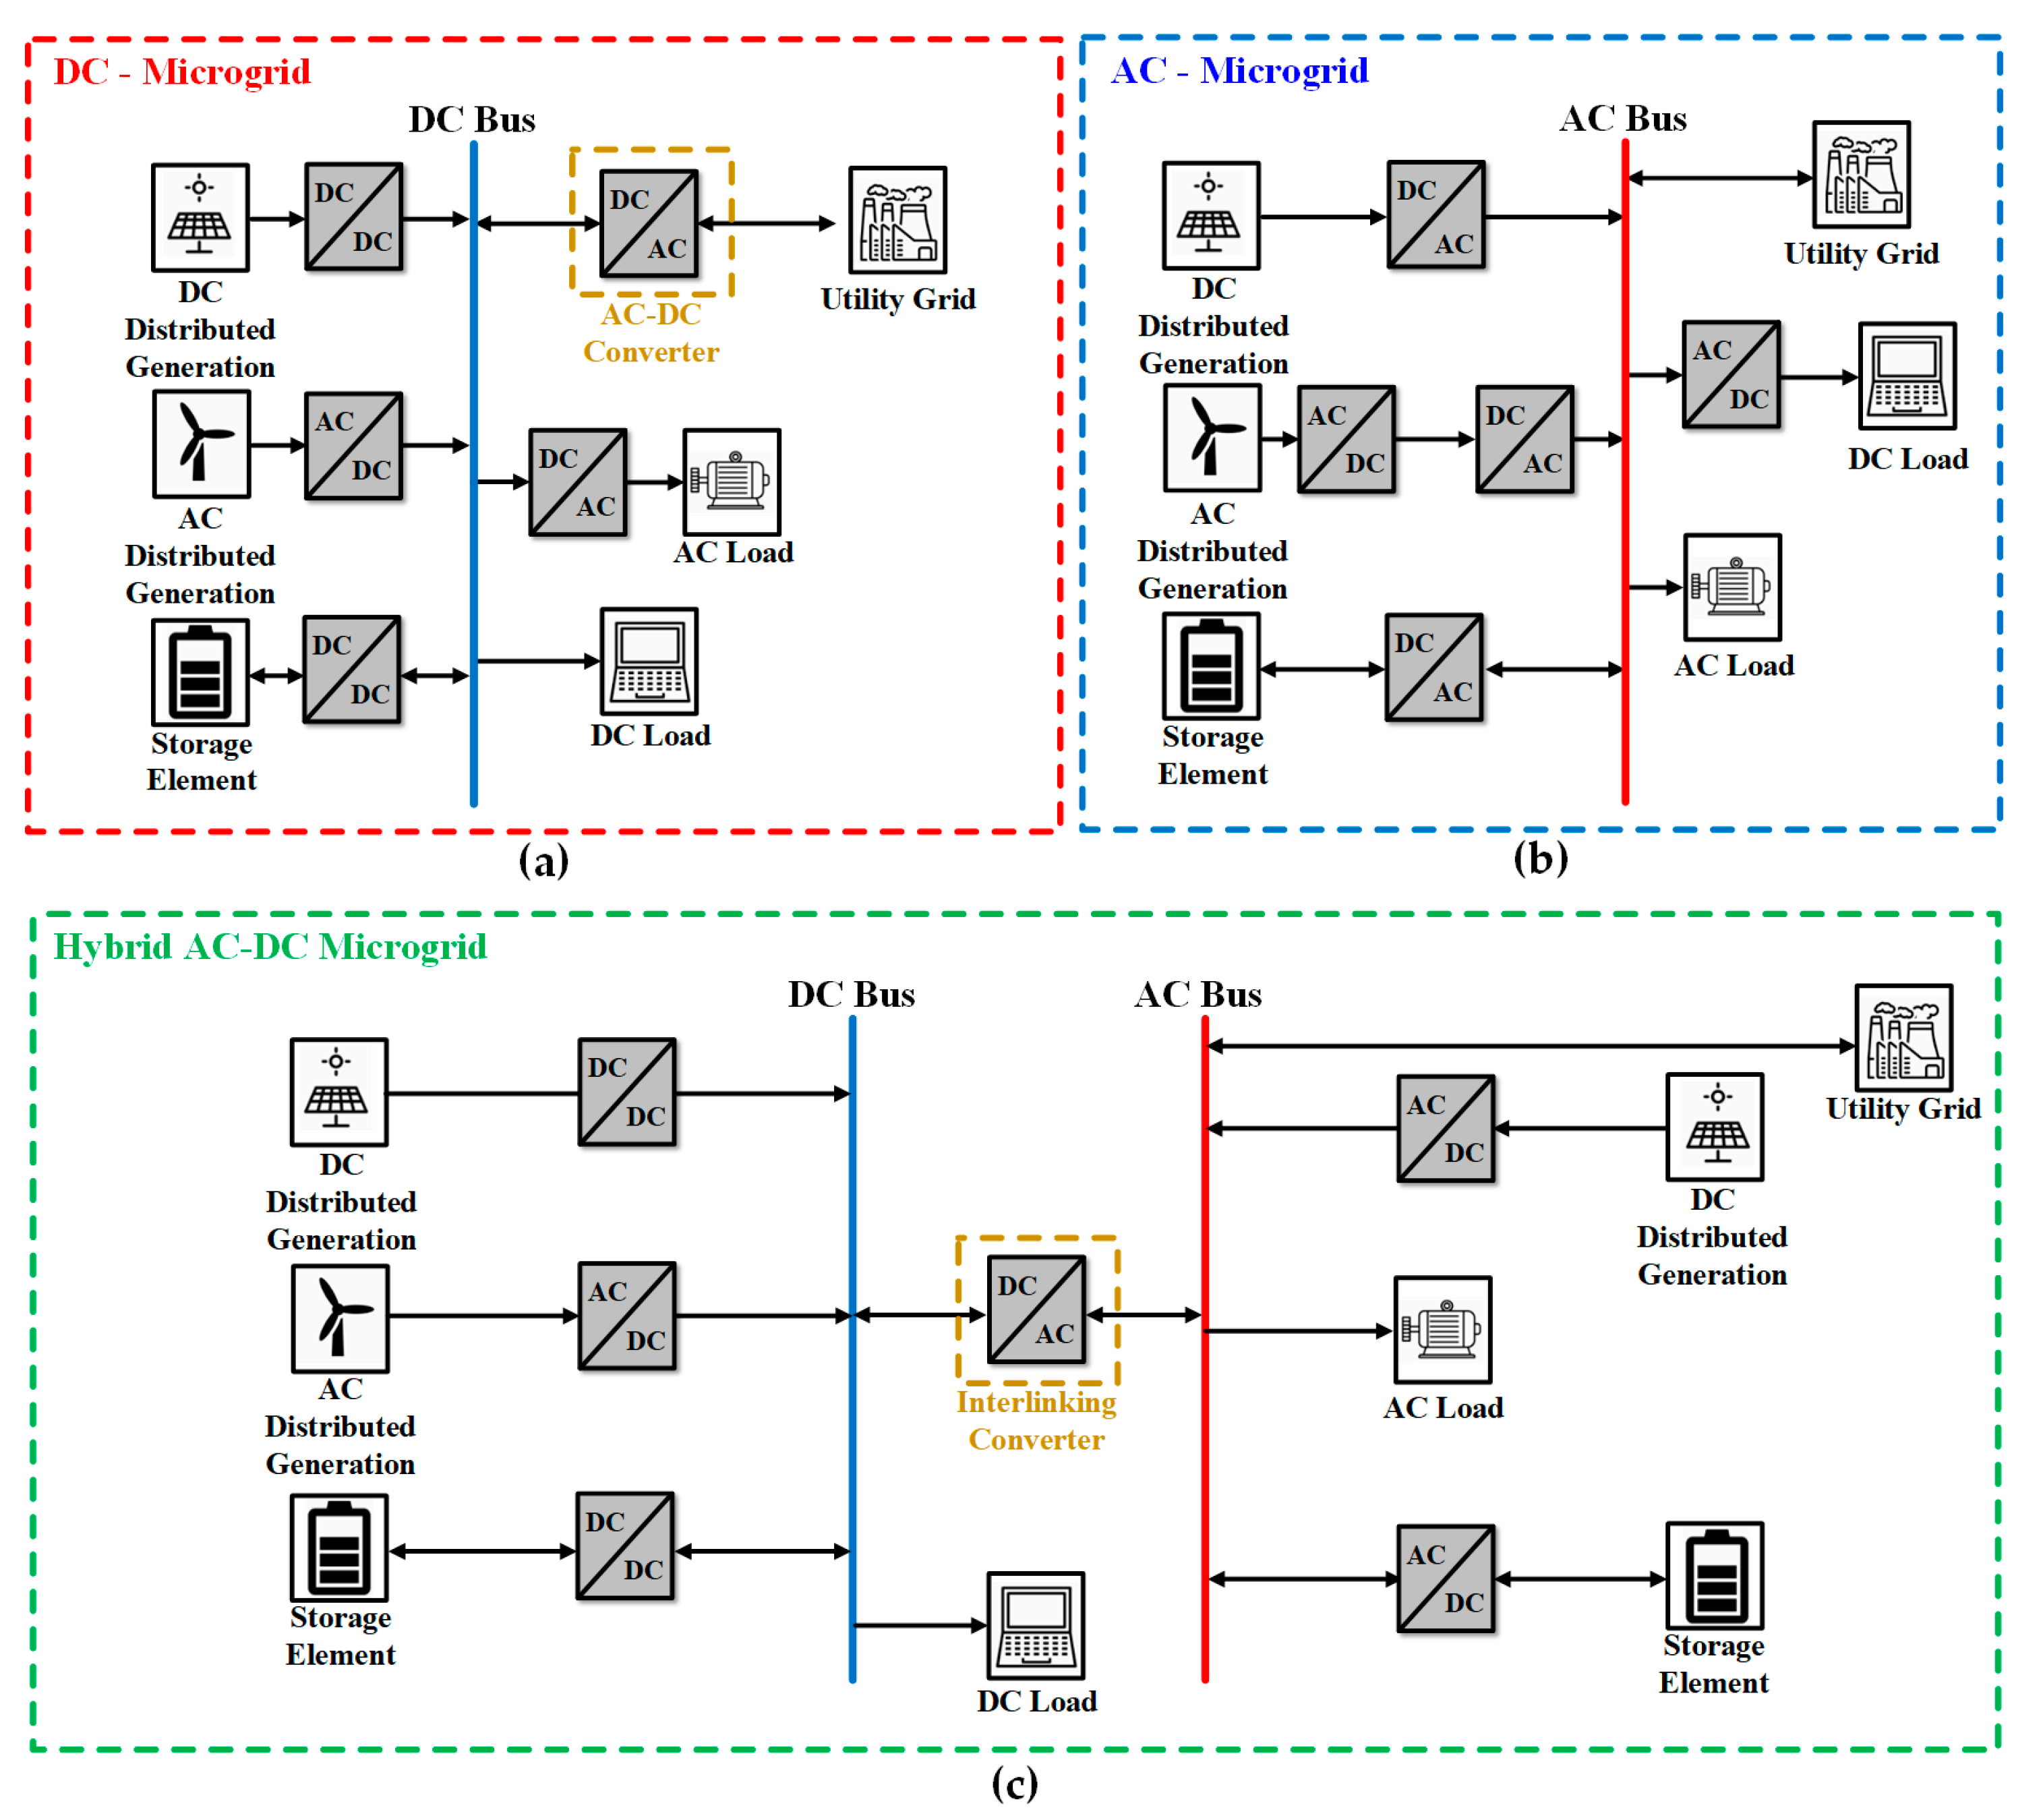
Article

Energy Management Method of Hybrid AC/DC Microgrid Using Artificial Neural Network

1
Department of Electrical and Computer Engineering, Sungkyunkwan University, Suwon 16419, Korea
2
Mando Corporation, Seongnam 13486, Korea
*
Author to whom correspondence should be addressed.
Electronics 2021, 10(16), 1939; https://doi.org/10.3390/electronics10161939
Submission received: 20 July 2021 / Revised: 4 August 2021 / Accepted: 9 August 2021 / Published: 11 August 2021
(This article belongs to the Section Power Electronics)

Abstract

:
This paper proposes an artificial neural network (ANN)-based energy management system (EMS) for controlling power in AC–DC hybrid distribution networks. The proposed ANN-based EMS selects an optimal operating mode by collecting data such as the power provided by distributed generation (DG), the load demand, and state of charge (SOC). For training the ANN, profile data on the charging and discharging amount of ESS for various distribution network power situations were prepared, and the ANN was trained with an error rate within 10%. The proposed EMS controls each power converter in the optimal operation mode through the already trained ANN in the grid-connected mode. For the experimental verification of the proposed EMS, a small-scale hybrid AD/DC microgrid was fabricated, and simulations and experiments were performed for each operation mode.

1. Introduction

Recently, as the problem of resource depletion due to the reckless use of fossil fuels and environmental problems caused by the generation of greenhouse gases has emerged, interest in new energy sources has also greatly increased [1,2,3,4,5]. Therefore, policies to reduce the use of fuels such as oil, natural gas, and coal, which are considered the main sources of greenhouse gas worldwide, are also being prepared. For example, the Paris Agreement, which replaced the existing Kyoto Protocol when it expired in 2020, set the target for the supply of renewable energy sources to make up 11% of our energy by 2030. To this end, since 2012, the Renewable Energy Portfolio—a mandatory system for supplying renewable energy sources (RESs) such as wind, tidal, and solar power—has been implemented. Along with this movement, academia defined a microgrid as a small-scale distribution network based on renewable energy that provides network operation control capabilities [6,7]. A microgrid is a distributed power generation method, and unlike the conventional centralized power generation method, it is efficient because it can reduce power loss due to long-distance transmission. In addition, since the stand-alone operation of distributed power is possible without the microgrid being connected to existing systems, a high energy independence can be obtained [8]. Such a microgrid can be categorized as DC, AC, and hybrid AC/DC microgrids depending on how the distribution network and loads are connected [9,10]. Figure 1a shows a DC microgrid. A DC microgrid has the advantage of not having to consider problems such as phase, frequency, power factor, and reactive power, and it is expected to reduce system installation cost and increase power transmission efficiency by reducing the power conversion step [11]. Figure 1b shows an AC microgrid. AC microgrids have the advantage of low initial costs, in that we can utilize existing AC systems in current distribution networks. However, due to frequency, AC systems require additional considerations compared to DC systems. In addition, in most distributed power sources such as photovoltaic power generation and fuel cells, power generation has a form of a DC voltage, so an additional power conversion device is required for connection with existing AC systems [12].
Figure 1c shows a hybrid AC/DC distribution network. A hybrid AC/DC distribution network can benefit from all the advantages of easy connection with distributed power sources, as well as make use of existing AC systems [13,14,15]. For the interlinked operation of these hybrid AC/DC distribution networks, AC/DC converters are placed between distribution networks to carry out bidirectional power and voltage control. The converter that performs this role is defined as an interlinking converter (ILC), and there has been significant related research in this area [16]. RESs such as solar and wind power used to supply microgrids like those described above are affected by the amount of power generated, which irregularly fluctuates according to changes in climate such as solar radiation and wind speed. Therefore, an energy storage system (ESS)-based energy management system (EMS) is indispensable for maintaining the power supply and optimal operation of distribution networks [17,18,19,20]. Figure 2 shows example control structures for EMSs; these structures can largely be divided into either centralized control or decentralized control methods [21,22,23]. Figure 2a illustrates the decentralized control method, which is independently controlled according to the characteristics of each distributed power source; this kind of system has the advantage of easy capacity expansion. However, reliability can vary depending on the droop controller’s gain and performance, and there may be difficulties in the independent design and control of each controller [24,25]. Figure 2b shows the centralized control method. Unlike in the decentralized control method, a central controller monitors the power generation of the load and the distributed power in the distribution network, and it transmits commands to the local controllers connected to each distributed power source using the power of an ESS [26,27]. Since this method allows for the easy management of energy between multiple converters connected to the distribution network, the authors of this paper adopted an EMS based on the centralized method. Additionally, for EMSs based on centralized control, research has already been conducted into how to reduce distribution network operation costs and improve the reliability of power supply through charge/discharge scheduling of energy storage devices [28].
Since such systems are aimed at smooth power supply and efficient consumption, it is necessary to predict the power generation amount and load demand of the distributed power sources such as solar and wind power, as well as information on the remaining capacity of the ESS. However, it is not just necessary to receive profile data on medium and long-term load demands in distribution networks, as well as on the power generated by distributed power sources; we must tackle the limitations of these systems, as it is difficult to infer accurate data due to instantaneous fluctuations in power generation [29,30]. In particular, in the case of a photovoltaic power generation, a number of studies attempted to predict the amount of generated power, but it has been difficult in most cases to predict the amount of power generation by time period based only on the amount of solar radiation. In addition, in the case of load demand forecast, researchers have mostly studied large-scale loads with little volatility or uncertainty. However, studies on small customers and buildings where significant load fluctuations can occur are insufficient [31,32]. The conventional EMS operation algorithm determines the power reference of an ESS with only the power generation and load demand amount of the DG [33]. This method is not efficient because it does not consider the accumulated power received by the AC grid and the SOC of the ESS. Additionally, it has the disadvantage that the algorithm for operating the EMS is complicated [34,35,36].
Therefore, the authors of this paper propose an integrated energy management method based on centralized control to which artificial neural network (ANN) theory is applied to achieve efficient power operation in small-scale microgrids. The proposed energy management method simplifies the neural transmission process of organisms and applies ANN theory, which is a mathematically interpreted model. Through this approach, the optimal operation modes of the power converter in a distribution network can be determined while the energy management of the entire distribution network is carried out. The proposed method generates the ESS’s power reference by additionally considering the ESS’s SOC and the AC grid’s accumulated power in addition to the DG’s power generation and load demand. In addition, since the operation mode is determined through the power reference of the ESS, which is determined by the input data of the ANN, the algorithm for operation is not as complicated as the conventional EMS.
The main contributions of this paper are listed below:
(1)
Our ANN-based EMS algorithm is effective for small-scale microgrids with frequent fluctuations in power generation and load.
(2)
In addition to DG’s power generation and load demand, our power distribution network’s power management is efficient because the ESS’s SOC and the accumulated power received from the AC grid are additionally considered.
(3)
Since the output power standard of the ESS is determined by the ANN trained by different input data for each operation mode, the algorithm for implementing the operation of the EMS is simplified.
The rest of this paper is organized as follows. Section 2 describes the configuration of the proposed centralized distribution system, as well as the proposed ANN algorithm and the distribution system’s power flow. Section 3 describes the training simulation for ANN theory, and Section 4 discusses the results of experiments conducted to verify the proposed method. Conclusions is given in Section 5.

2. Operation and Control Method of Proposed Energy Management System for Hybrid AC/DC Microgrids

This section describes the configuration of the AC/DC microgrid considered in this paper and details the operation method of the proposed EMS. Figure 3 shows the configuration diagram of the hybrid AC/DC microgrid distribution network used in this paper.
The existing AC grid is connected to a DC distribution network through the ILC, and the ILC can operate in the grid-connected or standalone modes. In the grid-connected mode, the ILC controls the voltage of the DC distribution network through the power of the AC grid. If a problem occurs in the AC grid, the ILC operates in the stand-alone mode to control the voltage of the AC distribution network. Wind and photovoltaic power are connected to the DC distribution system through a power converter device to supply power. In addition, the ESS controls the voltage of the DC distribution network or supplies power by performing charge/discharge operations according to the current operation mode.

2.1. Control Method of the Proposed Energy Management System

The energy management method proposed in this paper uses a hierarchical control structure based on centralized control. The ILC that connects the DC and AC distribution networks is used as the microgrid central controller (MGCC), and each distributed power supply connected to the distribution network and the local controller of the ESS are used as sub-controllers of the ILC. Figure 4 shows the hierarchical control structure of the proposed EMS and the control block diagram of each power converter. The control structure consists of three stages, and the primary controller uses the local controller to control each power conversion device, which is a component of the distribution network. The secondary controller uses a specific local controller that performs voltage control to keep the distribution network voltage constant. In this paper, the ILC was designed to perform secondary control to maintain the DC distribution network voltage during normal operation. If an accident occurs on the AC grid, the ILC operates in a stand-alone operation mode and performs voltage control on the AC distribution network side, which is the secondary control. At this time, to maintain the DC distribution network voltage, the ESS power conversion device controls the DC distribution network voltage and performs secondary control on the DC distribution network. Lastly, tertiary control, which is the highest level control, refers to the EMS functions being performed by the ILC acting as the MGCC. This means receiving instantaneous power, ESS state of charge (SOC), and fault information from each power conversion device connected to the distribution network while performing power management duties for the entire hybrid AC/DC distribution network. Since the distributed generators (DGs) connected to the distribution network generally perform maximum power point tracking (MPPT), energy management is carried out through the power control of the ESS. Therefore, the MGCC performs energy management through the ESS, except for during stand-alone operation situations triggered by distribution network accidents. It can be seen that the local controllers change their operation mode and output power according to the reference generated through the tertiary controller in the MGCC, and in the case of the converter that controls the distribution network voltage, voltage control is additionally performed with the secondary controller.
In the case of a power converter connected to a distributed power supply, it operates in the MPPT mode and reduced power (RP) mode. In addition, the ESS carries out charge and discharge power control, as well as DC distribution network voltage control. In the case of the ILC, the DC power distribution network voltage control mode is carried out when the grid is connected, but AC customer-side voltage control is performed to provide a stable voltage during stand-alone mode. The operation mode of each local controller and the amount of the ESS power are determined by the MGCC using the ANN depending on whether the system is in the grid-connected or stand-alone mode.

2.2. Operation Method of the Proposed Energy Management System

Figure 5 shows the ANN-based energy management flowchart for tertiary controller, and it is largely divided into grid-connected and stand-alone modes. Modes 1, 2, and 3 represent grid-connected modes in which the ILC controls the DC voltage, and modes 4, 5, and 6 represent stand-alone modes in which the ILC controls the AC voltage due to a problem having occurred in the AC system.
Figure 6 shows a configuration diagram of the ANN applied to the grid-connected mode of Figure 5. The ANN applied in this paper is composed of three input layers, three hidden layers, and one output layer, and there is a weight between each layer.
The signal transmitted from the input layer passes through the hidden layer to the output layer. At this time, the output value is determined by the weighted connections between each layer. In order to derive the optimal output according to the input signal, the weight value must be updated. This process is called training. In our proposed system, the weight of the ANN is trained using the backpropagation algorithm. The data input to the input layer of the ANN in this paper are the SOC of the ESS, the surplus power generation PS, and the power received by the AC grid Pgrid, where the surplus power generation is the total power generation of the distributed power supply minus the load in the distribution network.

2.2.1. Mode 1: ESS Charge Mode

The ESS charging mode is the mode for charging the SOC of the ESS when the remaining amount of the SOC of the ESS is low and the surplus power generation is sufficient. This mode operates in a situation where the SOC of the ESS is less than 50%. Considering a case where the ILC operates in a standalone mode, this mode is performed to secure 50% or more of the SOC’s remaining capacity.
Figure 7 shows the power flow of each power converter in the ESS charge mode. At this time, the ILC controls the voltage of the DC distribution network, and the DG performs MPPT control. The charging amount of the ESS is determined through the neural network, and the surplus power PS, the accumulated power Wgrid received from the AC distribution network, and the SOC of the ESS are considered. PS is expressed as the difference between the distributed power generation amount PDG and the load demand PLoad, as shown in Equation (1), and the accumulated power received Wgrid is calculated with Equation (2).
P S = P D G P L o a d
W g r i d = 0 t P G r i d t d t
Table 1 shows an ANN training table prepared by considering input data (SOC, surplus power, and accumulated power) to determine the charging power of the ESS in mode 1. The data were written as ratios of the rated or maximum value as a P.U value. The charge power reference of the ESS was selected to be inversely proportional to the value of the SOC and the accumulated power received, as well as to be proportional to the surplus generated power.

2.2.2. Mode 2: Power Regeneration Mode

Mode 2 is the mode that is performed when the power generation PDG of the DG is greater than the load demand PLoad and the SOC of the ESS is 50% or more. In this mode, a portion of the generated power is transmitted to the AC grid side through the ILC, as shown in Figure 8. As in mode 1, the ILC performs voltage control on the DC distribution network and the DGs perform MPPT control. Pgrid—the power transmitted to the distribution network—is determined by Equation (3) as the difference between the DG power generation PDG, the load demand PLoad, and the ESS charge amount. Therefore, for power transmission to the distribution network, the charging power PESS of ESS must satisfy the conditions of Equation (4).
P g r i d = P D G P L o a d P E S S
P E S S < P D G P L o a d
In mode 2, the reference data used for training the ANN to determine the charging power of the ESS were selected as 18 data as shown in Table 2. The data are written as ratios of the rated or maximum value as a P.U value. Unlike mode 1, the charging amount of the ESS was selected to maintain the conditions of Equation (4). In other words. PESS is proportional the surplus generated power, but it is inversely to the SOC and the accumulated power received by the distribution network.

2.2.3. Mode 3: ESS Discharge Mode

The ESS discharge mode is the mode that minimizes the power received from the AC grid through the ESS discharge when the SOC is 50% or more and the amount of power generated by the DG is less than the demand for the load. Figure 9 shows the power flow diagram in ESS discharge mode operation. As in mode 1, the ILC performs voltage control on the DC distribution network and the DGs perform MPPT control. Therefore, in order to minimize the supply and demand power of the distribution network, the discharge power PESS of the ESS must satisfy the conditions of Equation (5).
P E S S < P L o a d P D G
In other words, the amount of discharging power from the ESS PESS is proportional to the power consumption of the distribution network and the accumulated received power, and it must be inversely proportional to the SOC in order to minimize the power supply and demand of the power distribution network according to the load demand. Table 3 shows the input/output data used for training the ANN for the ESS discharge mode; for the efficient discharge of the ESS, the data were prepared based on the operation described above.

2.2.4. Mode 4: Stand-Alone Mode

The standalone modes comprise modes 4, 5, and 6, which used when the AC system is cut off due to a problem in the AC grid. The ILC operates in voltage control mode to supply power to the AC customer. Figure 10 shows the power flow diagram when in the stand-alone mode where, unlike the grid-connected mode, ESS performs the voltage control of the DC distribution network rather than charge and discharge power control. The ESS controls the difference between the power generation and the load consumption amount of distributed power sources flowing into the distribution network through charge and discharge in order to stably maintain the voltage in the distribution network. Therefore, the conditions of Equation (6) must be satisfied for the voltage control of the DC distribution network during island-mode.
P E S S , r a t e d > | P D G P L o a d |

2.2.5. Mode 5: RP (Reduced Power) Mode

The RP mode is a mode that limits the amount of power generated from the distributed power supply. It operates in this mode only when the power generation of the distributed power supply exceeds the load demand, so the condition of (6) is not satisfied, or when the charging mode operation is difficult due to the full charge of the SOC. Figure 11 shows the power flow diagram when in the RP mode and EMS is delivering the power reference, as shown in Equation (7), to the distributed power source to limit the amount of power generated by the distributed power source. In this equation, PESS represents the amount of power charged in the ESS.
P D G = P L o a d P E S S

2.2.6. Mode 6: Load Shedding Mode

The load shedding mode (mode 4) operates when the SOC of the ESS decreases to a certain value (20% in this paper) or less, and it maintains the voltage in the distribution network by cutting off the non-critical load. Figure 12 shows the power flow diagram in load shedding mode. The circuit breaker (CB) connected to the non-critical load is interrupted by the EMS. The load shedding mode is restored to island or RP mode when the SOC is secured above a certain value.

3. Simulations

For this section, the method proposed in this paper was verified through simulation. The ILC for the connection of the AC distribution network and the DC distribution network had a capacity of 20 kW, and the ESS, wind power, solar power, and AC load on the customer side were each 10 kW. Table 1, Table 2 and Table 3 show energy management characteristics that made mathematical analysis difficult due to the nonlinear characteristics of the data. In order to calculate the optimal charge/discharge power reference value of ESS in EMS using these data, the ANN had to be trained. For the ANN training, 100~500 training sessions were conducted so that the error rate of the ESS charge/discharge reference power data and the ESS charge/discharge reference in each operation mode was 10% or less. Figure 13a–c shows simulation results of the ANN training in ESS charge mode, power regeneration mode, and ESS discharge mode, respectively. It can be seen that the training of the ANN was completed within 5% of the error for each reference data sample.
Figure 14 shows the customer’s load by time and the amount of power generated by the DGs applied for the simulation. The simulation profile was created by assuming that 0.1 s in the simulation was an actual one hour.
Figure 15 shows the simulation results of the microgrid to which the proposed EMS is applied. From this result, it can be seen that the load demand and distributed generation appear similar to the simulation profile in Figure 14. The t0 < t < t1 area is a section where the SOC of the ESS in the distribution network was less than 50%. To prioritize ESS charge, the EMS operates in mode 1 (a charge mode) to charge the battery. The t1 < t < t2 area is a section with an SOC of 50% or more and a load demand (PLoad) greater than the distributed power generation (PDG).
At this time, the EMS operates in mode 3 (ESS discharge mode) to supply insufficient power. The t3 < t < t4 interval is the section where the DGs and load-demand curves intersect, and if the DG amount is large, the operation is performed in mode 2 (regeneration mode) or mode 3. The t4 < t < t5 area is a section where solar power generation starts. Since the amount of DG is greater than the load demand, the ESS is charged when in the power regeneration mode and the remaining power is regenerated through the AC grid. In the t5 < t section, solar power regeneration is not possible in the evening, and since the load demand from the customer is high, the ESS operates in the discharge mode.

4. Experiment Results

In order to verify the validity of the proposed ANN-based EMS system, a hybrid AC/DC microgrid system was constructed, and experiments were conducted. Figure 16 shows the overall configuration of the laboratory-scale microgrid constructed for this experiment.
The detailed configurations of the experimental set are shown in the following figures. Figure 17 shows the experimental set of the ILC for connecting AC and DC distribution networks. The ILC applied in this experiment was composed of a three-phase, two-level AC/DC topology, and it included an initial charging circuit for safe connection with each distribution network. The ILC was manufactured with a capacity of 10 kW, and the experiment was conducted based on the AC side line voltage of 220 Vrms and the DC side voltage of 380 V. Figure 18a shows the ESS experiment set. The ESS comprised a 240 V battery pack that was formed by connecting twenty 12 V batteries in series, and a 5 kW class interleaved buck boost converter was manufactured to connect this to the DC distribution network. Figure 18b shows the experimental set of the solar power system. The PV module was composed of 6 × 2 series-parallel, and an interleaved boost topology was applied as a power converter. The PV modules, configured in series and parallel, had a cut-off voltage of 260 V, a short-circuit current of 9.6 A, and a maximum rated output power of 1.8 kW.
Figure 19 shows the experimental set for the wind power generation system and applied three-level NPC topology. In order to simulate a wind turbine, a DC motor capable of controlling a constant speed and coupled PMSG were used in the experiment.

4.1. Grid-Connected Control Mode

Figure 20 shows the experimental waveform for the grid-connected operation by the energy management system to which the ANN was applied in the grid-connected mode. When the SOC of the ESS was discharged to less than 45%, it operated in operation mode 1 (the ESS charge mode). Table 4 shows the changes in the power flow of each power conversion device in the mode 1 experiment.
Figure 20a shows the SOC, surplus power generation (PS), and grid power supply (Pgrid), which are information for calculating the charge/discharge power reference (PESS) of the ESS in the EMS. Figure 20b shows the DC link voltage in the distribution network, as well as the output current of ESS and distributed power according to the EMS power reference when the same experiment was conducted.
It can be seen that the charge amount of the ESS increased to close to the rated capacity in the T1~T2 section, where the amount of power generated by the DG was greater than the amount of load demand. However, it can be seen that the amount of charge of the ESS decreased in the section after T2, where the amount of distributed generation was similar to the load demand due to the decrease in the amount of wind power generation. In addition, it can be seen that the power supplied from the AC grid side to the DC distribution network side increased.
Figure 21 shows the experiment for operation mode 2 in which the ESS was charged and surplus power was recovered when the total amount of power generation from distributed power was greater than the load demand when the SOC of the ESS was 74%. Table 5 shows the power flow of each power conversion device in the mode 2 experiment.
Figure 21a shows the surplus power generation (PS), grid supply, and demand power (Pgrid), SOC of ESS and charge/discharge power(PESS) of ESS in operation mode 2. Figure 21b shows the DC link voltage and the output current of the ESS and distributed power in the same experiment.
The experiment was conducted by changing the load demand from T1 to 2 kW and from T2 to 4 kW while the wind power generation was fixed at 4.8 kW. The waveform of Figure 21 confirms that there was a lot of power (Pgrid) regenerated in the AC grid in the T1~T2 section, where the amount of surplus generated power (Ps) was large. However, after the T2 section, when the load increased, the amount of power charged by the ESS and the amount of power regenerated by the AC grid were reduced because the surplus power was reduced.
Figure 22 shows the experimental results for operation mode 3, in which the ESS supplied insufficient power to the load through discharge when the total amount of power generation from distributed power was less than the load demand under the condition that the SOC of the ESS was 74%. Table 6 shows the power flow of each power conversion device for the mode 3 experiment.
Figure 22a shows a waveform demonstrating the SOC of the ESS, the surplus generation power (PS), the grid supply and demand power (Pgrid), and the charge/discharge power (PESS) of the ESS. Figure 22b shows the DC link voltage and output current of the ESS and distributed power.
Mode 3 was performed with a load of 5 kW applied. Before T1, since the amount of distributed power generation was small and the surplus power was insufficient, the ESS performed a discharge operation, and it can be seen that power was supplied from the AC grid side to the DC power distribution network side. As the current discharged from the ESS increased, it can be seen that the power supplied from the AC grid side to the DC distribution network side decreased. After T1, when the amount of wind power generation rapidly increased, it can be seen that the ESS discharge current and power supplied from the AC grid to the DC side decreased as the surplus power increased.

4.2. Stand-Alone Control Mode

The stand-alone operation mode experiment was conducted after disconnecting the AC distribution network and the AC system. Figure 23 shows the experimental results of the stand-alone operation mode according to the accident situation of the AC system when the SOC of the ESS was more than 30% charged. Unlike the grid-connected mode, the ESS controlled the DC distribution network voltage to maintain 380 V, and the ILC operated as an inverter and controlled the AC distribution network voltage to maintain 220 Vrms. Table 7 shows the power flow of each distribution network when in the stand-alone operation mode, which is EMS operation mode 4, under the condition that the SOC of the ESS was more than 30%.
Figure 23a shows the SOC of the ESS, the total generation of distributed power, the load demand, and the charge/discharge power of ESS. Figure 23b shows the DC link voltage controlled by the ESS, the voltage of the AC distribution network, and the load current connected to the AC distribution network.
At T1, when a load of 2.6 kW was applied, the ESS that controlled the DC grid voltage was discharged and power was supplied to the load. After T2, when the amount of wind power generation rapidly increased, the surplus power was charged to the ESS. After T3, when the amount of wind power generation decreased, it can be seen that the ESS performed a discharge operation to again supply power to the load. It can be seen that the AC and DC grid voltage were also stably maintained.
Figure 24 shows an experimental waveform for the RP mode that operated when the generation power exceeded the maximum rated charging/discharging power of the ESS in the stand-alone operation mode. For the experiment, the limit of the charging amount of the ESS was adjusted to 3 kW. Table 8 shows the power flow of each distribution network when in EMS operation mode 5 under RP when the SOC of the ESS was more than 30% during stand-alone operation.
Figure 24a shows the SOC of the ESS, the total generation of distributed power, load demand power, and charging/discharging power of ESS when in operation mode 5. Figure 24b shows the DC link voltage, the voltage of the AC distribution network, and the load current connected to the AC distribution network.
In the T1 section, a load of 1 kW is applied, and the ESS supplies power to the load through discharge. At T2, the ESS is charged because wind power generation starts and surplus power is generated. Since the difference between the generated power and the load demand after T3 exceeds the rated charging power of the ESS, it operates in the RP mode to reduce the amount of power generated by the wind power generation.
Figure 25 is an experimental waveform that reduces the power consumption of the load through the load shedding mode under the condition that the SOC of the ESS is less than 30% when in the stand-alone operation mode. The experiment was conducted under the condition that the SOC of the ESS was more than 30%], and when the SOC was less than 30%, the power consumption of the ESS was reduced by cutting off the load. Table 9 shows the power flow of each major power converter during the experiment.
Figure 25a shows the SOC of ESS, the total generation of distributed power, the load demand, and the charging/discharging power of ESS when in operation mode 6. Figure 25b shows the DC link voltage, the voltage of the AC distribution network, and the load current connected to the AC distribution network.
At T1, a load of 2.6 kW was applied and power was supplied to the load through the discharge of the ESS. If the amount of wind power generation increased at T2, the surplus power charged the ESS. At T3, the amount of wind power was reduced and the ESS supplied power to the load through discharge. At this time, the SOC of the ESS also decreased. When the SOC of the ESS fell below 30% at T4, it operated in the load shedding mode to minimize the amount of ESS discharge.
Figure 26 shows a separate EMS monitoring screen for the power status of the total distribution network. Through this screen, the operation status and power flow of each power conversion device can be monitored. It can also be seen that the power flow shown on the monitoring screen for each operation mode and the waveforms of the experiment results in Figure 21, Figure 22, Figure 23, Figure 24, Figure 25 and Figure 26 are the same.

5. Conclusions

In this paper, an energy management method based on ANN theory is proposed to efficiently operate small-scale hybrid AC/DC microgrids. In order to implement the pro-posed EMS, an operation mode of EMS was selected, an operation profile was created in each operation mode, and then ANN training was performed in each operation mode. The ANN-based EMS receives the SOC of ESS, the surplus generation power of the DG, and the power received by the AC system to determine the optimal operation mode based on trained weight. In order to verify the proposed EMS operation algorithm, experiments were conducted by establishing a small-scale microgrid and monitoring system in a laboratory unit that linked the ESS, solar power generation system, wind power generation system, and ILC. In order to check whether the ANN-based EMS can stably operate in the proposed operation mode, experiments were conducted by varying the amount of generated power, the amount of load power, and the SOC of the ESS. The results of the experiment are summarized as follows. (1) In the ESS charging mode, it was confirmed that the ESS power reference was flexibly changed according to the amount of surplus power generation and the amount of accumulated power to charge the ESS. (2) In the power regeneration mode, it was confirmed that the power regenerated into the system was flexibly changed as the load power increased. (3) In the ESS discharge mode, it was confirmed that the ESS flexibly discharged in proportion to the load demand. In addition, it was confirmed that the proposed operation for each mode was efficiently performed, even in the independent operation mode to which ANN was not applied. The ANN-based EMS proposed in this paper is expected to be a suitable candidate for small-scale microgrids, where it is difficult to formalize the pattern of load and DG. In addition, unlike existing EMS operation algorithm, this EMS operates by additionally considering the accumulated power received by the system and the SOC of the ESS so that the energy management in the distribution network can be more efficiently performed and various operation modes can be operated through the ANN-based operation algorithm. One advantage of this system is that an uncomplicated algorithm is applied in implementation. Though an ANN was only applied to the grid-connected mode in this study, it is expected that the algorithm for operating the EMS can be further simplified if the ANN-based algorithm is applied to the independent operation mode in the future.

Author Contributions

K.-M.K. and B.-Y.C. conceived and designed the theory and experiment; K.-M.K., B.-Y.C. and H.L. performed the experiment; K.-M.K., B.-Y.C. and C.-G.A. analyzed the theory; K.-M.K. wrote the manuscript; M.K., Y.-S.L. and T.-G.K. reviewed the manuscript and searched conventional studies; C.-Y.W. and J.Y. participated in research plan development and revised the manuscript. All authors have read and agreed to the published version of the manuscript.

Funding

This research received no external funding.

Institutional Review Board Statement

Not applicable.

Informed Consent Statement

Not applicable.

Data Availability Statement

Not applicable.

Acknowledgments

This work was supported by the Korea Institute of Energy Technology Evaluation and Planning (KETEP) and the Ministry of Trade, Industry and Energy (MOTIE) of the Republic of Korea (No. 2019381010001B).

Conflicts of Interest

The authors declare no conflict of interest.

References

  1. Atika, Q.; Fayaz, H.; Nasrudin, A.R.; Glenn, H.; Daniyal, A.; Khaled, S.; Khalid, H. Towards Sustainable Energy: A Systematic Review of Renewable Energy Sources, Technologies, and Public Opinions. IEEE Access 2019, 7, 63837–63851. [Google Scholar]
  2. Rajvikram, M.E.; Shafiullah, G.M.; Sanjeevikumar, P.; Nallapaneni, M.K.; Annapurna, A.; Ajayragavan, M.V.; Lucian, M.-P.; Jens, B.H.-N. A Comprehensive Review on Renewable Energy Development, Challenges, and Policies of Leading Indian States with an International Perspective. IEEE Access 2020, 8, 74432–74457. [Google Scholar]
  3. Ali, S.; Zheng, Z.; Aillerie, M.; Sawicki, J.-P.; Péra, M.-C.; Hissel, D. A Review of DC Microgrid Energy Management Systems Dedicated to Residential Applications. Energies 2021, 14, 4308. [Google Scholar] [CrossRef]
  4. European Commission. 2030 Climate & Energy Framework. Available online: https://Ec.Europa.Eu/Clima/Policies/Strategies/2030_en (accessed on 30 September 2020).
  5. REN21. Renewables 2021 Global Status Report; REN21 Secretariat: Paris, France, 2021; ISBN 978-3-948393-03-8. [Google Scholar]
  6. Ramon, Z.; Anurag, K.S. Controls for microgrids with storage: Review, challenges, and research needs. Renew. Sustain. Energy Rev. 2010, 14, 2009–2018. [Google Scholar]
  7. Asano, H.; Hatziargyriou, N.; Iravani, R.; Marnay, C. Microgrids: An overview of ongoing research, development, and demonstration projects. IEEE Power Energy Mag. 2007, 5, 78–94. [Google Scholar]
  8. Daniel, E.O.; Ali, M.-S.; Amir, H.E.; Claudio, A.C.; Reza, I.; Mehrdad, Z.; Amir, H.H.; Oriol, G.-B.; Maryam, S.; Rodrigo, P.B.; et al. Trends in Microgrid Control. IEEE Trans. Smart Grid 2014, 5, 1905–1919. [Google Scholar]
  9. Farzam, N.; Yun, W.L. Overview of Power Management Strategies of Hybrid AC/DC Microgird. IEEE Trans. Power Electron. 2015, 30, 7072–7089. [Google Scholar]
  10. Planas, E.; Andreu, J.; Gárate, J.I.; Martínez de Alegría, I.; Ibarra, E. AC and DC Technology in Microgrids: A Review. Renew. Sustain. Energy Rev. 2015, 43, 726–749. [Google Scholar] [CrossRef]
  11. Lie, X.; Dong, C. Control and Operation of a DC Microgrid with Variable Generation and Energy Storage. IEEE Trans. Power Deliv. 2011, 26, 2513–2522. [Google Scholar]
  12. Rajesh, K.S.; Dash, S.S.; Ragam, R.; Sridhar, R. A review on control of ac microgrid. Renew. Sustain. Energy Rev. 2017, 71, 814–819. [Google Scholar] [CrossRef]
  13. Poh, C.L.; Ding, L.; Yi, K.C.; Frede, B. Autonomous Operation of Hybrid Microgrid with AC and DC Subgrids. IEEE Trans. Power Electron. 2013, 28, 2214–2223. [Google Scholar]
  14. Liang, C.; Mohammad, S.; Ahmed, A.; Yusuf, A.-T. Hierarchical Coordination of a Community Microgrid with AC and DC Microgrids. IEEE Trans. Smart Grid 2015, 6, 3042–3051. [Google Scholar]
  15. Ajay, G.; Suryanarayana, D.; Kishore, C. Hybrid AC-DC Microgrid: Systematic Evaluation of Control Strategies. IEEE Trans. Smart Grid 2018, 9, 3830–3843. [Google Scholar]
  16. Javad, K.; Gerry, M. Simplified Hybrid AC-DC Microgrid with a Novel Interlinking Converter. IEEE Trans. Ind. Appl. 2020, 56, 5023–5034. [Google Scholar]
  17. Igualada, L.; Corchero, C.; Cruz-Zambrano, M.; Heredia, F. Optimal Energy Management for a Residential Microgrid Including a Vehicle-to-Grid System. IEEE Trans. Smart Grid 2014, 5, 2163–2172. [Google Scholar] [CrossRef] [Green Version]
  18. Arefifar, S.A.; Ordonez, M.; Mohamed, Y.A.-R.I. Energy Management in Multi-Microgrid Systems—Development and Assessment. IEEE Trans. Power Syst. 2017, 32, 910–922. [Google Scholar]
  19. Helal, S.A.; Najee, R.J.; Hanna, M.O.; Shaaban, M.F.; Osman, A.H.; Hassan, M.S. An Energy Management System for Hybrid Microgrids in Remote Communities. In Proceedings of the 2017 IEEE 30th Canadian Conference on Electrical and Computer Engineering (CCECE), Windsor, ON, Canada, 30 April–3 May 2017; pp. 1–4. [Google Scholar]
  20. Pascual, J.; Barricarte, J.; Sanchis, P.; Marroyo, L. Energy Management Strategy for a Renewable-Based Residential Microgrid with Generation and Demand Forecasting. Appl. Energy 2015, 158, 12–25. [Google Scholar] [CrossRef]
  21. Dragicevic, T.; Lu, X.; Vasquez, J.C.; Guerrero, J.M. DC Microgrids–Part I: A Review of Control Strategies and Stabilization Techniques. IEEE Trans. Power Electron. 2015, 31, 4876–4891. [Google Scholar] [CrossRef] [Green Version]
  22. Omid, P.; Kimmo, K. Hierarchical control structure in microgirds with distributed generation: Island and grid-connected mode. Renew. Sustain. Energy Rev. 2015, 44, 797–813. [Google Scholar]
  23. Meng, L.; Sanseverino, E.R.; Luna, A.; Dragicevic, T.; Vasquez, J.C.; Guerrero, J.M. Microgrid Supervisory Controllers and Energy Management Systems: A Literature Review. Renew. Sustain. Energy Rev. 2016, 60, 1263–1273. [Google Scholar] [CrossRef]
  24. Guerrero, J.M.; Vasquez, J.C.; Matas, J.; De Vicuna, L.G.; Castilla, M. Hierarchical Control of Droop-Controlled AC and DC Microgrids—A General Approach toward Standardization. IEEE Trans. Ind. Electron. 2011, 58, 158–172. [Google Scholar] [CrossRef]
  25. Boroyevich, D.; Cvetkovi’c, I.; Dong, D.; Burgos, R.; Wang, F.; Lee, F. Future electronic power distribution systems: A contemplative view. In Proceedings of the 2010 12th International Conference on Optimization of Electrical and Electronic Equipment, Basov, Romania, 20–22 May 2010; pp. 1369–1380. [Google Scholar]
  26. Parvizimosaed, M.; Farmani, F.; Anvari-Moghaddam, A. Optimal energy management of a micro-grid with renewable energy resources and demand response. J. Renew. Sustain. Energy. 2013, 5, 31–48. [Google Scholar] [CrossRef] [Green Version]
  27. Anvari-Moghaddam, A.; Seifi, A.; Niknam, T. Multi-Operation Management of a Typical Micro-Grids Using Particle Swarm Optimization: A Comparative Study. Renew. Sustain. Energy Rev. 2012, 16, 1268–1281. [Google Scholar] [CrossRef]
  28. Daniel, E.O.; Claudio, A.C.; Mehrdad, K. A centralized optimal energy management system for microgrids. In Proceedings of the 2011 IEEE Power and Energy Society General Meeting, Detroit, MI, USA, 24–28 July 2011; pp. 1–6. [Google Scholar]
  29. Marcin, D.; Christophe, M.; Ashwati, K.; Mel, S. Weather-based solar energy prediction. In Proceedings of the 2012 IEEE International Conference on Fuzzy Systems, Brisbane, Australia, 10–15 June 2012; pp. 1–7. [Google Scholar]
  30. Davide, C.; Francesco, G.; Marco, M.; Riccardo, E.Z. Photovoltaic Plants Predictive Model by means of ANN trained by a Hybrid Evolutionary Algorithm. In Proceedings of the 2010 International Joint Conference on Neural Networks (IJCNN), Barcelona, Spain, 18–23 July 2010; pp. 1–6. [Google Scholar]
  31. Bo, Z.; Xiangjin, W.; Da, L.; Dadison, M.C.; Julia, C.M.; Ruwen, Q.; Caisheng, W. Energy Management of Multiple Microgrids Based on a System of Systems Architecture. IEEE Trans. Power Syst. 2018, 33, 6410–6421. [Google Scholar]
  32. Raymond, H.B.; Tu, A.N.; David, A.C.; Babu, R.C.; Imre, G. Energy Management and Optimization Methods for Grid Energy Storage Systems. IEEE Access 2018, 6, 13231–13260. [Google Scholar]
  33. Lee, H.; Kang, J.-W.; Choi, B.-Y.; Kang, K.-M.; Kim, M.-N.; An, C.-G.; Yi, J.; Won, C.-Y. Energy Management System of DC Microgrid in Grid-Connected and Stand-Alone Modes: Control, Operation and Experimental Validation. Energies 2021, 14, 581. [Google Scholar] [CrossRef]
  34. Berardi, U.; Tomassoni, E.; Khaled, K. A Smart Hybrid Energy System Grid for Energy Efficiency in Remote Areas for the Army. Energies 2020, 13, 2279. [Google Scholar] [CrossRef]
  35. Ouédraogo, S.; Faggianelli, G.A.; Pigelet, G.; Duchaud, J.-L.; Notton, G. Application of Optimal Energy Management Strategies for a Building Powered by PV/Battery System in Corsica Island. Energies 2020, 13, 4510. [Google Scholar] [CrossRef]
  36. Corrêa, F.C.; Eckert, J.J.; Silva, L.C.; Martins, M.; Baroncini, V.; Santiciolli, F.M.; Gonçalves, C.; Dedini, G.F. Rule-based Control and Fuzzy Control for Power Management Strategies for Hybrid Vehicles. In Proceedings of the 2020 IEEE Colombian Conference on Applications of Computational Intelligence (IEEE ColCACI 2020), Cali, Colombia, 7–8 August 2020; pp. 1–6. [Google Scholar]
Figure 1. Classification of microgrids according to distribution network configuration (a) DC microgrid, (b) AC microgrid, (c) hybrid AC/DC microgrid.
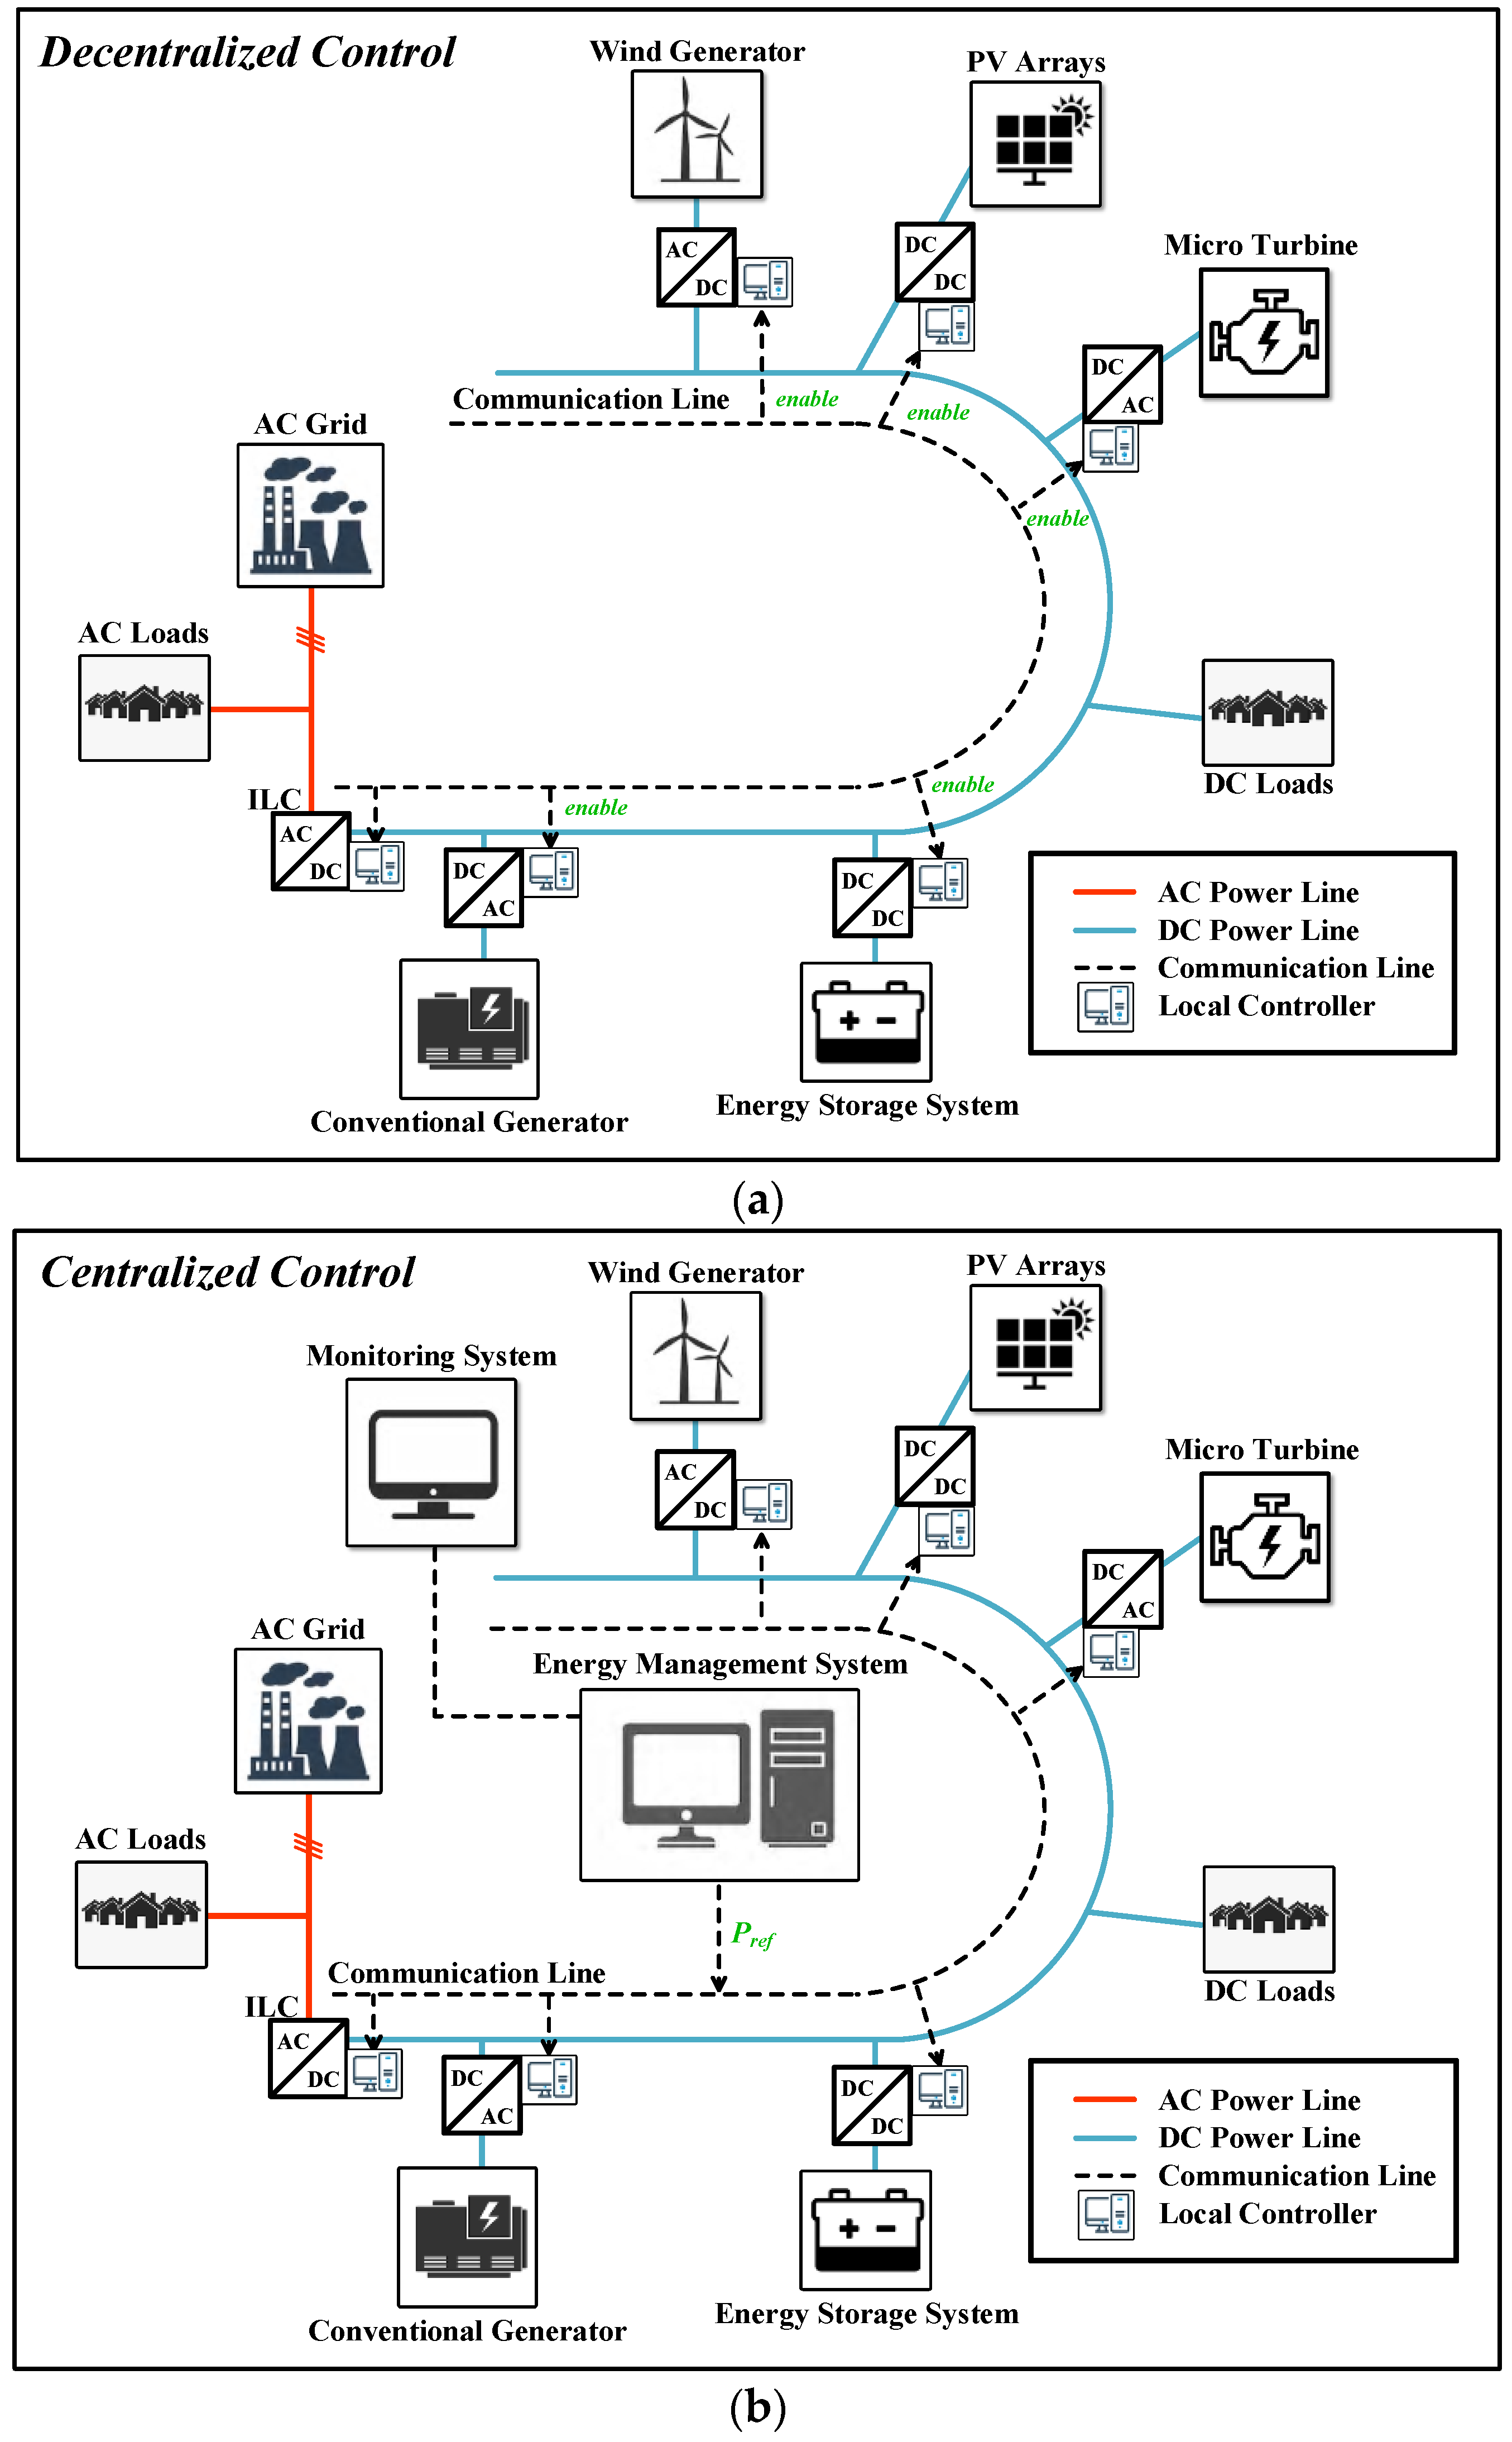
Electronics 10 01939 g001
Figure 2. Two types of control structure for EMSs (a) decentralized control, (b) centralized control.
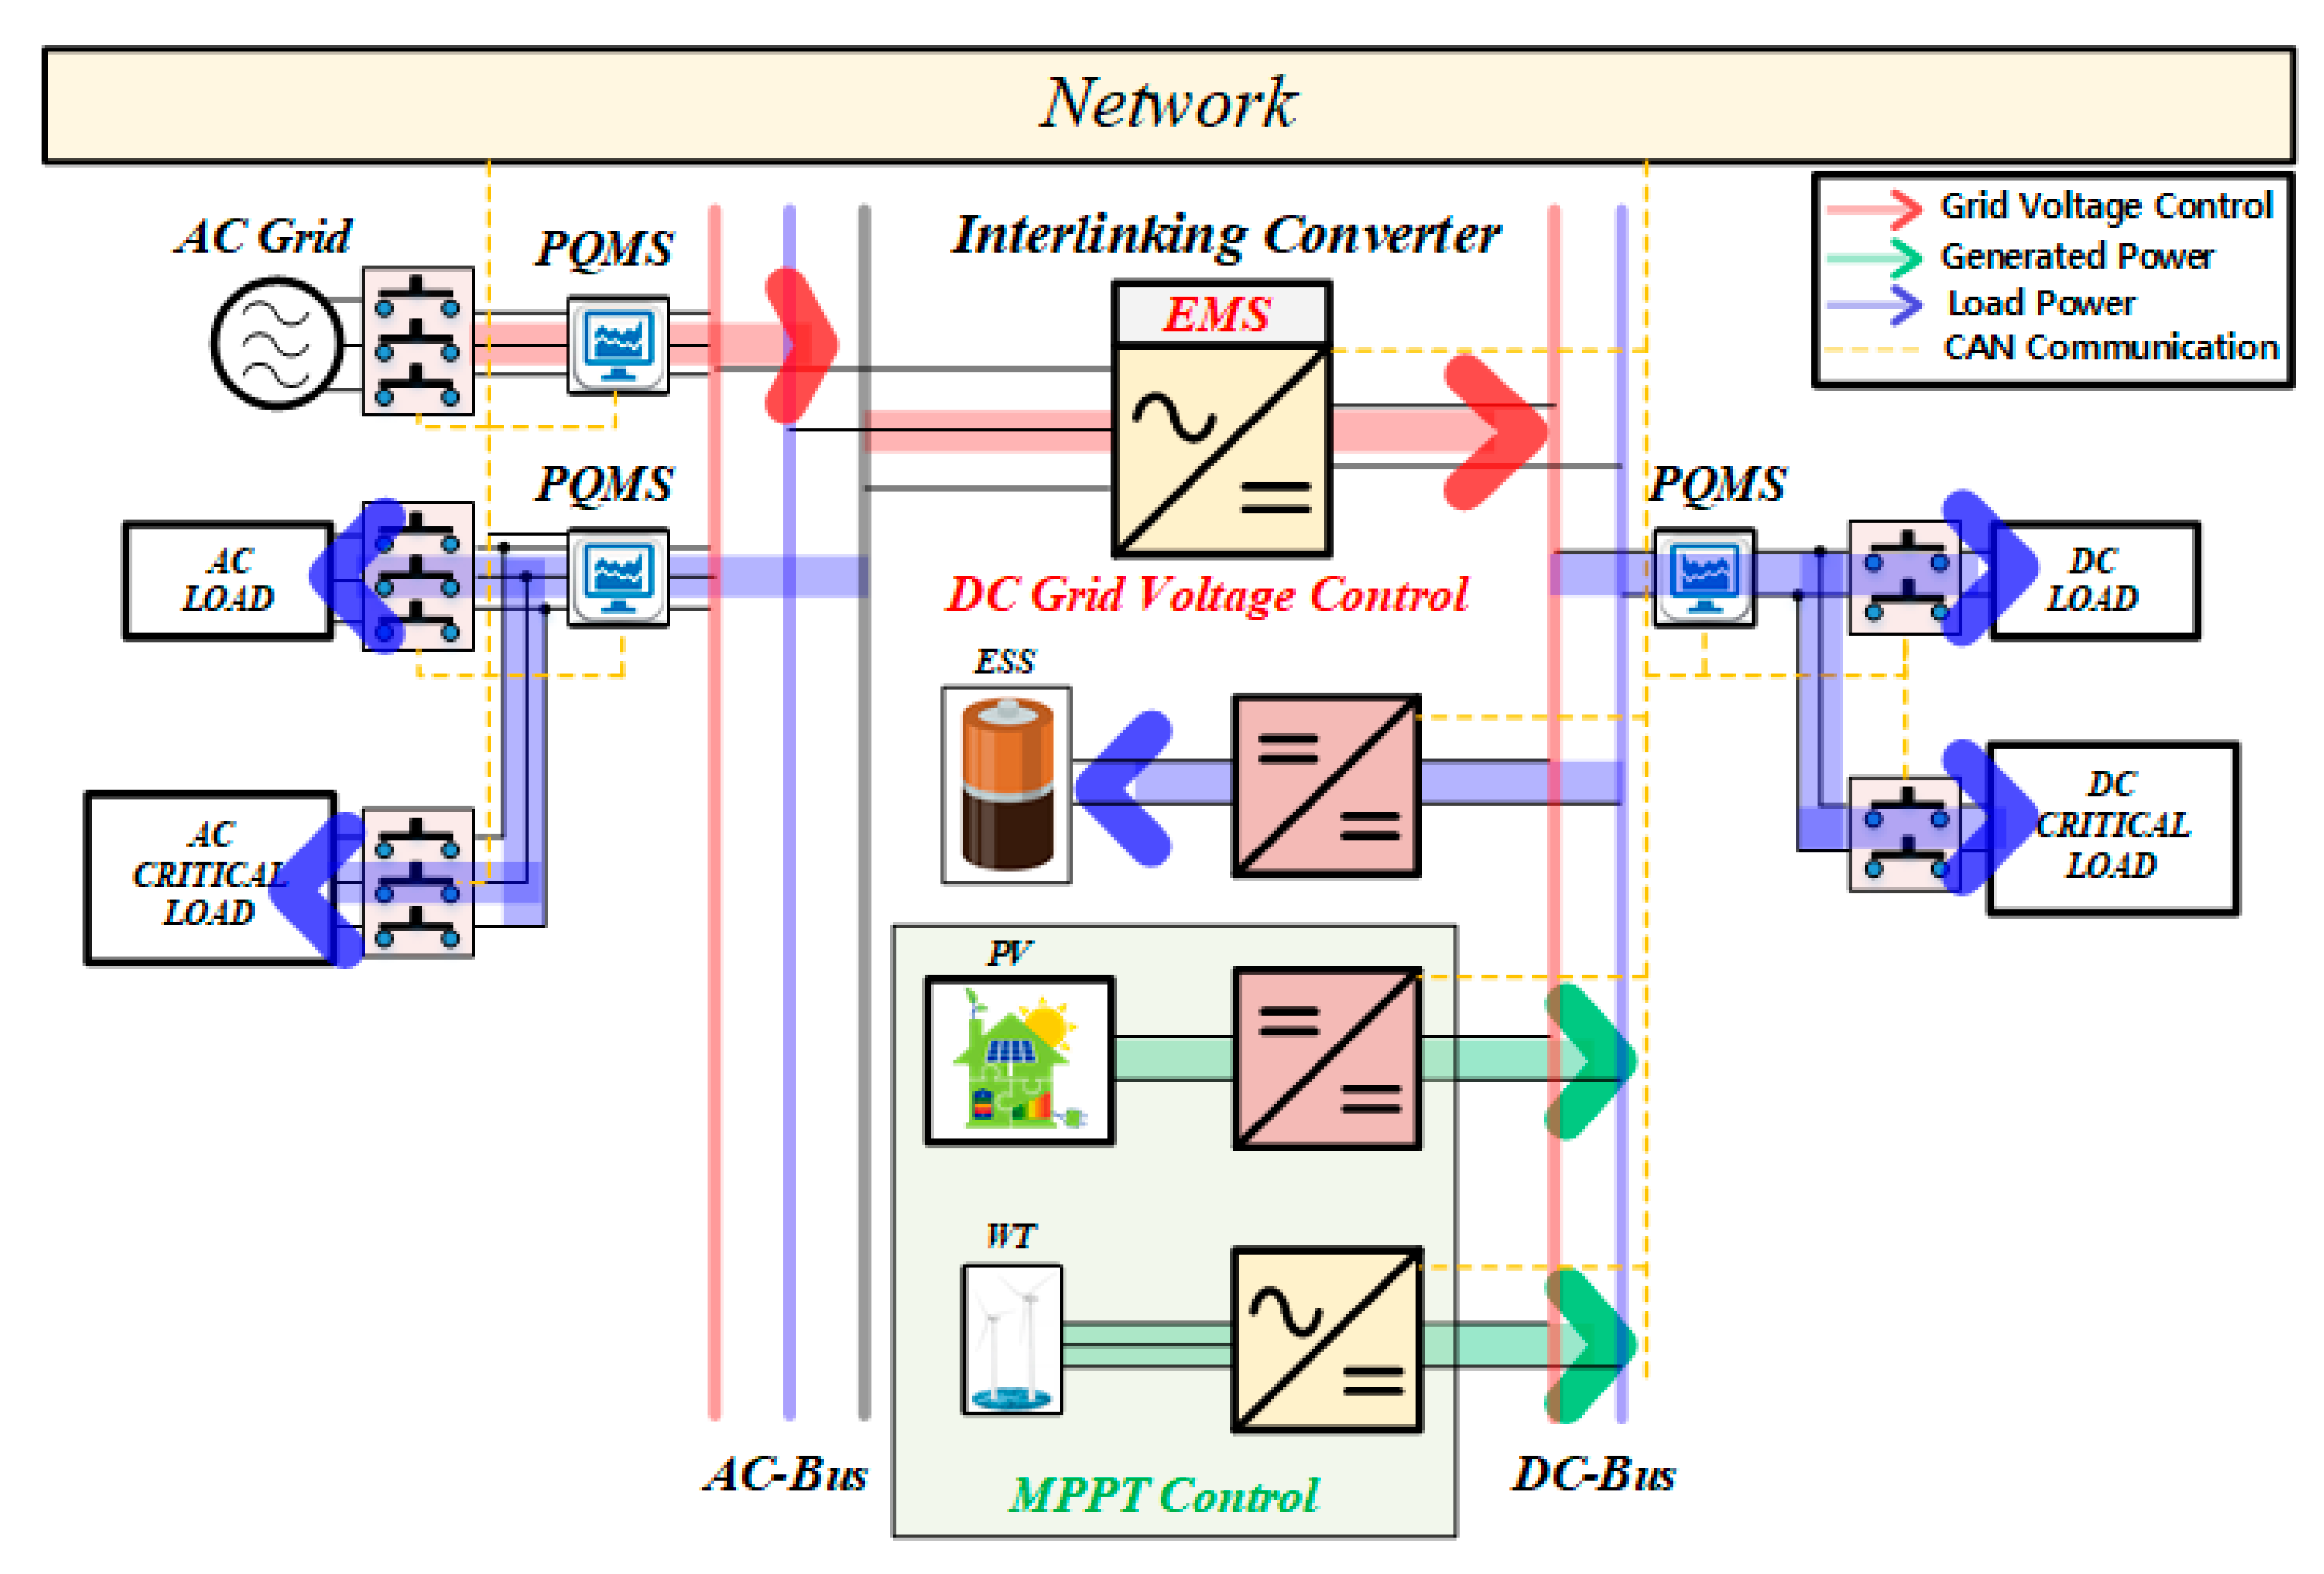
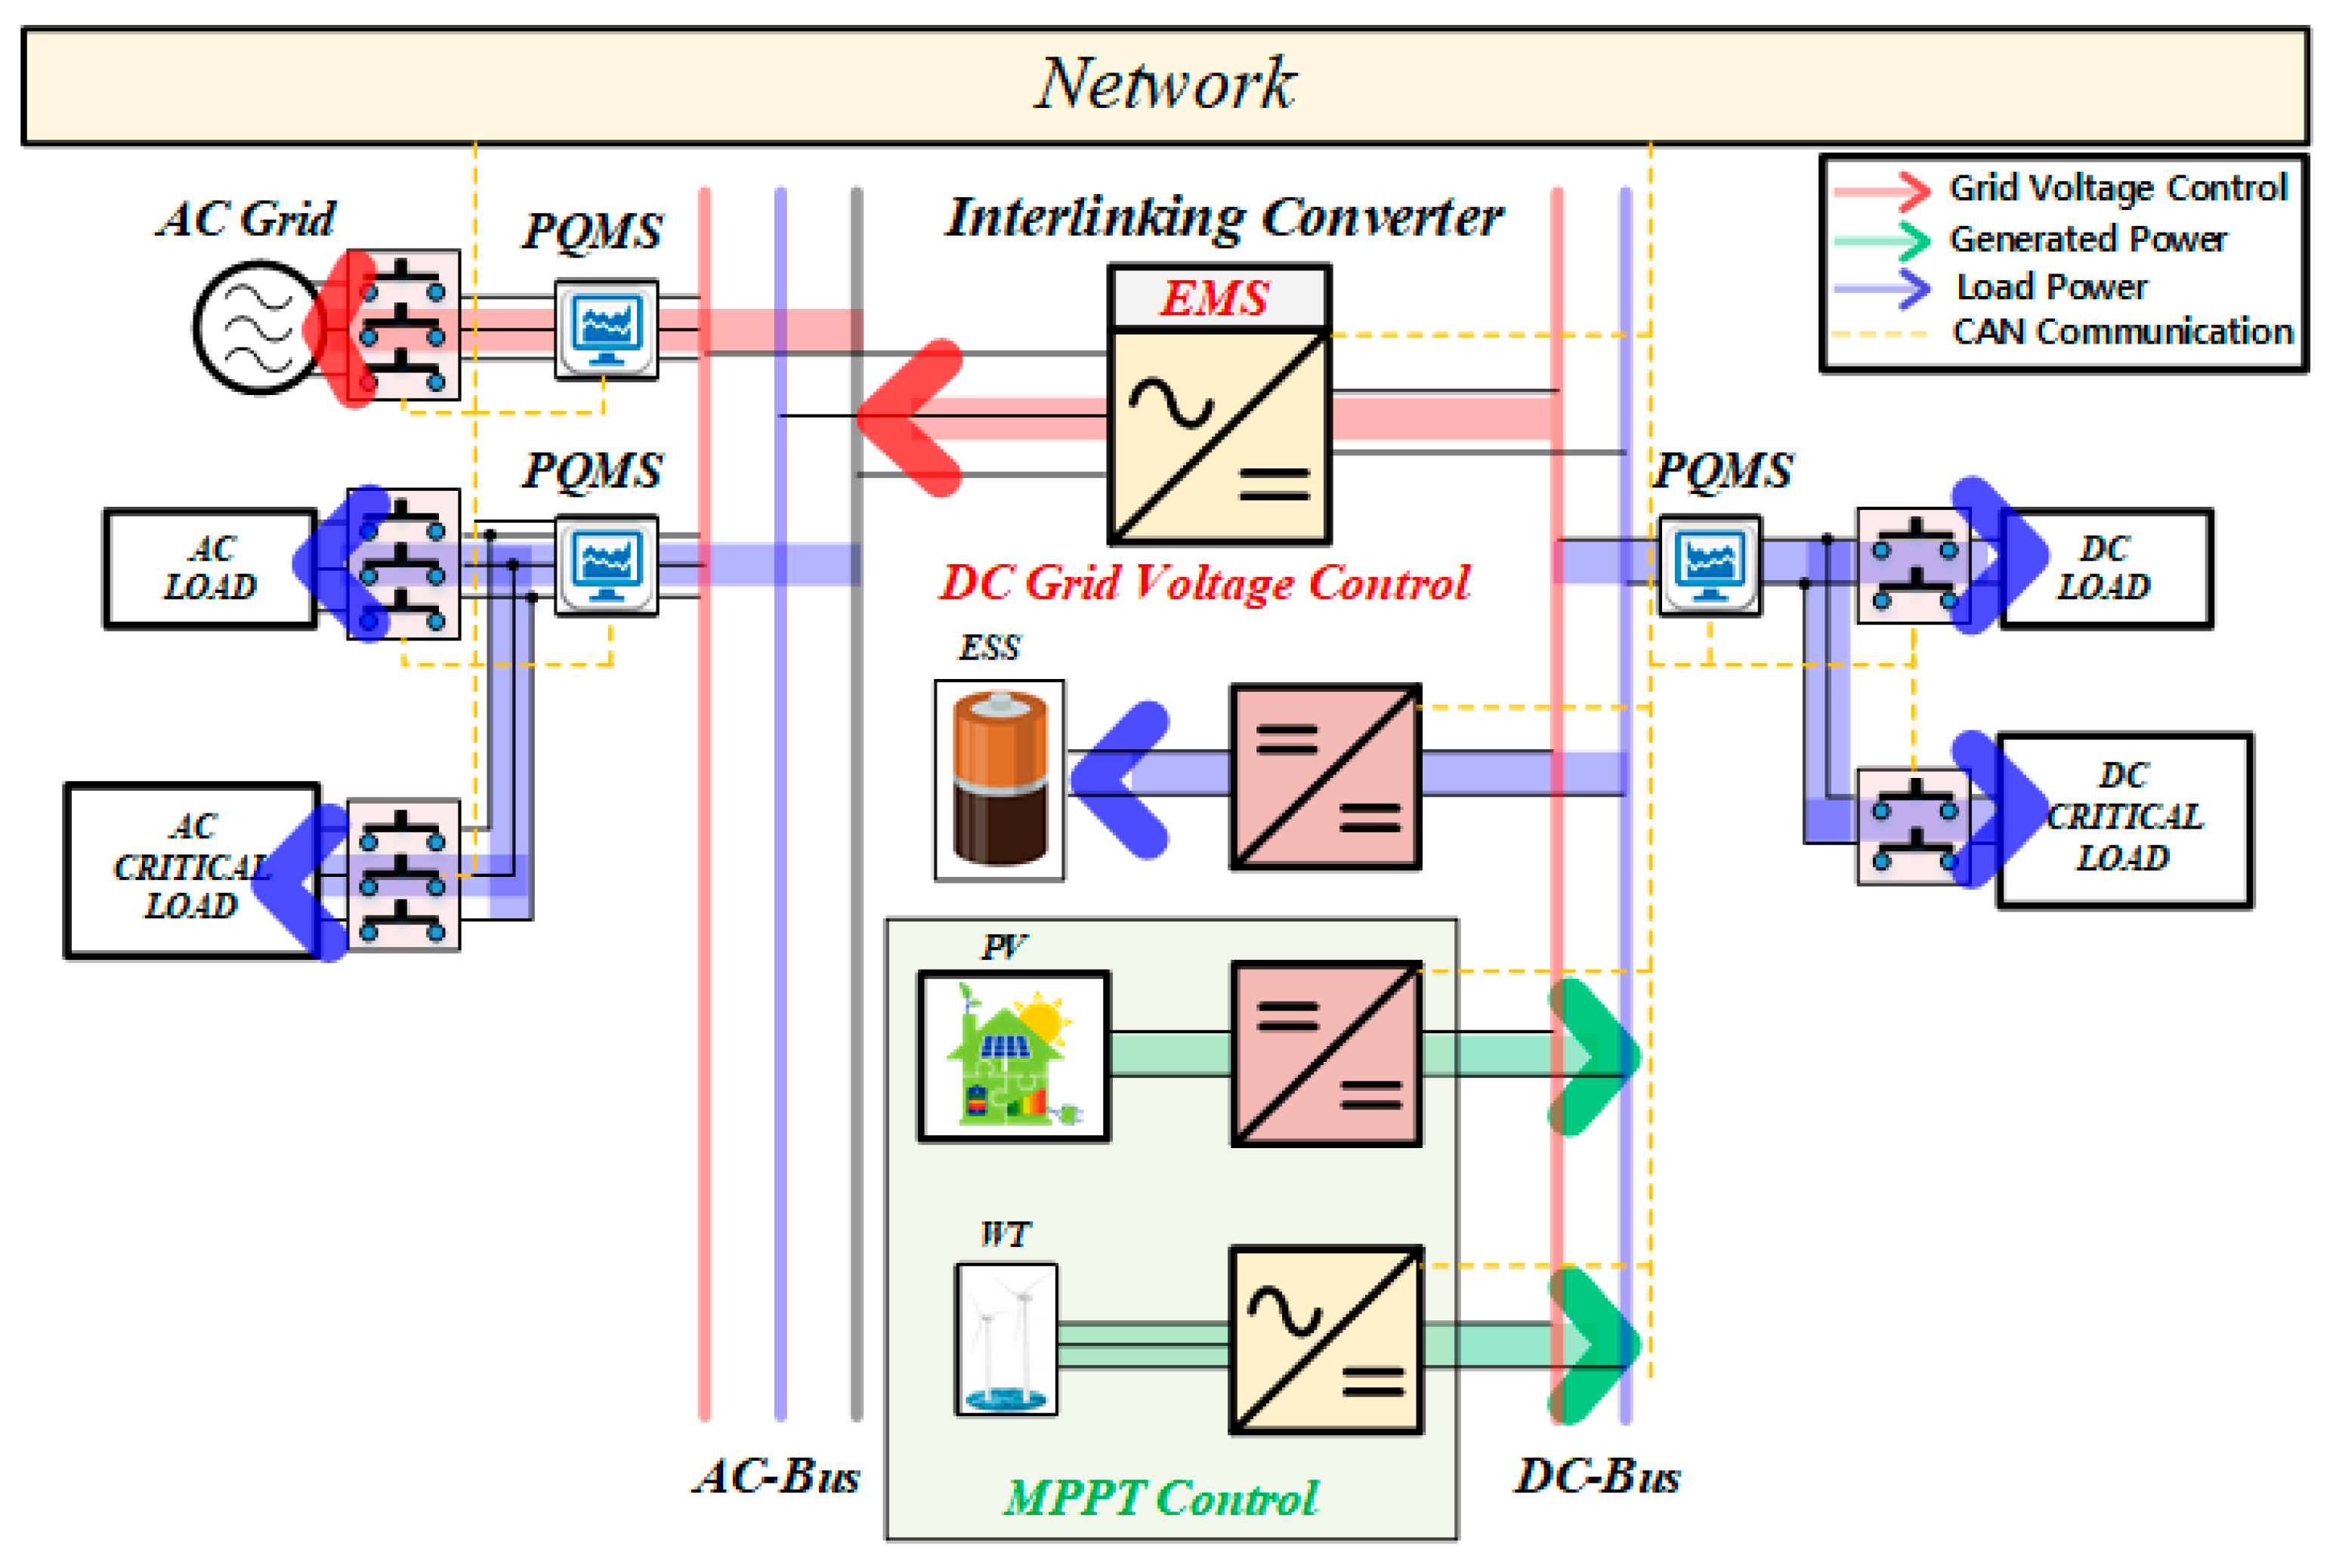
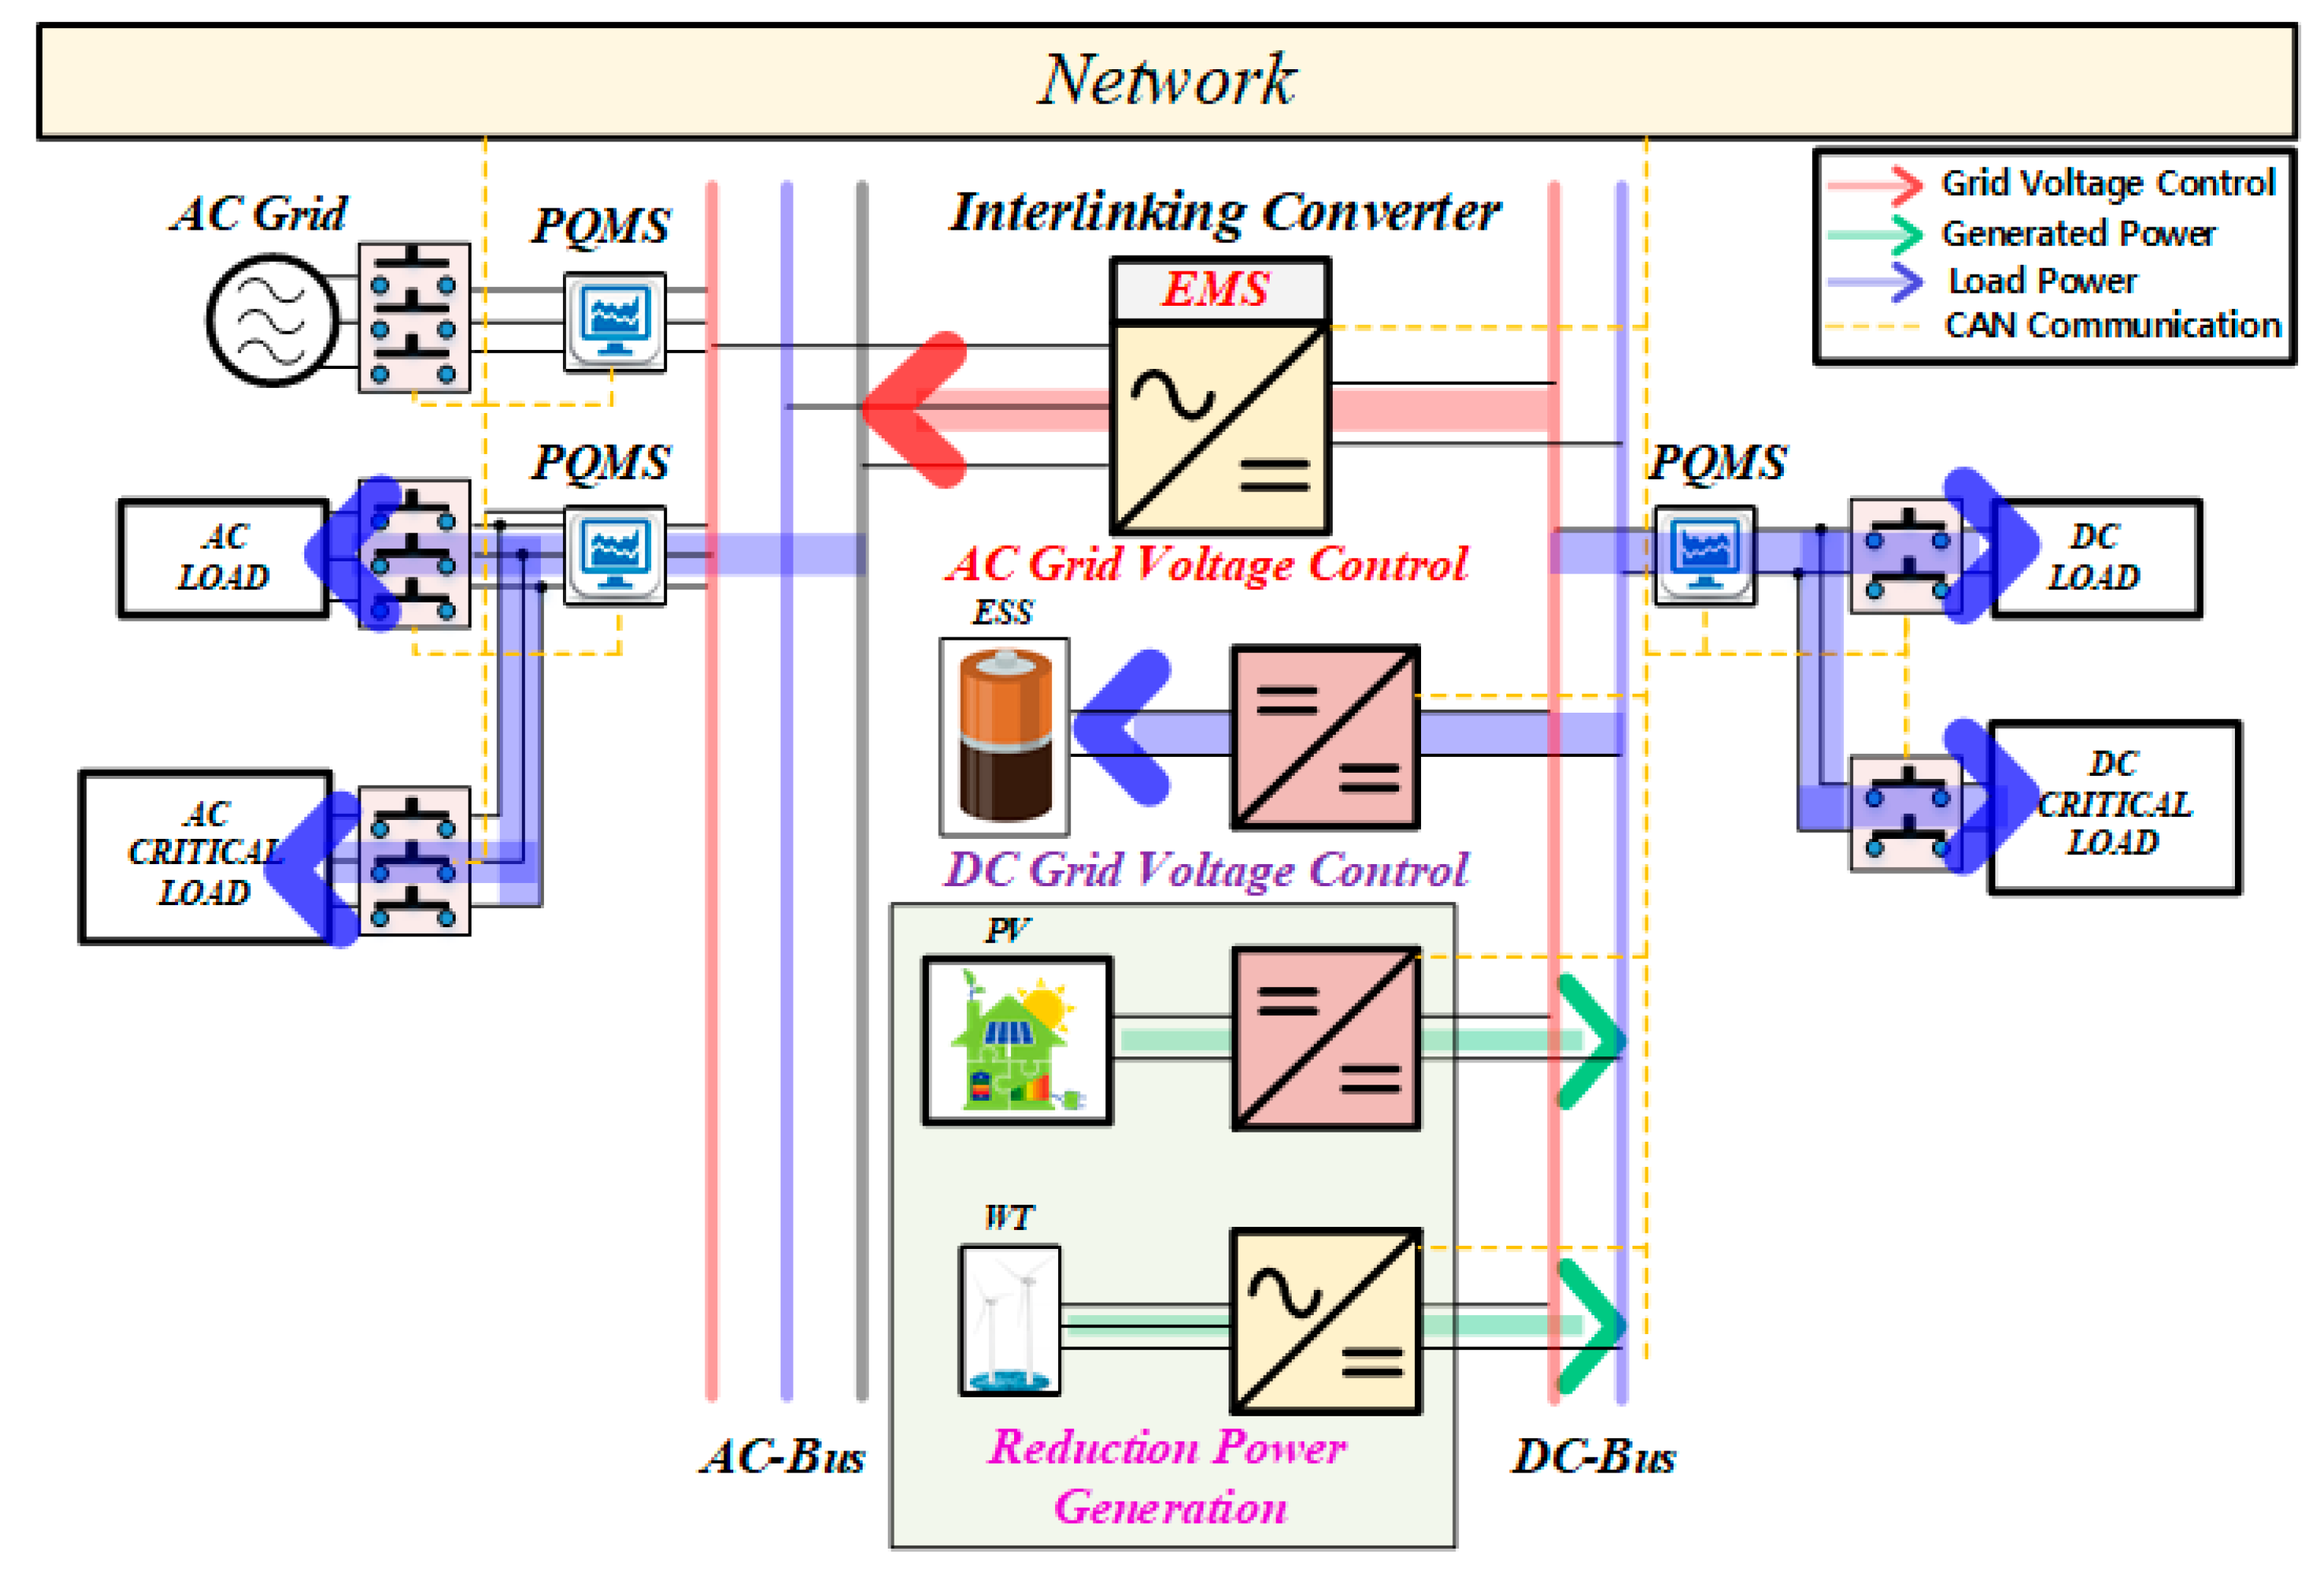
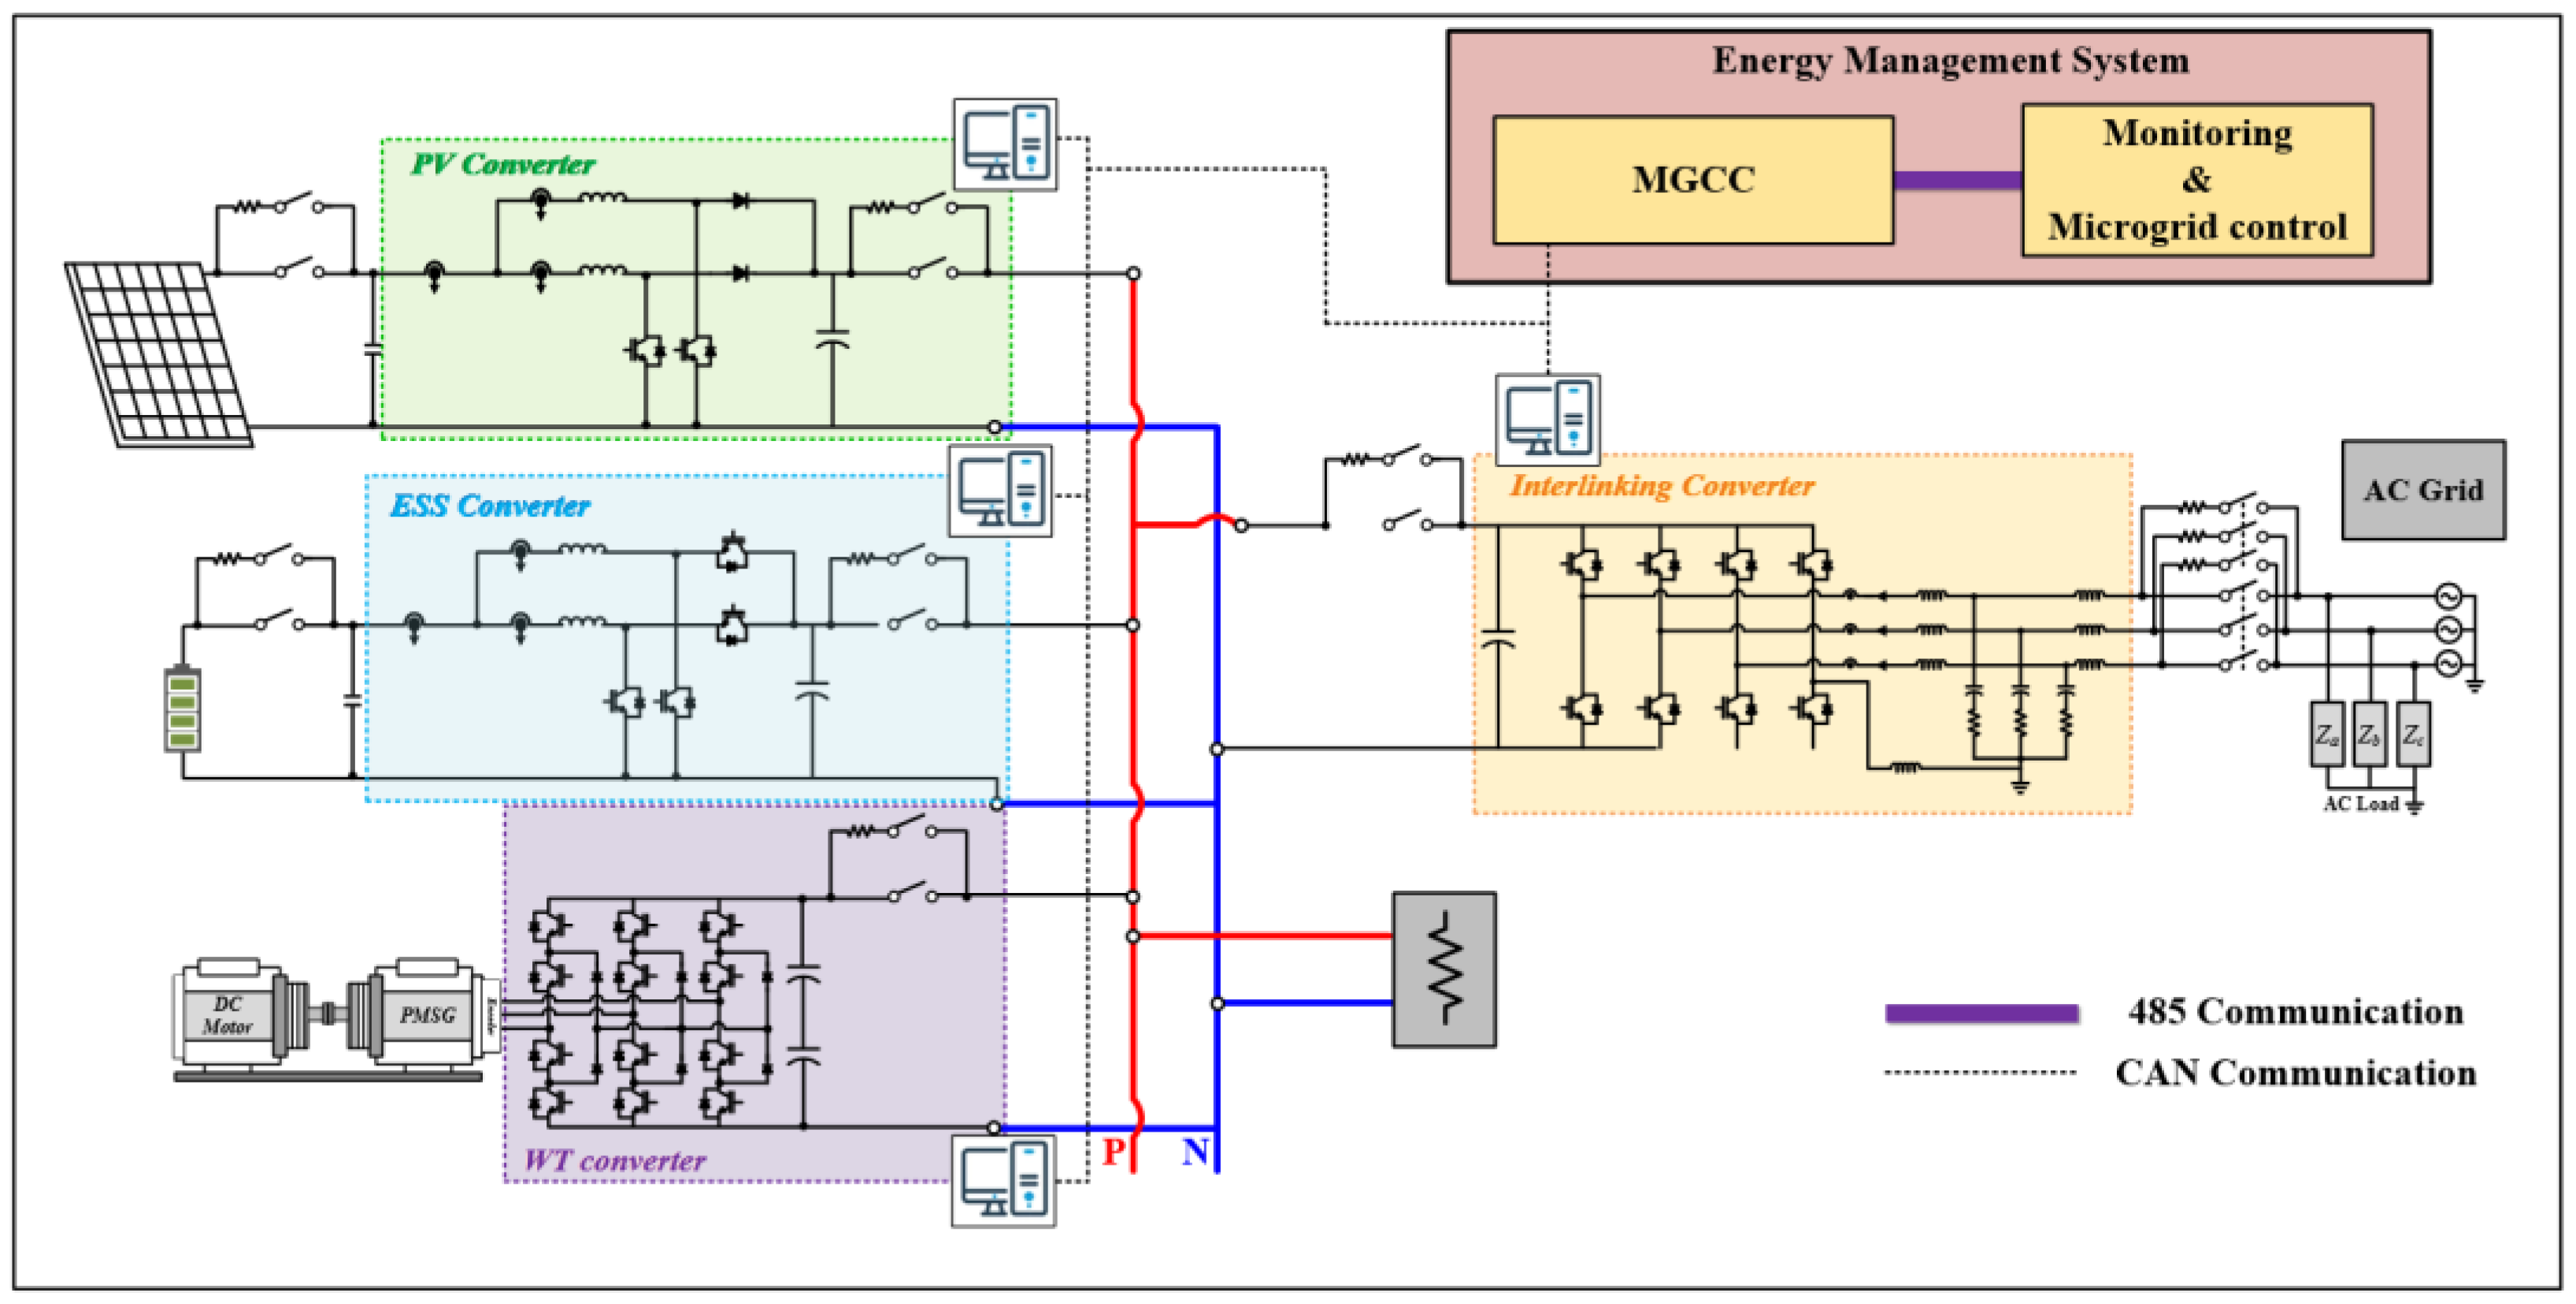
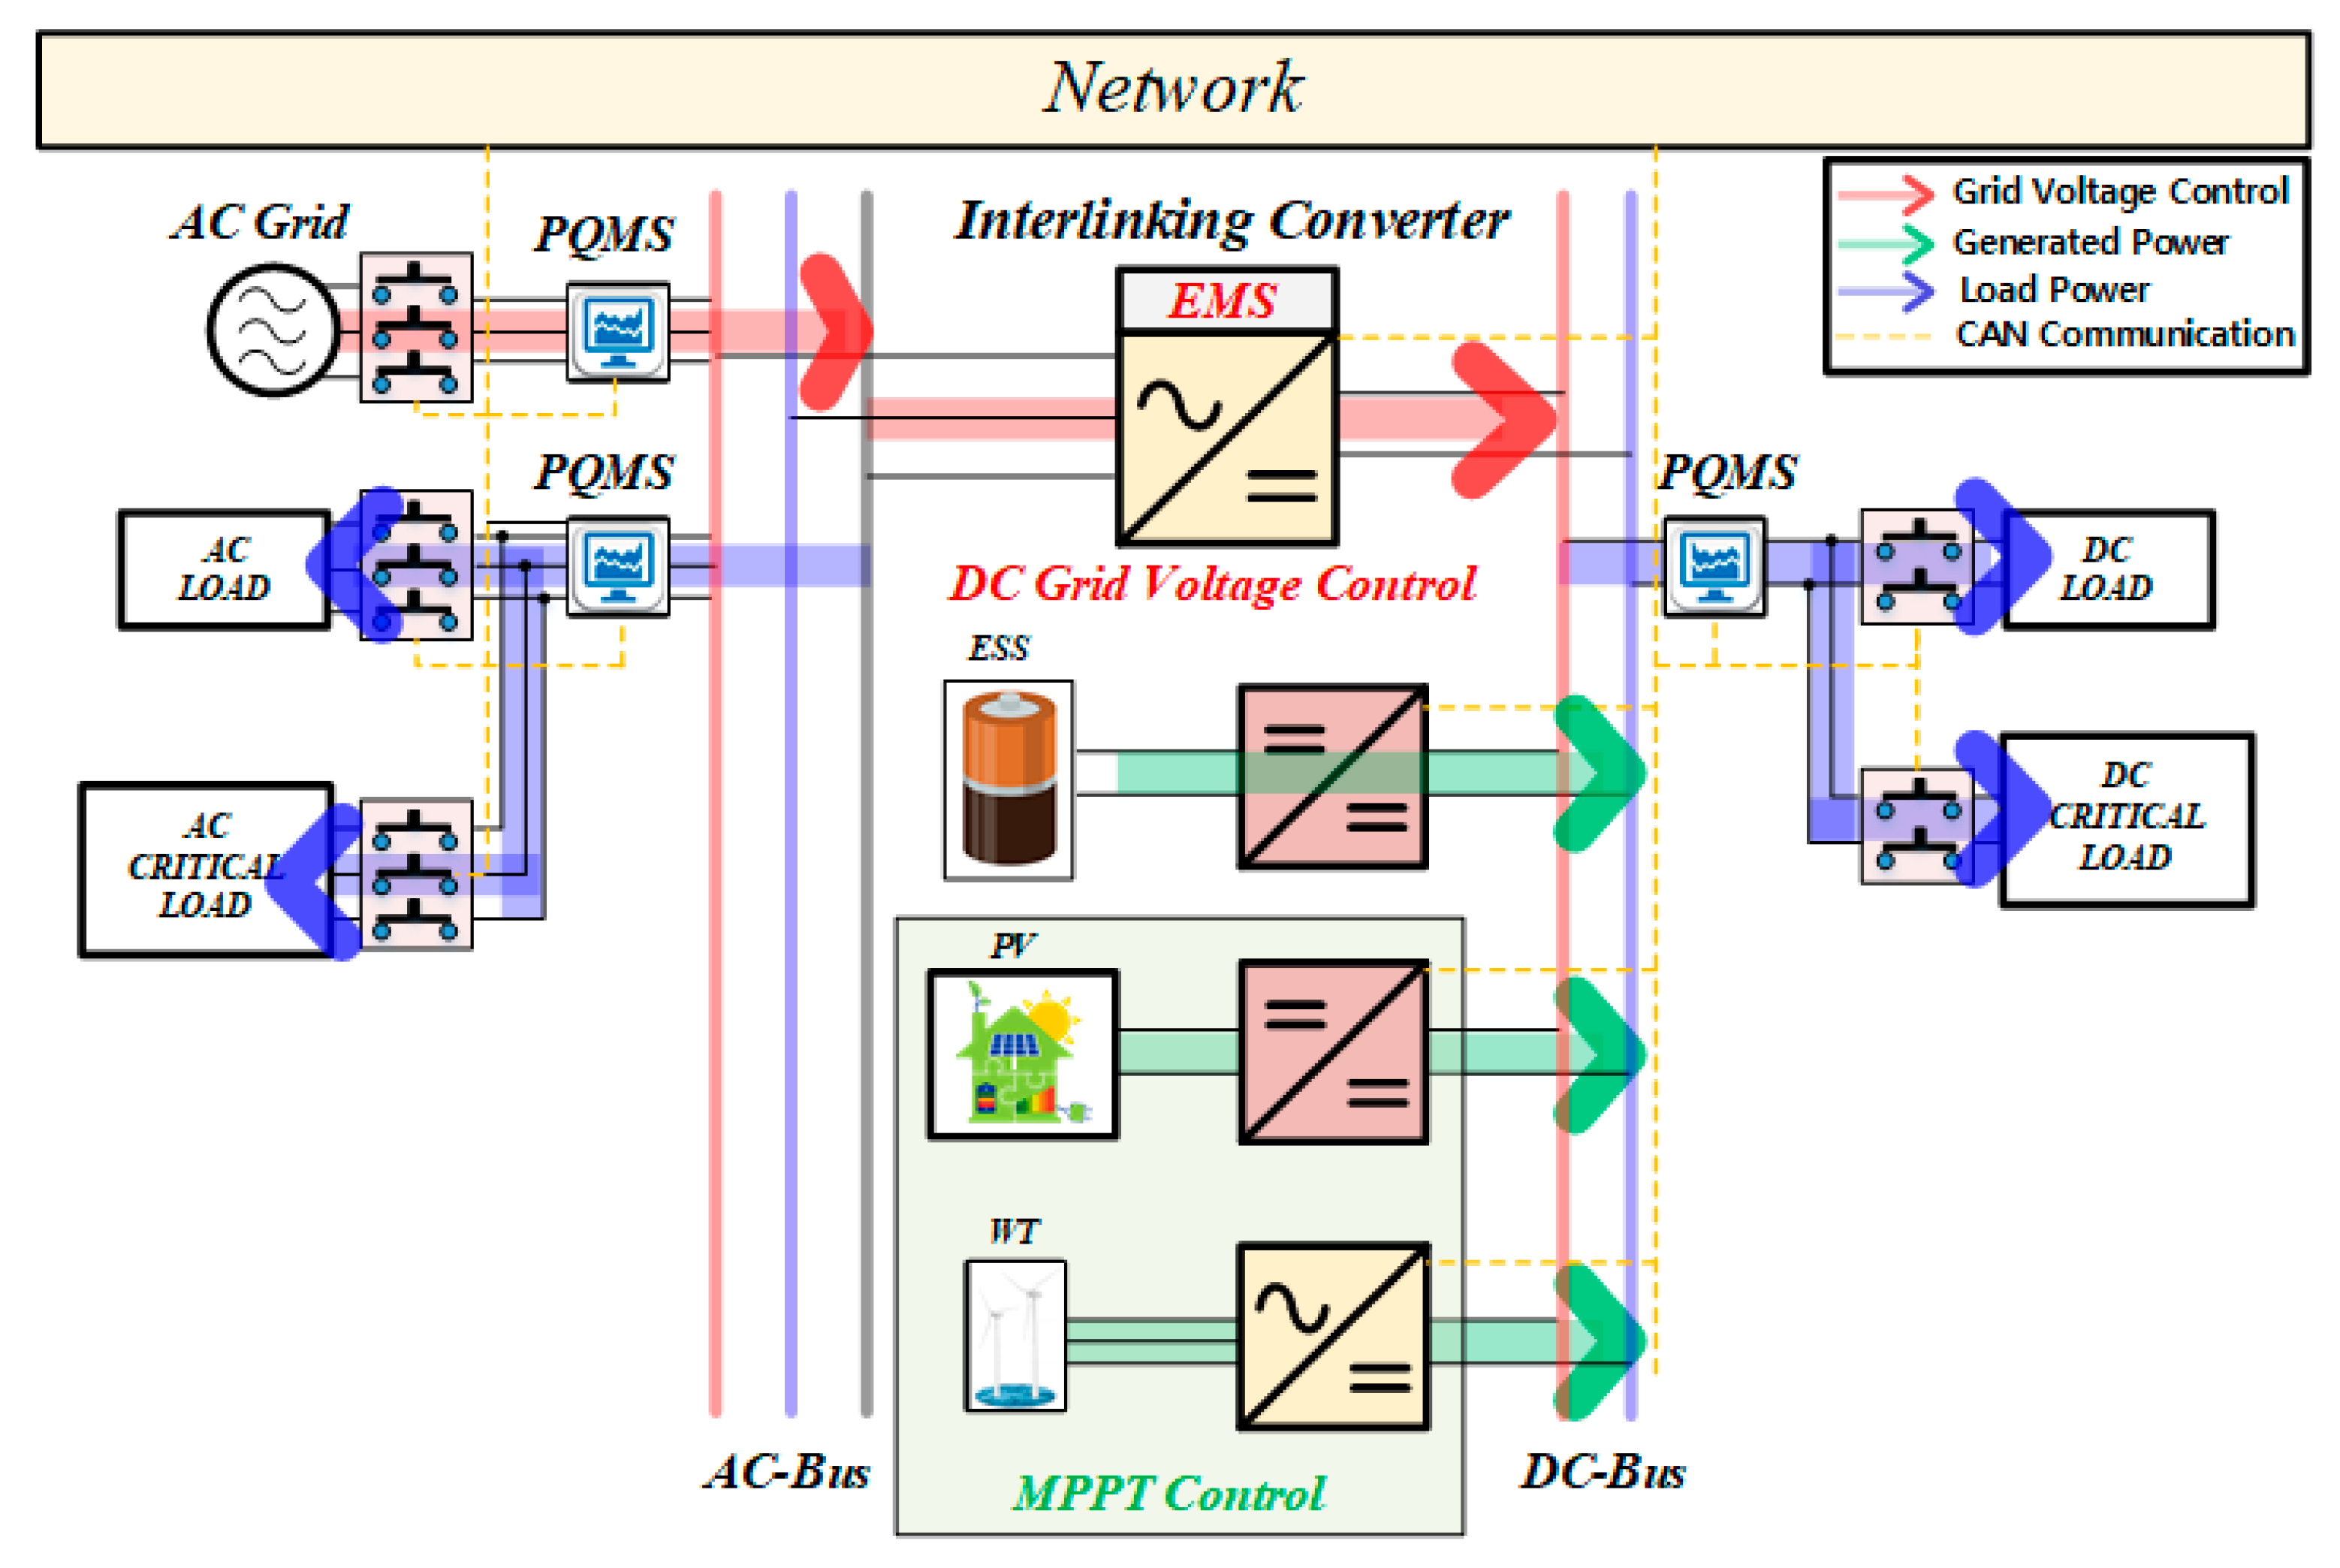
Electronics 10 01939 g002
Figure 3. Configuration diagram of hybrid AC/DC distribution network.
Electronics 10 01939 g003
Figure 4. Hierarchical control structure of the proposed EMS and control block diagram of each power converter.
Electronics 10 01939 g004
Figure 5. Flowchart of the proposed EMS.
Electronics 10 01939 g005
Figure 6. Configuration of the proposed ANN.
Electronics 10 01939 g006
Figure 7. Power flow diagram of ESS charge mode (mode 1).
Electronics 10 01939 g007
Figure 8. Power flow diagram of the power regeneration mode (mode 2).
Electronics 10 01939 g008
Figure 9. Power flow diagram of the ESS discharge mode (mode 3).
Electronics 10 01939 g009
Figure 10. Power flow diagram of the stand-alone mode (mode 4).
Electronics 10 01939 g010
Figure 11. Power flow diagram of the RP mode (mode 5).
Electronics 10 01939 g011
Figure 12. Power flow diagram of the load shedding mode (mode 6).
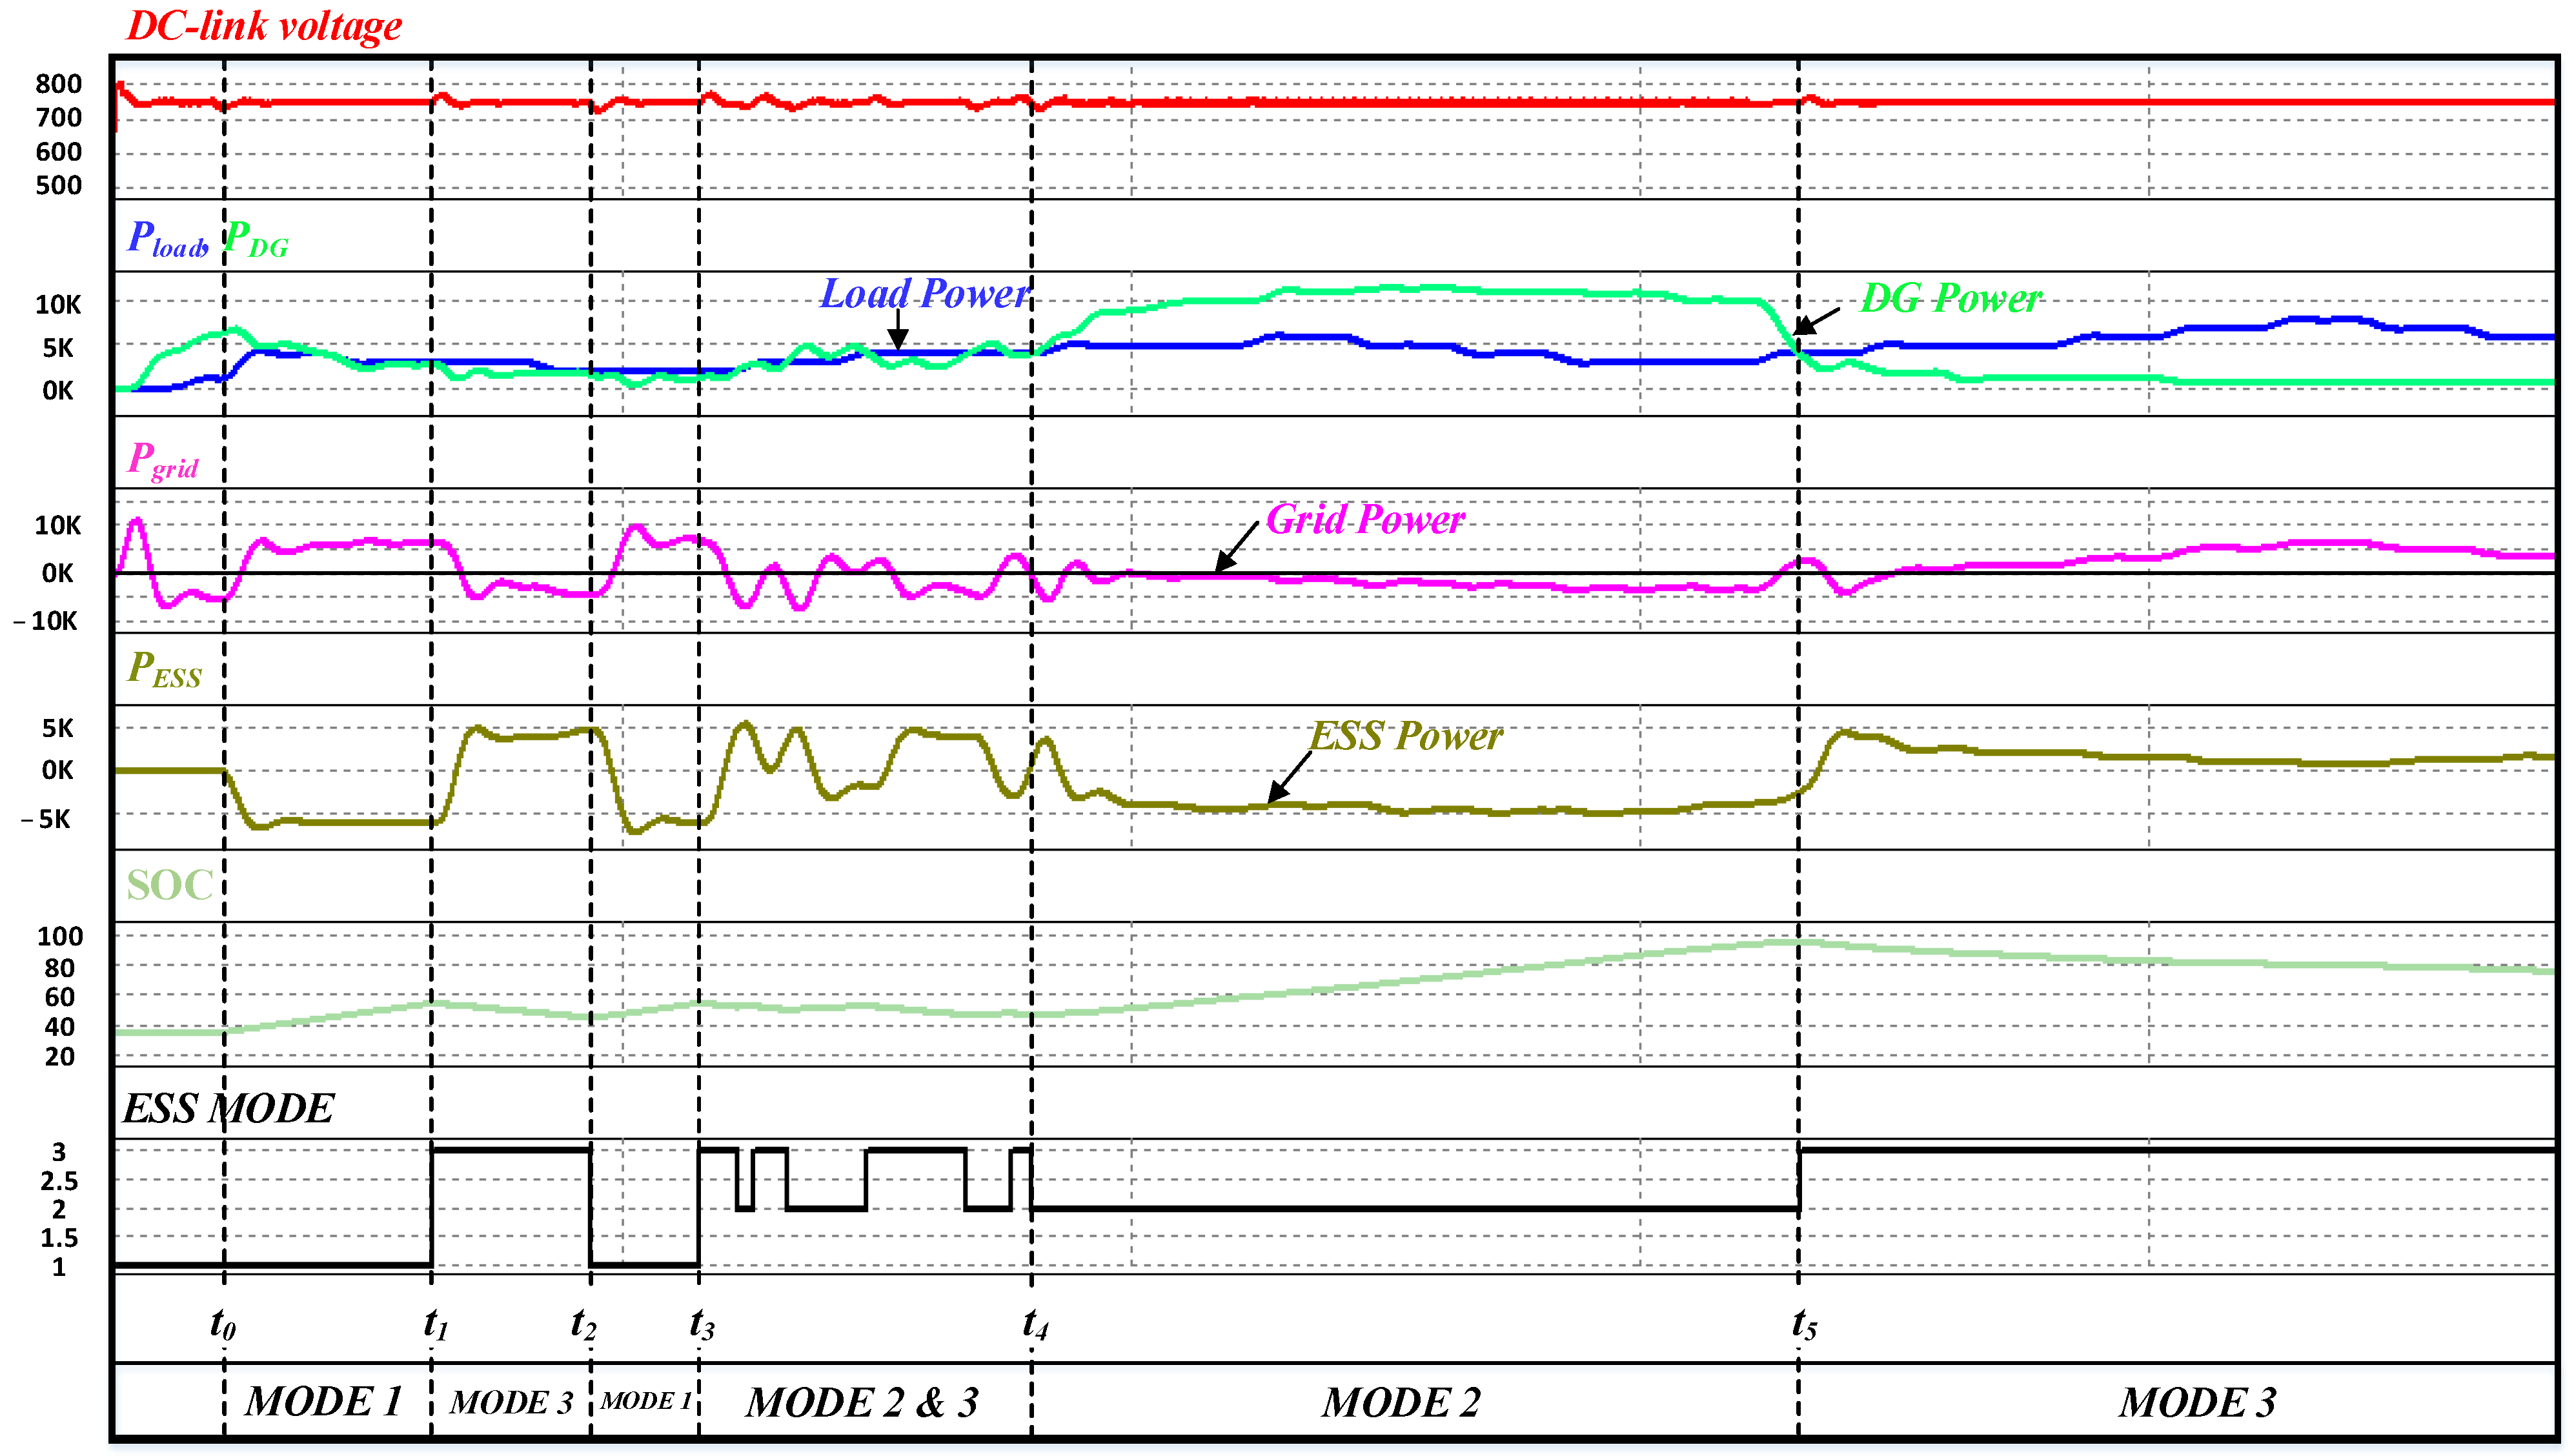
Electronics 10 01939 g012
Figure 13. Simulation results of ANN training (a) ESS charge mode, (b) power regeneration mode, (c) ESS discharge mode.
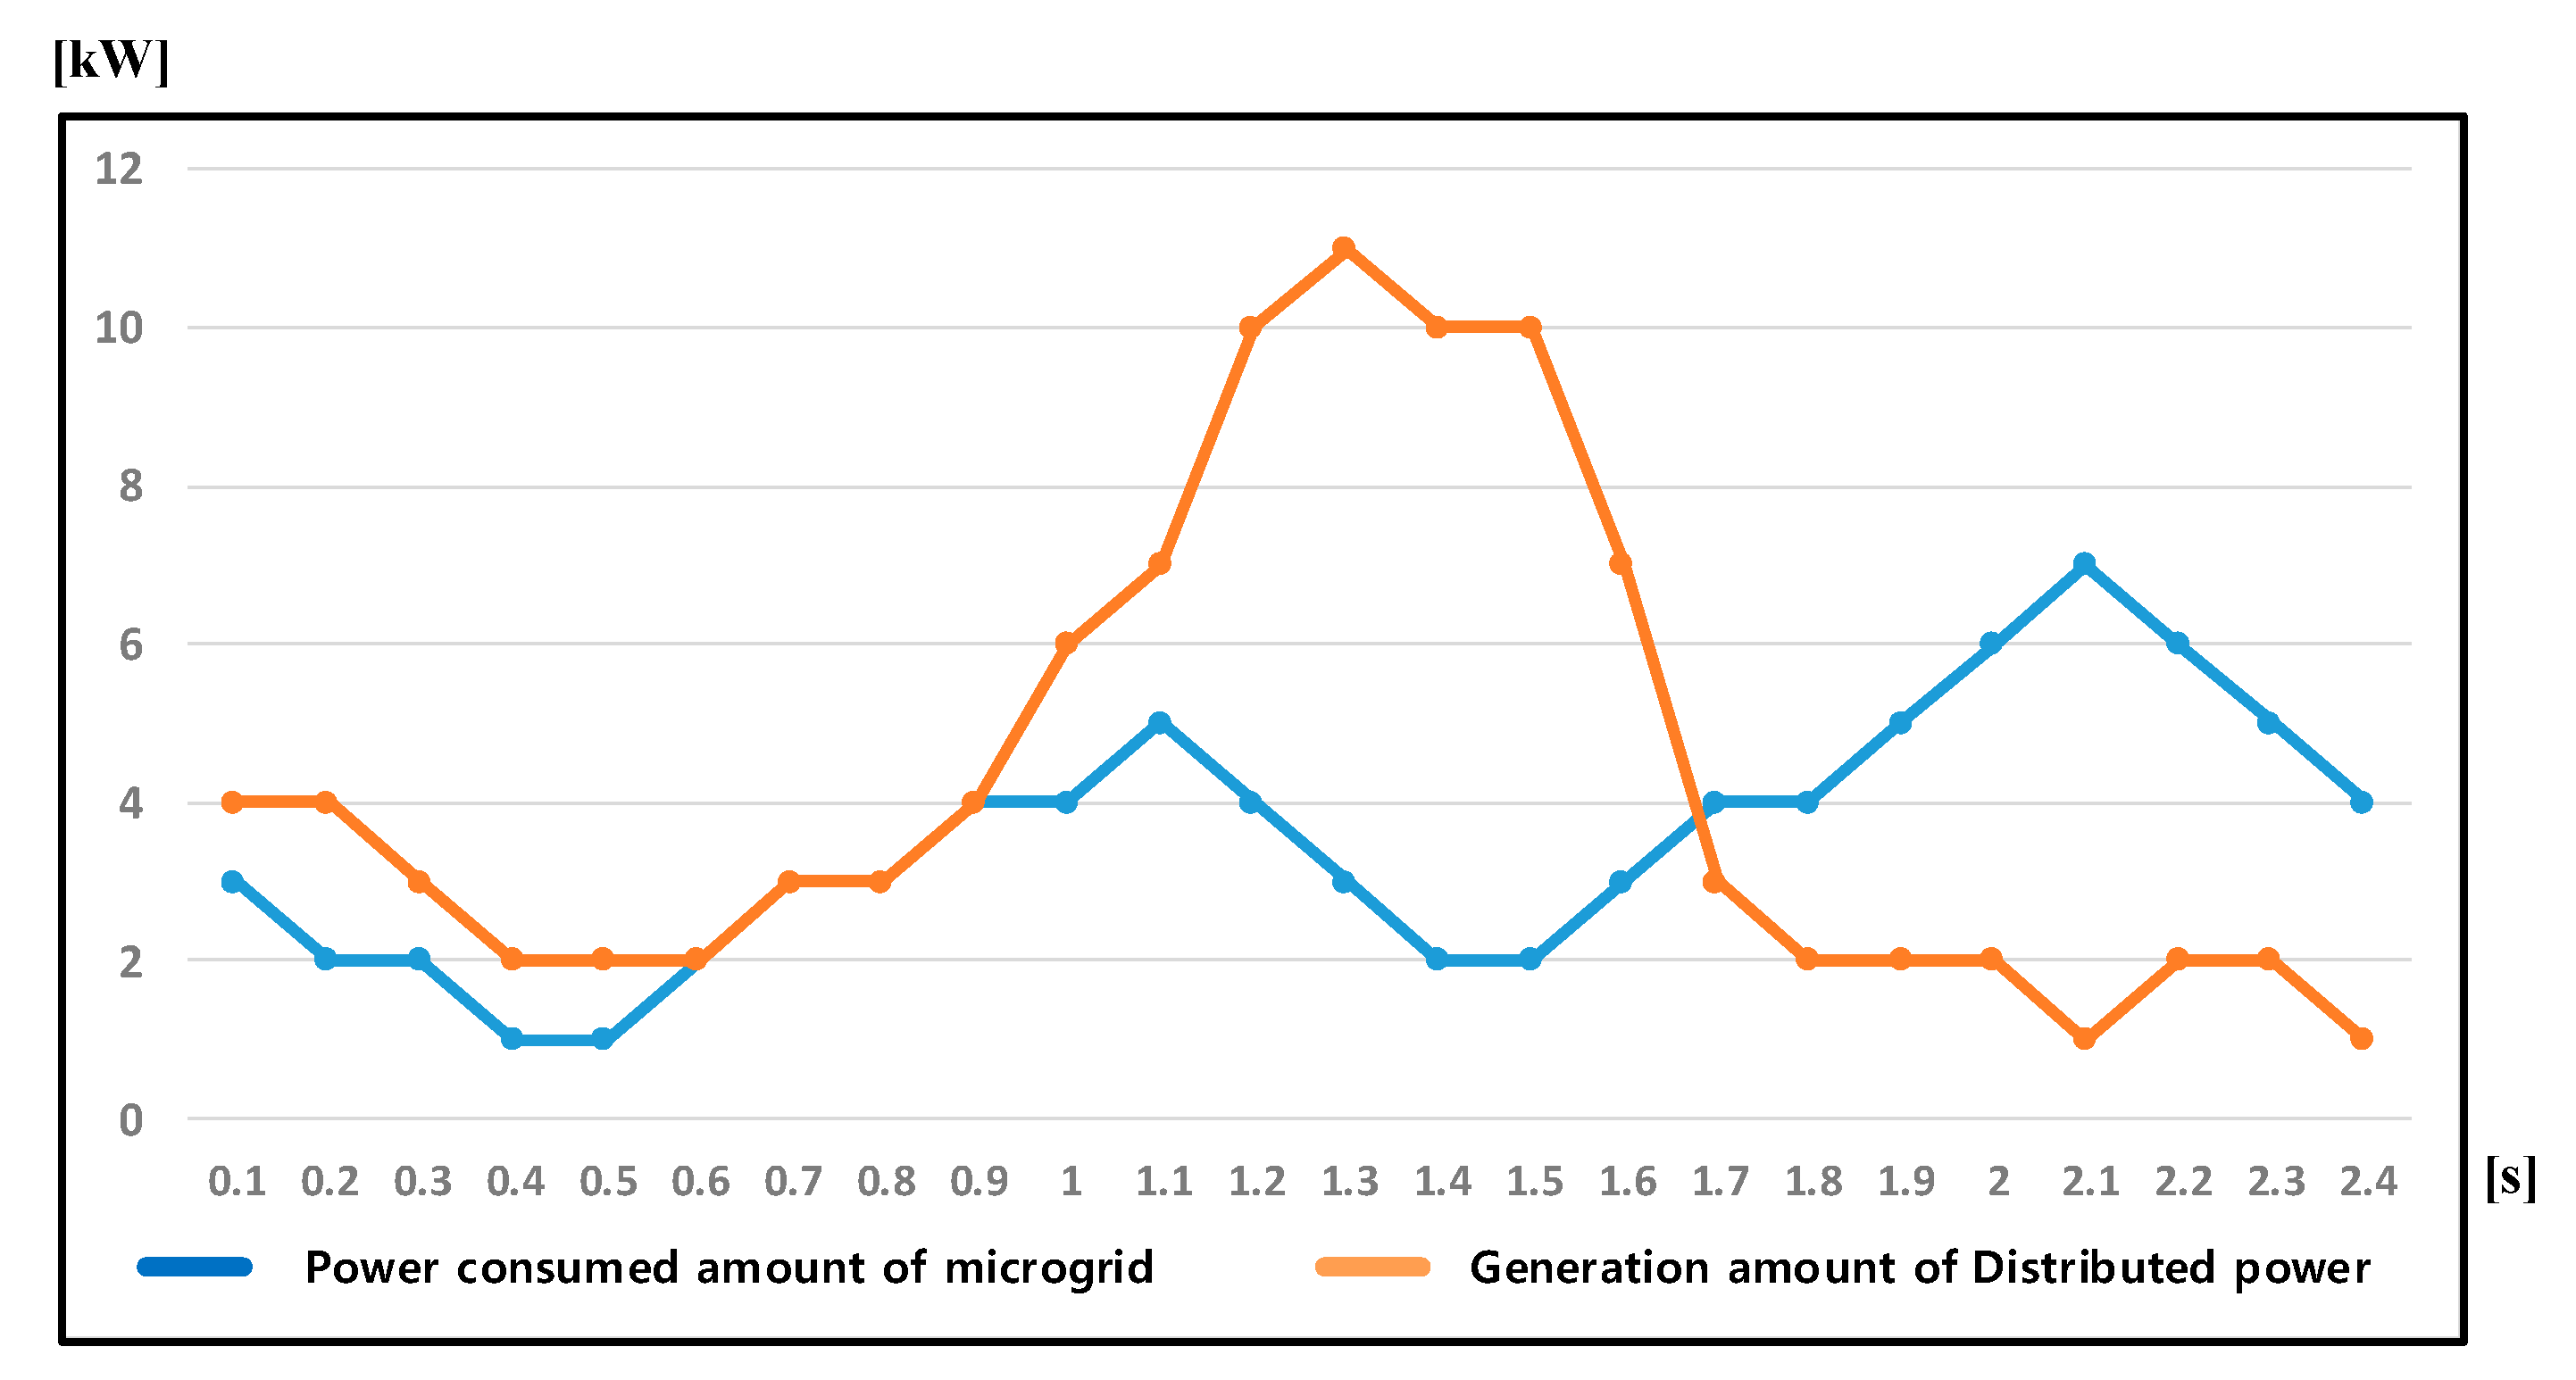
Electronics 10 01939 g013
Figure 14. Load pattern and distributed power generation amount in reference to time applied to simulation.
Electronics 10 01939 g014
Figure 15. Simulation result of EMS when applying ANN theory.
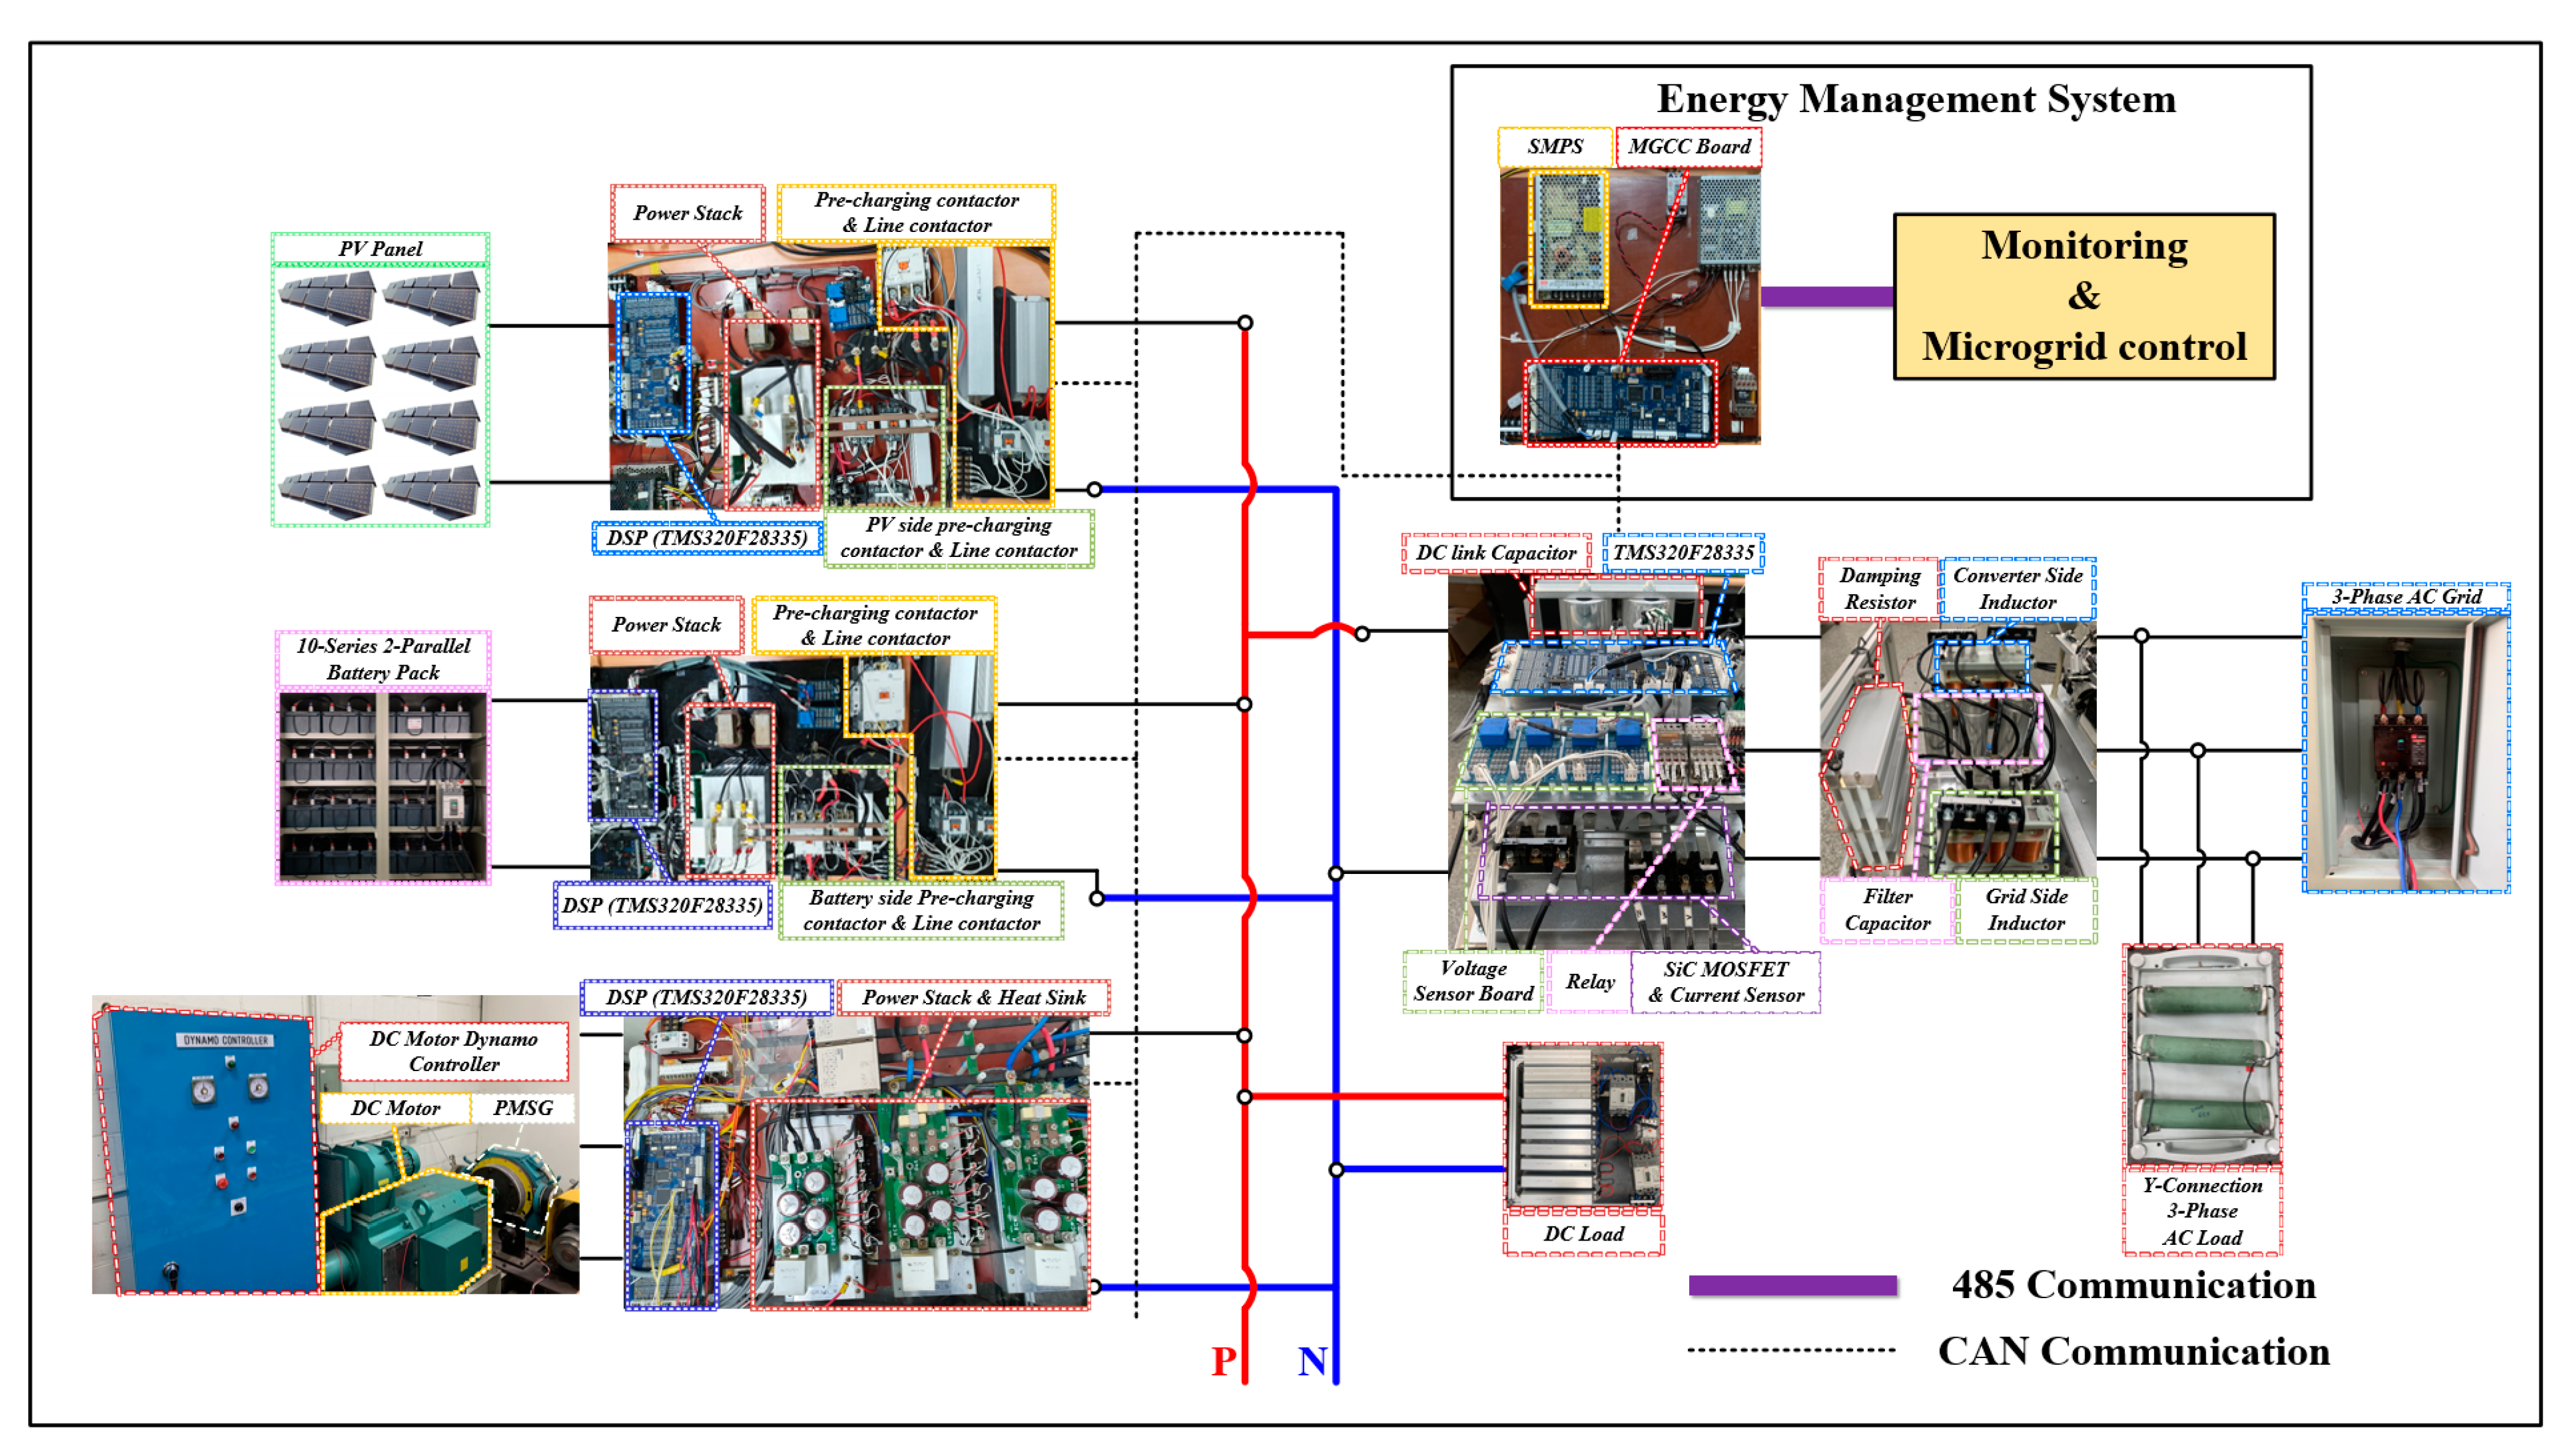
Electronics 10 01939 g015
Figure 16. Experiment configuration of the hybrid AC/DC microgrid.
Electronics 10 01939 g016
Figure 17. Configuration of the 10 kW class ILC hardware set.
Electronics 10 01939 g017
Figure 18. Configuration of the hardware set for ESS and PV (a) converter for ESS, (b) converter for PV.
Electronics 10 01939 g018
Figure 19. Configuration of the wind generation system hardware set (a) 3-level NPC, (b) MG-set.
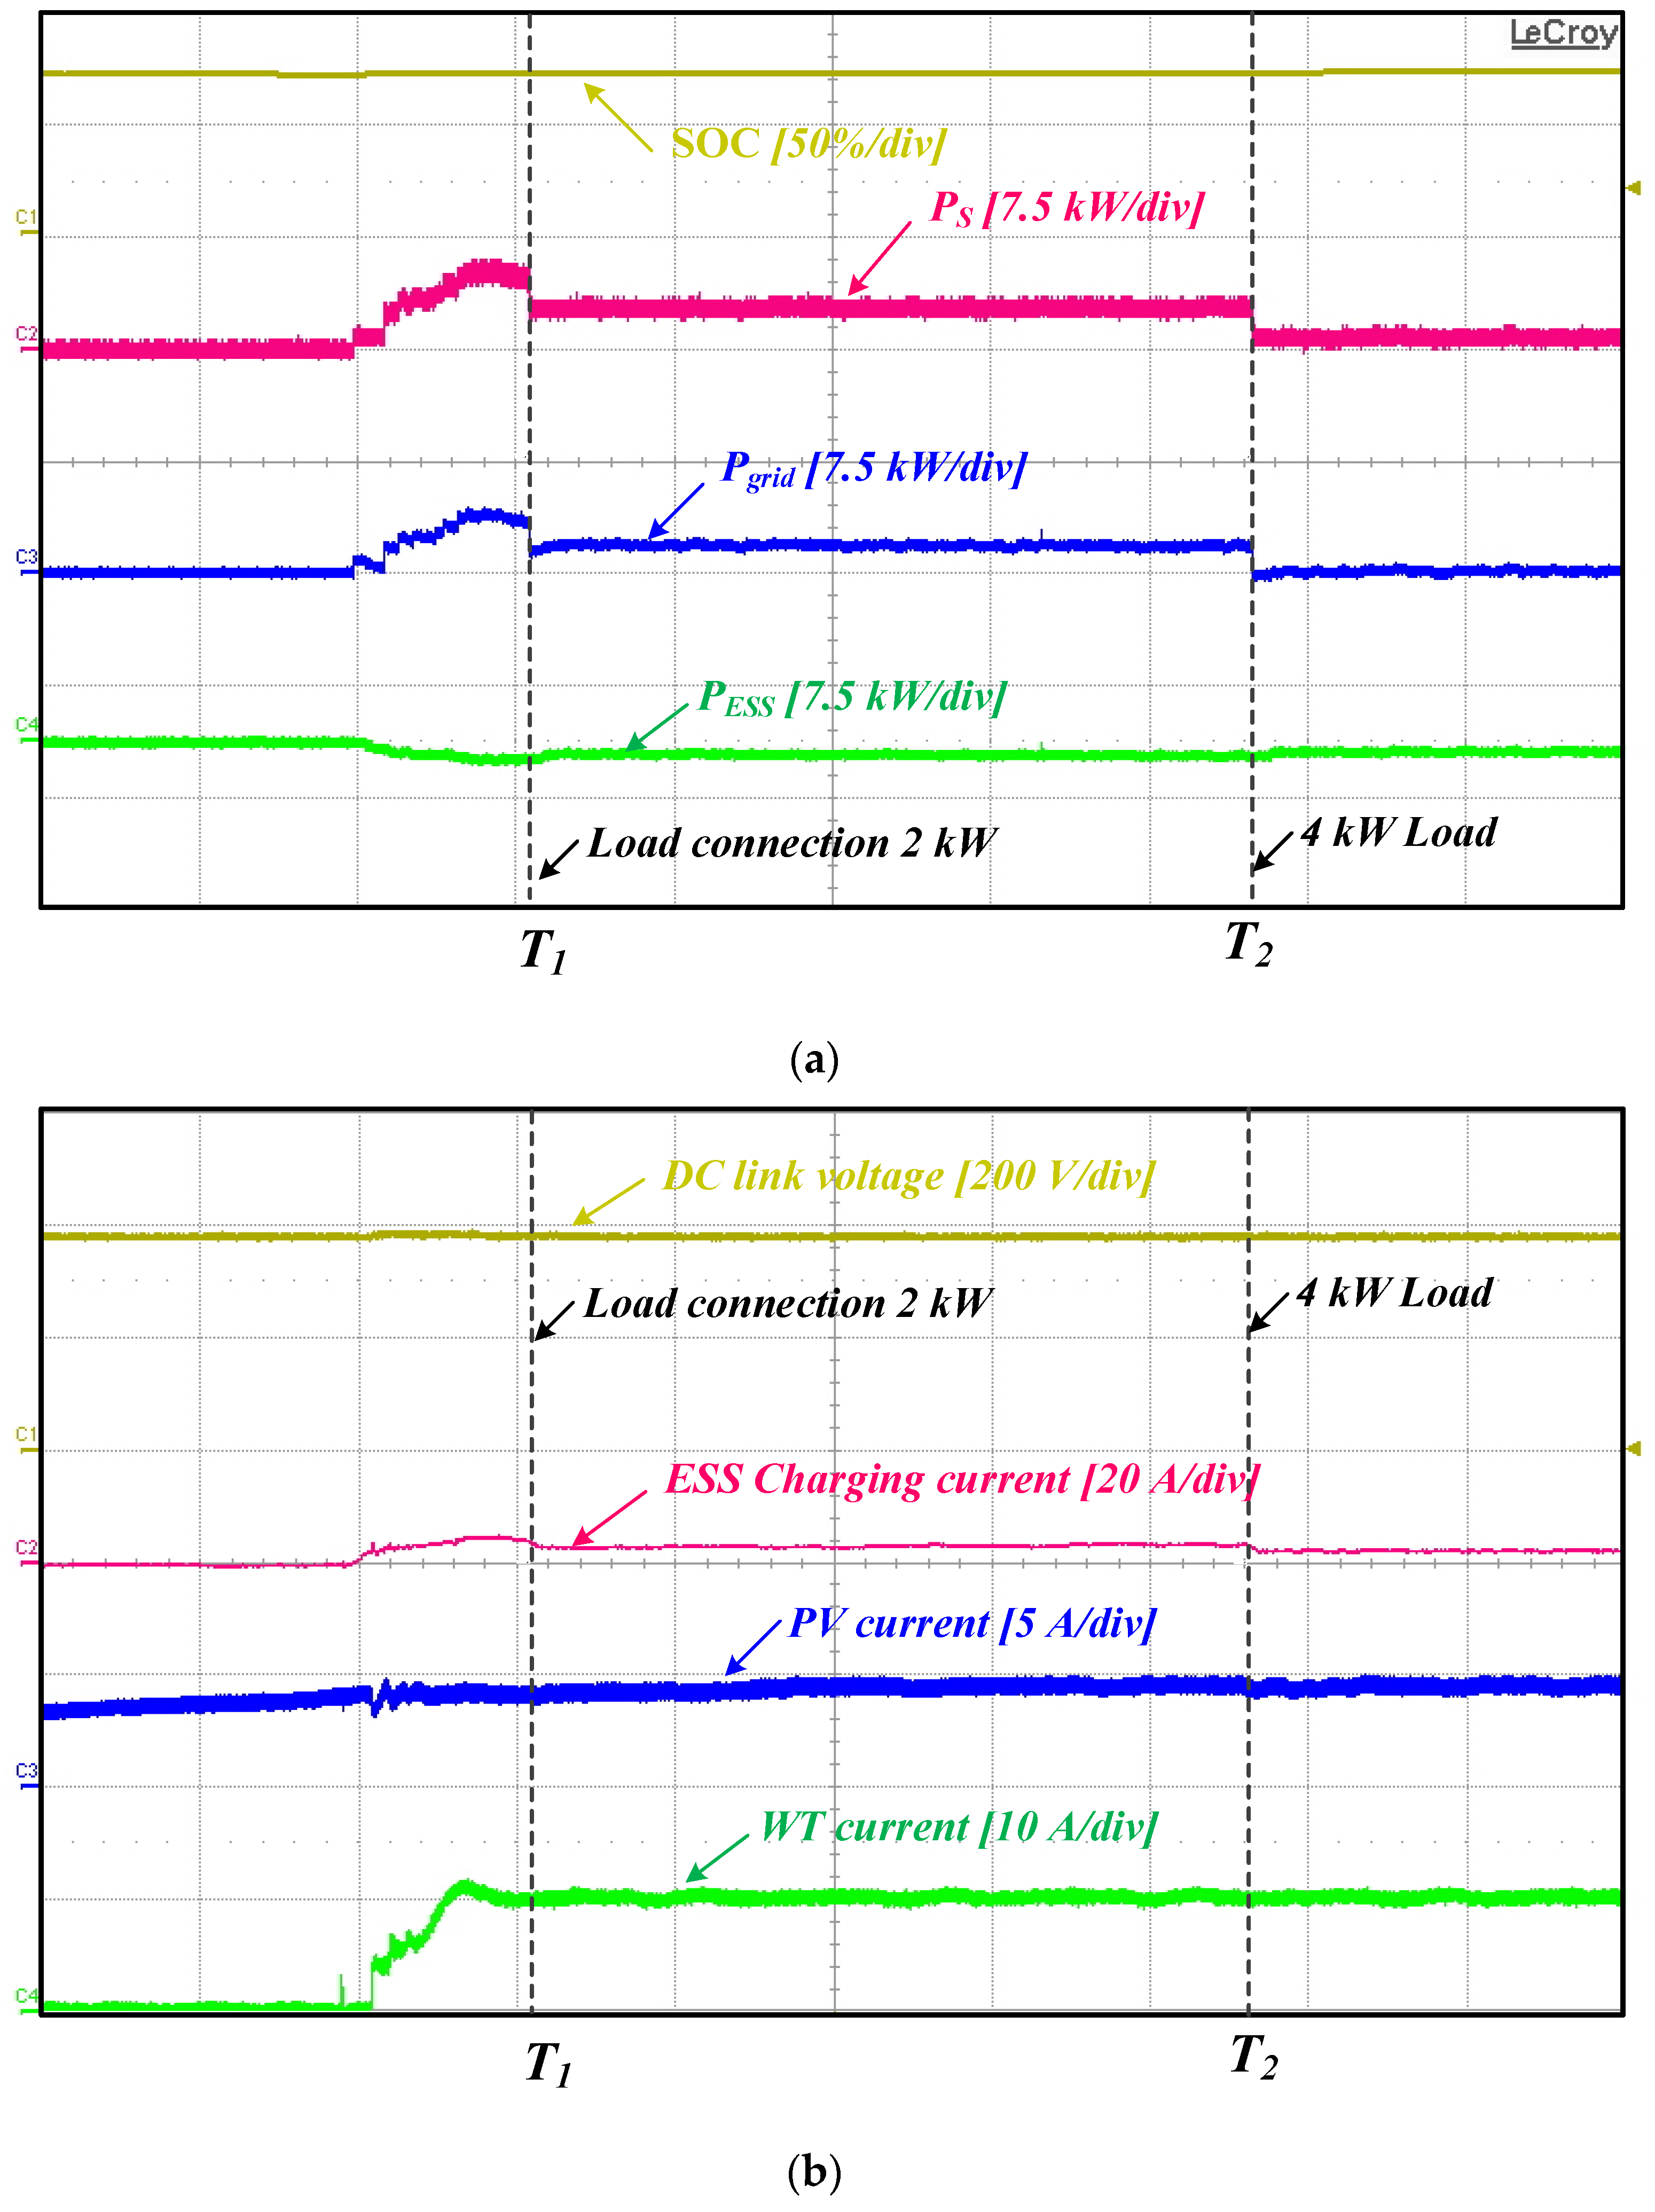
Electronics 10 01939 g019
Figure 20. Experiment waveforms of operation mode 1 (a) ANN input/output data waveform, (b) Voltage and current waveforms in major parts.
Electronics 10 01939 g020aElectronics 10 01939 g020b
Figure 21. Experiment waveforms of operation mode 2 (a) ANN input/output data waveform, (b) Voltage and current waveforms in major parts.
Electronics 10 01939 g021
Figure 22. Experiment waveforms of operation mode 3 (a) ANN input/output data waveform, (b) Voltage and current waveforms in major parts.
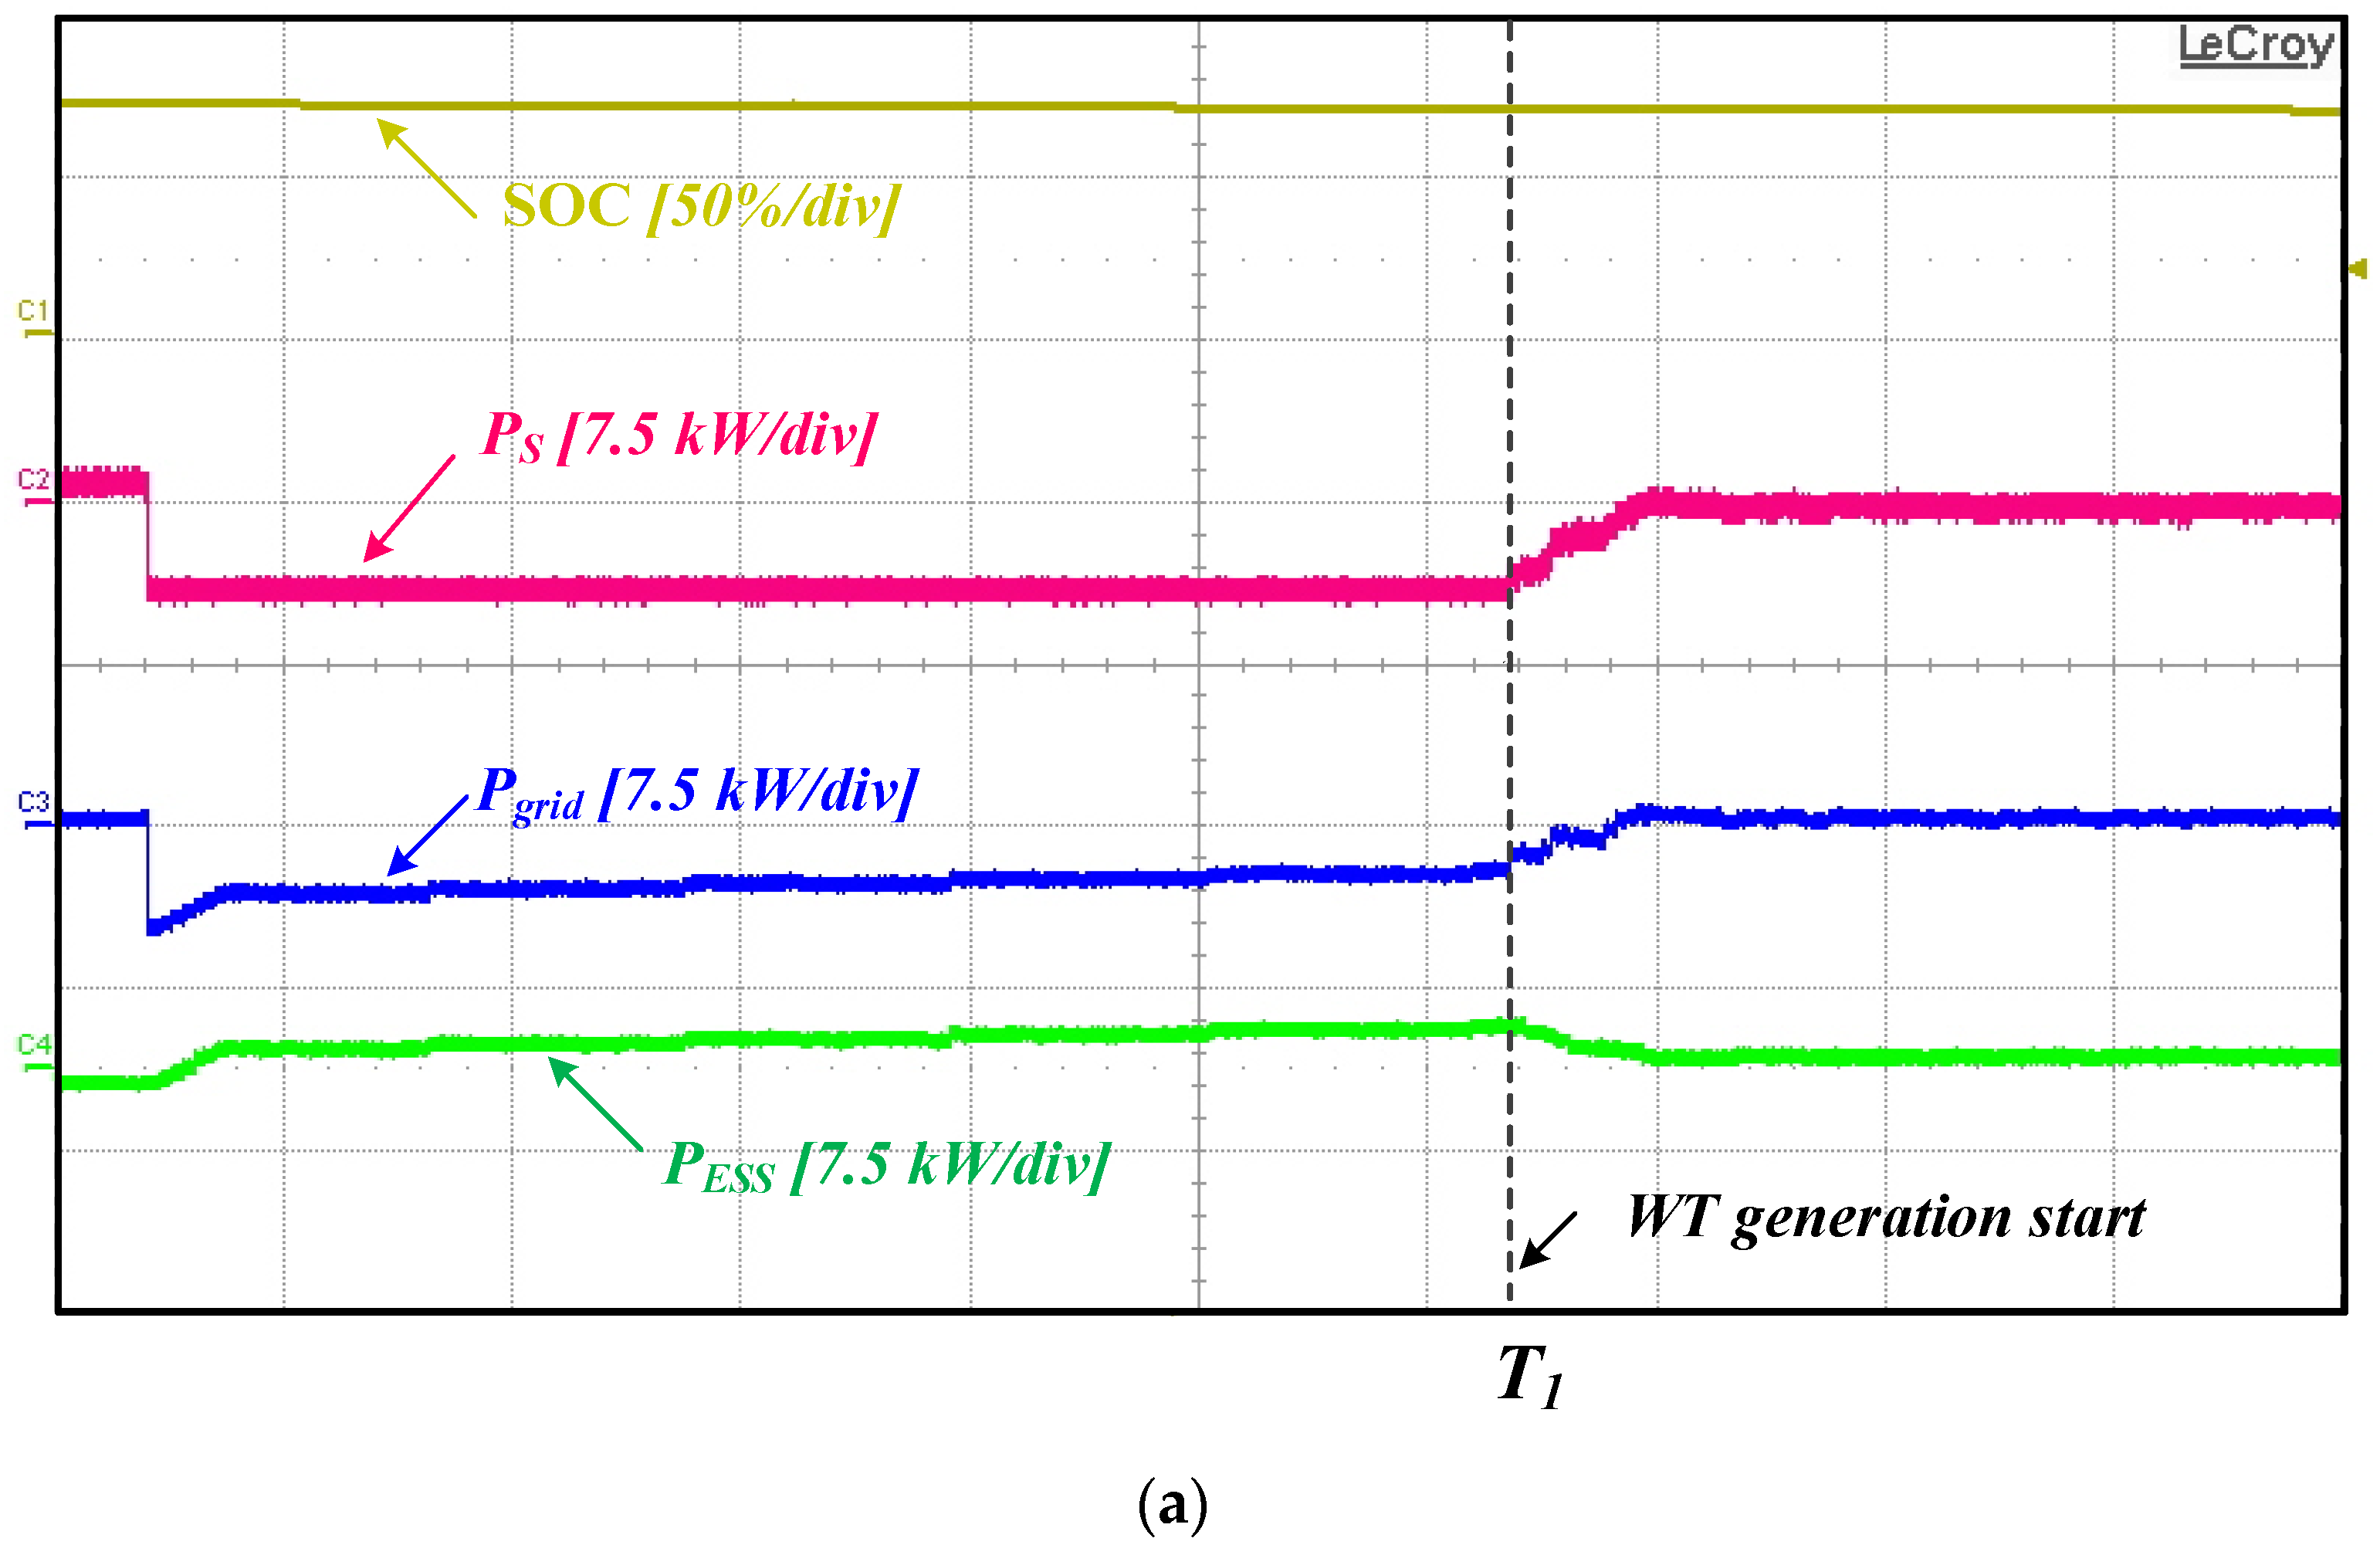
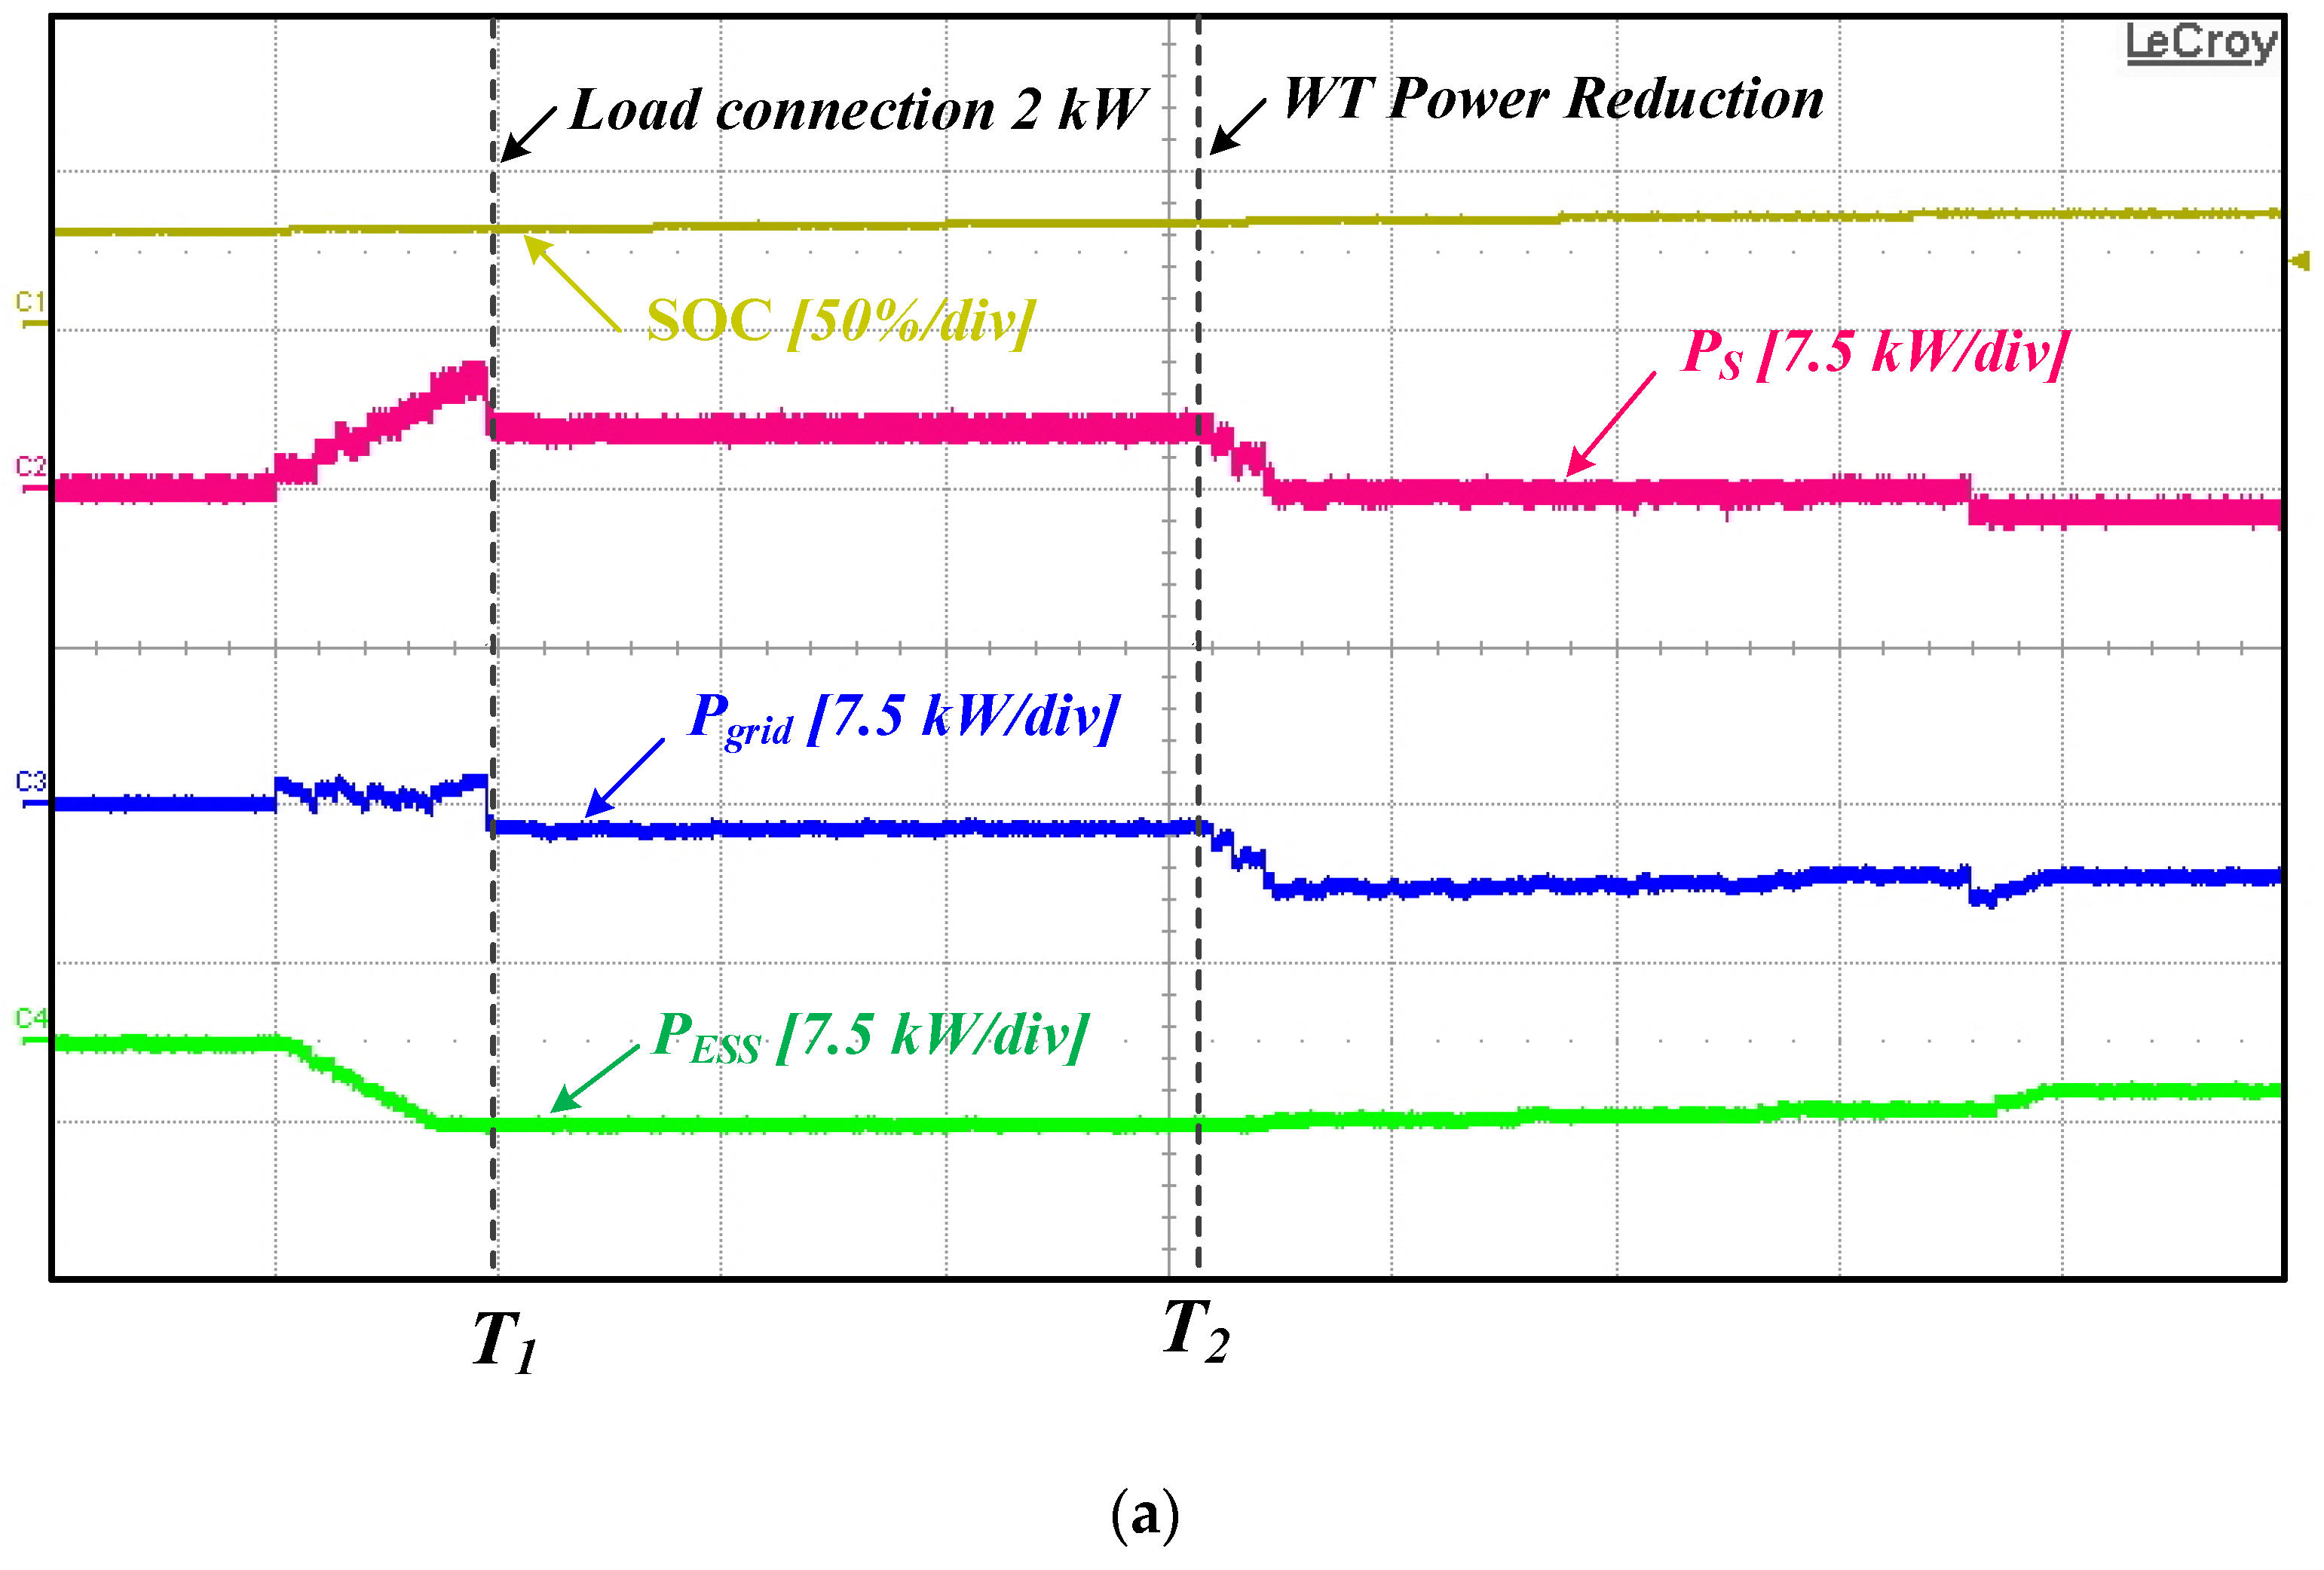
Electronics 10 01939 g022aElectronics 10 01939 g022b
Figure 23. Experiment waveforms of operation mode 4 (a) Power quantity of major parts and SOC, (b) Voltage and current waveforms in major parts.
Electronics 10 01939 g023
Figure 24. Experiment waveforms of operation mode 5 (a) Power quantity of major parts and SOC, (b) Voltage and current waveforms in major parts.
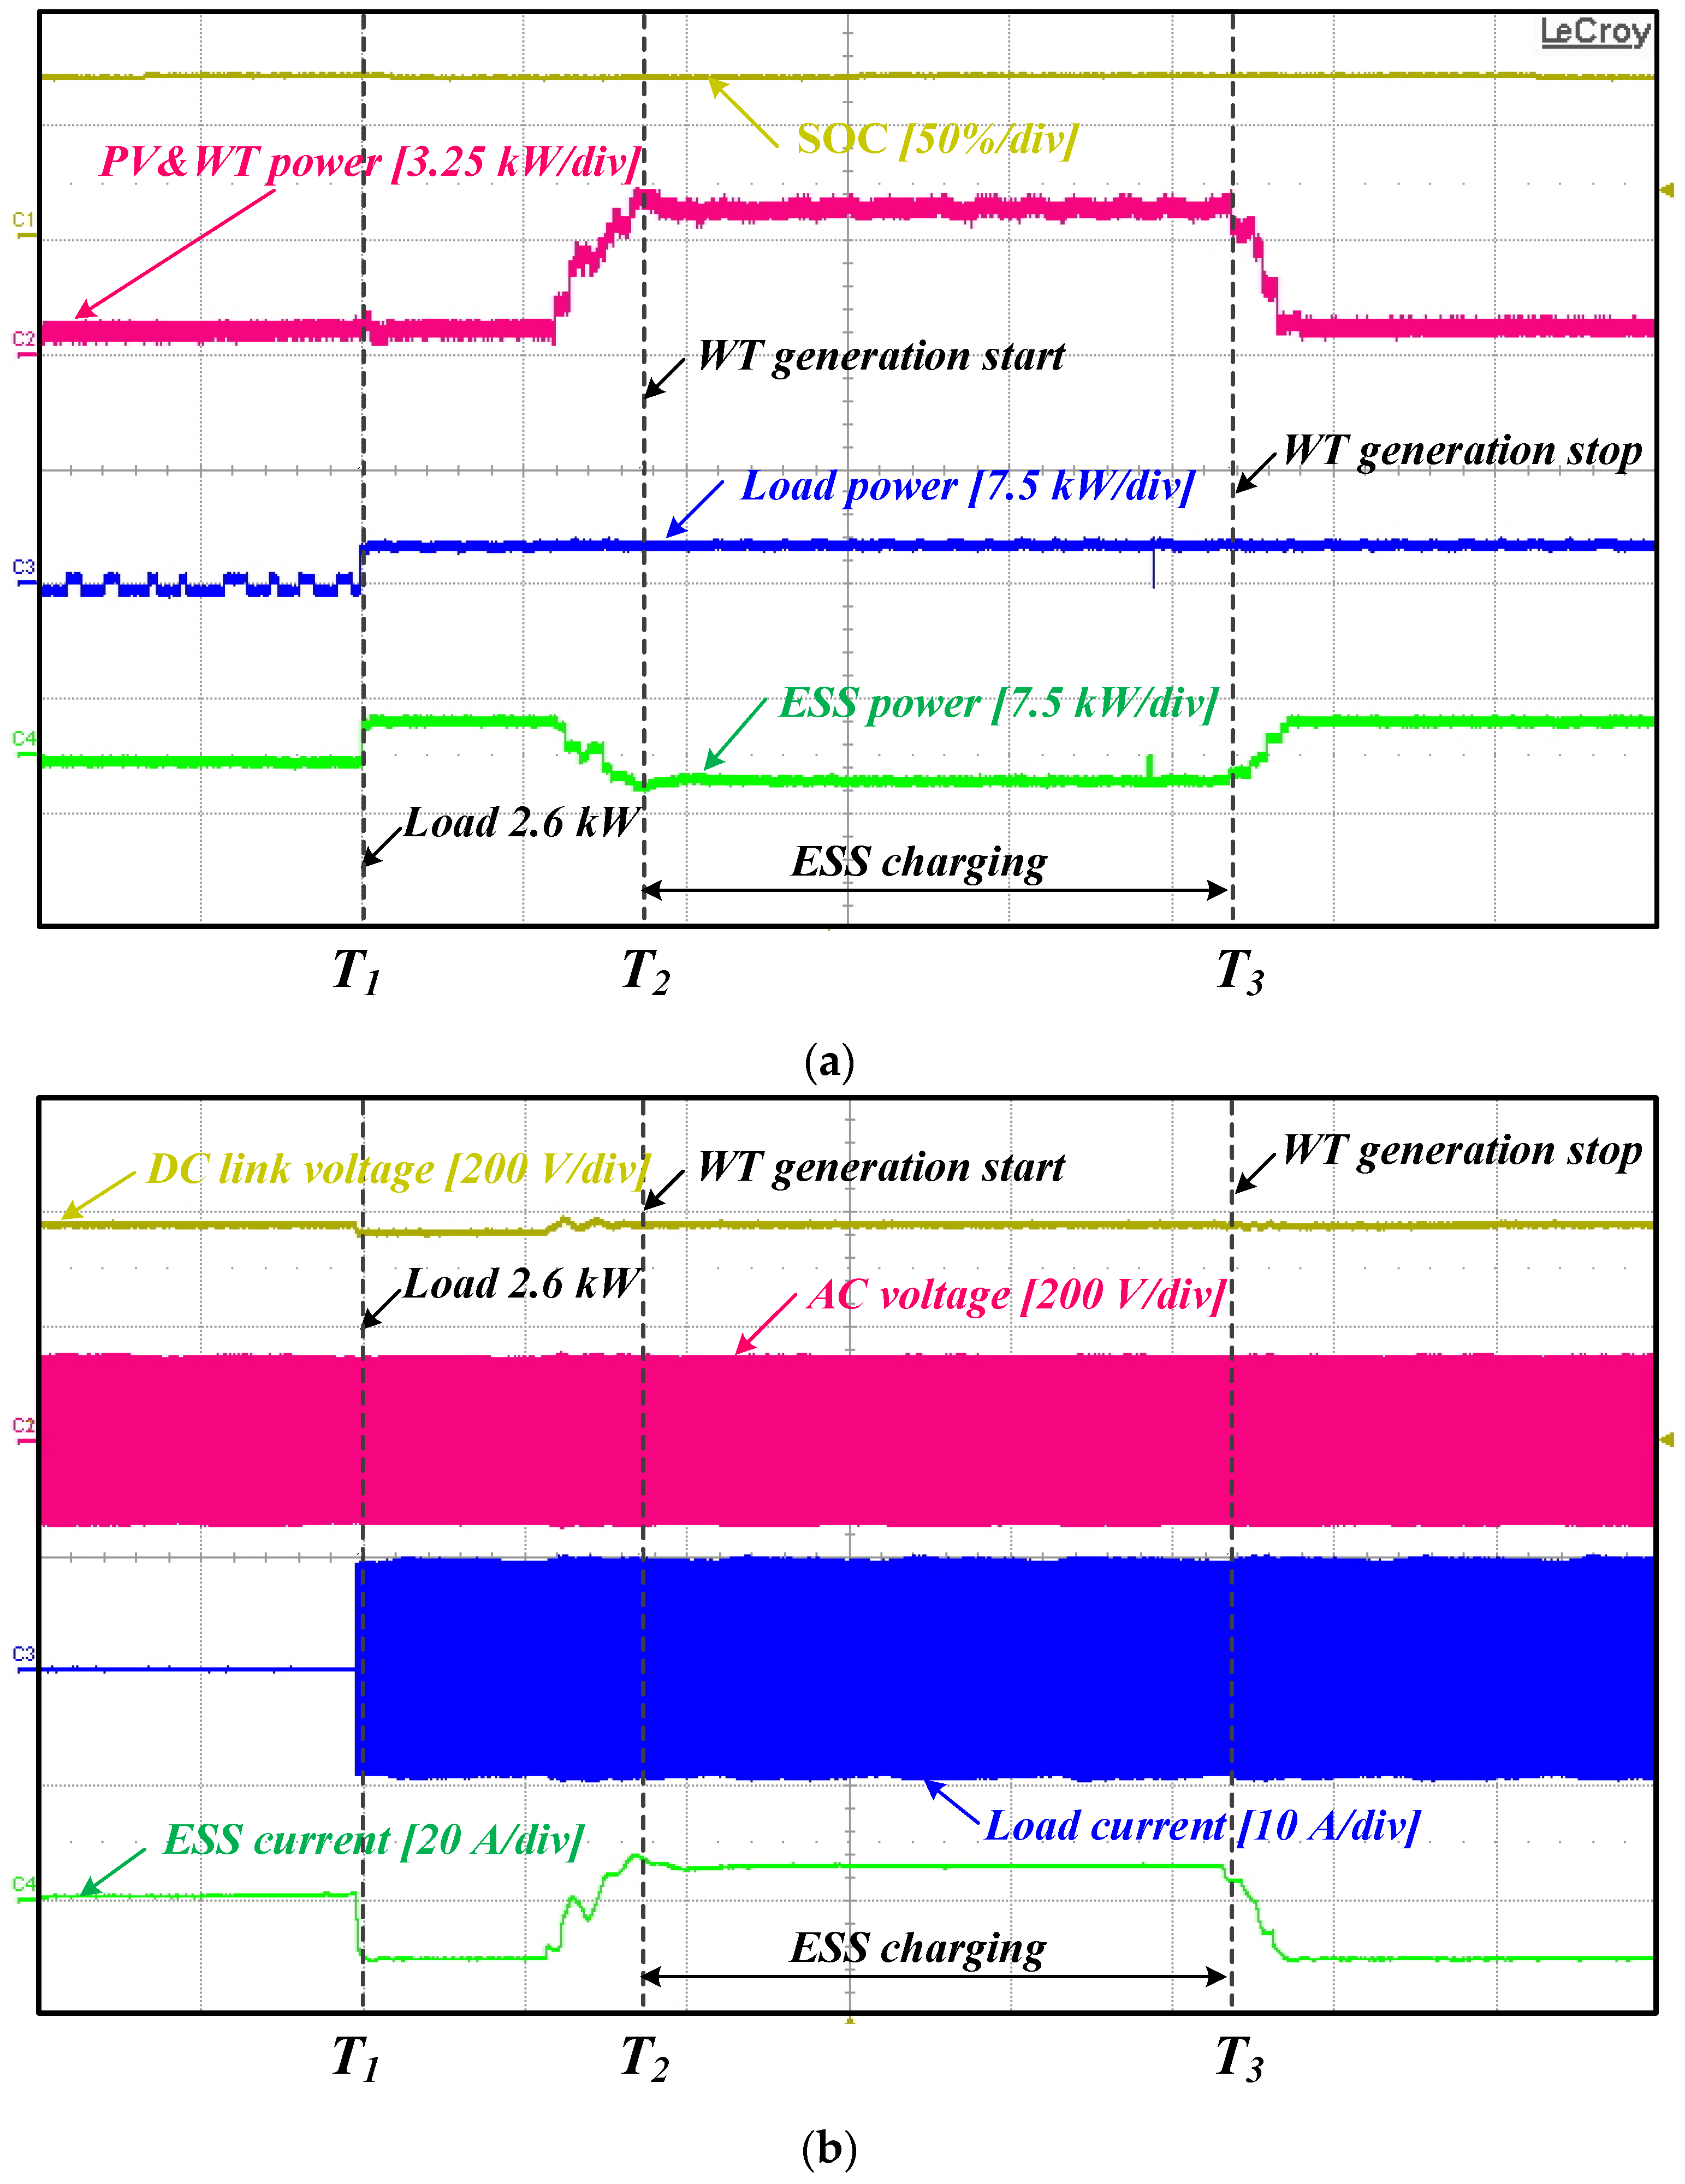
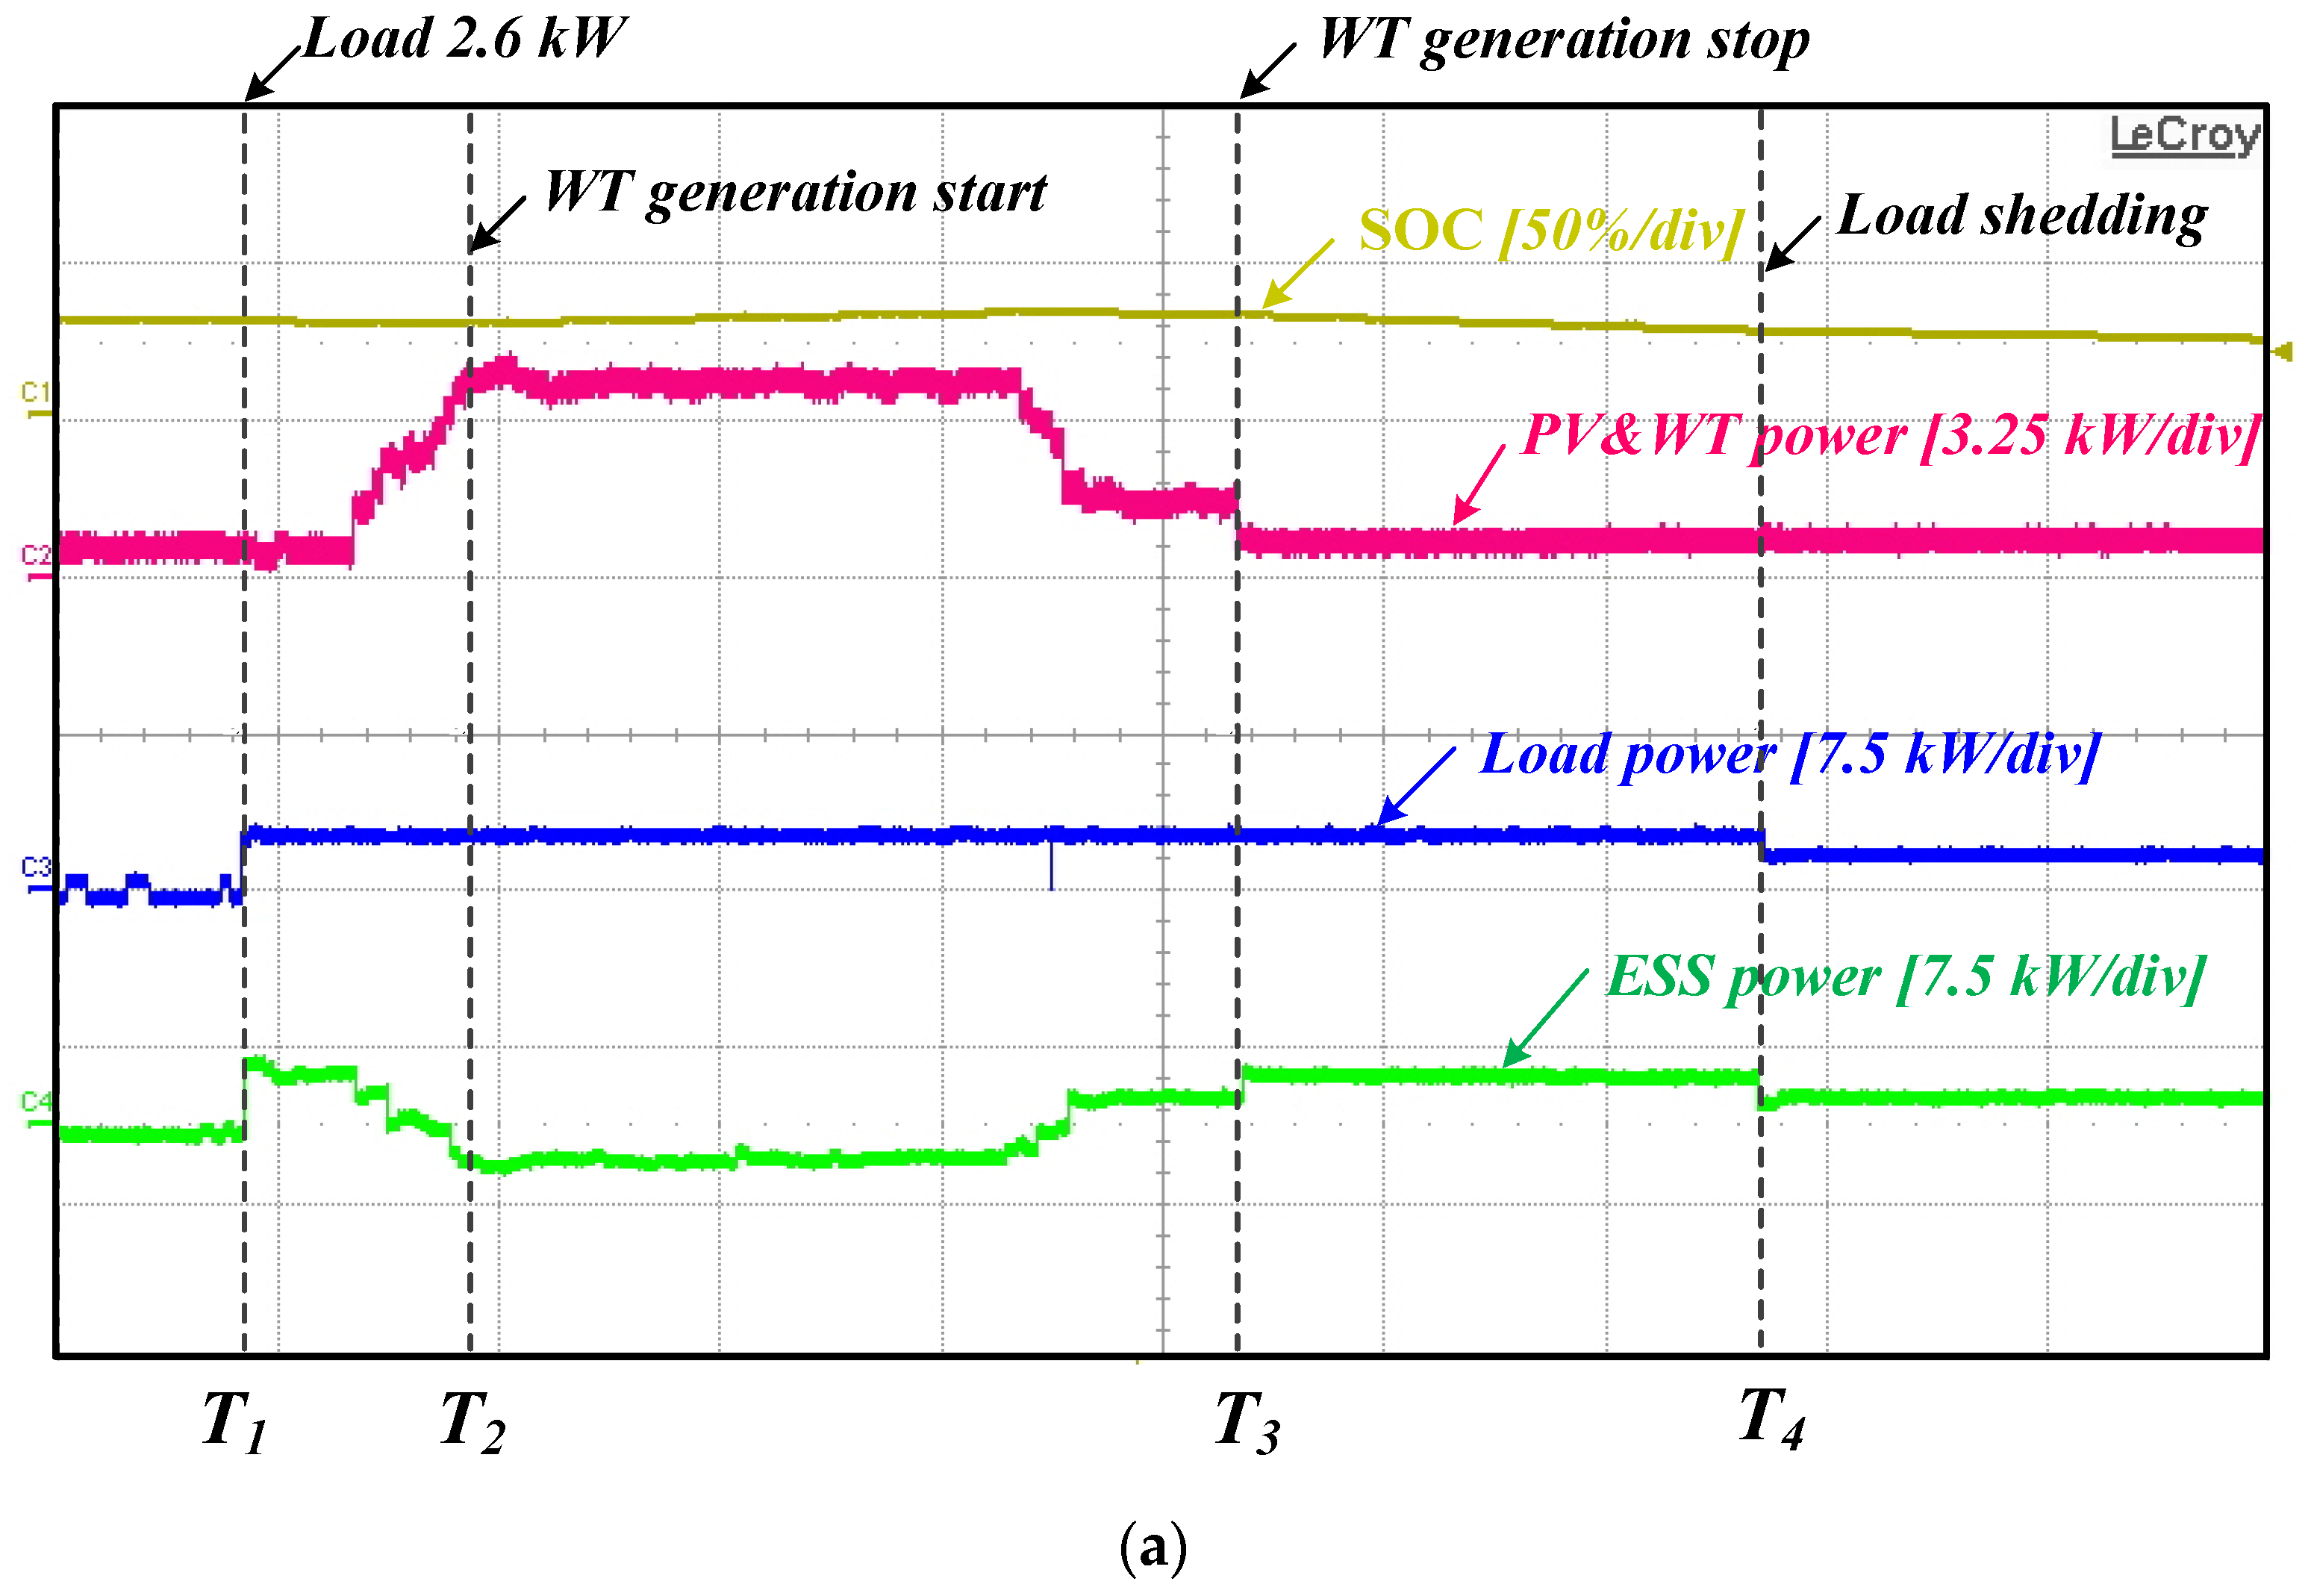
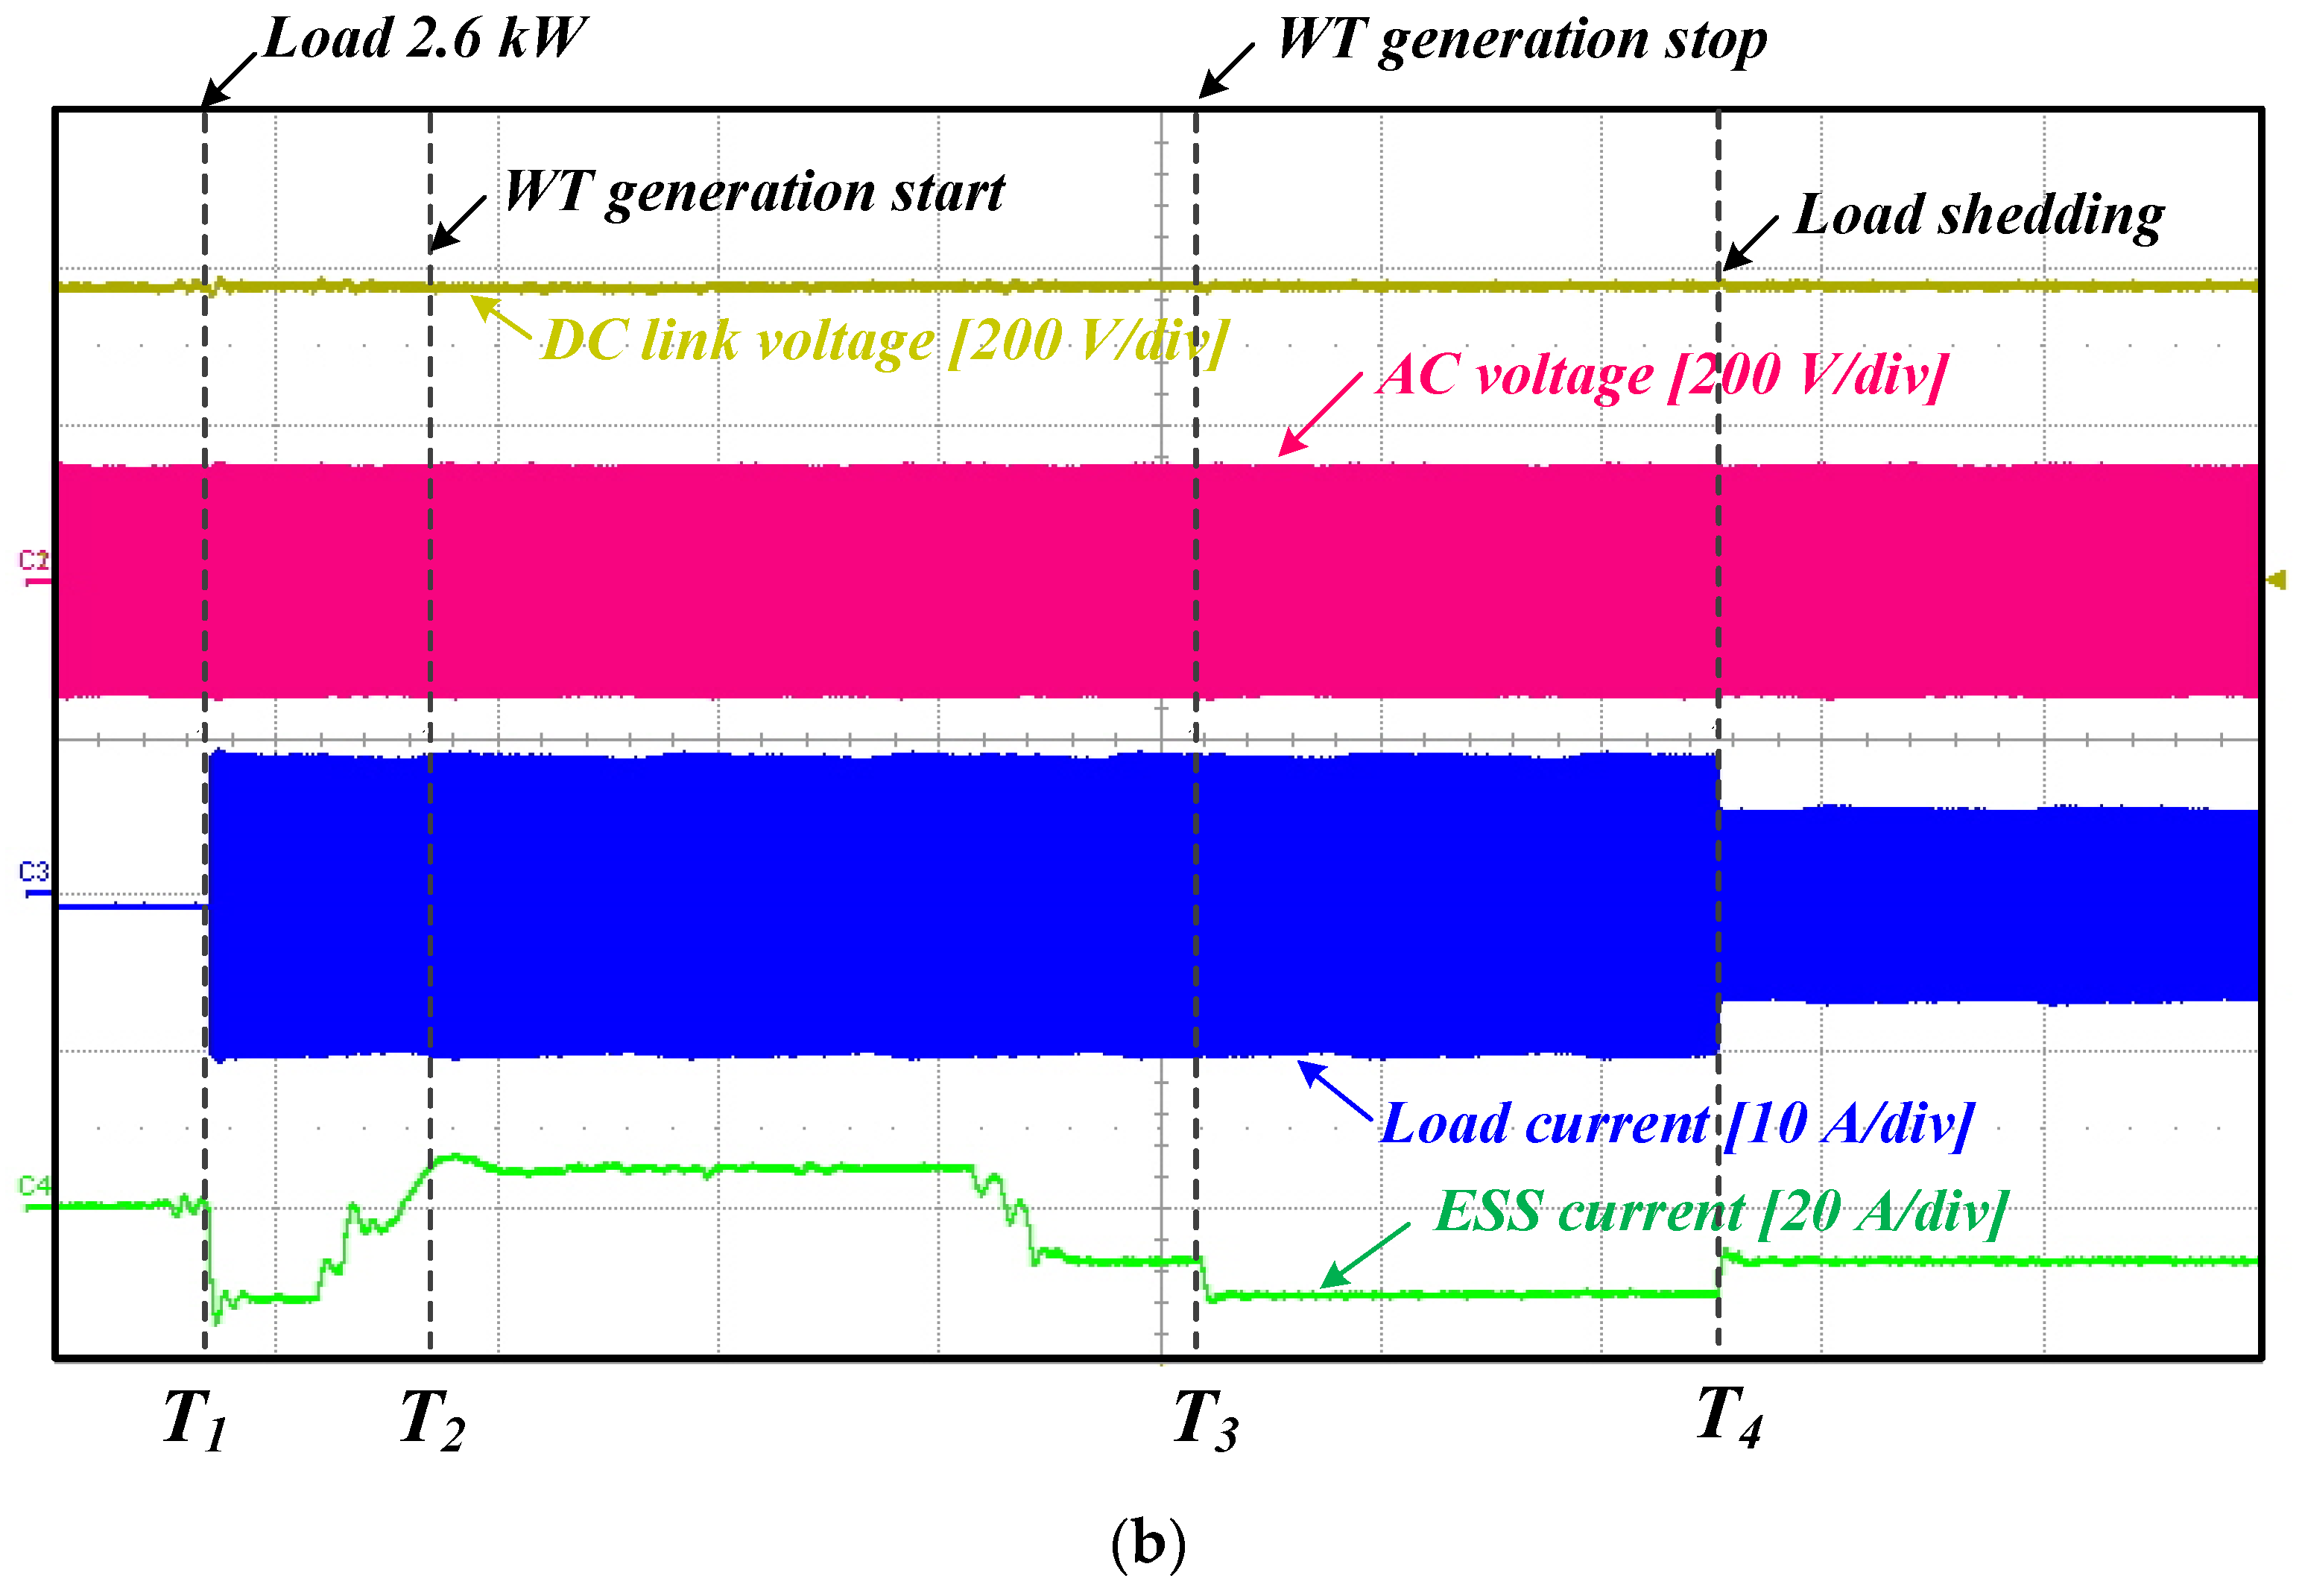
Electronics 10 01939 g024
Figure 25. Experiment waveforms of operation mode 6 (a) Power quantity of major parts and SOC, (b) Voltage and current waveforms in major parts.
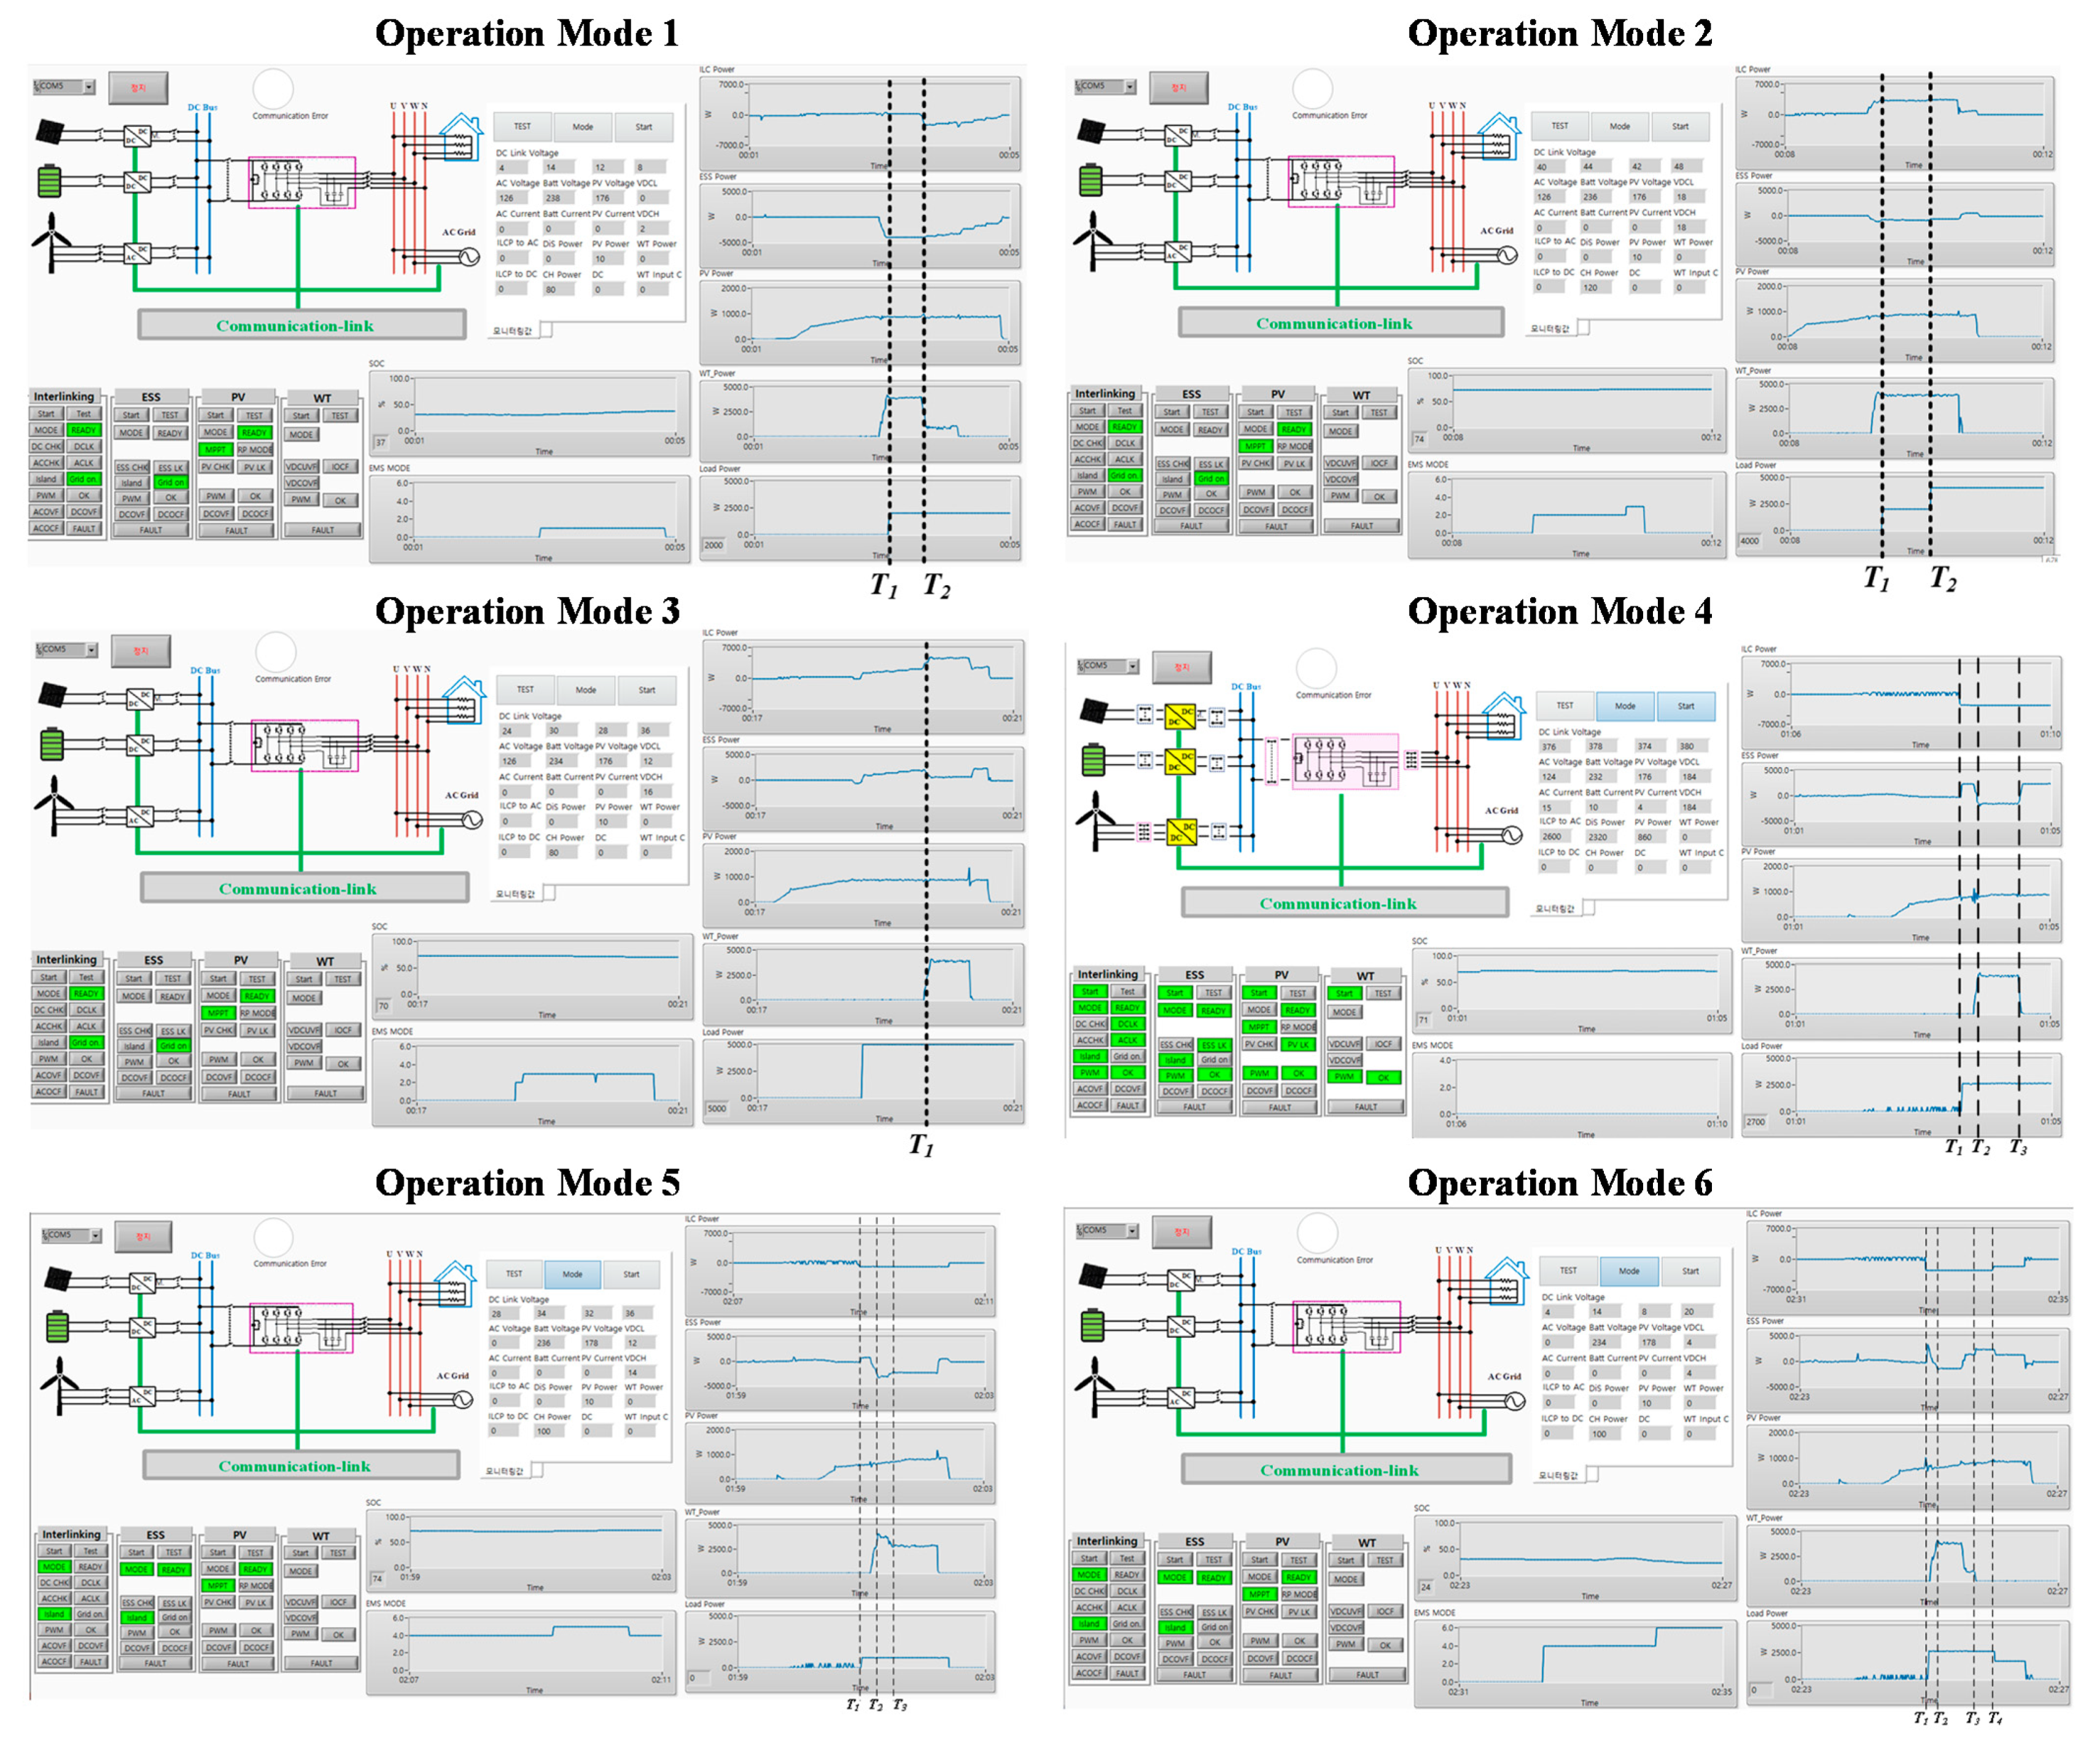
Electronics 10 01939 g025aElectronics 10 01939 g025b
Figure 26. Screen configuration of EMS monitoring system according to each operation mode.
Electronics 10 01939 g026
Table 1. ANN training data of mode 1.
SampleInput DataOutput Data
SOC (P.U)Ps (P.U)WGrid (P.U)PESS (P.U)
10.1−0.50.30.5
20.50.4
30.70.3
400.30.75
50.50.65
60.70.55
70.50.31
80.50.9
90.70.8
100.3−0.50.30.348
110.50.23
120.70.112
1300.30.673
140.50.555
150.70.437
160.50.30.998
170.50.88
180.70.762
Table 2. ANN training data of mode 2.
SampleInput DataOutput Data
SOC (P.U)Ps (P.U)WGrid (P.U)PESS (P.U)
10.50.30.30.27
20.50.17
30.70.07
40.70.30.63
50.50.53
60.70.43
70.70.30.30.21
80.50.11
90.70.01
100.70.30.57
110.50.47
120.70.37
130.90.30.30.166
140.50.076
150.70
160.70.30.526
170.50.436
180.70.346
Table 3. ANN training data of mode 3.
SampleInput DataOutput Data
SOC (P.U)Ps (P.U)WGrid (P.U)PESS (P.U)
10.5−0.70.30.177
20.50.295
30.70.413
4−0.30.30.327
50.50.445
60.70.563
70.7−0.70.30.277
80.50.395
90.70.513
10−0.30.30.173
110.50.645
120.70.763
130.9−0.70.30.269
140.50.387
150.70.505
16−0.30.30.519
170.50.637
180.70.755
Table 4. Power flow of each power converter in operation mode 1.
ParameterValueUnit
T1~T2After T2
Interlinking Converter0.5−1.1kW
ESS Converter4.32.1kW
PV Converter11kW
WT Converter3.80kW
Load Demand22kW
Table 5. Power flow of each power converter in operation mode 2.
ParameterValueUnit
T1~T2After T2
Interlinking Converter3.84.3kW
ESS Converter10.5kW
PV Converter11kW
WT Converter3.83.8kW
Load Demand24kW
Table 6. Power flow of each power converter in operation mode 3.
ParameterValueUnit
Before T1After T1
Interlinking Converter2.55.3kW
ESS Converter−1.5−0.5kW
PV Converter11kW
WT Converter03.8kW
Load Demand55kW
Table 7. Power flow of each power converter in operation mode 4.
ParameterValueUnit
T1~T2T2~T3After T3
Interlinking Converter2.6kW
ESS Converter−1.62.2−1.6kW
PV Converter1kW
WT Converter03.80kW
Load Demand2.6kW
Table 8. Power flow of each power converter in operation mode 5.
ParameterValueUnit
T1~T3After T3
Interlinking Converter1kW
ESS Converter−3.6−2.3kW
PV Converter0.8 kW
WT Converter3.82.5kW
Load Demand1kW
Grid Regenerative Power0kW
Table 9. Power flow of each power converter in operation mode 6.
ParameterValueUnit
Before T3T3~T4After T4
Interlinking Converter2.61.8kW
ESS Converter−1.40.8kW
PV Converter32 kW
WT Converter1kW
Load Demand30kW
Grid Regenerative Power2.61.8kW
Publisher’s Note: MDPI stays neutral with regard to jurisdictional claims in published maps and institutional affiliations.

