
Image Fusion Algorithm Selection Based on Fusion Validity Distribution Combination of Difference Features

Abstract
:1. Introduction
- (1)
- Intuition-possible sets are built to model fusion validity of attributes of image difference features.
- (2)
- A novel construction method of fusion validity distribution based on intuition-possible sets is proposed, which can reflect the fusion validity change process of attributes of image difference features to algorithms.
- (3)
- This paper puts forward a distribution combination method based on intuition-possible set ordering to solve the optimal algorithm selection problem that has a relatively better effect on the fusion of the difference features according to the varied image feature attribute values, which provides the basis to algorithm classification and mimicry bionic fusion. The rest of this paper is organized as follows: Section 2 briefly analyses the type of difference feature for infrared polarization and intensity images. Section 3 determines intuition-possible set on fusion effect according to the distance of amplitudes of difference features, then proposes a fusion validity distribution construction method. A distribution combination method based on intuition possible set ordering is put forward. Experimental results and comparisons are given and analyzed. Conclusions are presented in Section 4.
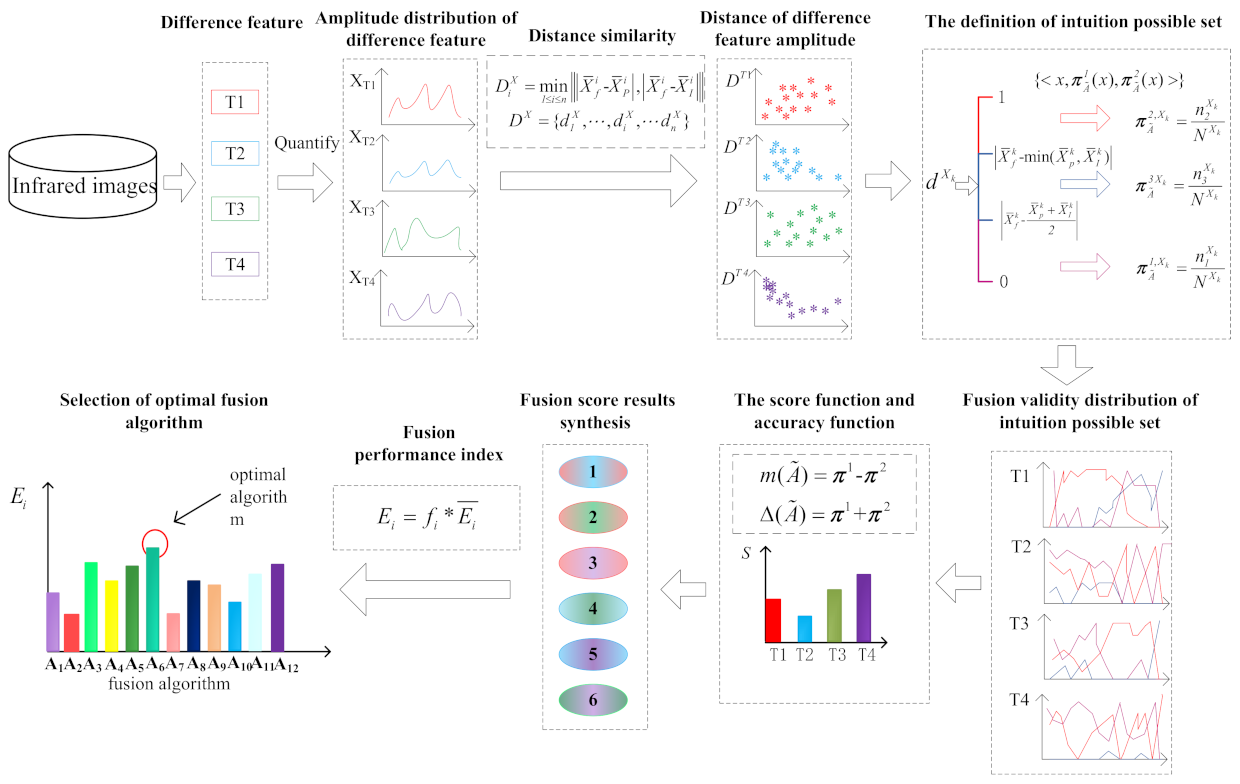
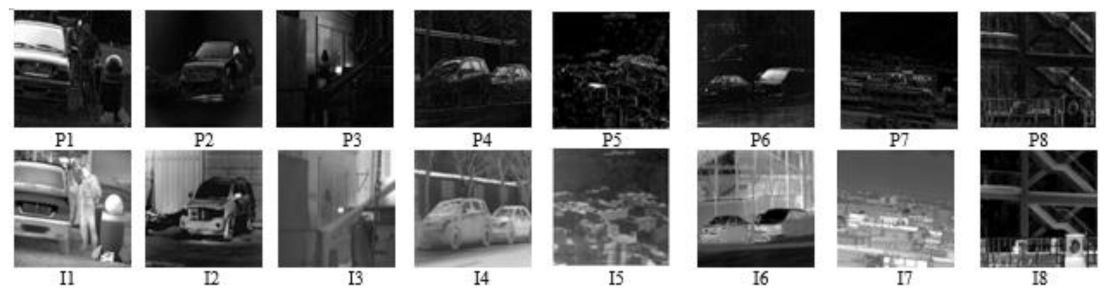
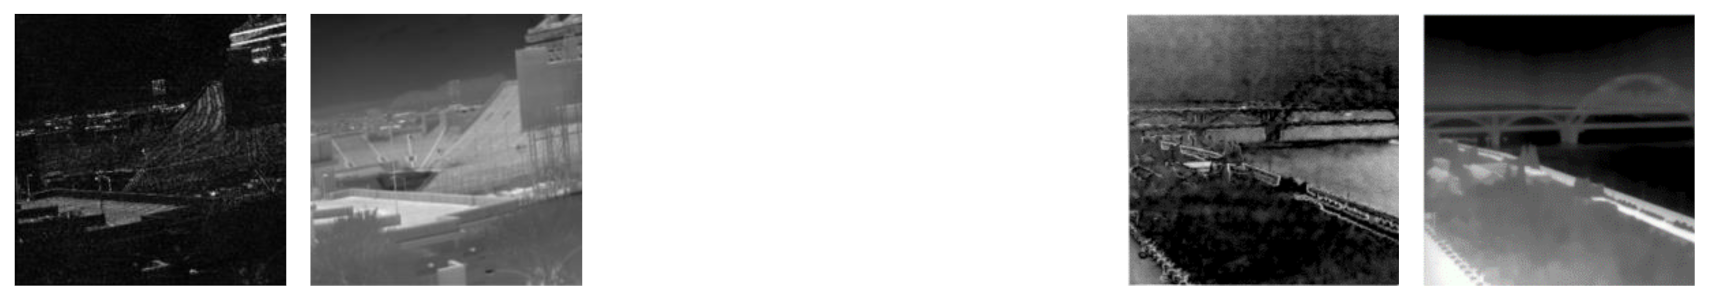
2. Determination of the Type of Difference Feature
- Gray mean: In the grayscale image, the brightness information changes continuously from dark to bright. The difference gray mean value represents the absolute value of mean difference of all pixel intensity values of two types of images in the dual-mode infrared images, thus it can effectively reflect the change of the difference of brightness characteristics of images.
- Edge intensity: The edge information is the contour structural feature of the human eye recognition feature information, and the distributions of the two types of images are very different. The difference edge intensity represents the absolute value of the difference in the edge amplitude intensity of the two types of images. This paper selects the Sobel operator based on the commonly used edge extraction operators to extract the edge amplitude intensity information to characterize the edge feature difference change of the images.
- Standard deviation: The difference standard deviation can reflect the discrete situation of the gray scale of the dual mode infrared image compared to the average gray scale. The larger the difference standard deviation is, the more discrete the gray level distribution is, indicating the greater the contrast between the two kinds of images, the more information available, that is, the better the fusion effect.
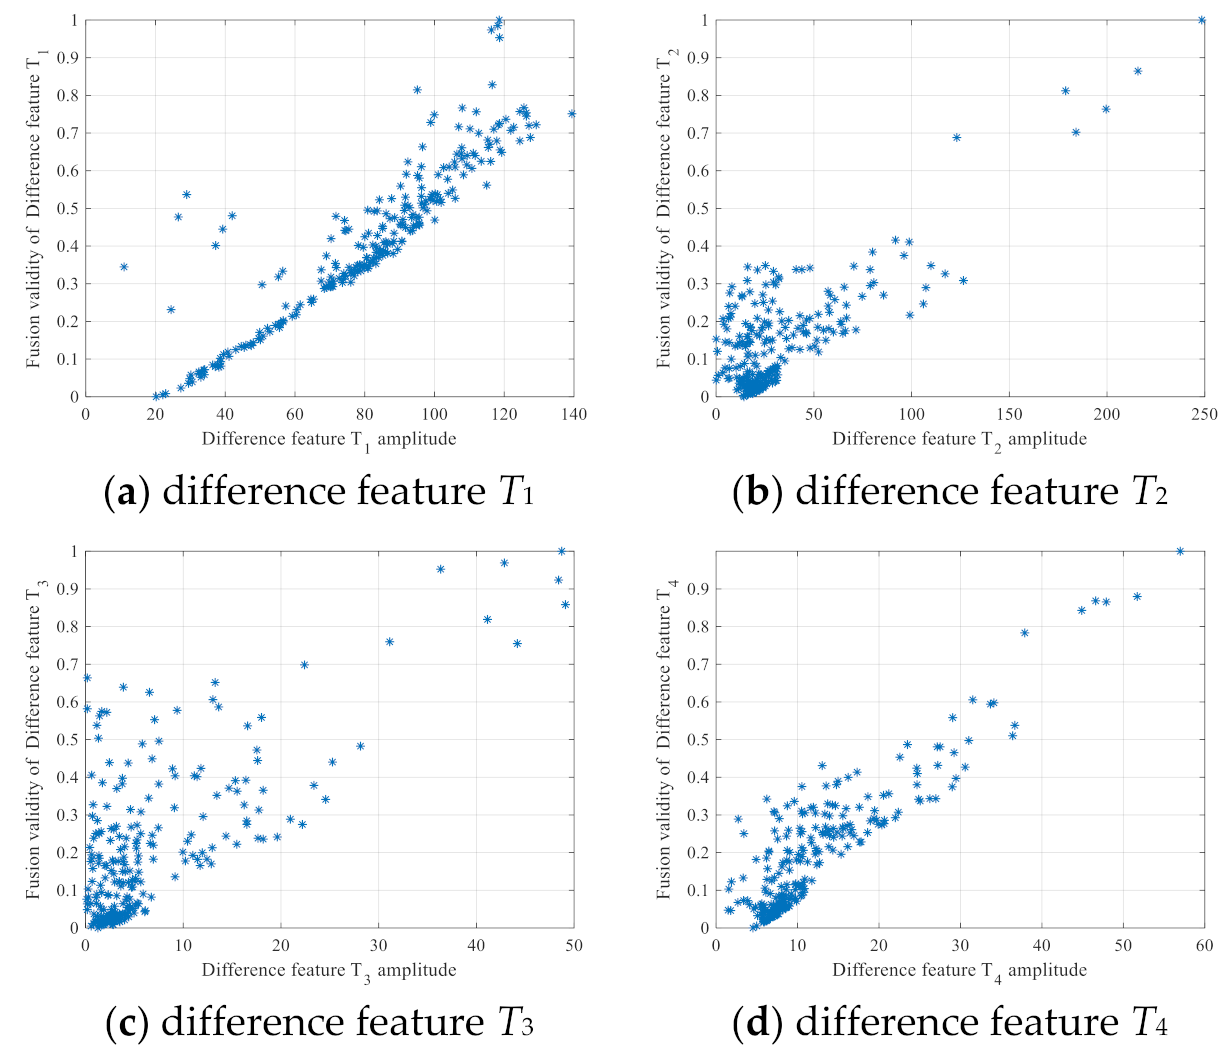
- Spatial frequency: Difference spatial frequency can reflect the sharpness of pixel gray value changes in dual-mode infrared images, can effectively represent image texture feature information, and reflect the image’s ability to describe the contrast of small details. The greater the difference spatial frequency, the clearer the fused image. The above can be well described image information, so we adopt four difference features in this paper, labelled as T1, T2, T3 and T4.
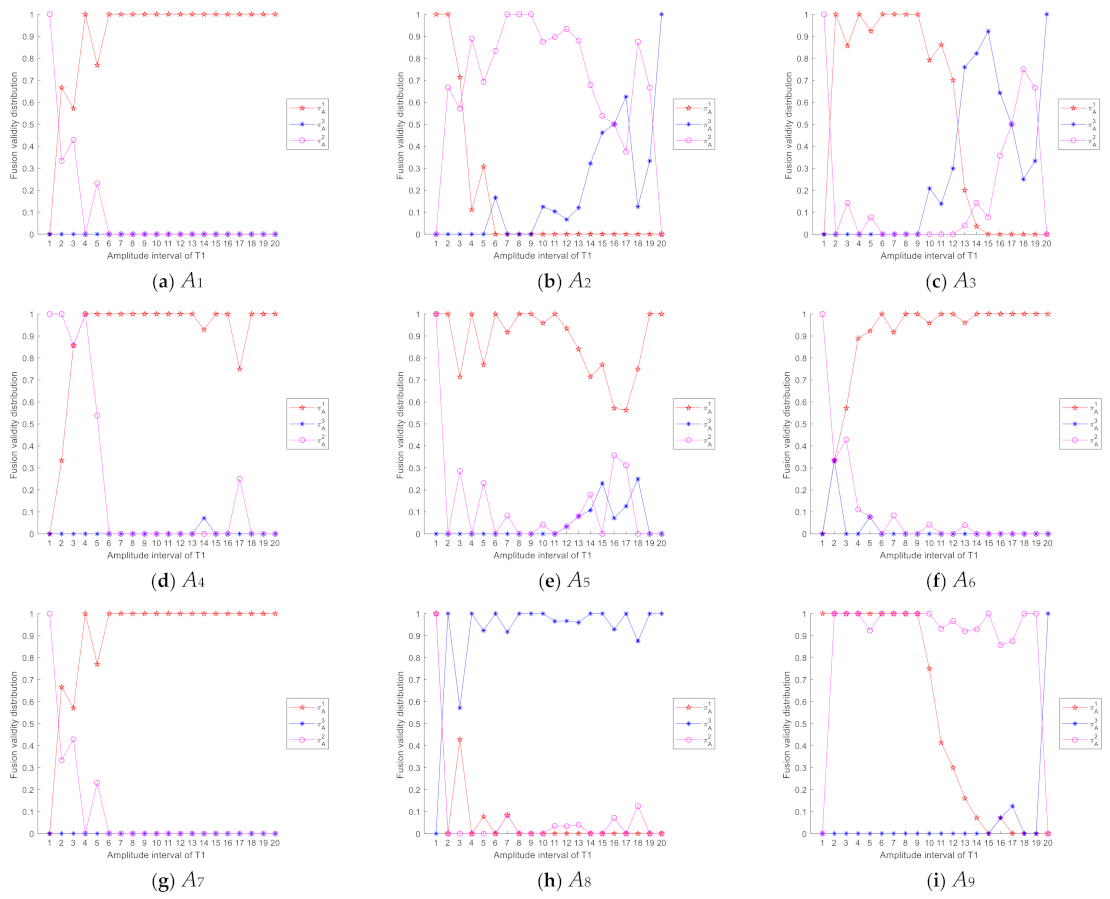
3. Construction of Fusion Validity of Difference Feature Amplitude Based on Intuition Possible Sets
3.1. Intuition Possible Sets
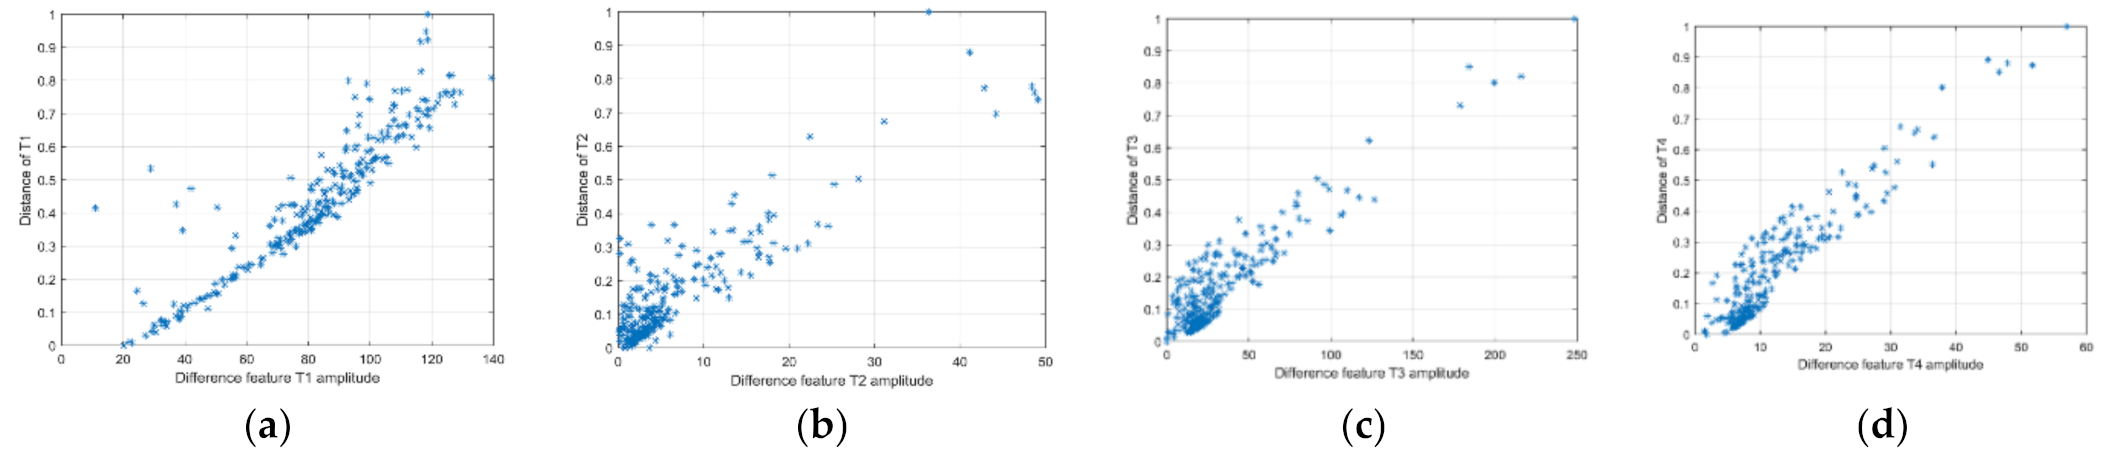
3.2. Calculation of the Distance of the Amplitudes of Difference Feature between Fused Image and Source Images
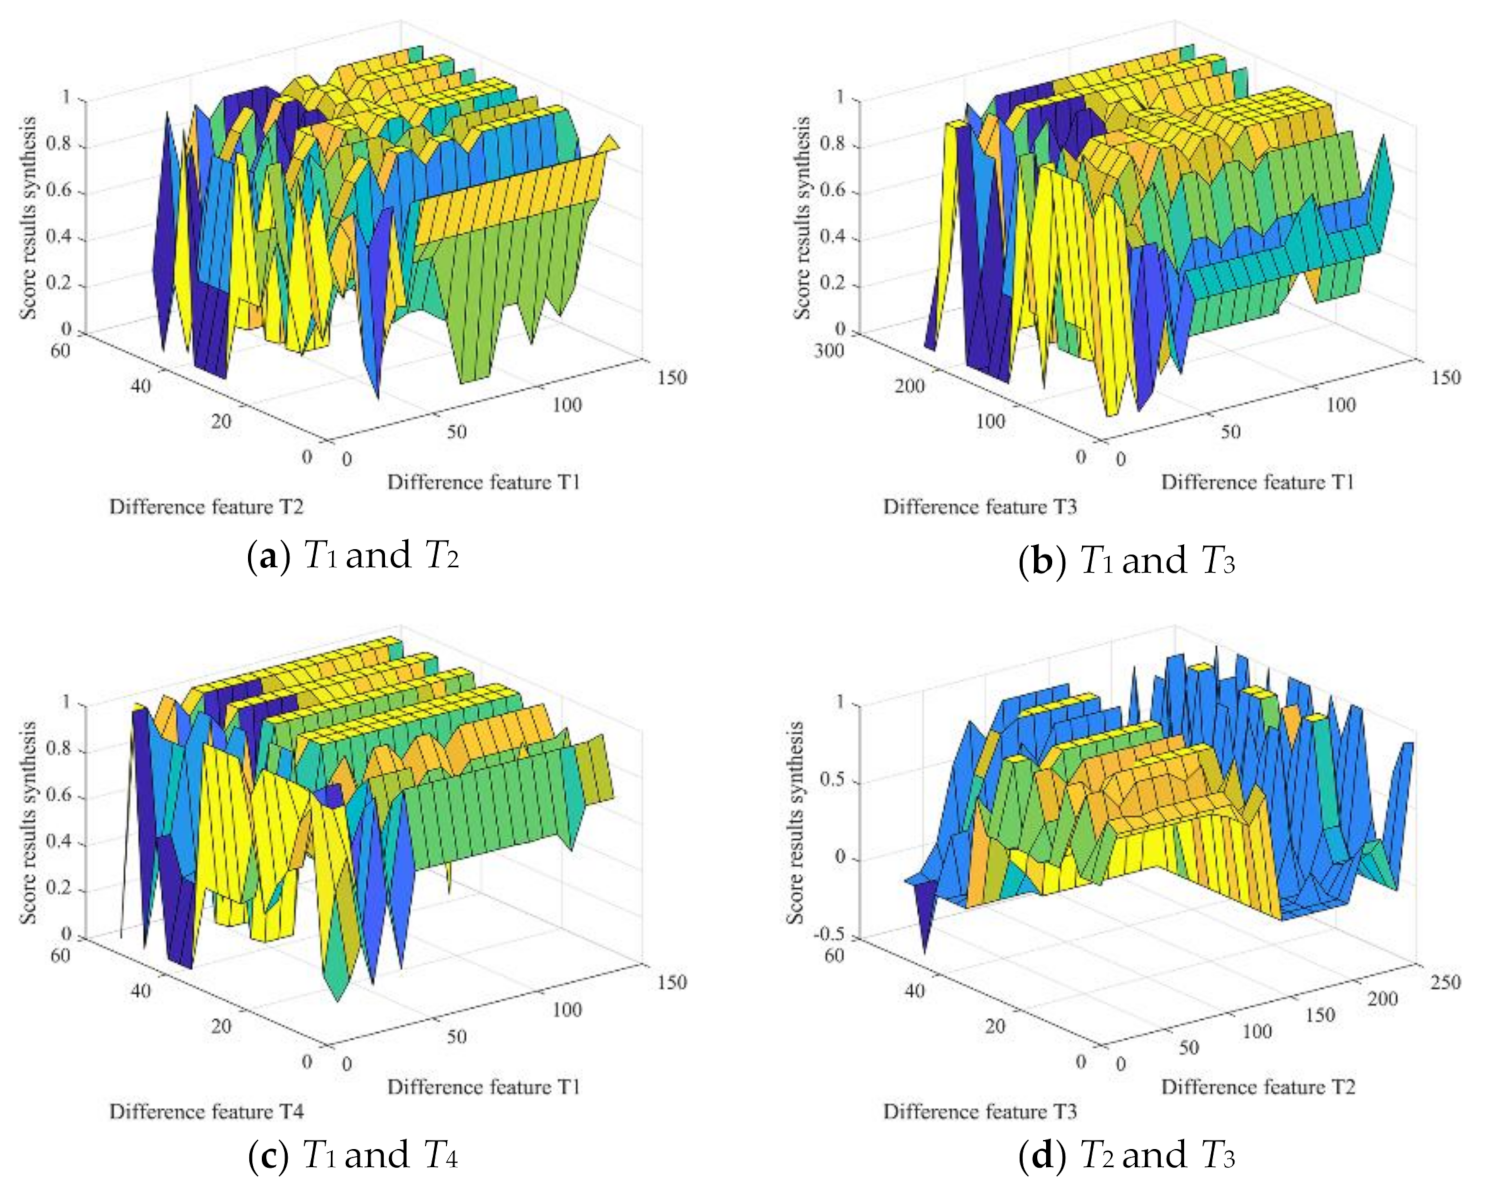
3.3. Distribution Construction
| Algorithm 1: Distribution construction |
| Input: Infrared polarization image, infrared intensity image and fused image Output: Fusion validity distribution Step 1: The amplitudes of difference feature // T1, T2, T3 and T4. Step 2: Calculation of the distance of the amplitudes of difference feature using (5) Step 3: Building of Intuition possible sets on fusion effect Step 4: Construction of fusion validity distribution a. Determine the number of image blocks b. Initialize , and c. Update , and using Equations (6)–(8) d. Calculate fusion validity |
- (1)
- For image blocks, if the distances of the amplitudes of difference feature between fused image and source images are in the interval , then fused images in these image blocks have better effect than those based on weighted average method. So in this case, there is definite possibility for the set of high fusion effect of difference feature to algorithms.
- (2)
- When the distances of the amplitudes of difference feature are in the interval , difference features with high complementary have not been fused in fused image effectively, so there should be a definite possibility for the set of low fusion effect of difference feature to algorithms.
- (3)
- If the distance of the amplitudes of difference feature between fused image and source images are in the interval , we cannot determine the fusion validity to be high or low under this circumstance, i.e., medium state.
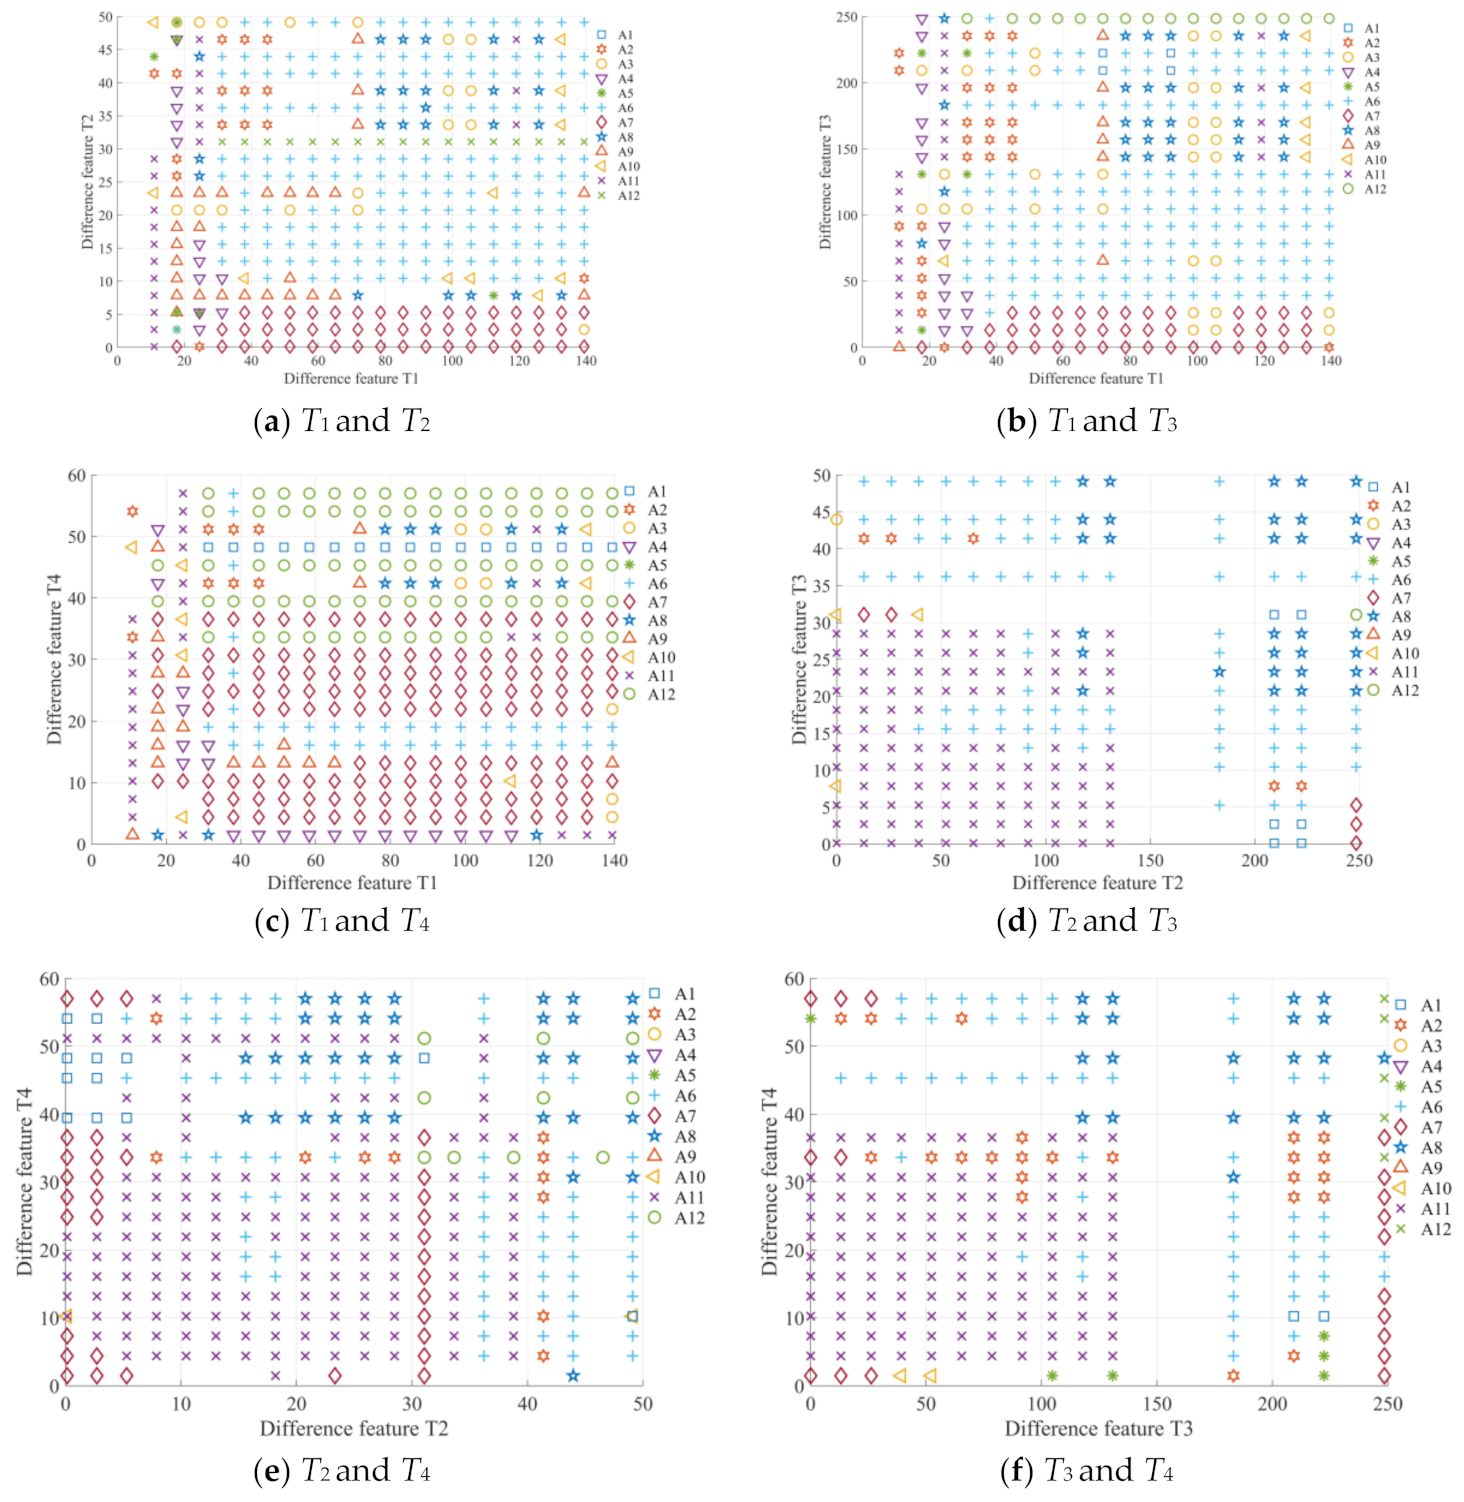
3.4. Combination of Fusion Validity Distribution Based on Intuition Possible Set Ordering
- 1.
- If , then is superior to , denoted by ;
- 2.
- If , then is superior to , denoted by ;
- 3.
- If , then,
- (1)
- If , then is superior to , denoted by ;
- (2)
- If , then is equivalent to , denoted by
- (3)
- If , then is superior to , denoted by .
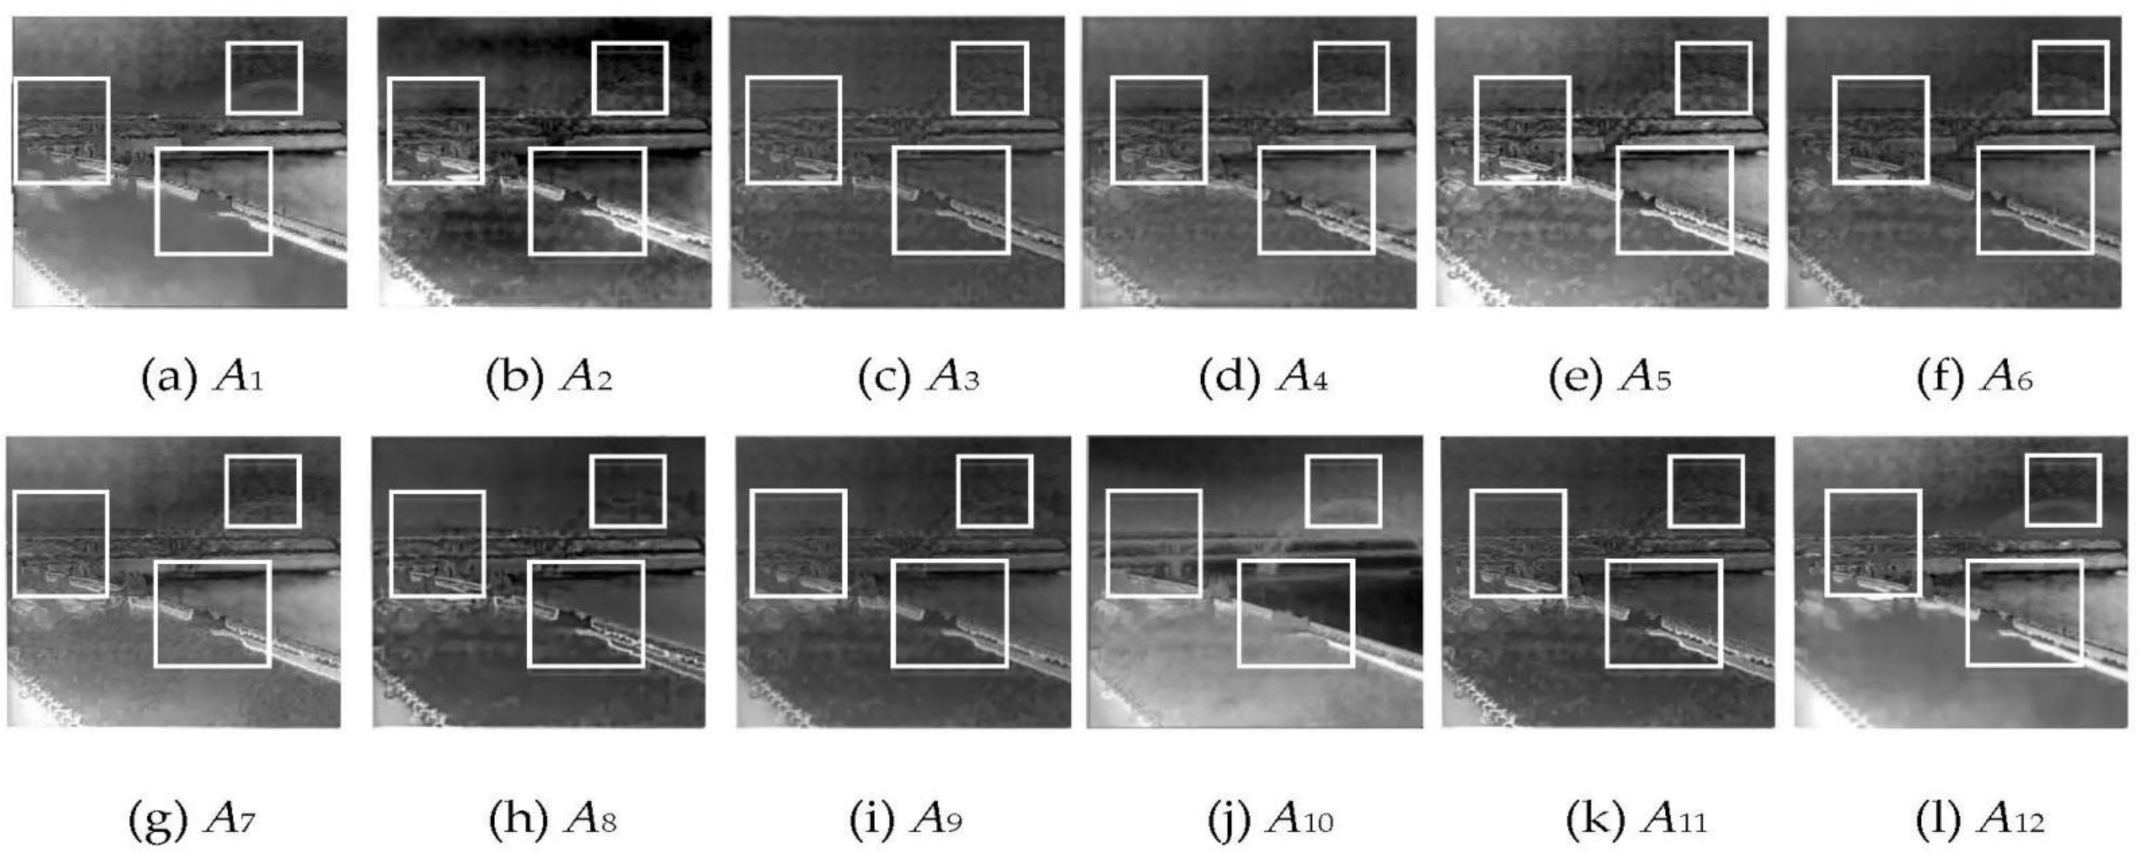
3.5. Experimental Results and Comparisons
4. Conclusions
- (1)
- In this article, four difference features are used to select the best one of the twelve fusion algorithms. In further research, we should consider the recently published solutions for image fusion to choose the algorithm with better fusion effects.
- (2)
- Although the method proposed in this paper has great advantages in selecting the optimal fusion algorithm, there is still some room for improvement. We utilize a fuzzy operator to aggregate difference feature score results in this paper. It would be very interesting to apply some fuzzy weighted averaging operators to cope with fusion validity distribution combination of difference features, such as fuzzy ordered weighted averaging operator, and Pythagorean fuzzy averaging and geometric averaging operators, etc.
Author Contributions
Funding
Institutional Review Board Statement
Informed Consent Statement
Data Availability Statement
Conflicts of Interest
References
- Li, S.; Jin, W.; Xia, R.; Li, L.; Wang, X. Radiation correction method for infrared polarization imaging system with front-mounted polarizer. Opt. Express 2016, 24, 26414–26430. [Google Scholar] [CrossRef]
- Hu, P.; Yang, F.; Wei, H.; Ji, L.; Liu, D. A multi-algorithm block fusion method based on set-valued mapping for dual-modal infrared images. Infrared Phys. Technol. 2019, 102, 102977. [Google Scholar] [CrossRef]
- Sappa, A.D.; Carvajal, J.A.; Aguilera, C.A.; Oliveira, M.; Romero, D.; Vintimilla, B.X. Wavelet-based visible and infrared image fusion: A comparative study. Sensors 2016, 16, 861. [Google Scholar] [CrossRef] [Green Version]
- Zhang, L.; Yang, F.; Ji, L. Multi-Scale Fusion Algorithm Based on Structure Similarity Index Constraint for Infrared Polarization and Intensity Images. IEEE Access 2017, 5, 24646–24655. [Google Scholar] [CrossRef]
- Liang, J.; Zhang, W.F.; Ren, L.Y. Polarimetric dehazing method for visibility improvement based on visible and infrared image fusion. Appl. Opt. 2016, 55, 8221–8226. [Google Scholar] [CrossRef] [PubMed]
- Zhou, Z.; Wang, B.; Li, S.; Dong, M. Perceptual fusion of infrared and visible images through a hybrid multi-scale decomposition with Gaussian and bilateral filters. Inf. Fusion 2016, 30, 15–26. [Google Scholar] [CrossRef]
- Lin, S.-Z.; Wang, D.-J.; Zhu, X.-H.; Zhang, S.-M. Fusion of infrared intensity and polarization images using embedded multi-scale transform. Optik 2015, 126, 5127–5133. [Google Scholar] [CrossRef]
- Gangapure, V.N.; Banerjee, S.; Chowdhury, A. Steerable local frequency based multispectral multifocus image fusion. Inf. Fusion 2015, 23, 99–115. [Google Scholar] [CrossRef]
- Xiang, T.; Yan, L.; Gao, R. A fusion algorithm for infrared and visible images based on adaptive dual-channel unit-linking PCNN in NSCT domain. Infrared Phys. Technol. 2015, 69, 53–61. [Google Scholar] [CrossRef]
- Meng, F.; Guo, B.; Song, M.; Zhang, X. Image fusion with saliency map and interest points. Neurocomputing 2016, 177, 1–8. [Google Scholar] [CrossRef]
- Liu, Z.; Yin, H.; Fang, B.; Chai, Y. A novel fusion scheme for visible and infrared images based on compressive sensing. Opt. Commun. 2015, 335, 168–177. [Google Scholar] [CrossRef]
- Cai, H.Y.; Zhuo, L.R.; Chen, X.D. Infrared and visible image fusion based on BEMSD and improved fuzzy set. Infrared Phys. Technol. 2019, 98, 201–211. [Google Scholar] [CrossRef]
- Wang, B.; Zeng, J.C.; Lin, S.Z. Multi-band images synchronous fusion based on NSST and fuzzy logical inference. Infrared Phys. Technol. 2019, 98, 94–107. [Google Scholar] [CrossRef]
- Ji, L.N.; Yang, F.B.; Wang, X.X. Similarity measure and weighted combination method of nonlinear possibility distributions. J. Nonlinear Convex Anal. 2019, 20, 787–800. [Google Scholar]
- Satapathi, G.S.; Srihari, P. Rough fuzzy joint probabilistic association for tracking multiple targets in the presence of ECM. Expert Syst. Appl. 2018, 106, 132–140. [Google Scholar] [CrossRef]
- Dubois, D.; Prade, H.; Rico, A. Graded cubes of opposition and possibility theory with fuzzy events. Int. J. Approx. Reason. 2017, 84, 168–185. [Google Scholar] [CrossRef] [Green Version]
- Peng, X.; Yang, Y. Algorithms for interval-valued fuzzy soft sets in stochastic multi-criteria decision making based on regret theory and prospect theory with combined weight. Appl. Soft Comput. 2017, 54, 415–430. [Google Scholar] [CrossRef]
- Zhang, H.M.; Yue, L.Y. New distance measures between intuitionistic fuzzy sets and interval-valued fuzzy sets. Inf. Sci. 2013, 245, 181–196. [Google Scholar] [CrossRef]
- Ji, L.N.; Yang, F.B.; Guo, X.M. Set-valued mapping cloud model and its application for fusion algorithm selection of dual mode infrared images. IEEE Access 2021, 9, 54338–54349. [Google Scholar] [CrossRef]
- Tirupal, T.; Mohan, B.C.; Kumar, S.S. Multimodal medical image fusion based on yager’s intuitionistic fuzzy sets. Iran. J. Fuzzy Syst. 2019, 16, 33–48. [Google Scholar]
- Zhang, K.; Huang, Y.; Yuan, X.; Ma, H.; Zhao, C. Infrared and visible image fusion based on intuitionistic fuzzy sets. Infrared Phys. Technol. 2020, 105, 103124. [Google Scholar] [CrossRef]
- Kavitha, S.; Thyagharajan, K.K. Efficient DWT-based fusion techniques using genetic algorithm for optimal parameter estimation. Soft Comput. 2017, 21, 3307–3316. [Google Scholar] [CrossRef]
- Yang, Y. Multi-Sensor Image Fusion Based on a New Discrete Wavelet Transform Based Technique. Sens. Lett. 2013, 11, 2137–2140. [Google Scholar] [CrossRef]
- Liu, Y.; Jin, J.; Wang, Q.; Shen, Y.; Dong, X. Region level based multi-focus image fusion using quaternion wavelet and normalized cut. Signal Process. 2014, 97, 9–30. [Google Scholar] [CrossRef]
- Chai, P.; Luo, X.; Zhang, Z. Image Fusion Using Quaternion Wavelet Transform and Multiple Features. IEEE Access 2017, 5, 6724–6734. [Google Scholar] [CrossRef]
- Yu, B.; Jia, B.; Ding, L.; Cai, Z.; Wu, Q.; Law, C.H.R.; Huang, J.; Song, L.; Fu, S. Hybrid dual-tree complex wavelet transform and support vector machine for digital multi-focus image fusion. Neurocomputing 2016, 182, 1–9. [Google Scholar] [CrossRef]
- Hu, G.; Li, X.; Liang, D. Thin cloud removal from remote sensing images using multidirectional dual tree complex wavelet transform and transfer least square support vector regression. J. Appl. Remote Sens. 2015, 9, 095053. [Google Scholar] [CrossRef]
- Bao, W.X.; Zhu, X.L. A Novel Remote Sensing Image Fusion Approach Research Based on HSV Space and Bi-orthogonal Wavelet Packet Transform. J. Indian Soc. Remote Sens. 2015, 43, 467–473. [Google Scholar] [CrossRef]
- Zhang, B.; Lu, X.; Pei, H.; Zhao, Y. A fusion algorithm for infrared and visible images based on saliency analysis and non-subsampled Shearlet transform. Infrared Phys. Technol. 2015, 73, 286–297. [Google Scholar] [CrossRef]
- Moonon, A.-U.; Hu, J. Multi-Focus Image Fusion Based on NSCT and NSST. Sens. Imaging Int. J. 2015, 16, 1–16. [Google Scholar] [CrossRef]
- Kong, W.; Wang, B.; Lei, Y. Technique for infrared and visible image fusion based on non-subsampled shearlet transform and spiking cortical model. Infrared Phys. Technol. 2015, 71, 87–98. [Google Scholar] [CrossRef]
- Wang, W.; Chang, F. A Multi-focus Image Fusion Method Based on Laplacian Pyramid. J. Comput. 2011, 6, 2559–2566. [Google Scholar] [CrossRef]
- Du, J.; Li, W.; Xiao, B.; Nawaz, Q. Union Laplacian pyramid with multiple features for medical image fusion. Neurocomputing 2016, 194, 326–339. [Google Scholar] [CrossRef]
- Qu, X.J.; Zhang, F.; Zhang, Y. Feature-Level Fusion of Dual-Band Infrared Images Based on Gradient Pyramid Decomposition. Appl. Mech. Mater. 2013, 347–350, 2380–2384. [Google Scholar] [CrossRef]
- Li, Y.; Li, F.; Bai, B.; Shen, Q. Image fusion via nonlocal sparse K-SVD dictionary learning. Appl. Opt. 2016, 55, 1814–1823. [Google Scholar] [CrossRef] [Green Version]
- Liu, Y.; Liu, S.; Wang, Z. A general framework for image fusion based on multi-scale transform and sparse representation. Inf. Fusion 2015, 24, 147–164. [Google Scholar] [CrossRef]
- Vijayarajan, R.; Muttan, S. Discrete wavelet transform based principal component averaging fusion for medical images. AEU Int. J. Electron. Commun. 2015, 69, 896–902. [Google Scholar] [CrossRef]
- Zhu, P.; Ma, X.; Huang, Z. Fusion of infrared-visible images using improved multi-scale top-hat transform and suitable fusion rules. Infrared Phys. Technol. 2017, 81, 282–295. [Google Scholar] [CrossRef]
- Li, S.; Kang, X.; Hu, J. Image Fusion with Guided Filtering. IEEE Trans. Image Process. 2013, 22, 2864–2875. [Google Scholar] [CrossRef]
- Toet, A.; Hogervorst, M.A. Multiscale image fusion through guided filtering. Target & Background Signatures II. Int. Soc. Opt. Photonics 2016, 9997, 99970J. [Google Scholar]
- Kou, F.; Chen, W.; Wen, C.; Li, Z. Gradient Domain Guided Image Filtering. IEEE Trans. Image Process. 2015, 24, 4528–4539. [Google Scholar] [CrossRef] [PubMed]
- Liu, P.; Li, D. Some Muirhead Mean Operators for Intuitionistic Fuzzy Numbers and Their Applications to Group Decision Making. PLoS ONE 2017, 12, e0168767. [Google Scholar] [CrossRef] [PubMed] [Green Version]
- Xu, Z.; Yager, R.R. Some geometric aggregation operators based on intuitionistic fuzzy sets. Int. J. Gen. Syst. 2006, 35, 417–433. [Google Scholar] [CrossRef]
- Wan, S.-P.; Yi, Z.-H. Power Average of Trapezoidal Intuitionistic Fuzzy Numbers Using Strict t-Norms and t-Conorms. IEEE Trans. Fuzzy Syst. 2015, 24, 1035–1047. [Google Scholar] [CrossRef]
- Chen, S.-M.; Chang, C.-H. A novel similarity measure between Atanassov’s intuitionistic fuzzy sets based on transformation techniques with applications to pattern recognition. Inf. Sci. 2015, 291, 96–114. [Google Scholar] [CrossRef]
- Guo, K.; Song, Q. On the entropy for Atanassov’s intuitionistic fuzzy sets: An interpretation from the perspective of amount of knowledge. Appl. Soft Comput. 2014, 24, 328–340. [Google Scholar] [CrossRef]


| Particular Terms | Description |
|---|---|
| Difference feature | The difference information of infrared polarization and intensity image. |
| Diverse attribute | The type and amplitude of difference features. |
| The type of difference features | The brightness, the edge and detailed features, including gray mean, standard deviation, edge intensity and spatial frequency. |
| The amplitude of difference features | The absolute difference of the feature pixels intensity value of two types of image. |
| Fusion validity | It is used to measure effective degree of fusing the features in fused images and the source images for the specific fusion algorithm. |
| Fusion validity distribution | It can reflect fusion validity changing process of attributes of image difference features to algorithms. |
| Intuition possible sets | It can realize quantitative description of fusion effect changing process of difference feature of images to algorithms. |
| Relative better effect | From the comprehensive consideration of objective evaluation and subjective evaluation, this algorithm has the best fusion effect. |
| Distribution construction | The changing process based on the new method (intuition possible sets) is constructed. |
| Fusion Algorithm | Difference Feature Amplitude Interval | |||||||||
|---|---|---|---|---|---|---|---|---|---|---|
| 1 | 2 | 3 | 4 | 5 | 6 | 7 | 8 | 9 | 10 | |
| A1 | 0.2143 | 0.4742 | 0.6535 | 0.6526 | 0.8095 | 0.9182 | 0.8829 | 0.8962 | 0.9394 | 0.9167 |
| A2 | 0.3571 | 0.3918 | 0.2970 | 0.2211 | 0.2143 | 0.1818 | 0.0450 | 0.0189 | 0.0101 | 0.0167 |
| A3 | 0.0429 | 0.0206 | −0.0198 | 0.1474 | 0.1270 | 0.1091 | −0.0270 | −0.0094 | −0.0101 | −0.0500 |
| A4 | −0.6286 | −0.4845 | −0.4356 | −0.2737 | −0.0635 | 0.0727 | 0 | 0 | −0.0101 | −0.0333 |
| A5 | 0.3571 | 0.5464 | 0.6139 | 0.7053 | 0.7540 | 0.8273 | 0.8378 | 0.7264 | 0.6465 | 0.6167 |
| A6 | 0.3857 | 0.5670 | 0.6733 | 0.6632 | 0.6190 | 0.7818 | 0.8108 | 0.6887 | 0.7374 | 0.6167 |
| A7 | 0.2429 | 0.4124 | 0.5050 | 0.4947 | 0.5159 | 0.5818 | 0.6306 | 0.4906 | 0.5253 | 0.3833 |
| A8 | 0.7000 | 0.7010 | 0.7228 | 0.5368 | 0.5794 | 0.5091 | 0.4865 | 0.5000 | 0.5859 | 0.5333 |
| A9 | 1.0000 | 0.0515 | 0 | 0 | 0 | 0 | 0 | 0 | 0 | 0 |
| A10 | 0.7571 | 0.6392 | 0.3762 | 0.2842 | 0.2778 | 0.1455 | 0.0721 | 0.0943 | 0.0606 | 0.0500 |
| A11 | 0.9143 | 0.1856 | 0.0198 | 0.0105 | 0 | 0 | 0 | 0 | 0 | 0 |
| A12 | 0.1286 | 0.5670 | 0.7129 | 0.6737 | 0.8254 | 0.9182 | 0.8739 | 0.7642 | 0.8081 | 0.8167 |
| Fusion Algorithm | Difference Feature Amplitude Interval | |||||||||
|---|---|---|---|---|---|---|---|---|---|---|
| 11 | 12 | 13 | 14 | 15 | 16 | 17 | 18 | 19 | 20 | |
| A1 | 0.9310 | 0.9286 | 0.9245 | 0.9535 | 1.0000 | 0.9231 | 0.9167 | 1.0000 | 0 | 0 |
| A2 | 0 | −0.1000 | −0.0755 | −0.1395 | −0.0870 | −0.1538 | −0.1667 | 0 | 0 | −1.0000 |
| A3 | −0.0115 | −0.0429 | −0.0943 | −0.0233 | 0.2609 | 0.2308 | −0.3333 | −0.3333 | 0 | −1.0000 |
| A4 | 0 | −0.0143 | −0.0377 | 0 | 0 | 0 | −0.2500 | −0.3333 | 0 | −1.0000 |
| A5 | 0.7241 | 0.8286 | 0.7736 | 0.8372 | 0.8696 | 0.9231 | 1.0000 | 1.0000 | 0 | 0 |
| A6 | 0.8161 | 0.8000 | 0.8491 | 0.8837 | 0.8696 | 0.9231 | 0.9167 | 1.0000 | 0 | −1.0000 |
| A7 | 0.4943 | 0.6000 | 0.5660 | 0.6744 | 0.4783 | 0.3846 | 0.3333 | 0.3333 | 0 | −1.0000 |
| A8 | 0.3678 | 0.0714 | 0.2453 | 0.0465 | −0.4783 | −0.5385 | −0.3333 | −0.3333 | 0 | 1.0000 |
| A9 | 0 | 0 | −0.9623 | −1.0000 | −1.0000 | −1.0000 | −1.0000 | −1.0000 | 0 | −1.0000 |
| A10 | 0.0460 | 0.0714 | 0.0189 | 0.0930 | −0.0870 | −0.1538 | −0.3333 | −0.3333 | 0 | −1.0000 |
| A11 | 0 | −0.0429 | −0.7736 | −1.0000 | −1.0000 | −1.0000 | −1.0000 | −1.0000 | 0 | −1.0000 |
| A12 | 0.8966 | 0.9429 | 0.9057 | 0.9767 | 1.0000 | 0.9231 | 1.0000 | 1.0000 | 0 | 1.0000 |
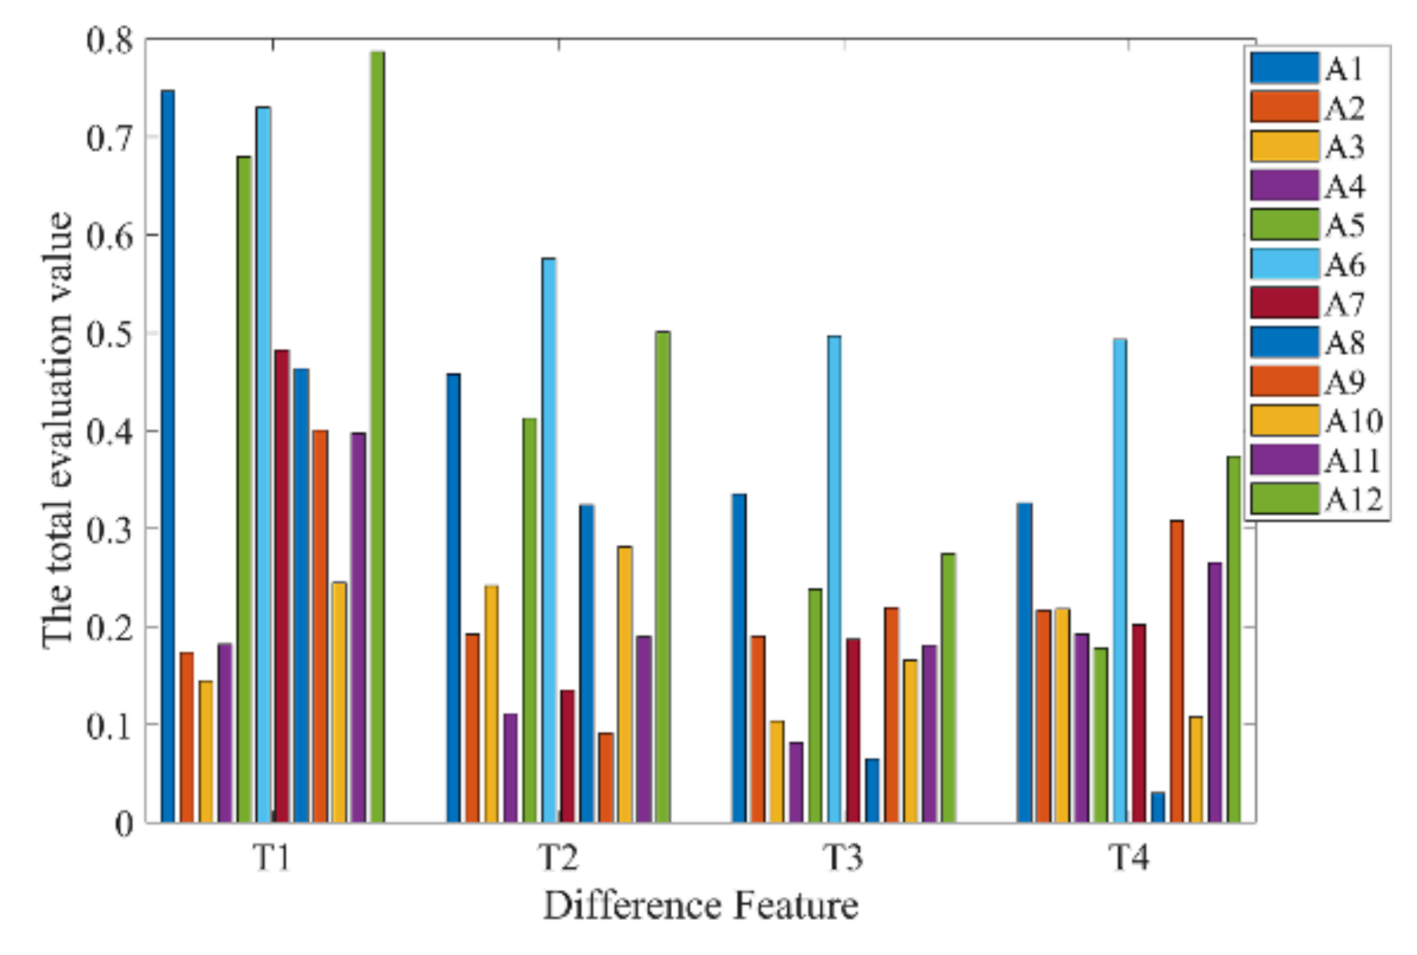
| Fusion Algorithm | T1 | T2 | T3 | T4 |
|---|---|---|---|---|
| A1 | 0.7467 | 0.4579 | 0.3354 | 0.3260 |
| A2 | 0.1738 | 0.1923 | 0.1901 | 0.2168 |
| A3 | 0.1447 | 0.2418 | 0.1036 | 0.2181 |
| A4 | 0.1819 | 0.1115 | 0.0817 | 0.1921 |
| A5 | 0.6794 | 0.4127 | 0.2383 | 0.1781 |
| A6 | 0.7301 | 0.5755 | 0.4967 | 0.4929 |
| A7 | 0.4823 | 0.1355 | 0.1871 | 0.2020 |
| A8 | 0.4635 | 0.3241 | 0.0651 | 0.0303 |
| A9 | 0.4007 | 0.0912 | 0.2193 | 0.3080 |
| A10 | 0.2447 | 0.2817 | 0.1657 | 0.1079 |
| A11 | 0.3973 | 0.1899 | 0.1811 | 0.2653 |
| A12 | 0.7867 | 0.5007 | 0.2744 | 0.3739 |
| Difference Features | Index | Fusion Algorithm | |||||||||||
|---|---|---|---|---|---|---|---|---|---|---|---|---|---|
| A1 | A2 | A3 | A4 | A5 | A6 | A7 | A8 | A9 | A10 | A11 | A12 | ||
| T1, T2 | 0.0207 | 0 | 0.0059 | 0 | 0.0237 | 0.6657 | 0.2219 | 0 | 0 | 0.0148 | 0.0059 | 0.0059 | |
| 0.2140 | 0 | 0.2031 | 0 | 0.3813 | 0.3439 | 0.2101 | 0 | 0 | 0.2226 | 0.2031 | 0.5980 | ||
| Ei | 0.0044 | 0 | 0.0012 | 0 | 0 | 0.2289 | 0.0466 | 0 | 0 | 0.0033 | 0.0012 | 0.0035 | |
| T1, T3 | 0.1030 | 0 | 0 | 0 | 0.0258 | 0.4052 | 0.0585 | 0.1288 | 0.0081 | 0.0094 | 0 | 0.2646 | |
| 0.3341 | 0 | 0 | 0 | 0.3125 | 0.3118 | 0.1430 | 0.4267 | 0.1210 | 0.2688 | 0 | 0.3333 | ||
| Ei | 0.0344 | 0 | 0 | 0 | 0.0081 | 0.1263 | 0.0084 | 0.0550 | 0.0010 | 0.0025 | 0 | 0.0882 | |
| T1, T4 | 0.1592 | 0.0100 | 0 | 0.0149 | 0.1194 | 0.3383 | 0.1741 | 0.0647 | 0 | 0.0697 | 0 | 0 | |
| 0.1818 | 0.2264 | 0 | 0.2814 | 0.5393 | 0.3561 | 0.1917 | 0.2691 | 0 | 0.2918 | 0 | 0 | ||
| Ei | 0.0289 | 0.0023 | 0 | 0.0042 | 0.0644 | 0.1205 | 0.0334 | 0.0174 | 0 | 0.0203 | 0 | 0 | |
| T2, T3 | 0.1633 | 0 | 0 | 0 | 0.0854 | 0.4296 | 0.1985 | 0.0578 | 0 | 0.0226 | 0 | 0.0302 | |
| 0.3727 | 0 | 0 | 0 | 0.5650 | 0.5005 | 0.2120 | 0.3981 | 0 | 0.6550 | 0 | 0.5400 | ||
| Ei | 0.0609 | 0 | 0 | 0 | 0.0483 | 0.2151 | 0.0421 | 0.0230 | 0 | 0.0148 | 0 | 0.0163 | |
| T2, T4 | 0.2111 | 0 | 0 | 0 | 0.0427 | 0.2563 | 0.1231 | 0 | 0 | 0.0427 | 0 | 0.2739 | |
| 0.2440 | 0 | 0 | 0 | 0.5755 | 0.4892 | 0.2553 | 0 | 0 | 0.6599 | 0 | 0.4480 | ||
| Ei | 0.0515 | 0 | 0 | 0 | 0.0246 | 0.1254 | 0.0314 | 0 | 0 | 0.0282 | 0 | 0.1227 | |
| T3, T4 | 0.2601 | 0 | 0 | 0 | 0.0934 | 0.1086 | 0.1010 | 0.0985 | 0 | 0.0253 | 0 | 0.3131 | |
| 0.3210 | 0 | 0 | 0 | 0.6009 | 0.5951 | 0.1894 | 0.3213 | 0 | 0.7471 | 0 | 0.4510 | ||
| Ei | 0.0835 | 0 | 0 | 0 | 0.0561 | 0.0646 | 0.0191 | 0.0316 | 0 | 0.0189 | 0 | 0.1412 | |
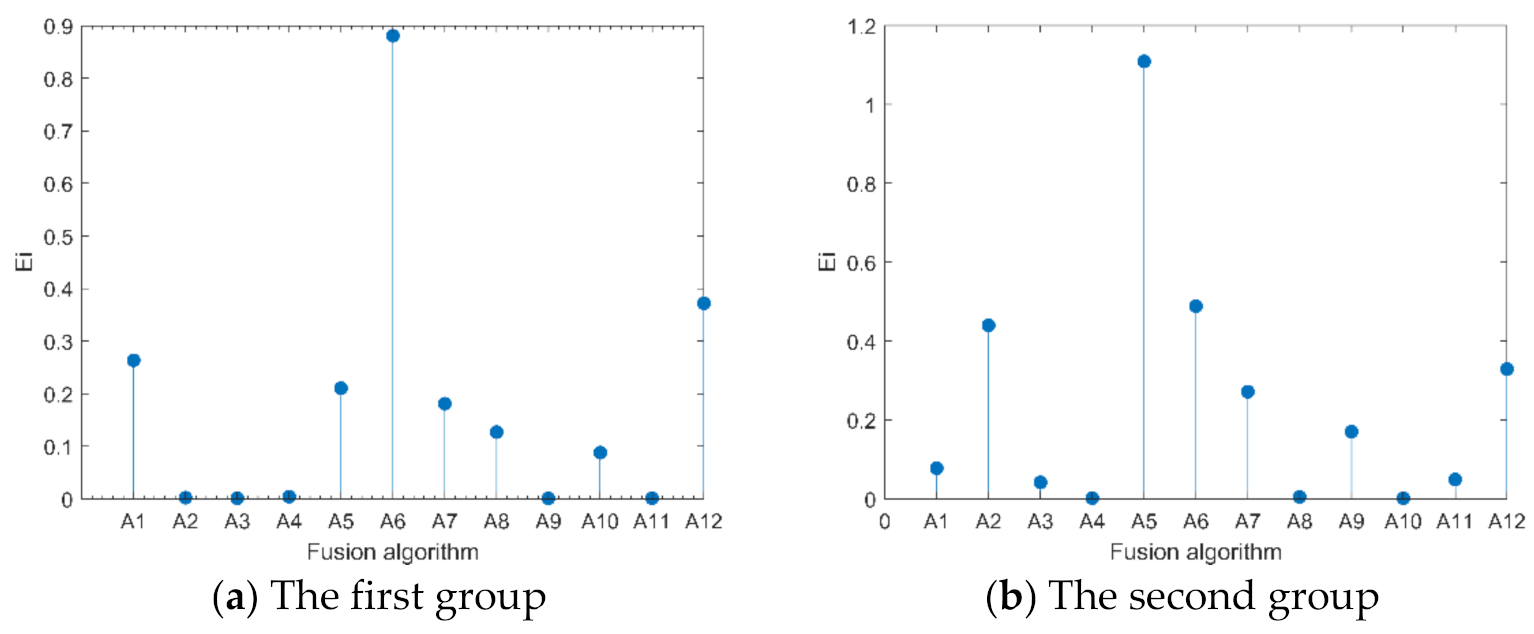
| sum | 0.2636 | 0.0023 | 0.0012 | 0.0042 | 0.2105 | 0.8808 | 0.1810 | 0.1270 | 0.0010 | 0.0880 | 0.0012 | 0.3719 | |
| rank | 3 | 10 | 11 | 9 | 4 | 1 | 5 | 6 | 12 | 7 | 11 | 2 | |
| Difference Features | Index | Fusion Algorithm | |||||||||||
|---|---|---|---|---|---|---|---|---|---|---|---|---|---|
| A1 | A2 | A3 | A4 | A5 | A6 | A7 | A8 | A9 | A10 | A11 | A12 | ||
| T1, T2 | 0 | 0.2553 | 0.0184 | 0 | 0.3289 | 0.0474 | 0.1263 | 0.0184 | 0.0145 | 0.0094 | 0 | 0.1158 | |
| 0 | 0.6891 | 0.8492 | 0 | 0.6361 | 0.8124 | 0.7805 | 0.8492 | 0.6549 | 0.0851 | 0 | 0.6876 | ||
| Ei | 0 | 0.1759 | 0.0156 | 0 | 0.2092 | 0.0385 | 0.0986 | 0.0156 | 0.0095 | 0.0008 | 0 | 0.0796 | |
| T1, T3 | 0.0797 | 0.1087 | 0 | 0 | 0.5966 | 0.1522 | 0 | 0 | 0 | 0 | 0.0338 | 0.0072 | |
| 0.7975 | 0.6974 | 0 | 0 | 0.6790 | 0.7858 | 0 | 0 | 0 | 0 | 0.7048 | 0.7717 | ||
| Ei | 0.0636 | 0.0758 | 0 | 0 | 0.4051 | 0.1196 | 0 | 0 | 0 | 0 | 0.0238 | 0.0056 | |
| T1, T4 | 0 | 0.2746 | 0.0405 | 0 | 0.2197 | 0.1069 | 0.1012 | 0.0405 | 0.0825 | 0 | 0 | 0.2572 | |
| 0 | 0.6857 | 0.6456 | 0 | 0.5714 | 0.8249 | 0.7746 | 0.6456 | 0.2839 | 0 | 0 | 0.6969 | ||
| Ei | 0 | 0.1883 | 0.0261 | 0 | 0.1255 | 0.0882 | 0.0784 | 0.0261 | 0.0234 | 0 | 0 | 0.1793 | |
| T2, T3 | 0.0150 | 0 | 0 | 0 | 0.6675 | 0.1925 | 0.0425 | 0 | 0.1457 | 0.0246 | 0 | 0 | |
| 0.5056 | 0 | 0 | 0 | 0.2652 | 0.4916 | 0.4146 | 0 | 0.4015 | 0.0285 | 0 | 0 | ||
| Ei | 0.0076 | 0 | 0 | 0 | 0.1770 | 0.0946 | 0.0176 | 0 | 0.0585 | 0.0007 | 0 | 0 | |
| T2, T4 | 0 | 0 | 0 | 0.0025 | 0.4347 | 0.0779 | 0.1382 | 0 | 0.0023 | 0 | 0.0553 | 0.1457 | |
| 0 | 0 | 0 | 0.3074 | 0.1668 | 0.4844 | 0.4525 | 0 | 0.6105 | 0 | 0.3465 | 0.2850 | ||
| Ei | 0 | 0 | 0 | 0.0008 | 0.0725 | 0.0377 | 0.0625 | 0 | 0.0014 | 0 | 0.0192 | 0.0415 | |
| T3, T4 | 0.0090 | 0 | 0 | 0.0045 | 0.6014 | 0.2545 | 0.0383 | 0 | 0 | 0 | 0.0180 | 0.0721 | |
| 0.7382 | 0 | 0 | 0.2611 | 0.1995 | 0.4321 | 0.3799 | 0 | 0 | 0 | 0.3426 | 0.3236 | ||
| Ei | 0.0067 | 0 | 0 | 0.0012 | 0.1200 | 0.1100 | 0.0145 | 0 | 0 | 0 | 0.0062 | 0.0233 | |
| sum | 0.0778 | 0.4400 | 0.0418 | 0.0019 | 1.1094 | 0.4886 | 0.2716 | 0.0049 | 0.1705 | 0.0015 | 0.0492 | 0.3293 | |
| rank | 7 | 3 | 9 | 11 | 1 | 2 | 5 | 10 | 6 | 12 | 8 | 4 | |
| Group | Method | Evaluation Index | R | Rank | |||||||
|---|---|---|---|---|---|---|---|---|---|---|---|
| X1 | X2 | X3 | X4 | X5 | X6 | X7 | X8 | ||||
| 1 | A1 | 0.5791 | 0.4356 | 0.7113 | 0.3051 | 0.5886 | 0.4116 | 3.1011 | 0.0534 | 36 | 2 |
| A2 | 0.3698 | 0.3807 | 0.5591 | 0.2022 | 0.6174 | 0.3445 | 4.3507 | 0.0637 | 64 | 10 | |
| A3 | 0.5734 | 0.4118 | 0.7060 | 0.2878 | 0.4635 | 0.3886 | 2.8213 | 0.0556 | 58 | 8 | |
| A4 | 0.4056 | 0.3777 | 0.5651 | 0.1905 | 0.4327 | 0.3432 | 3.1173 | 0.0376 | 82 | 12 | |
| A5 | 0.5587 | 0.4005 | 0.6697 | 0.2745 | 0.5100 | 0.3693 | 3.0407 | 0.0485 | 55 | 7 | |
| A6 | 0.5873 | 0.4663 | 0.6353 | 0.2743 | 0.8514 | 0.4385 | 7.1886 | 0.0686 | 21 | 1 | |
| A7 | 0.4721 | 0.3851 | 0.5955 | 0.2101 | 0.6797 | 0.3510 | 6.3275 | 0.0597 | 51 | 6 | |
| A8 | 0.3651 | 0.3095 | 0.6639 | 0.2452 | 0.4863 | 0.2724 | 3.3568 | 0.0487 | 72 | 11 | |
| A9 | 0.3621 | 0.4446 | 0.6110 | 0.2366 | 0.5029 | 0.4141 | 3.4465 | 0.0313 | 62 | 9 | |
| A10 | 0.4007 | 0.4531 | 0.5648 | 0.2173 | 0.7542 | 0.4633 | 4.0854 | 0.0418 | 50 | 5 | |
| A11 | 0.4587 | 0.4214 | 0.6708 | 0.2751 | 0.6502 | 0.3978 | 3.0044 | 0.0668 | 41 | 4 | |
| A12 | 0.4511 | 0.5241 | 0.5441 | 0.2582 | 0.5451 | 0.5197 | 7.4121 | 0.0558 | 40 | 3 | |
| 2 | A1 | 0.4536 | 0.3853 | 0.5386 | 0.3719 | 0.1691 | 4.5003 | 0.0605 | 0.1259 | 53 | 7 |
| A2 | 0.4849 | 0.3779 | 0.657 | 0.374 | 0.31 | 1.9077 | 0.0538 | 0.2986 | 37 | 3 | |
| A3 | 0.4895 | 0.3549 | 0.6488 | 0.3458 | 0.1678 | 1.5654 | 0.0459 | 0.2517 | 64 | 10 | |
| A4 | 0.4319 | 0.3421 | 0.5639 | 0.3305 | 0.159 | 2.7579 | 0.043 | 0.1568 | 77 | 11 | |
| A5 | 0.4921 | 0.4368 | 0.6406 | 0.4851 | 0.2989 | 8.0634 | 0.0657 | 0.3351 | 17 | 1 | |
| A6 | 0.4663 | 0.3883 | 0.6753 | 0.3824 | 0.268 | 1.9236 | 0.066 | 0.2915 | 32 | 2 | |
| A7 | 0.4377 | 0.3666 | 0.6813 | 0.3546 | 0.2708 | 1.6754 | 0.0659 | 0.2613 | 50 | 5 | |
| A8 | 0.4398 | 0.3846 | 0.5538 | 0.3676 | 0.1829 | 4.4382 | 0.0654 | 0.1175 | 57 | 9 | |
| A9 | 0.4477 | 0.377 | 0.5654 | 0.3211 | 0.2021 | 5.2334 | 0.0489 | 0.322 | 51 | 6 | |
| A10 | 0.2843 | 0.0524 | 0.0652 | 0.0244 | 0.0255 | 4.6624 | 0.0354 | 0.0203 | 88 | 12 | |
| A11 | 0.4442 | 0.3704 | 0.6375 | 0.3619 | 0.2823 | 2.2638 | 0.0504 | 0.227 | 54 | 8 | |
| A12 | 0.5028 | 0.4665 | 0.5359 | 0.4711 | 0.1699 | 6.3297 | 0.048 | 0.1505 | 43 | 4 | |
Publisher’s Note: MDPI stays neutral with regard to jurisdictional claims in published maps and institutional affiliations. |
© 2021 by the authors. Licensee MDPI, Basel, Switzerland. This article is an open access article distributed under the terms and conditions of the Creative Commons Attribution (CC BY) license (https://creativecommons.org/licenses/by/4.0/).
Share and Cite
Ji, L.; Yang, F.; Guo, X. Image Fusion Algorithm Selection Based on Fusion Validity Distribution Combination of Difference Features. Electronics 2021, 10, 1752. https://doi.org/10.3390/electronics10151752
Ji L, Yang F, Guo X. Image Fusion Algorithm Selection Based on Fusion Validity Distribution Combination of Difference Features. Electronics. 2021; 10(15):1752. https://doi.org/10.3390/electronics10151752
Chicago/Turabian StyleJi, Linna, Fengbao Yang, and Xiaoming Guo. 2021. "Image Fusion Algorithm Selection Based on Fusion Validity Distribution Combination of Difference Features" Electronics 10, no. 15: 1752. https://doi.org/10.3390/electronics10151752
APA StyleJi, L., Yang, F., & Guo, X. (2021). Image Fusion Algorithm Selection Based on Fusion Validity Distribution Combination of Difference Features. Electronics, 10(15), 1752. https://doi.org/10.3390/electronics10151752