1. Introduction
The COVID-19 pandemic is impacting many areas, including technology, education, the economy, and social life. COVID-19 has caused increased morbidity around the world. Front-liners are fighting hard to eradicate this pandemic. People in crowds and public areas easily spread this pandemic. A globally accepted strategy to decrease its spread is social distancing. The World Health Organization (WHO) recommends preventive measures such as social distancing and masks and gloves to limit the transmission of the virus from person to person. However, checking or controlling these strategies is inefficient to ensure that a public area is risk-free. Authorities must take extra measures to know about a crowded place or obtain statistics on people who wear masks or practice social distancing [
1]. Machine learning (ML) is a part of artificial intelligence that enables a system to make individual decisions based on trained data models. Currently, computer techniques are used to detect pathogens in the human body. There is an urgent need to find a way to implement the preventive measures needed to limit the spread of the coronavirus. This study presents a system that recognizes interpersonal distances in crowds within a community or a queue in any organization to detect whether a person is wearing personal protective equipment such as a surgical mask and to detect any high body temperatures in a crowded place. This makes it possible to perform risk prediction in public areas. This study also proposes the application of the Internet of Things (IoT) to collect all these input data to be processed by ML algorithms for classifying and predicting the risk based on the given data objects [
2].
Artificial intelligence-based solutions are currently applied for many biomedical health problems and complications such as detection of brain tumors or breast cancer. The existing ML technology can reveal image features that are not visible in the original images [
3]. Moreover, the availability of existing data is enough to allow training of the ML models to predict a correct result. This study uses multiple datasets to compare ML algorithms’ performances to predict risk factors. The analysis focuses on prevention measures such as wearing masks and social distancing, which are more likely to influence overall risk. The success of risk prediction depends on how data are collected from various places. It is recommended to use high-performance IoT sensors and cameras to collect the data required for ML algorithms to learn and understand so that the prediction will be more correct [
2]. In addition, IoT-based ML systems can also minimize the risk of healthcare staff being infected by direct contact with COVID-19 patients. IoT-based health monitoring systems can maintain real-time communication with patients, minimizing contact with healthcare staff. IoT-based deep learning models can also be used for early assessment of COVID-19 by diagnosing infections from the chest X-rays of patients [
4]. For instance, Choyon et al. [
5] used Arduino or Raspberry Pi-based IoT hardware connected to a camera, touchscreen display, wearable physiological and biological sensors, and temperature sensors to collect patient data and feed the data into a cloud network with a powerful server running ML algorithms that can be accessed by healthcare professionals or government authorities. Embedded sensors attached to the IoT hardware can detect temperature, blood pressure, heartbeat, etc., whereas Raspberry Pi can identify different types of data before they are fed into the cloud server. The data received by the server will then be used for training the ML model and prediction.
Currently, many kinds of research on COVID-19 are using the concept of ML and other computer technologies. Some investigations focus on applying ML in detecting COVID-19, whereas others explore prediction of COVID-19 and risk analysis [
6]. Various approaches are used to collect data in these studies, such as predefined data from WHO websites or research portals or real-time data collected from hospitals or people. The core of such research is constituted by data from various resources and ML models are designed and trained using these datasets. Different algorithms play roles in the data analysis, modeling, and prediction processes of these studies. Some algorithms cannot provide accurate results, but the present study finds the best algorithms that can provide more accurate results by applying different ML algorithms to be used along with IoT applications to process and provide valuable predictions. This comparison between popular ML algorithms will be a stepping stone for developers to implement an application based on the algorithms’ performances in this research. This study also recommends that application developers collect data through IoT devices and process those data in cloud-based servers to make predictions in real-time environments.
This paper is organized as follows. A brief introduction to COVID-19 data applications using IoT and ML algorithms is presented in
Section 2.
Section 3 describes the data collection, architecture design, and classification methods. Experimental results are presented in
Section 4 and conclusions in
Section 5.
2. Literature Review
The IoT is a system of devices connected to each other through a network, enabling data transfer automatically among people or objects. The IoT connects different types of devices that can share data efficiently, consisting of sensors and cameras to read data (e.g., temperature, humans, and faces) and networks to send the categorized data to a cloud server, which runs the ML engine. Data analysis and data monitoring are the other aspects of IoT for making real-time decisions based on the input data. The IoT contributes to data mining processes and ML, but the main challenge is the difficulty in processed data reaching the server through the internet. In [
7], a study to assess various ML methods to process IoT data in a smart city environment was presented, using different ML algorithms and further data processing tasks for analyzing data on traffic, weather, citizens, the environment, and other topics. These data were then clustered and optimized to predict traffic, weather, travel patterns, emergencies and anomalies, etc. The study then combined classification and regression ML algorithms to classify the data.
IoT devices are considered as things that can be used to collect various data. IoT sensors collect human data (positions, usage of masks, temperature, etc.) in indoor or outdoor spaces such as schools, streets, playgrounds, offices, shopping malls, and other public areas. Data collection is one of the basic tasks, and the IoT can contribute to ML. The devices or things consist of sensors, embedded systems, and cameras to collect data and transfer these data to a ML engine running in a cloud environment to perform prediction tasks. The communication between these IoT devices and the ML engine can be achieved using mobile networks or wireless networks. The K-means clustering algorithm can group the received data from IoT sensors [
8].
Adam et al. [
9] investigated the role of ML in IoT networks and discussed resource management solutions for wireless IoT. IoT networks support both long-range and short-range communications. Their study recommended that the IoT network in ML environments be scalable, adaptive, and efficient and have a fair network management method. Network resource management is another vital point that needs to be considered in IoT networks. This study emphasized that applying a ML algorithm efficiently can control network resources in an IoT network.
In ML approaches, the learning process is divided into three main parts: supervised learning, unsupervised learning, and reinforced learning. Supervised learning systems use trained data, where the output should meet the requirement of an input. Unsupervised learning systems do not require the desired result, whereas reinforced learning systems learn from external resources and make decisions accordingly [
9]. Data need to be characterized into multiple categories to analyze and recognize safe or unsafe zones. ML applications mainly focus on these data classifications, which are discussed and analyzed in the present paper. Different ML algorithms are used to achieve this goal.
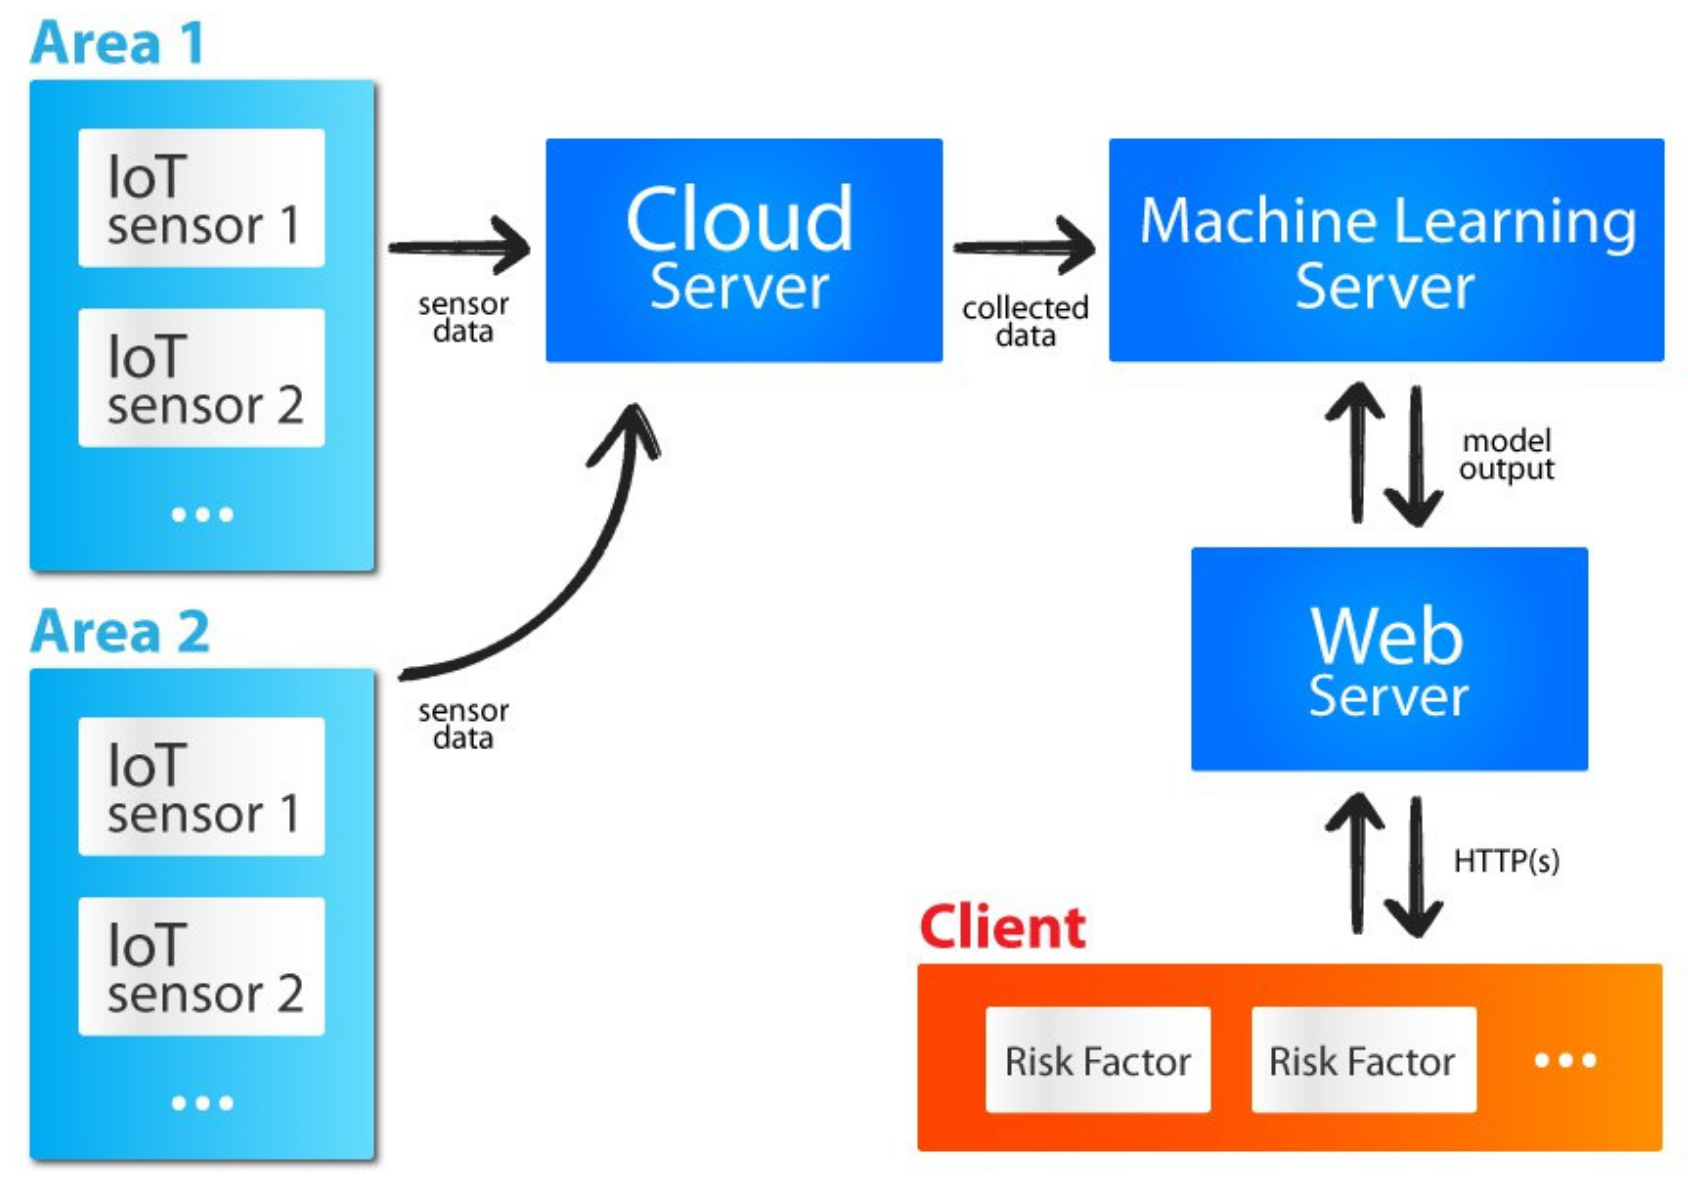
Figure 1 shows the general view of the system and data flow, with data collection through IoT sensors in two different crowded areas, area 1 and area 2. Data are then sent to a cloud server. The collected data will be analyzed using clustering, classification, and prediction algorithms by the ML server. The obtained results will be stored in a web server for public access through an HTTP connection. Finally, the client end will be able to see the area-wise risk factors.
The study conducted by Wang et al. [
10] investigated the potential of a deep learning model for automatic COVID-19 diagnosis by chest computed tomography (CT) volumes. They designed a high-performance COVID-19 diagnosis system with the help of ML classification algorithms and reported that the system requires minimal interpretation by doctors and that it is easy to train the model with artificial software. Built CT volumes were used to train the ML model, which helps predict COVID-19 probabilities using a deep classification network known as DeCoVNet. Research was also conducted in [
7] using the Bayes and random forest algorithms to classify 3000 COVID-19 related posts. These data were collected from a Chinese social media application called Sina Weibo. The collected data were then classified into seven types of situational information to help authorities predict the scale of the spread, sense the public’s mood, and understand the existing situation. The authors claimed that ML algorithms are powerful enough to handle massive data and produce accurate results.
There are different methods used in various studies to mitigate the spread of COVID-19. Most studies have tried to focus on social distancing strategies with the help of distinct types of monitoring devices such as crowd detection sensors and image recognition methods with ML algorithms. However, the prediction of high-risk and low-risk areas is crucial in such scenarios as the system should efficiently read and classify the input data and predict the outcome. In some places, though the crowd might be huge, 95% of the people may wear masks and gloves and practice proper social distancing. Still, if numbers of people are considered as input data to the system, the prediction will not be successful as it will predict such areas as being high-risk. The work presented in [
11] exploits cellular network functionalities to detect if a specific region is at-risk or not. This approach assumes that everyone is carrying cellular mobile devices or other user equipment that can serve as a human tracker. The prediction of at-risk areas is based on the mobility of people. Higher mobility is considered to reflect higher risk. However, the system prediction depends on cellular mobile devices, the presence of which cannot be guaranteed. Another fact that needs to be considered for these systems is that the prediction is not based on social distancing or how many precautions are applied. It is strongly recommended to take safety precautions to reduce the risk of being in a public place more than banning events or implementing lockdowns, which will not be practical for more extended periods.
The efficiency of the ML approach in various studies depends on the number of trained models and the algorithms’ accuracies. In [
12], Sethi et al. used neural networks for medical image classification to identify different lung diseases and predict pneumonia. They used 100,000 X-ray images to train the model to increase the accuracy of COVID-19 prediction. This research proved that a ML algorithm with an efficiently trained model could successfully predict the results. Their accuracy in their results was 99% for all models tested in the study.
IoT networks consist of cameras and sensors to detect human faces and their locations. The prototype built in [
13] utilized various IoT sensors to detect human faces and identify if people were wearing masks or not. The authors claimed that the sensors could clearly sense the face region regardless of size, shape, and color. Furthermore, a large database of models was prepared to achieve this task. The distance between people can also be calculated as the system detects human faces or human bodies. Similarly, IoT temperature sensors can sense an individual’s temperature and send the data to ML software for a perfect prediction of high-risk or minimal-risk regions.
Researchers implemented a deep learning model for biometric face detection frameworks for cities under lockdown during the COVID-19 pandemic. This research aimed to detect human faces using IoT-based sensors to control public movement. It was found that the IoT devices used in the implementation were highly vulnerable to security issues. The researchers discussed the issue of cybercrime and recommended some data security solutions such as device authentication, secured cloud storage, secured internet connections, regular software updates, and encrypted security layers for the IoT sensors [
14]. It is essential to ensure cloud platform security for the exchange of data as these systems handle large amounts of personal data, including individual images.
Performance of data analysis and prediction in ML are based on different algorithms. These algorithms are mainly classified into three categories. First, supervised algorithms are algorithms that will adjust the input variables to control the output. Second, unsupervised algorithms need no specific goal for achieving a target outcome. They manage and cluster all input data for different subsets or groups. Third, reinforced algorithms are trained in making decisions or predictions. Algorithms can learn by themselves by experience with the success or failure of output [
15]. The K-means algorithm is an unsupervised algorithm used for forming data clusters. K in this algorithm is an input for the algorithm. Based on the input value, the algorithm selects K number of real or imaginary locations. The data points neighboring this centroid location are then combined with its location and create a cluster. This process continues until the imaginary or real centroid location does not change [
15].
The random forest algorithm can be described as a collection of decision trees, and recent studies have shown that the random forest algorithm is an efficient classification algorithm as it can classify and handle large amounts of data correctly. To organize large volumes of medical data, in [
16], researchers executed a combination of K-means clustering and the random forest classification method. They also conducted a comparative analysis and found that the K-means algorithm showed better performance. While other algorithms require more time for processing, K-means can partition high volumes of data in comparatively less time. The same study also proved random forest’s efficiency as the algorithm helps ML models learn more quickly compared to other algorithms by interpreting data value sets. First, a randomized training dataset is created to design a random data subset. These data subsets are known as decision trees. The study’s experimental results showed that random forest can classify large amounts of data efficiently compared to the existing LC-KNN and RC-KNN algorithms.
Naïve Bayes is another popular data classification algorithm in ML and it uses probability theory in classification. This algorithm uses a set of probabilities by calculating the frequency and combination of values in a dataset. Several classification methods prove that the naïve Bayes algorithm provides the best area under the curve value compared to other algorithms. Studies also show that this algorithm has the best accuracy compared to the zero-R and decision tree algorithms. The main advantages of using the naïve Bayes algorithm are that it requires less training data, has simple computing, is easy to implement, offers time efficiency and efficiency in handling big data, can handle missing or incomplete data, is not sensitive to irrelevant features, and does not suffer from data noise [
17].
Regression analysis in ML consists of the prediction of a continuous outcome variable. A neural network is considered an intelligent tool in ML, giving some desired output for the given input achieved through various training processes. A training set consists of pairs of input datasets and output sets. This method is the first successful approach introduced in deep learning, which requires minimal data preprocessing [
12]. In previous studies [
18,
19], authors successfully analyzed the current trends of the transmission of COVID-19 in the world using regression algorithms and found an accuracy of approximately 93% in predicting the rise in cases for a period. Neural networks are also among the deep learning techniques used in ML imaging classification. In [
12], Sethi et al. recommended deep learning systems to train a model in a study using a large volume of chest X-rays to pretrain the model, and they found that neural networks helped to learn about the images. Detailed knowledge was transferred to the data model. It was then possible to predict or diagnose cases based on the X-rays in the input data model [
12].
ML models are mainly categorized as supervised and unsupervised models. Supervised models learn a function that directs input data toward output based on the trained input-output pairs. Regression and classification are the two subcategories of supervised models. Unsupervised ML models deals with unlabeled data, such as employee salaries without employee names and IDs. These data will then need to be grouped and segmented based on the behavior of the datasets using a clustering method [
20]. Classification is a process to prepare input datasets by correcting anomalies, removing null values, and finding patterns or relations for training a model to successfully predict the output. The most challenging part of ML classification is the possibility of missing or incorrect data, which may affect model training and classification. There are many classification algorithms used in ML to mine data and each algorithm has its own methods; some of them filter the data based on logic and perception while others use statistical and instance-based learning methods [
21].
Jiang et al. proposed an automated mask detection method with better performance compared to other methods. The “Properly Wearing Masked Face Detection Dataset” was used with the proposed algorithm, which has 9205 images. The Squeeze and Excitation-YOLOv3 object detector algorithm gave very promising results, being more effective, robust, and efficient [
22]. Castillo et al. proposed a model to forecast and predict COVID-19 using a combination of several different artificial intelligence algorithms. This model helps doctors and decision-makers decrease the spread of the virus with early diagnosis and treatment of patients. A neuro-hybrid epidemic prediction model was applied for data extraction and analysis. A recurrent network algorithm was also applied in high-level processing for rule extraction, which had high accuracy, robustness, and speed [
23]. Hnatiuc et al. developed a system to recognize subjects based on gait posture, which gives information for subject identification. Data were collected from different age, gender, height, and weight groups via inertial measurement units. ML algorithms are used for data processing and analysis. Decision tree and KNN algorithms give more promising results at rates above 90% [
24].
The decision tree algorithm can lead ML systems to many outputs based on a given set of inputs for making a prediction or decision. The algorithm can facilitate both prediction and classification in ML. Trees are formed with different hierarchical procedures that will help the system reach certain decisions, such as whether a patient is positive or negative. The algorithm mainly follows an induction process, by which the system will build a tree based on given inputs and a pruning process will remove the complexities of the existing tree [
25].
3. Methodology
Today, data are derived from sensors, smart factories, and social media very quickly in different fields. For this reason, it is necessary to analyze data with different methods to gain full value from them. ML methods are a wise choice for interpreting data in the best, most accurate way.
The main property of ML is the ability to learn from experiences or examples. Significant research has shown that ML technology can predict expected outputs by analyzing all available sample inputs. Computer vision is another essential technique used to train a system to recognize human presence, masks, gloves, and interpersonal distance by incorporating these models’ patterns. Risk prediction could be implemented based on computer vision data inputs and data analytic tools that use specific algorithms [
26].
In this article, data from IoT sensors are analyzed with ML algorithms, results obtained in different ways are compared, and risk areas are determined using the best ML algorithms. This model will help reduce the number of COVID-19 cases by the calculation of risk parameters such as temperature, interpersonal distance, and use of personal protective equipment.
3.1. Data Models and Training
Modeling different data beforehand and then training with different ML methods is the first stage of the system. Classifying different values obtained from the data model is important. The system classifies its data into safe and unsafe categories based on interpersonal distance, body temperature, and presence of mask and gloves. These parameters can be measured using IoT devices and detected using different ML algorithms. The decision tree algorithm and naïve Bayes classifier are used to classify these data by automatically dividing them into multiple classifications. These algorithms can provide rules of classifications in a human-legible format [
27]. The input data are analyzed by applying statistical methods and relational expressions to make multiple predictions [
9]. The random forest algorithm uses mathematical expressions between these predictions to achieve risk prediction in this work. The algorithm also provides a regression technique to randomly select data from among all the input data.
A data clustering technique is used to compare the input data and the trained data. First, it will identify a set of matched data objects as described in [
10]. Secondly, data are partitioned into safe and unsafe datasets based on parameters such as temperature, interpersonal distance, and personal protective equipment (mask and gloves). The K-means classical clustering algorithm is used to achieve this by making multiple clusters, in which aggregated data instances in a cluster are the same but data objects in different clusters are different [
28].
This paper proposes a system in which IoT sensors collect nonpersonal data such as the distance between human objects, temperature, and use of a mask; personal data such as person’s image, age, or name are not necessary for the system to analyze and predict the risk. Hence, this paper ensures that the privacy of each individual is protected. In this work, we do not collect personal private data such as age, name, address, or image; therefore, there is no issue of privacy in data collection.
3.2. Architecture Design
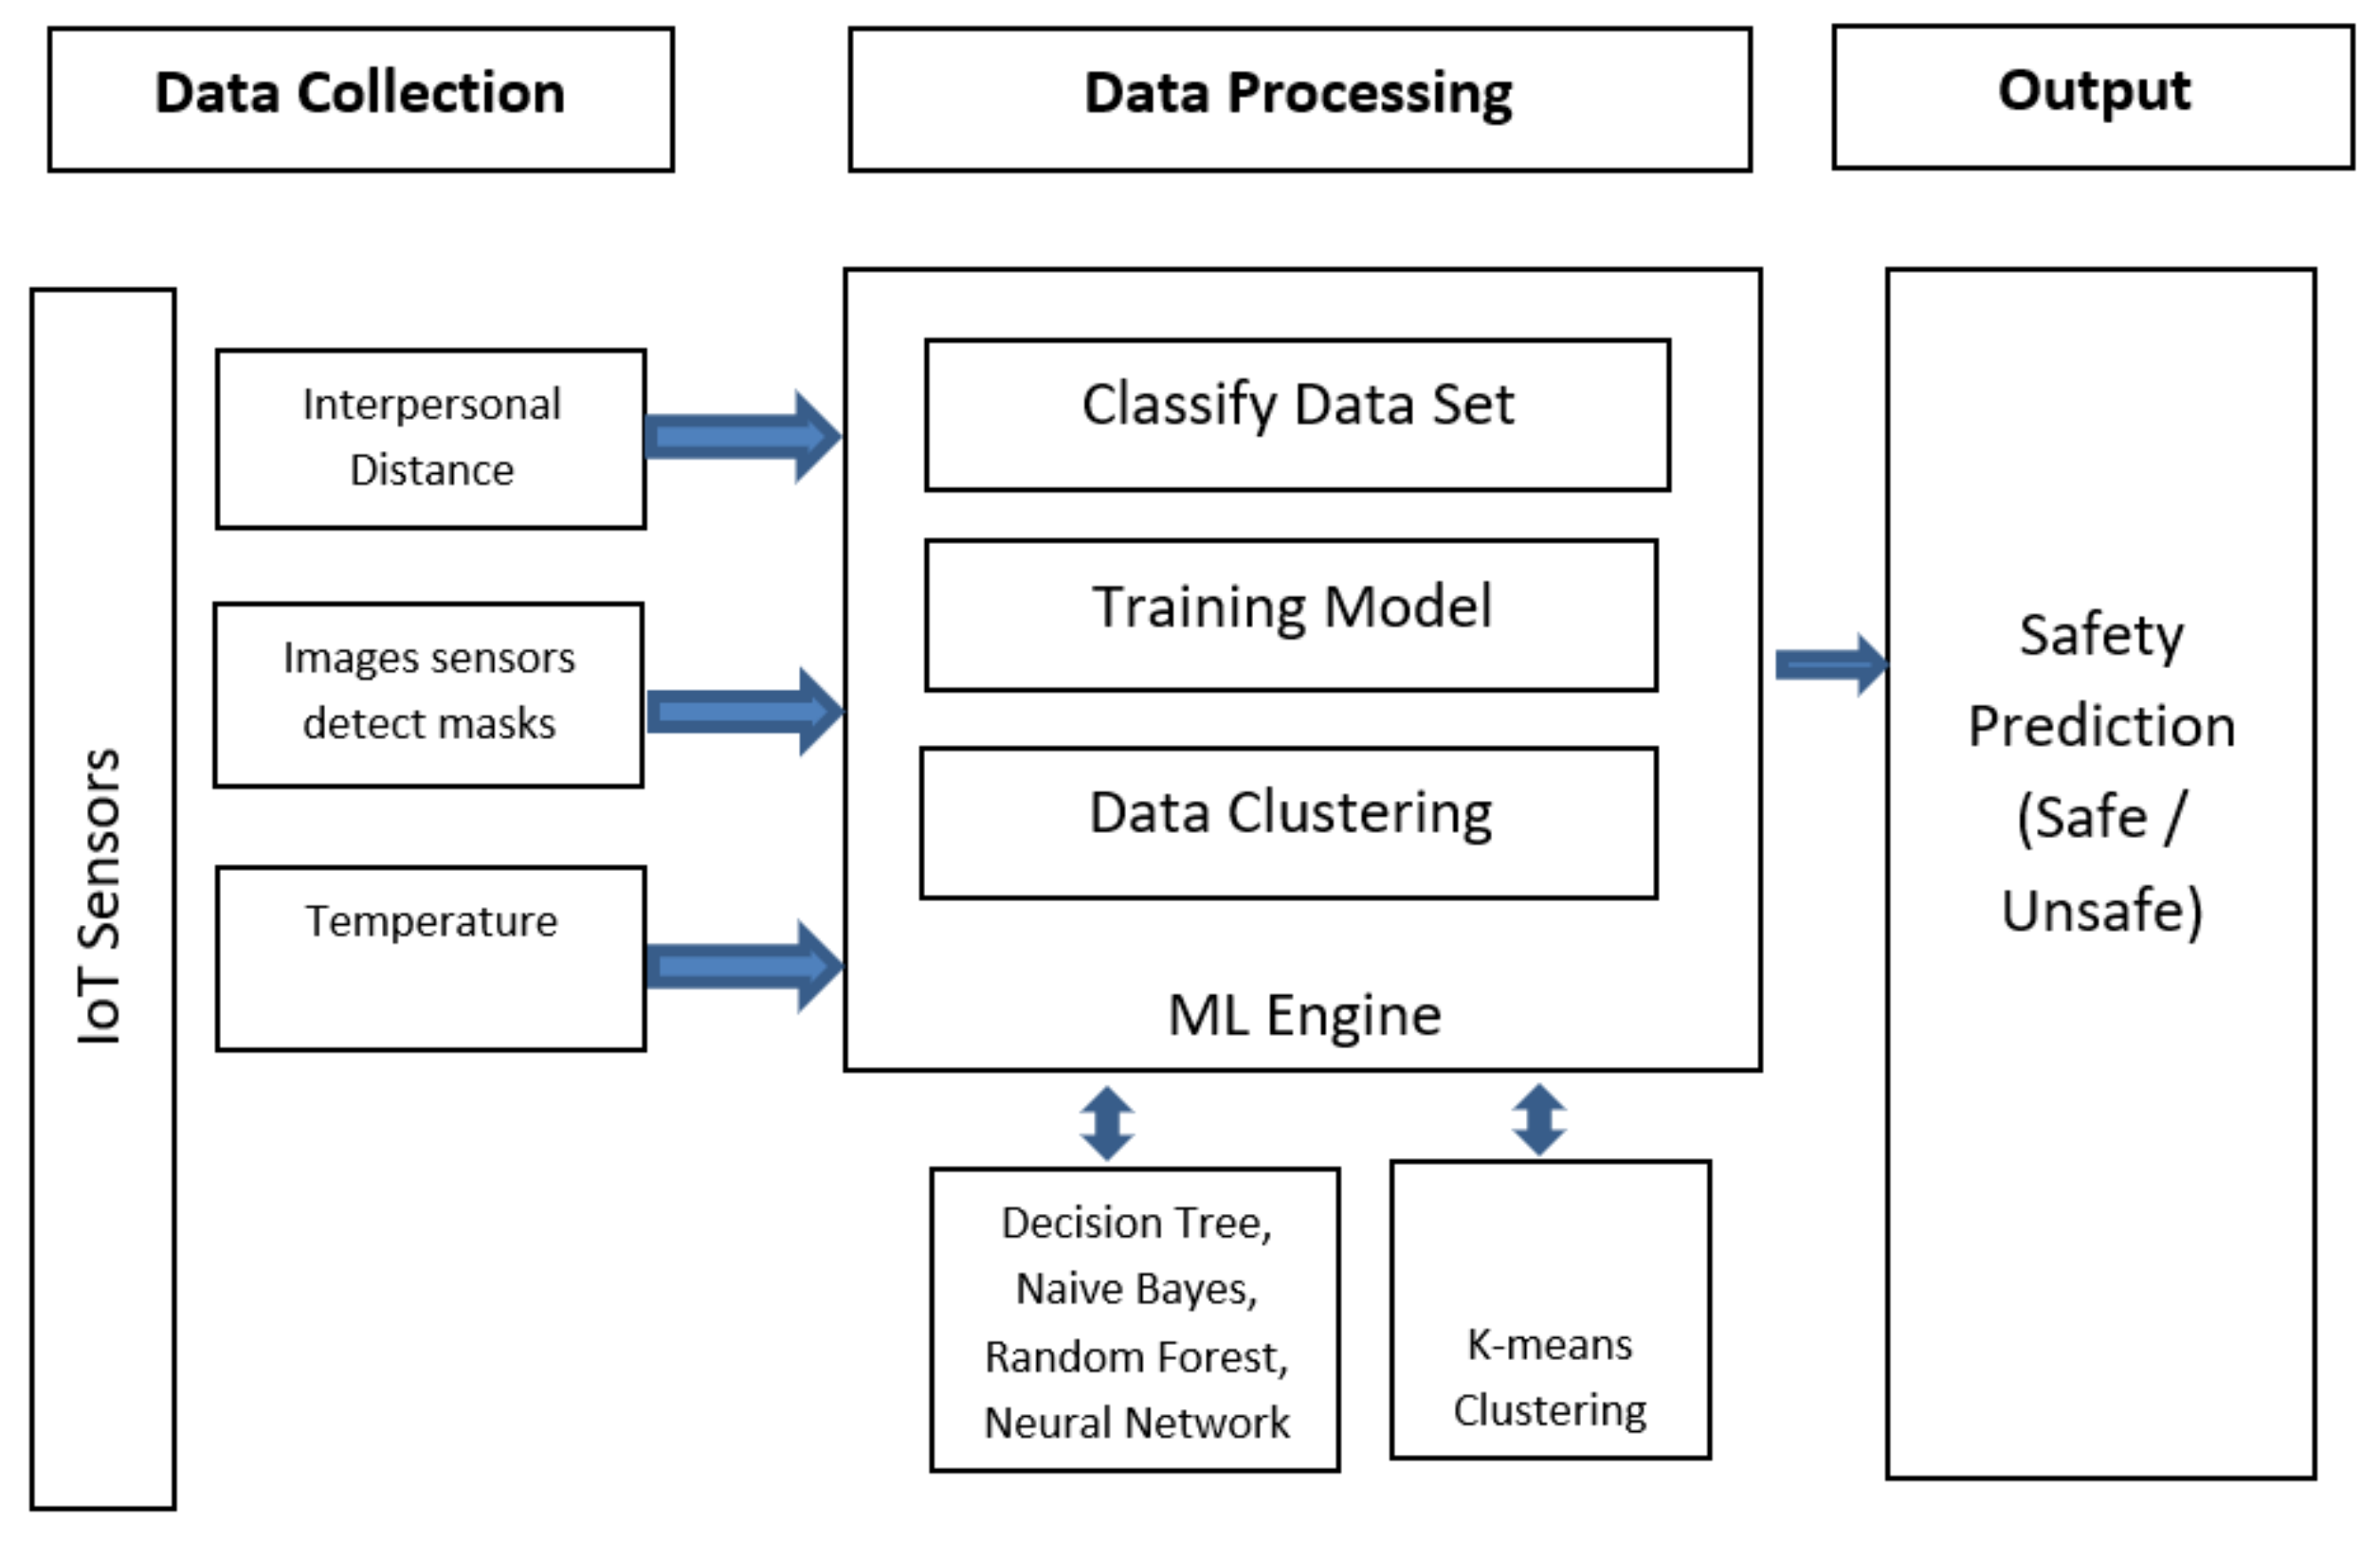
The architecture, as depicted in
Figure 2, consists of the following parts:
Data Collection: IoT sensors are used to collect data, such as interpersonal distance and images. Initially, data are collected from IoT devices in order to incorporate them into the data procession operation.
Data Processing: The collected data will be sent to the data processing module. There, they are initially classified and clustered. Some of the data are used for the training model. This module deals with organizing, modeling, and clustering the data using ML algorithms to predict the results. Different ML algorithms are used to evaluate the performance of different algorithms.
Machine Learning Engine Platform: Different ML algorithms yield different results for risk parameters. The results are compared to obtain the best decision by the calculation of safety parameters.
Display: Processed data from the data processing module are sent to the systems that need to take action about the results. Based on the received and processed data, details about places and their risk assessments denoted as safe or unsafe will be the output of the model.
ML algorithms have been used in many areas, from biomedical data classification to self-driving cars [
29,
30]. IoT applications are prevalent nowadays because video cameras and hardware are tiny and cheaply available everywhere [
31]. Devices connected to the internet collect information about moving objects to process and monitor them for security purposes in automated decision-making. IoT sensors collect several types of moving object data from crowds in both outdoor and indoor spaces [
32,
33]. In this work, we collected data for three different people’s contacts and created a data vector for each crowd as follows:
V = [{Distance from person A to person B}, {Distance from person B to person C}, {Distance from person A to person C}, {Mask status of person A}, {Mask status of person B}, {Mask status of person C}, {Temperature of person A}, {Temperature of person B}, {Temperature of person C}, {CLASS: Safe or Unsafe}]
Here, A, B, and C represent three different people in the same crowd. In our research, we collected data using IoT sensors. Several ML algorithms are applied to predict, classify, and cluster crowd data vectors. We use 800 crowd data vectors {V1, V2,……, V800} for a total of 7200 data. Some of the data are used for training and others are used for testing depending on the algorithm that we apply. Some of the data are available from the Multidisciplinary University Research Initiatives (MURI) dataset [
34]. In addition to MURI, other data are simulated and labeled using medical experts’ support in the classification of data as safe or unsafe for physical distances in crowds. Each vector belongs to one of the two classes of safe and unsafe. Automatically understanding whether a group is safe or unsafe in terms of COVID-19 physical distancing rules is vital for reducing the spreading of the virus in public. Low-level processing is the first phase of the automated decision. First, objects and crowds should be detected, and then features should be extracted for the second phase. High-level processing is the second phase, where the feature vector is an input [
35,
36,
37]. Data samples for each class is given in the below.
SAFE Class: distance {A, B} = 0.8; distance {B, C} = 1.2; distance {A, C} = 1.3; mask {A} = 1; mask {B} = 1; mask{C} = 0; temperature {A} = 37; temperature {B} = 36.5; temperature {C} = 35.9.
UNSAFE Class: distance {A, B} = 0.6; distance {B, C} = 0.8; distance {A, C} = 0.5; mask {A} = 0; mask {B} = 1; mask{C} = 0; temperature {A} = 38.5; temperature {B} = 36.5; temperature {C} = 36.2.
In this study, we evaluate data using high-level processing for classification and rule extraction. The decision tree (DT), neural network (NN), naïve Bayes classifier (NBC), support vector machine (SVM), Bayesian network classifier (BNC), locally weighted learning (LWL), logistic regression (LR), AdaBoost.M1 (ABM1), Hoeffding tree (HT), and random forest (RF) algorithms are used to classify the dataset. Comparing the building model’s performances, LWL yields the best performance along with the NBC and RF algorithms. Test model performance is worst for LWL. Other models give much better performance for test modeling. Weka is used as open-source, freely available, and platform-independent software for implementation environments. Weka is a tool for ML algorithms written in Java and developed at the University of Waikato. In the present study, Weka is used for preprocessing, regression, classification, and clustering of data retrieved from the IoT [
38].
This paper proposes a system in which IoT sensors collect nonpersonal data such as the distance between human objects, temperature, and mask usage; personal data such as a person’s image, age, or name are not necessary for the system to analyze and predict risk. Hence, this paper ensures that individuals’ privacy is protected. The distance dataset is taken from MURI research, while the mask and temperature datasets are simulated using the Weka data generator tool. There are two classes in the dataset, labeled based on WHO standards. IoT sensors in this system should be low-cost and can be easily connected to other hardware and software. The VL531x time of flight (ToF) sensor can be used to measure distance between human objects. A Raspberry I camera can also be included in the system to detect distances between individuals. LM34/TMP34, LM35/TMP35, or TMP36 temperature sensors are suitable for the proposed system with wider temperature ranges. For mask detection, the computer vision-based Raspberry Pi single-board computer equipped with a camera module can be used.
Random forest, naïve Bayes classifier and decision tree algorithms (Algorithms 1–3) are given in the below [
16,
17,
20].
| Algorithm 1: Random Forest Algorithm |
INPUT: Data set V; ensemble size S; subspace dimension n.
FOR s = 1 to S DO
Build a bootstrap sample vs. from V by sampling |V| data points with replacement.
Select n features at random and reduce the dimensionality of vs. accordingly
Train a tree model Ms on vs. without pruning
END
OUTPUT: Ensemble of tree models |
| Algorithm 2: Decision Tree Algorithm |
INPUT: Data partition V, attribute list L, attribute selection list A
Create a node N
IF dataset in V are belongs to the same class C
THEN return N
Function attribute selection method to FIND best split attribute
FOR each outcome i of splitting criterion
Vi set for satisfying outcome
IF Vi is empty
THEN attach leaf with majority class in V
ELSE
Attach the node returned by function generate tree
END
OUTPUT: A decision tree |
| Algorithm 3: Naïve Bayes Classifier Algorithm |
INPUT: Training data set V, attribute list A = {a1, a2,…an}
Read the training set V
Calculate the mean and standard deviation of the predictor attributes for each class
FOR each attribute
Calculate the probability of all predictor attributes A = {a1, a2,…an}
END
Calculate the probability for each class
OUTPUT: A class of testing dataset |
4. Experimental Results
There are several ML algorithms used for classification and rule extraction in this work. The decision tree (DT), neural network (NN), naïve Bayes classifier (NBC), support vector machine (SVM), Bayesian network classifier (BNC), locally weighted learning (LWL), logistic regression (LR), AdaBoost.M1 (ABM1), Hoeffding tree (HT), and random forest (RF) algorithms are used to classify the dataset. The neural network algorithm, decision tree, and AdaBoost.M1 give more than 93% accuracy based on the experiments [
39]. The random forest and naïve Bayes classifiers result in more than 97% accuracy, and the support vector machine algorithm gives 85.75% accuracy for the same dataset.
Table 1 shows the accuracy rates of these classification algorithms for crowd safety data taken from IoT sensors. For all classification algorithms, 67% of the data are used for training and the rest of the data are used for testing [
40,
41,
42]. The study includes 800 crowd data, 542 of which belong to the safe class while 258 belong to the unsafe class. Sixty percent of the data are used for training and the rest are used for testing for all ML algorithms. Many of the works related to prediction of COVID-19 from patient records have used a few ML algorithms regardless of performance accuracy, whereas this paper addresses the collection of real-time data with the help of IoT sensors to predict the risk of COVID-19 in public areas and analyze the performance of the leading ML algorithms to suggest the best algorithm based on performance accuracy in terms of prediction.
Table 2 and
Figure 3 show the performance indicators for the applied ML algorithms for crowd data classification. “True positive” (
TP) indicates the rate of correctly classified data and “false positive” indicates the rate of incorrectly classified data. The naïve Bayes classifier gives a 90.9%
TP rate for the safe class and 78.2%
TP rate for the unsafe class. The random forest and locally weighted learning algorithms have the lowest
TP rate for the unsafe class, while neural network has the highest
TP rate for the unsafe class. The
F-measure is also considered as the combined accuracy of precision and recall for the given data:
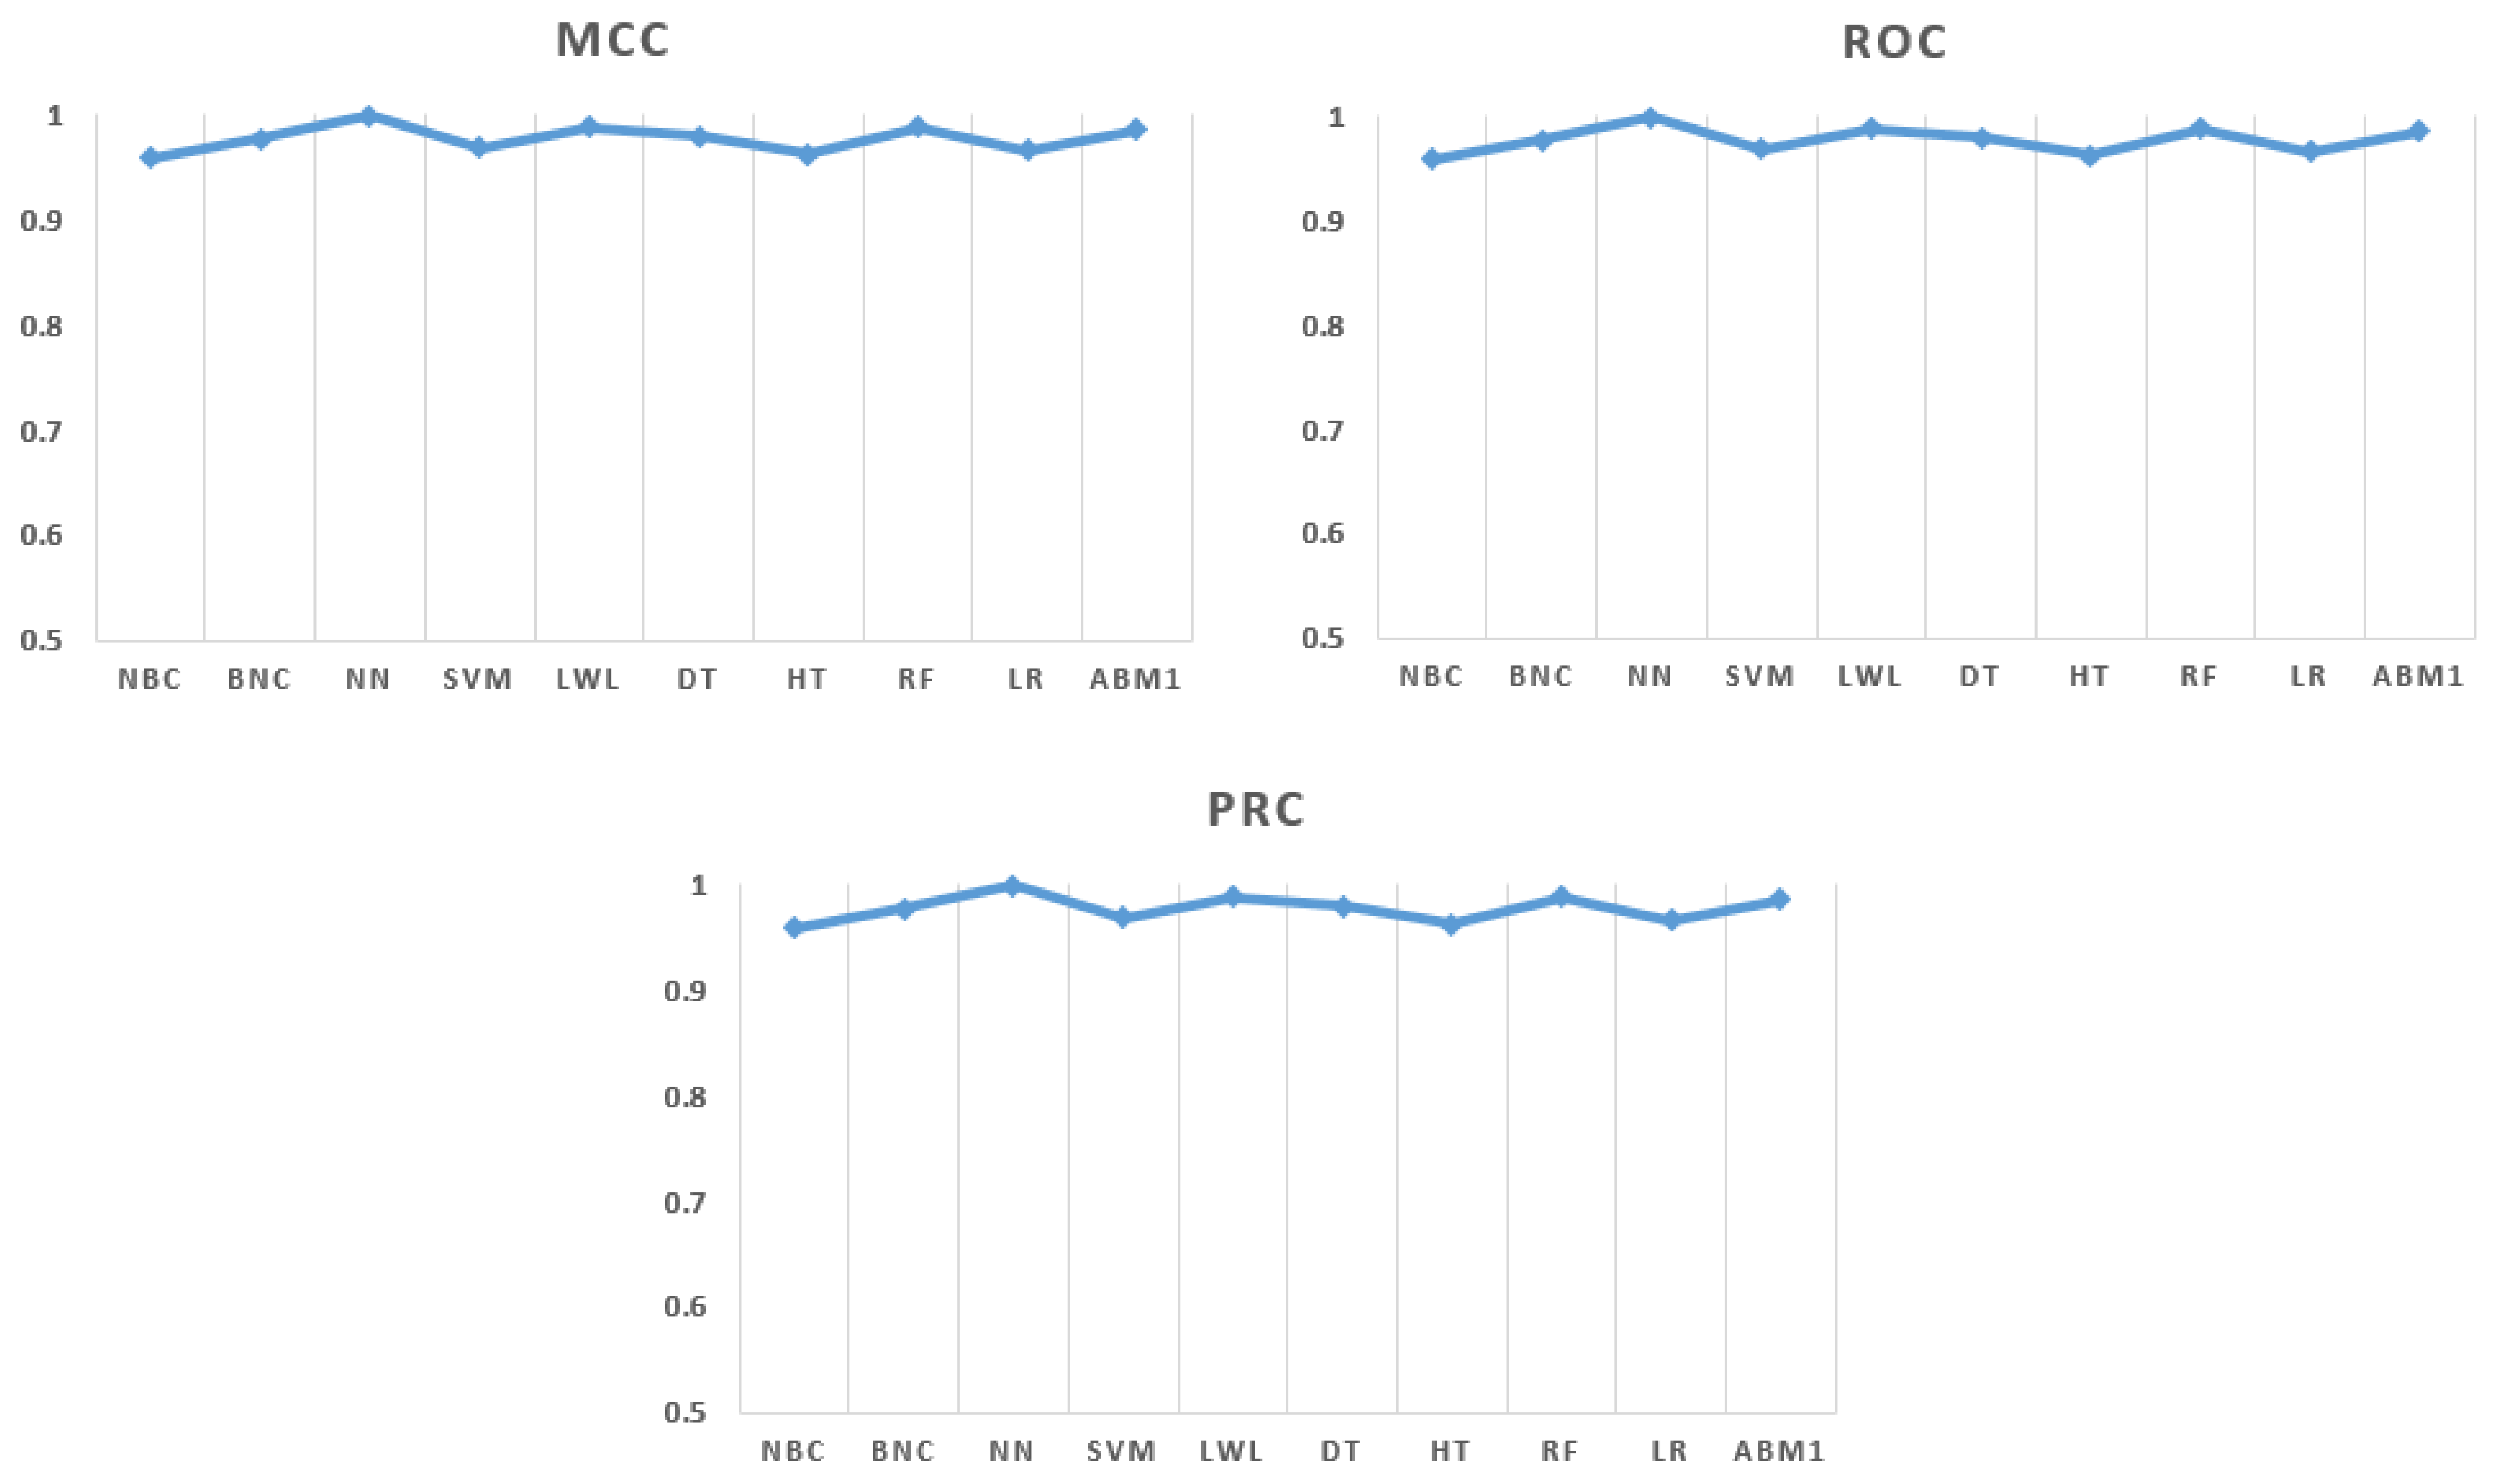
The Matthews correlation coefficient (MCC) measures the quality of ML algorithms for two-class problems. The MCC uses true positives and negatives and false positives and negatives. It measures the balance of accuracy between the classes and is calculated as follows:
If there is a correlation between the predicted and observed classifications of the dataset, the MCC value will be between −1 and +1. If the MCC value is +1, it means that there is perfect prediction between the classes. If the MCC value is −1, it means that there is disagreement between the classes. Experimental results show that all algorithms tested in this study give excellent MCC values. This shows the quality of the data, which have been observed from IoT sensors. The receiver operating characteristics (ROC) curve is another important quality measurement for ML classification algorithms. It shows the general performance of the data for each class. To create the ROC curve area,
TP and
FP rates are needed. If the ROC area is 1, it shows the perfect quality of the ML classification algorithm. If the ROC area is 0.5, it shows the random (chance) accuracy.
Table 2 shows that all algorithms have ROC area values of more than 0.9, which is very promising. Based on the ROC area, the neural network algorithm gives more accurate results than the other algorithms. The precision-recall curve (PRC) is used less frequently than ROC curves. If data are unbalanced and complex, however, it is better to use the PRC. Perfect datasets and classifications give PRC results of 1. In this case, the neural network and random forest algorithms give better PRC values than the other algorithms [
43,
44].
A decision tree is a flowchart-like structure in which each inner node shows an attribute such as distance from A to B, distance from A to C, distance from B to C, Mask A, Mask B, Mask C, etc. Each leaf node represents a category label, which is SAFE or UNSAFE. The Hoeffding tree ML classification algorithm retrieves rules from complex data streams, being an incremental version of the decision tree algorithm. With the Hoeffding tree algorithm, nodes are expanded as soon as there is enough statistical evidence for that path. Crowd data classification, with data received from IoT sensors, is very suitable for both the decision tree and Hoeffding tree rule extraction algorithms. The random forest (RF) algorithm, meanwhile, is very successful at classification and regression. It uses several decision trees to predict rules from large datasets. Decision trees use the entire dataset for classification; on the other hand, the random forest algorithm selects specific features and records to classify data.
Table 3 below shows all rules extracted from the decision tree, Hoeffding tree, and random forest algorithms. The random forest and Hoeffding tree algorithms produced more rules than the decision tree algorithm. The decision tree algorithm has longer paths than the other two algorithms. Another advantage of the random forest algorithm is running time complexity to build a model. The random forest running time is 0.02 s, the Hoeffding tree running time is 0.05 s, and the decision tree running time is 0.09 s with Weka [
45].
Table 4 shows error measurement values for each classification algorithm, including the kappa statistic (KS), relative absolute error (RAE), root mean squared error (RMSE), and root relative squared error (RRSE). The KS is a corrected measurement between observed and actual classes. Kappa is calculated as follows
Here,
pe is the probability of change agreement and
p0 is observed agreement between rates. If there is an agreement between observed and expected values, then
κ will be 1; otherwise, it will be ≤0. Any value of
κ greater than 0 shows that the results are better than chance.
Table 4 shows that the kappa values for the neural network and random forest algorithms are very close to 1; on the other hand, the kappa values of the naïve Bayes classifier and Hoeffding tree are close to 0.5. The RAE measurement is used frequently in ML and data mining applications. It is a measurement between the actual value and naïve model value:
Here, A reflects actual values and B expected values. Ideal RAE values are less than 1. Random forest and neural network give the best RAE values; on the other hand, locally weighted learning and the naïve Bayes classifier give less promising RAE values. Another metric, the RRSE, uses the average of actual values as a simple predictor. Ideal RRSE values are close to 0. In this work, the best RRSE value is that for the random forest algorithm at 0.0091, reflecting the minimum error value based on the RRSE metric.
There are several ways to compare ML algorithms, including accuracy, error rate, visualization, and time performance.
Table 5 shows the time performance for building a model (training) and time performance for testing a model. Locally weighted learning takes only 0.01 s to build the model; on the other hand, the neural network algorithm needs 0.89 s to build the model. Testing the model usually takes less time than training. In this work, locally weighted learning takes 1.72 s, the naïve Bayes classifier takes 0.07 s, support vector machine takes 0.04 s, and other algorithms take only 0.01 s for 800 crowd data [
46].
In ML, there are many different clustering algorithms. Several algorithms use similarity or distance measures between examples in the characteristic space, which is an excellent way to discover dense observations. In this research, several clustering algorithms are applied, including EM, K-means, density, filtered, and farthest first. The accuracy for correctly clustering data for each cluster (safe and unsafe) is given for each algorithm in
Table 6. We applied a linear regression algorithm for prediction [
36]. It works by estimating coefficients for a line or hyperplane that satisfactorily fits the training statistics. It is a very simple regression algorithm and fast to train, and it may have superb performance if the output variable for the data is a linear mixture of the inputs. The regression algorithm gives very promising results (90% accuracy) for testing data [
37,
39].
Figure 4 shows the margin curve for the classification algorithms that we applied for the crowd dataset. A margin curve generates points illustrating the prediction margin. The margin is defined as the difference between the probability predicted for the actual class and the highest probability predicted for the other classes. The
x-axis shows the curve value and the
y-axis indicates the number of data. In this work, we used 800 crowd data. The margin is between −1 and +1. Incorrect classification yields values close to −1 and correct classification yields values close to +1 in
Figure 4. In
Figure 4a, based on the naïve Bayes classifier, some of the data have values close to −1, which is incorrect classification, but most of the data have values close to +1, reflecting correct classification. BNC, LR, SVD, LWL, ABM1, and HT have behavior similar to that of the NBC algorithm. However, the DT, NN, and RF algorithms give more promising results according to the figure below because none of them generate values close to −1.
5. Conclusions
COVID-19 is a community-acquired infection with symptoms resembling influenza and bacterial pneumonia. It has negatively affected the entire world in terms of economy, social life, education, and technology. Many health organizations confirm that it is very important to maintain physical distance and wear a mask to reduce the risk of COVID-19. Fever is also among the signs and symptoms of COVID-19. In our study, we have proposed a new approach that uses ML algorithms to monitor the risk of COVID-19 in public spaces using physical distancing, the presence of masks, and temperature. Our model can also make decisions to calculate risk with ML algorithms by adding other risk parameters to the system. In this work, we have proposed a new approach for monitoring crowds using IoT technologies and machine learning algorithms to detect safe and unsafe areas. IoT sensors collect data from indoor and outdoor areas in the feature vector. There are several ML algorithms used for classification, clustering, and prediction. The decision tree algorithm gives 94.50%, the naïve Bayes classifier gives 99.37%, and the random forest algorithm gives 97.32% accuracy using the same training and testing dataset. Expectation maximization (EM) and K-means algorithms are applied for clustering, and the K-means algorithm gives better results for two clusters compared to other algorithms. Time performances for building the model (training) and testing the model also provide very promising results. Locally weighted learning takes only 0.01 s to build the model; on the other hand, the neural network algorithm needs 0.89 s to build the model. Testing models usually takes less time than training them, and in this work, locally weighed learning takes 1.72 s, the naïve Bayes classifier takes 0.07 s, support vector machine takes 0.04 s, and the other algorithms take only 0.01 s for 800 crowd data.
We achieved high validation rates for our model by calculating risks using datasets. We achieved classification accuracy of 99.37% using the naïve Bayes classifier. We used a fixed dataset in our model. However, people often move at certain speeds indoors. The limitation of this study is related to the accurate capture and use of large numbers of data from moving objects. We plan to add other ML algorithms such as deep learning techniques to improve our model in our future work.


