Article

Numerical Analysis on the Effects of Saline Injection and Deformation for Radiofrequency Catheter Ablation

Integrated Medical Technology Team, Medical Device Development Center, Department of Research & Development, Osong Medical Innovation Foundation, Cheongju-si 28160, Korea
*
Author to whom correspondence should be addressed.
Electronics 2021, 10(14), 1674; https://doi.org/10.3390/electronics10141674
Submission received: 14 June 2021 / Revised: 2 July 2021 / Accepted: 7 July 2021 / Published: 13 July 2021

Abstract

:
Radiofrequency catheter ablation is an interventional procedure used to treat arrhythmia. An electrode catheter that could inject saline has been developed to prevent steam pop on heart tissue during radiofrequency catheter ablation. Thus, we investigated to numerical model on the effect of saline injection and heart tissue’s deformation. In this study, the hyperelastic model was implemented to analyze heart tissue deformation due to the catheter’s contact force. Besides, the advection–diffusion equation was used to analyze the mixture between saline and blood. We developed the multiphysics model that predicts thermal lesions based on the deformation of the heart and mixing between saline and blood flow. The thermal lesion and the maximum temperature in the numerical model that considered mixing saline and blood were smaller than that of other numerical models that did not consider mixing. Therefore, we observed that the saline injection was affected by thermal lesion due to higher electrical conductivity than blood flow and injection at a lower temperature than the human body. The numerical model was researched that considering the deformation of the heart tissue and saline injection in radiofrequency catheter ablation affects the heart tissue’s thermal lesion and maximum temperature.

1. Introduction

Radiofrequency catheter ablation is an interventional procedure for treating arrhythmia. This procedure is performed by inserting an ablation catheter into the heart through a vein and applying radiofrequency current between an electrode of the ablation catheter and a ground electrode attached to the back of a patient to generate Joule heating. The heat generated at the electrode necrotizes the heart tissue that causes arrhythmia, thereby treating arrhythmia. If the temperature of the heart tissue and the electrode increases to become more than 80 °C while performing radiofrequency catheter ablation, the blood flowing inside the heart attaches with the electrode to generate a thrombus. Therefore, increasing the heart tissue impedance can cause steam pops at the electrode [1,2,3]. An electrode equipped with holes has been developed for saline injection to prevent this phenomenon [4,5,6,7,8,9]. The phenomenon in which an electrode catheter inside the heart injects saline involves mixing blood and saline. Thus, changes in the material property of electrical conductivity must be considered. Because the electrical conductivity of saline is higher than blood flow, it affects the impedance of the electrode. In addition, the saline temperature is lower than body temperature, which affects the generation of the thermal lesion in the heart tissue due to convective heat transfer when injected from the electrode. Some studies have investigated the numerical analysis of radiofrequency catheter ablation used to predict the thermal lesion of tissues [3,10,11,12,13,14,15,16,17,18,19]. However, previous studies have a limitation that blood flow or the change of electrical conductivity of saline was not considered. Some studies have ignored the area on the blood inside the heart and replaced it with the heat flux boundary condition using convective heat transfer coefficient, whereas some studies that considered the area on the blood inside the heart replaced it with the same to perform the analysis [3,11,14,15,16]. Furthermore, the saline injection flow should be considered because the flow that changes due to saline injection affects the convective heat transfer of the electrode, blood, and heart tissue. However, some studies have been ignored or the boundary condition replaced with a specific temperature at the electrode to perform numerical analysis [11,17]. Although some studies have analyzed the numerical model by considering the flow of saline injection of the electrode, they simplified the phenomenon by transforming the injection of saline through the injection holes of the electrode into the injection of saline on the electrode surface. In addition, the flow of saline injection and blood was set as a single phase, which did not reflect the material property of saline. Further, the heat transfer phenomenon based on saline injection inside the electrode that can be used to determine the temperature of the electrode was not accurately considered [10,13,18]. Although the heart model deforms when the catheter electrode contacts the heart tissue, only some studies have presented this phenomenon [17,18]. Therefore, this study aimed to review the thermal lesion in a heart tissue deformed due to contact with the electrode catheter, by expressing the material property of the mixed saline–blood area with a proportional expression of the concentration. The analysis areas were classified into three areas. In the first area, the deformation of heart tissue was investigated by indentation of heart tissue due to contact with electrode catheter. Thus, the advection-diffusion equation was implemented to analyze the mixing saline and blood when saline was injected into blood through the electrode. Finally, the previously estimated concentration was used to calculate the material property in the fluid area in which saline and blood were catheter analyzed by varying the contact force with the catheter diameter.

2. Materials and Methods
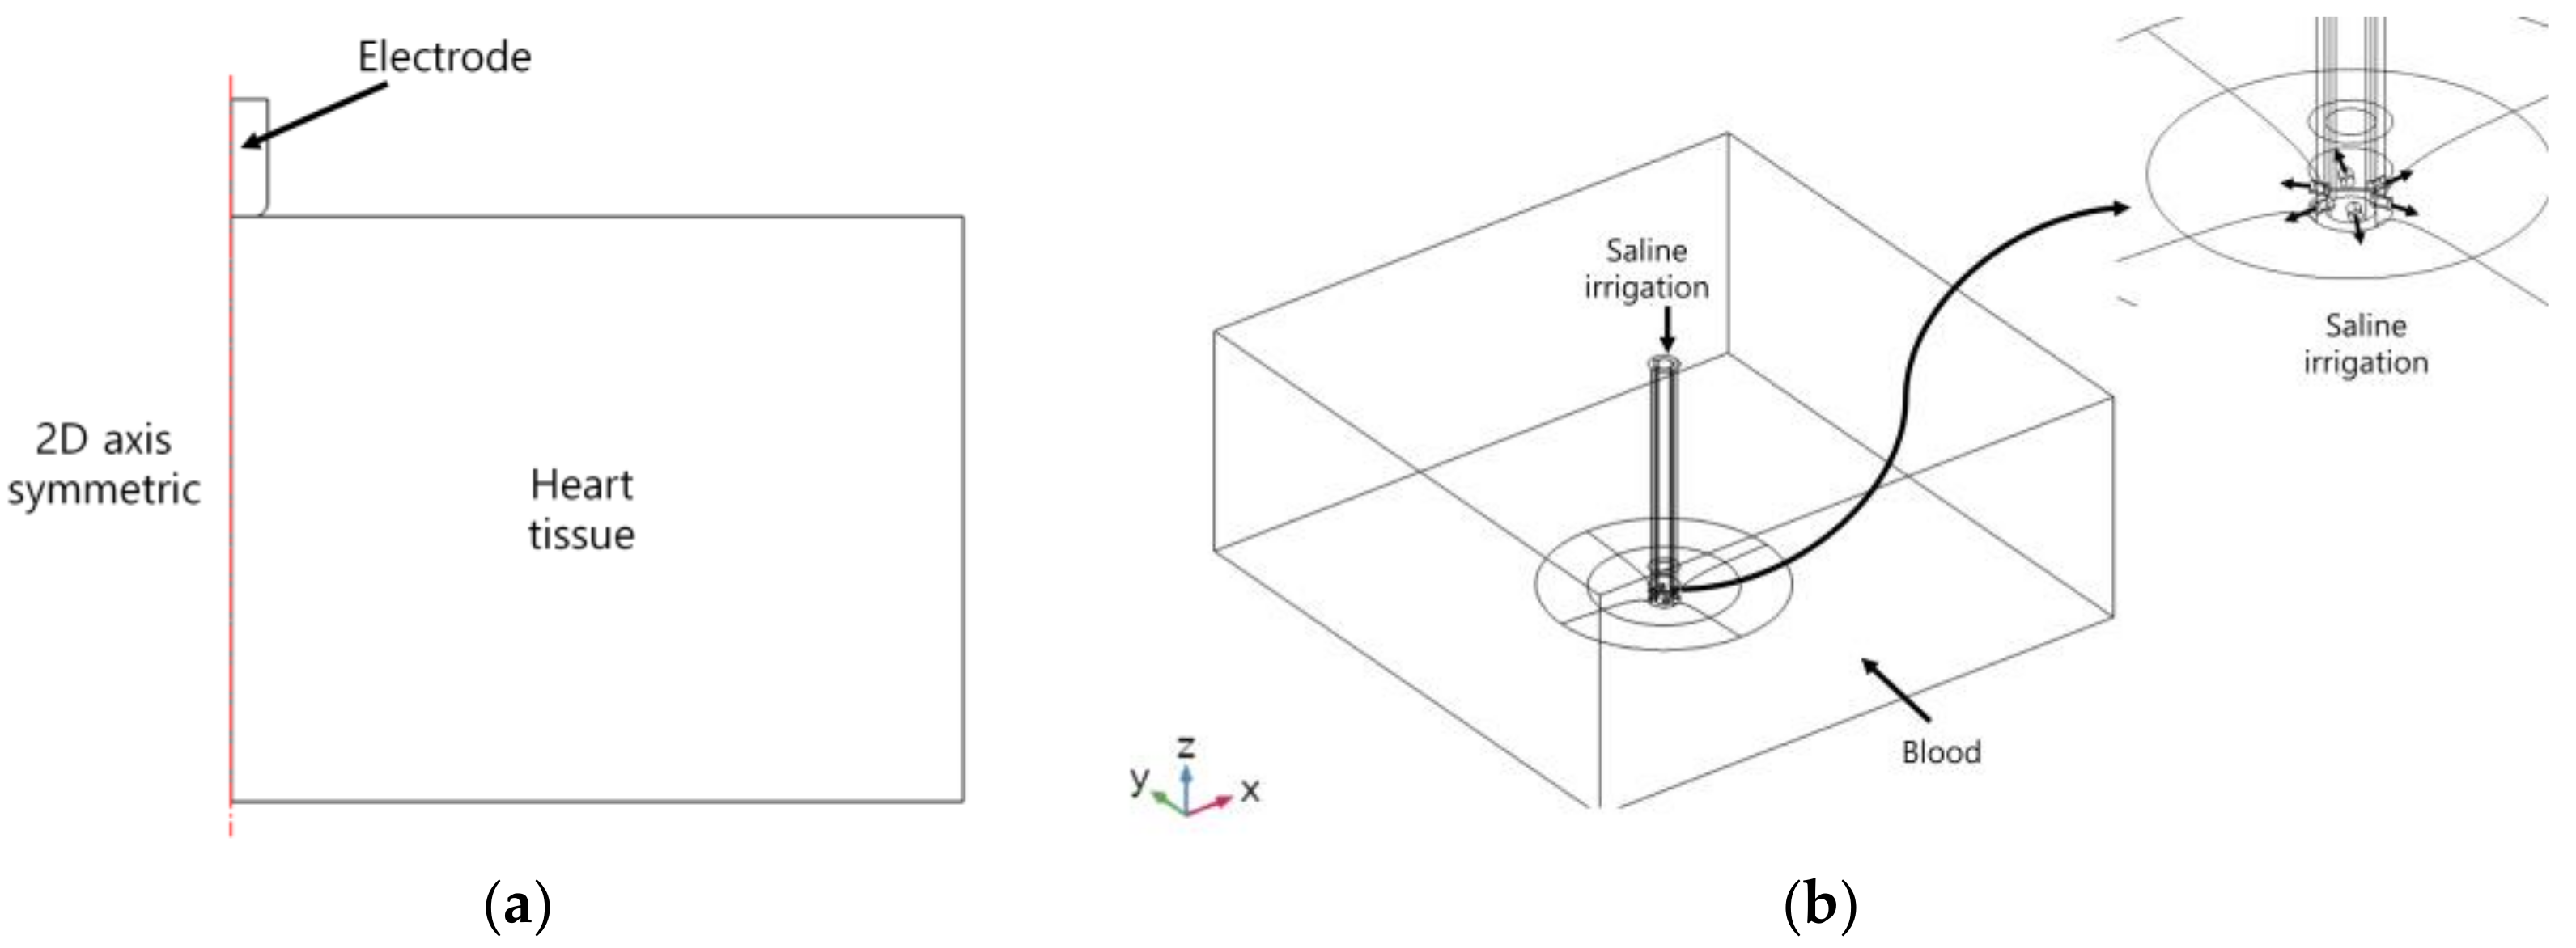
2.1. Model Geometry

Figure 1a presents the model that we were to solve, consisting of saline, blood, and catheter electrode in the heart. The width, length, and height of the heart tissue and blood in the heart were 50, 50, and 20 mm, respectively, and the diameters of the catheter were 7, 7.5, and 8 Fr [5,10,16]. The diameter of the electrode’s hole for saline injection was 0.4064 mm (0.16 in). The electrode holes were modeled that there were six holes on the electrode in an equiangular position. Figure 2a is a model of deformation of cardiac tissue by electrode catheters, and Figure 2b shows a mixture model of blood and saline. The model was configured to exhibit two-dimensional axial symmetry concerning the electrode part and the heart tissue. The mixing problem was defined by constructing saline and blood flow through the electrode, reflecting the deformation of heart tissue caused by the contact with the electrode. Figure 1b shows a schematic diagram of the numeric model. The deformation of heart tissue is first solved. If the mixing between saline and blood is considered, mixing between blood and saline is calculated, and then analyzed the heat transfer problem of heart tissue. Otherwise, it is solved as heat transfer of the heart tissue immediately. The analysis was conducted on three catheter diameters (7, 7.5, and 8 Fr) and two types of contact forces (10 and 20 g).

2.2. Governing Equation

2.2.1. Deformation of Heart Tissue

In the problem of heart tissue deformation by the contact force of the catheter electrode, the catheter electrode was assumed as an isotropic, linear elastic model. Further, a constitutive equation was applied to Hooke’s law, as shown in Equation (1).
τ = E ε
where τ is the stress (N/m2), ε is the strain, and E is Young’s modulus (Pa). In this model Young’s modulus (E) of electrode is 168 GPa, Poisson’s ratio ( ν ) is 0.38, and density ( ρ ) is 21,800 kg/m3 [20]. Because the heart tissue is deformed and shows nonlinear behavior when the external force is applied, this study aimed to introduce a hyperelastic model using the strain energy density function. The strain energy density function ( W ) based on the indentation of the heart tissue was assumed to be isotropic, incompressible, and defined in an exponential type as shown in Equations (2) and (3) [20,21].
W = d 1 ( e d 2 I 1 3 1 )
I 1 = C i i
where I 1 is the first invariant, C is the Cauchy–Green deformation tensor, and 1.872 kPa and 1.2081 were the values of the model parameters of d 1 and d 2 , respectively.

2.2.2. Mixing Between Blood and Saline

The two fluids mix when saline is injected from the electrode catheter. To reduce the computational cost, the concentration was used to model the mixing phenomenon between the two fluids [22]. Thus, the concentration and velocity field, including blood inside the heart and saline injection, should be coupled. The governing equation for the blood inside the heart and the saline injection flow was the incompressible Navier–Stokes equation, which can be described using Equations (4) and (5). By calculating Reynolds number by substituting the length of the heart tissue, speed, viscosity, and density of blood as Re =   ρ b l o o d u b l o o d   f l o w D t i s s u e μ b l o o d = 2381 , it was considered to be a laminar flow regime.
ρ u ·   u = P + μ 2 u
ρ · u = 0
where ρ is the density (km/m3),   u is the velocity (m/s), P is the pressure (Pa), and μ is the viscosity (Pa∙s).
The governing equation for concentration is the advection–diffusion equation, which can be described using Equation (6).
· D c   c u ·   c = 0
where c is the concentration (mol/m3), and D c is the coefficient of diffusion (m2/s), i.e., D c = 1.5 × 10 9 m2/s [23]. Based on the calculated concentration, the mixed-domain material property should be defined using a proportional equation for blood, saline as shown in Equation (7) [22,23]. The mixed-domain material property ( A m i x ) was defined as viscosity ( μ ), thermal conductivity ( k ), and electrical conductivity ( σ ).
A m i x = A b l o o d × 1 c + A s a l i n e × c

2.2.3. Heat Transfer of the Heart Tissue

As explained previously, the electric field, velocity field, and temperature must be solved simultaneously to solve the flow that includes blood inside the heart and saline injection as well as heat transfer that includes voltage applied to the electrode (reflecting the deformation of heart tissue caused by the contact force and mixed portion of blood and saline). At this point, the electric field, velocity field, and heat problems should be coupled with each other. The governing equation for the heat transfer problem is Pennes bioheat equation, as shown in Equation (8) [24].
ρ c P T t = · k   T + q Q p + Q m ρ c u ·   T
where ρ is the density (kg/m3), c P is the specific heat (J/K/kg), k is the thermal conductivity (W/m/K), T is the temperature (K), q is the heat source caused by radiofrequency current (W/m3), Q p is the heat loss caused by blood perfusion (W/m3), Q m is the metabolic heat (W/m3), and u is the velocity field (m/s). In this study, heat loss because of blood perfusion ( Q p ) and metabolic heat ( Q m ) were not considered because of their minimal effects [25,26].
The radiofrequency current is applied at an approximate frequency of 500 kHz, the Joule heating caused by the current of displacement and conduction should be considered. However, only resistive heat generated by the conduction current can be considered because the displacement current is lower than the conduction current in a biological medium and the size (below 1 m) of the domain to be analyzed in this numerical model [27,28]. Thus, a quasi-static approach could be applied to the electric field problem, and it can be described as Equations (9) and (10).
· σ E = 0
E =  
where σ is the electrical conductivity (S/m), E is the electric field (V/m), and ∅ is calculated by introducing electric potential (V). The heat source ( q ) caused by the radiofrequency current in the energy equation is shown in Equation (11).
q = 1 2 σ E 2
The governing equation for blood inside the heart and saline injection flow is the incompressible Navier–Stokes equation, which can be described as Equations (12) and (13).
ρ u t + ρ u ·   u = P + μ 2 u
ρ · u = 0
where ρ is the density (km/m3), u is the velocity (m/s), P is the pressure (Pa), and μ is the viscosity (Pa∙s).

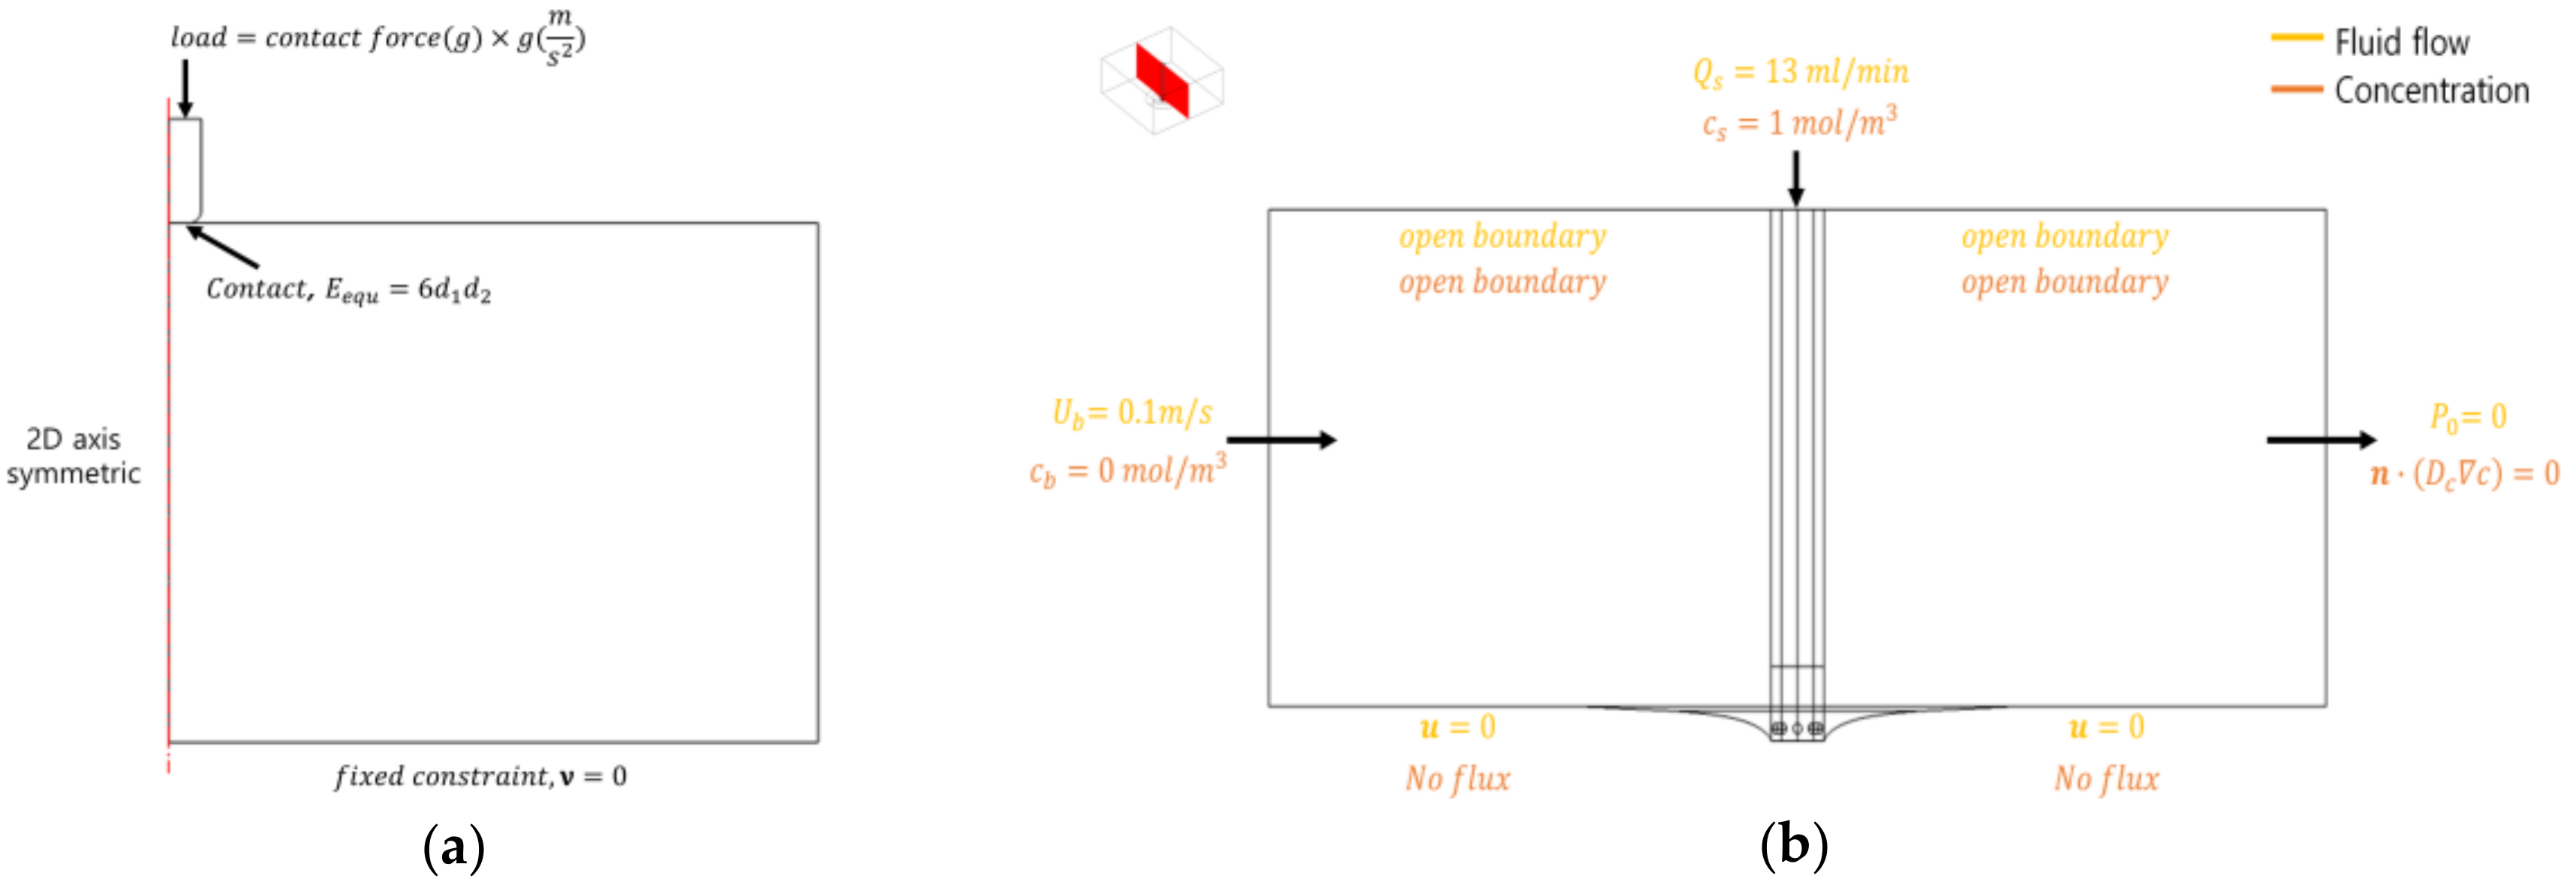
2.3. Material Property and Boundary Conditions
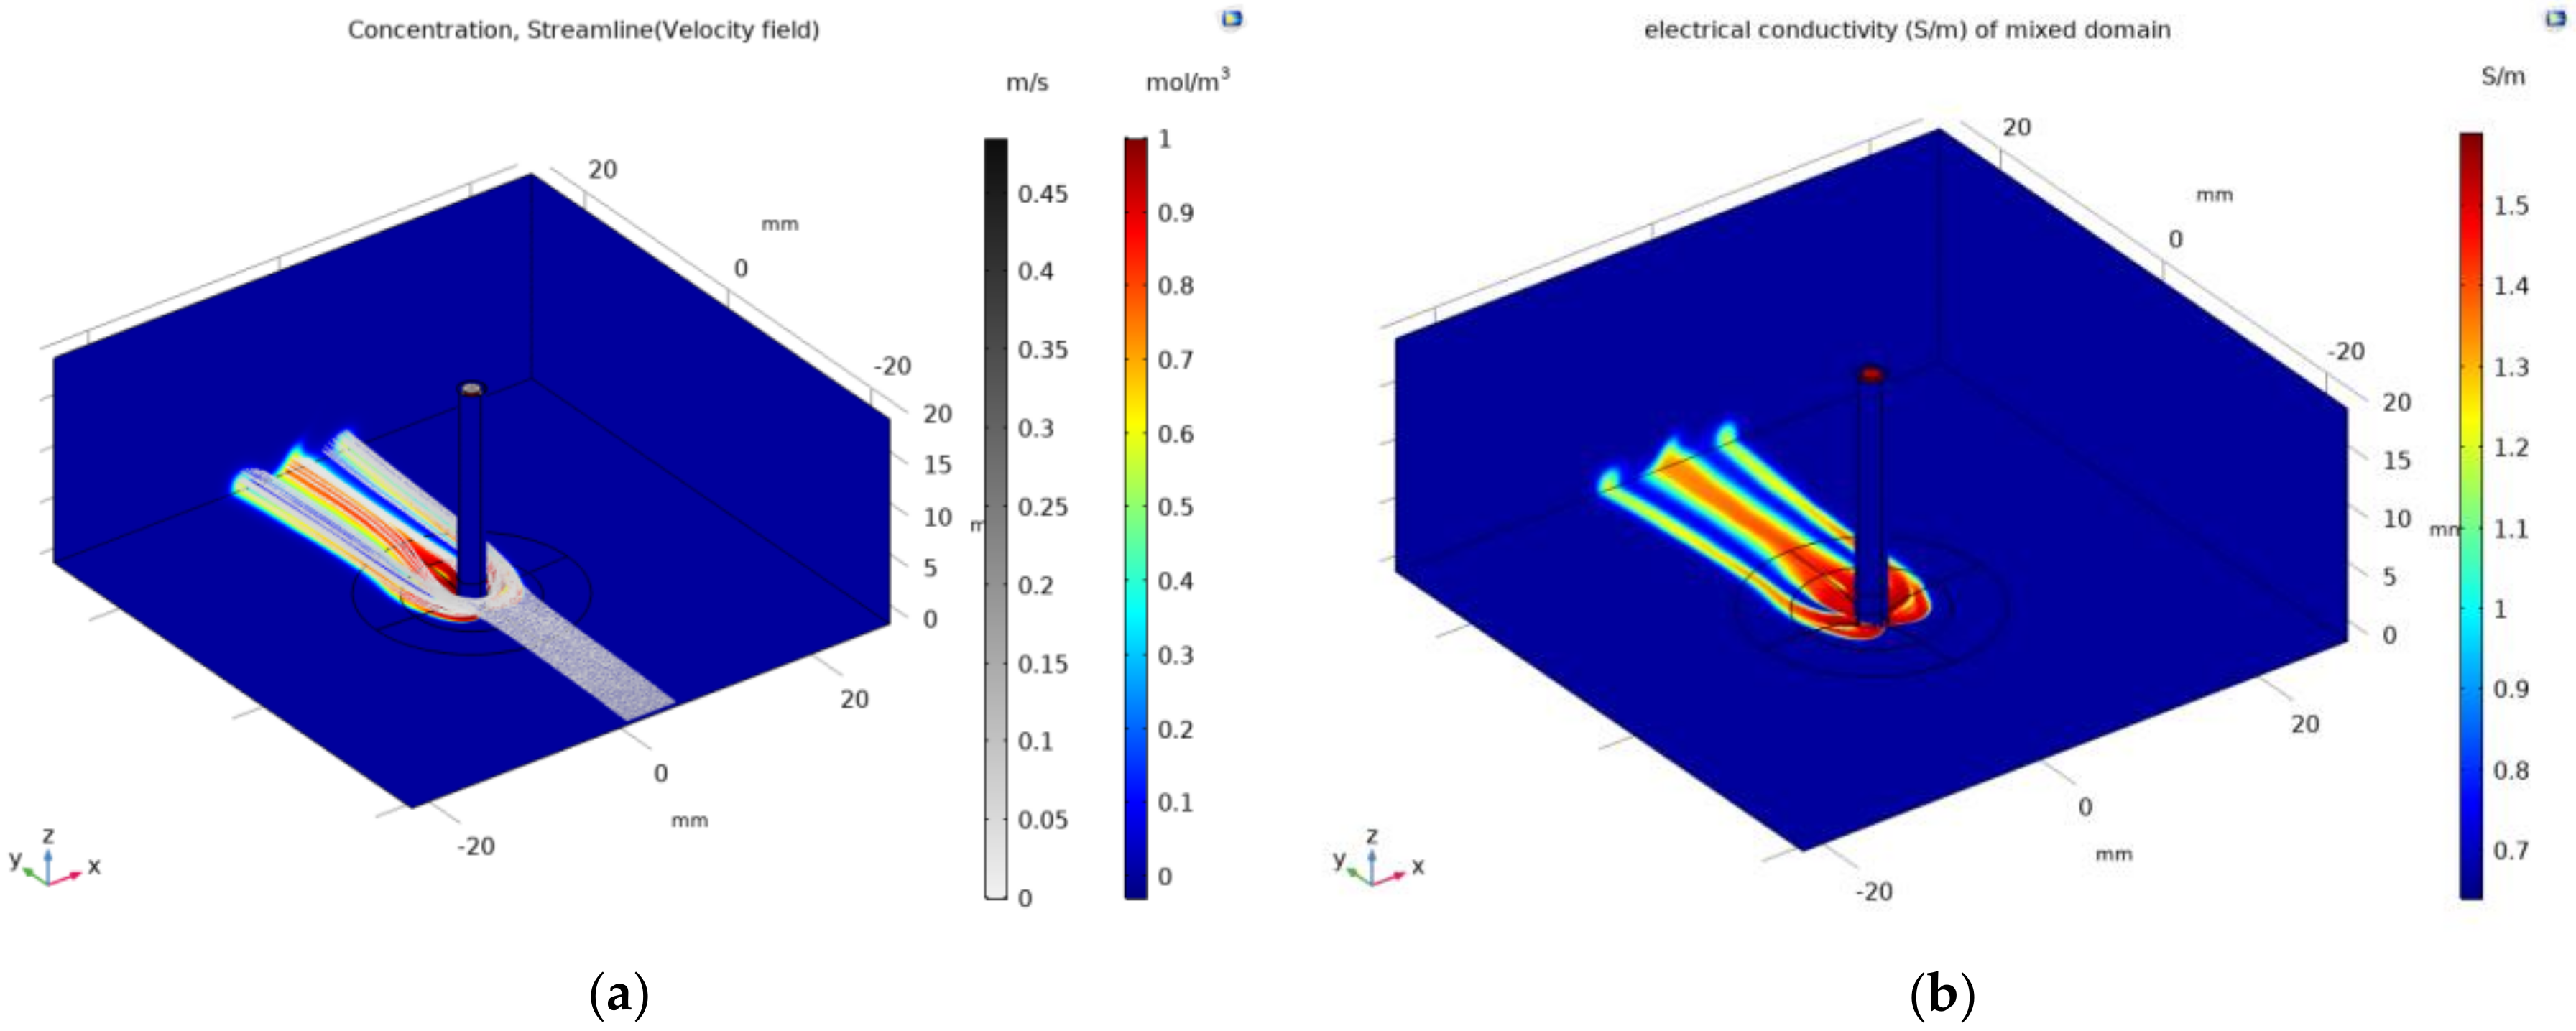
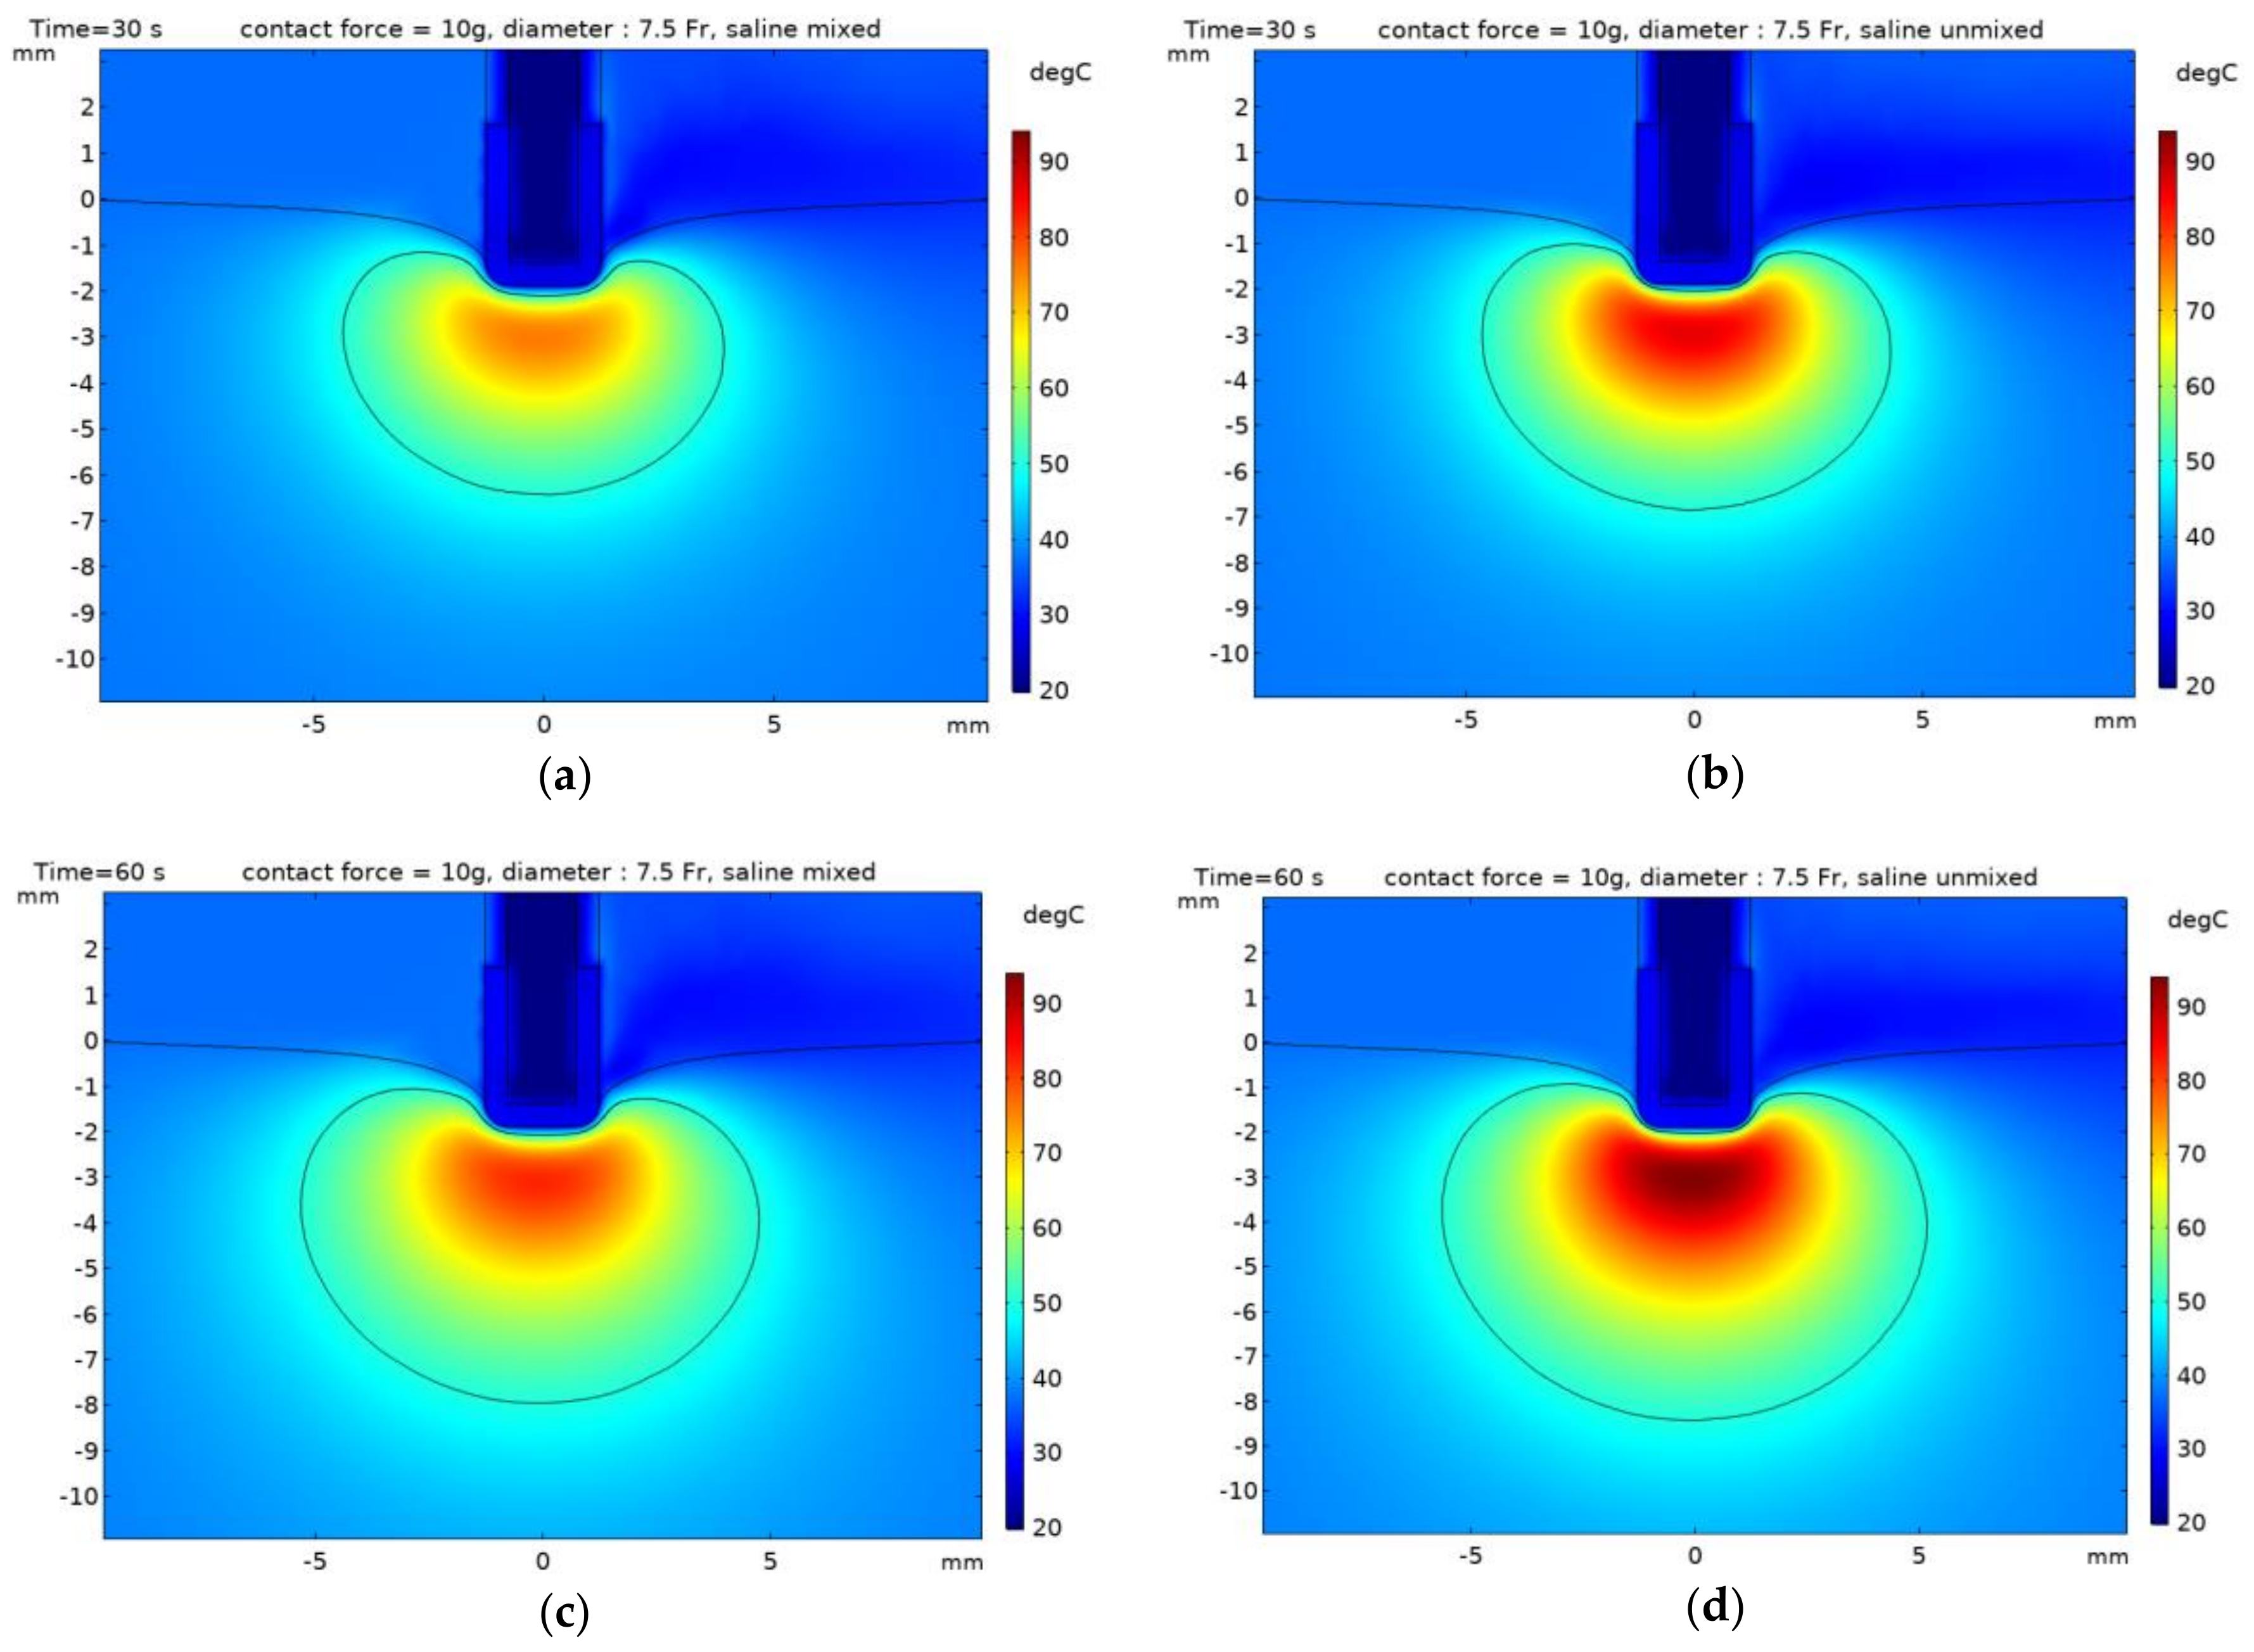
The material properties related to electricity, heat, and flow of the model component are presented in Table 1 [10,16,19]. The electrical and thermal conductivities of the heart tissue were defined as Equations (14) and (15), respectively, as functions of temperature.
σ o e 0.015 T 310.15
k o + 0.012 T 310.15
The viscosity and density of blood are 0.0021 Pa∙s and 1000 kg/m3, respectively [10,16,19], whereas those of saline are 0.001 Pa∙s and 1000 kg/m3, respectively, based on the material property of water. The electrical conductivity of saline based on temperature is shown in Equations (16) and (17) [29]. The normality (N) was set to 0.15397, and Figure 3 is electrical conductivity of saline as a function of temperature, calculated by Equations (16) and (17).
σ s a l i n e T , N = σ 25 , N [ 1 1.962 × 10 2 298.15 T + 8.08 × 10 5 298.15 T 2 N 298.15 T { 3.020 × 10 5 + 3.922 × 10 5 298.15 T + N ( 1.921 5 6.584 × 10 6 298.15 T } ]
σ s a l i n e 25 , N = N ( 10.394 2.3776 N + 0.628258 N 2 0.13538 N 3 + 1.0086 × 10 2 N 4 )
The boundary conditions of the heart tissue deformation model are shown in Figure 4a. The contact condition of heart tissue and electrode catheter was applied, and the equivalent Young’s modulus was set as E equ = 6 d 1 d 2 [21]. Weights (contact force) of 10 and 20 g were applied to the electrode catheter in the −z direction. The displacement of the electrode catheter in the r direction was set as v r = 0 m. A fixed constraint condition was applied to the bottom part of the heart tissue.
The boundary conditions related to the flow and concentration of the mixed model for saline and blood are shown in Figure 4b. The model was conducted by setting the velocity in blood area as 0.1 m/s, concentration as 0 mol/m3, flow during saline injection as 13 mL/min, and concentration as 1 mol/m3. Using the calculated concentration, the viscosity, thermal conductivity, and electrical conductivity in the mixed area were calculated, as shown in Equation (7).
The boundary conditions related to electricity, heat, and flow of the heat transfer model are shown in Figure 5. In the flow problem, the blood flow inside the heart was set as 0.1 m/s in the y direction [4,8,10]. The opposite boundary surface is the exit boundary surface, which is set as atmospheric pressure. In addition, the boundary surface of the upper area in z direction was set as an open boundary condition ( p I n = 0 N/m2) because the velocity of the upper area boundary surface was set as the no-slip condition (0 m/s) in some studies [10,19], which would be determined to affect the blood inside the heart owing to the wall effect. The flow rate of saline injection was set at 13 ml/min [4]. In the model of heat transfer, the temperature at each outer boundary surface was uniformly set as 37 °C. The initial temperature for all the components was set as 37 °C, except for saline (20 °C). By referring to the impedance values related to the human body, electrode, and blood during radiofrequency catheter ablation when considering a lumped parameter model, the power of the electrode was set as Z a = 75   Ω , Z body = 35   Ω , Z t i s s u e = 200   Ω [30,31]. Further, the power of the electrode was applied at 9.375 W.
The three models were analyzed by using COMSOL Multiphysics 5.5 (COMSOL Inc.) software. The models of heart tissue deformation and the mixing of saline and blood were analyzed under a steady-state, and the model of heat transfer with respect to the heart tissue was analyzed over time and was set as 60 s. The maximum time step was set as 0.2 s.

3. Results

The displacement distribution of heart tissue when it comes into contact with the catheter electrode based on contact force is shown in Figure 6, and the displacement of the catheter electrode based on contact with the catheter diameter is shown in Table 2. When the same contact force was applied, the maximum displacement decreased with the increasing catheter diameter. As the catheter diameter increased by 0.5 Fr and when considering contact forces of 10 and 20 g, the maximum displacement decreased by 3.3 and 2.3%, respectively.
Based on the deformation of heart tissue caused by contact with the catheter electrode, the distribution of the concentration and streamline in the model that considers mixing between saline and blood are presented in Figure 7a. Based on Equation (7) and the concentration, the electrical conductivity of the model mixed between saline and blood areas are presented in Figure 7b. The result indicated that the area surrounding the heart tissue that contact with the catheter electrode was affected by the injection of saline. To observe the difference of mixing between saline and blood, the distribution of electrical conductivity and the electric field with contour (black line) of 10 V/mm are shown in Figure 8 in the xz plane with a catheter diameter of 7.5 Fr and contact force of 10 g. For the model considering mixing between saline and blood, the electrical conductivity of saline calculated in Equation (7) was higher than those for which mixing was not considered in the surrounding electrode and in the interfaces of heart tissue and blood. Therefore, it could be indicated that the magnitude of the electric field and the size of contour with 10 V/mm in the model which consider mixing were smaller than the model which did not consider mixing.
This study aimed to identify the thermal lesion as it changed irreversibly when the temperature of the heart tissue is more than 50 °C, with a 50 °C isotherm [3,10,15,16]. Moreover, the dimensions of the thermal lesion were defined as depth (D), maximum width (MW), and depth at maximum width (DW). The dimensions of the thermal lesion and the maximum temperature in the heart tissue are presented in Table 3 with time (30 and 60 s), contact force (10 and 20 g), and whether mixing between saline and blood. The dimensions of the thermal lesion and maximum temperature decreased with the increasing catheter diameter, regardless of mixing between saline and blood. Figure 9 and Figure 10 indicated the temperature distribution and 50 °C contours of the yz plane in numerical model with time (30 and 60 s) and whether mixing between saline and blood. In the model that considered mixing between saline and blood, the thermal lesion was asymmetrical with respect to the z axis, and when depth at maximum width (DW) was measured, it was determined the higher dimension of the two values on the z axis. By comparing with an experiment result [4], depth (D) of heart tissue based on the catheter diameter of 7.5 Fr was 5.9 and 7.2 mm when considering times of 30 and 60 s, respectively (having errors of 10 and 4 % compared to the numerical model results). Similarly, maximum width (MW) was 11.2 and 13.5 mm when considering 30 and 60 s, respectively (having errors of 10 and 23% compared to the numerical model results).

4. Discussion

In the model of deformation of heart tissue, when the contact forces were 10 and 20 g, the saline injection hole (the gray line in Figure 6) was not blocked with the heart tissue, resulting in the smooth injection of saline. However, the holes of saline injection were blocked by the deformed heart tissue when the contact forces were 30 and 40 g. Therefore, only the cases in which the contact forces were 10 and 20 g were considered for problems of mixing between saline and blood and heat transfer of heart tissue.
As the contact force increased, the contact area between the catheter electrode and heart tissue increased, resulting in the increased power dissipation [17,18]. Therefore, it could be observed that the dimensions of the thermal lesion with a contact force of 20 g were increased by more than 10% compared to the contact force of 10 g. Furthermore, in the case of catheter diameter of 7.5 Fr and contact force of 10 g, the maximum temperature of the model considering mixing between saline and blood decreased by more than 10 % compared to the model without mixing, and the dimensions of the thermal lesion decreased by at least 1% and up to 14% at maximum. This could be attributed to the convective heat transfer of the heart tissue owing to saline injection with a temperature of 20 °C and the fact that the electrical conductivity of saline was higher than that of blood, resulting in the decreasing electric field and Joule heating.
The numerical model result indicated that the error at depth (D) was less than 10% and that the error at maximum width (MW) was less than 23% compared with the experimental result in the case of catheter diameter of 7.5 Fr and contact force of 10 g. This is because the catheter electrode and heart tissue are perpendicular to each other in the numerical model and the heart tissue is not perfectly horizontal in the actual experiment (therefore, the deformation of the heart tissue during saline injection could not be considered).

5. Conclusions

In this study, the numerical model was investigated that considering the deformation of the heart tissue and saline injection in radiofrequency catheter ablation affect the thermal lesion and maximum temperature of the heart tissue. As the contact force increased, it was indicated that the size of the thermal lesion increased. In addition, it was observed that saline injection affected the maximum temperature and the thermal lesion of the heart tissue. Although this study only considered the case in which the catheter electrode is perpendicular to the heart tissue, the thermal lesion must be observed by changing the angle of the catheter electrode in future work.

Author Contributions

Conceptualization, J.W.A. and Y.-J.K.; methodology, J.W.A. and Y.-J.K.; software, J.W.A. and Y.-J.K.; writing—original draft preparation, J.W.A. and Y.-J.K.; writing—review and editing, J.W.A. and Y.-J.K. All authors have read and agreed to the published version of the manuscript.

Funding

This work is supported by the National Research Foundation of Korea (NRF) Grant (NRF-2016R1A5A1921651) funded by the Korean Government (MSIP), and a grant from Chungcheongbuk-do Value Creation Program of Osong Medical Innovation Foundation (2018) funded by Chungcheongbuk-do.

Conflicts of Interest

The authors declare no conflict of interest.

References

  1. McRury, I.D.; Haines, D.E. Ablation for the treatment of arrhythmias. Proc. IEEE 1996, 84, 404–416. [Google Scholar] [CrossRef]
  2. Haines, D.E. The biophysics of radiofrequency catheter ablation in the heart: The importance of temperature monitoring. Pacing Clin. Electrophysiol. 1993, 16, 586–591. [Google Scholar] [CrossRef]
  3. Jain, M.K.; Wolf, P.D. Temperature-controlled and constant-power radio-frequency ablation: What affects lesion growth? IEEE Trans. Biomed. Eng. 1999, 46, 1405–1412. [Google Scholar] [CrossRef]
  4. Guerra, J.M.; Jorge, E.; Raga, S.; Galvez-Monton, C.; Alonso-Martin, C.; Rodriguez-Font, E.; Cinca, J.; Vinolas, X. Effects of open-irrigated radiofrequency ablation catheter design on lesion formation and complications: In vitro comparison of 6 different devices. J. Cardiovasc. Electrophysiol. 2004, 24, 1157–1162. [Google Scholar] [CrossRef]
  5. Wood, M.A.; Goldberg, S.M.; Parvez, B.; Pathak, V.; Holland, K.; Ellenbogen, A.L.; Han, F.T.; Alexander, D.; Lau, M.; Reshko, L.; et al. Effect of electrode orientation on lesion sizes produced by irrigated radiofrequency ablation catheters. J. Cardiovasc. Electrophysiol. 2009, 20, 1262–1268. [Google Scholar] [CrossRef]
  6. Everett, T.H., IV; Lee, K.W.; Wilson, E.E.; Guerra, J.M.; Varosy, P.D.; Olgin, J.E. Safety profiles and lesion size of different radiofrequency ablation technologies: A comparison of large tip, open and closed irrigation catheters. J. Cardiovasc. Electrophysiol. 2009, 20, 325–335. [Google Scholar] [CrossRef]
  7. Demazumder, D.; Mirotznik, M.S.; Schwartzman, D. Biophysics of radiofrequency ablation using an irrigated electrode. J. Interv. Card. Electrophysiol. 2001, 5, 377–389. [Google Scholar] [CrossRef] [PubMed]
  8. Yokoyama, K.; Nakagawa, H.; Wittkampf, F.H.; Pitha, J.V.; Lazzara, R.; Jackman, W.M. Comparison of electrode cooling between internal and open irrigation in radiofrequency ablation lesion depth and incidence of thrombus and steam pop. Circulation 2006, 113, 11–19. [Google Scholar] [CrossRef] [PubMed]
  9. Weiss, C.; Antz, M.; Eick, O.; Eshagzaiy, K.; Meinertz, T.; Willems, S. Radiofrequency catheter ablation using cooled electrodes: Impact of irrigation flow rate and catheter contact pressure on lesion dimensions. Pacing Clin. Electrophysiol. 2002, 25, 463–469. [Google Scholar] [CrossRef] [PubMed]
  10. González-Suárez, A.; Berjano, E.; Guerra, J.M.; Gerardo-Giorda, L. Computational modelling of open-irrigated electrodes for radiofrequency cardiac ablation including blood motion-saline flow interaction. PLoS ONE 2016, 11, e0150356. [Google Scholar] [CrossRef] [Green Version]
  11. Pérez, J.J.; D’avila, A.; Aryana, A.; Berjano, E. Electrical and thermal effects of esophageal temperature probes on radiofrequency catheter ablation of atrial fibrillation: Results from a computational modelling study. J. Cardiovasc. Electrophysiol. 2015, 26, 556–564. [Google Scholar] [CrossRef] [PubMed]
  12. Jain, M.K.; Wolf, P.D. A three-dimensional finite element model of radiofrequency ablation with blood flow and its experimental validation. Ann. Biomed. Eng. 2000, 28, 1075–1084. [Google Scholar] [CrossRef] [PubMed]
  13. Gopalakrishnan, J. A mathematical model for irrigated epicardial radiofrequency ablation. Ann. Biomed. Eng. 2002, 30, 884–893. [Google Scholar] [CrossRef] [PubMed]
  14. Gallagher, N.; Fear, E.C.; Byrd, I.A.; Vigmond, E.J. Contact geometry affects lesion formation in radio-frequency cardiac catheter ablation. PLoS ONE 2013, 8, e73242. [Google Scholar] [CrossRef] [Green Version]
  15. Tungjitkusolmun, S.; Woo, E.J.; Cao, H.; Tsai, J.Z.; Vorperian, V.R.; Webster, J.G. Thermal—electrical finite element modelling for radio frequency cardiac ablation: Effects of changes in myocardial properties. Medic. Biol. Eng. Comput. 2000, 38, 562–568. [Google Scholar] [CrossRef]
  16. González-Suarez, A.; Berjano, E. Comparative analysis of different methods of modelling the thermal effect of circulating blood flow during RF cardiac ablation. IEEE Trans. Biomed. Eng. 2016, 63, 250–259. [Google Scholar] [CrossRef] [Green Version]
  17. Yan, S.; Gu, K.; Wu, X.; Wang, W. Computer simulation study on the effect of electrode–tissue contact force on thermal lesion size in cardiac radiofrequency ablation. Int. J. Hyperth. 2020, 37, 37–48. [Google Scholar] [CrossRef]
  18. Petras, A.; Leoni, M.; Guerra, J.M.; Jansson, J.; Gerardo-Giorda, L. A computational model of open-irrigated radiofrequency catheter ablation accounting for mechanical properties of the cardiac tissue. Int J. Numer. Methods Biomed. Eng. 2019, 35, e3232. [Google Scholar] [CrossRef] [Green Version]
  19. Gonzalez-Suarez, A.; Perez, J.J.; Enrique, B. Should fluid dynamics be included in computer models of RF cardiac ablation by irrigated-tip electrodes? Biomed. Eng. Online 2018, 17, 43. [Google Scholar] [CrossRef] [Green Version]
  20. Humphrey, J.D.; Halperin, H.R.; Yin, F.C.P. Small indentation superimposed on a finite equibiaxial stretch. Implications for cardiac mechanics. J. Appl. Phys. Trans. ASME 1991, 58, 1108–1111. [Google Scholar] [CrossRef]
  21. Zisis, T.; Zafiropoulou, V.I.; Giannakopoulos, A.E. Evaluation of material properties of incompressible hyperelastic materials based on instrumented indentation of an equal-biaxial prestretched substrate. Int. J. Solids Struct. 2015, 64, 132–144. [Google Scholar] [CrossRef]
  22. Choi, H.W.; Jansen, B.; Birrer, D.; Kassab, G.S. Effect of saline injection mixing on accuracy of conductance lumen sizing of peripheral vessels. PLoS ONE 2013, 8, e74622. [Google Scholar] [CrossRef] [PubMed]
  23. Choi, H.W.; Farren, N.D.; Zhang, Z.D.; Huo, Y.; Kassab, G.S. Conductance catheter measurements of lumen area of stenotic coronary arteries: Theory and experiment. J. Appl. Physiol. 2011, 111, 758–765. [Google Scholar] [CrossRef] [PubMed]
  24. Pennes, H.H. Analysis of tissue and arterial blood temperatures in the resting human forearm. J. Appl. Physiol. 1948, 1, 93–122. [Google Scholar] [CrossRef]
  25. Obradović, M.; Avilla, A.; Thiagalingam, A.; Filipović, N. Finite element modeling of the endocardial radiofrequency ablation, J. Serb. Soc. Comput. Mech. 2010, 4, 43–53. [Google Scholar]
  26. Haines, D.E.; Watson, D.D. Tissue heating during radiofrequency catheter ablation: A thermodynamic model and observations in isolated perfused and superfused canine right ventricular free wall. Pacing Clin. Electrophysiol. 1989, 12, 962–976. [Google Scholar] [CrossRef]
  27. Doss, J.D. Calculation of electric fields in conductive media. Med. Phys. 1982, 9, 566–573. [Google Scholar] [CrossRef]
  28. Plonsey, R.; Heppner, D.B. Considerations of quasi-stationarity in electrophysiological systems. Bull. Math. Biol. 1967, 29, 657–664. [Google Scholar] [CrossRef]
  29. Stogryn, A. Equations for calculating the dielectric constant of saline water (correspondence). IEEE Trans. Microw. Theory Techn. 1971, 19, 733–736. [Google Scholar] [CrossRef]
  30. Berjano, E.; d’Avila, A. Lumped element electrical model based on three resistors for electrical impedance in radiofrequency cardiac ablation: Estimations from analytical calculations and clinical data. Open Biomed. Eng. J. 2013, 7, 62. [Google Scholar] [CrossRef]
  31. Nakagawa, H.; Wittkampf, F.H.M.; Yamanashi, W.S.; Pitha, J.V.; Imai, S.; Campbell, B.; Arruda, M.; Lazzara, R.; Jackman, W.M. Inverse relationship between electrode size and lesion size during radiofrequency ablation with active electrode cooling. Circulation 1998, 98, 458–465. [Google Scholar] [CrossRef] [PubMed]
Figure 1. Definition of the model in the heat transfer of the heart tissue (a) and schematic diagram of the numerical model (b).
Electronics 10 01674 g001
Figure 2. Definition of the deformation model of heart tissue (a) and the mixing model between saline and blood flow (b).
Electronics 10 01674 g002
Figure 3. The electrical conductivity of saline as a function of temperature.
Electronics 10 01674 g003
Figure 4. Boundary conditions of the deformation model of heart tissue (a) and the mixing model between saline and blood flow (b).
Electronics 10 01674 g004
Figure 5. Boundary conditions of the heat transfer model of the heart tissue.
Electronics 10 01674 g005
Figure 6. Displacement distribution with catheter diameter of 7.5 Fr. (a) contact force = 10 g, (b) contact force = 20 g, (c) contact force = 30 g, (d) contact force = 40 g.
Electronics 10 01674 g006
Figure 7. Concentration distribution and streamline in the model that considers mixing between saline and blood (a) and distribution of electrical conductivity calculated using Equation (7) (b).
Electronics 10 01674 g007
Figure 8. The distribution of electrical conductivity (a,b) and the electric field (c,d) with contour (black line) of 10 V/mm in the xz plane with catheter diameter of 7.5 Fr and contact force of 10g. (a,c) model mixed saline, (b,d) model unmixed.
Electronics 10 01674 g008
Figure 9. Temperature distribution with contour 50 °C of the heart tissue with the catheter diameter of 7.5 Fr and contact force of 10 g. (a,b) time: 30 s, (c,d) time: 60 s, (a,c) model mixed saline, (b,d) model unmixed.
Electronics 10 01674 g009
Figure 10. Temperature distribution with contour 50 °C of the heart tissue with the catheter diameter of 7.5 Fr and contact force of 20 g. (a,b) time: 30 s, (c,d) time: 60 s, (a,c) model mixed saline, (b,d) model unmixed.
Electronics 10 01674 g010
Table 1. Material properties of the model elements.
Properties of the Model Elements
Model elementσ [S/m]k [W/m/K]cp [J/kg/K]ρ [kg/m3]
Electrode4.6 × 1067113221500
Heart tissueσ0: 0.54k0: 0.53131111060
PU (catheter)N/A0.026104570
Blood0.6670.5441801000
Saline σ s a l i n e 0.5941861000
Table 2. Displacement of the catheter electrode.
Displacement of Catheter (mm)
Diameter of
Catheter (Fr)
Contact Force = 10 gContact Force = 20 g
71.94023.0352
7.51.87622.9634
81.81452.8932
Table 3. Thermal lesions and the maximum temperature of heat tissue based on the catheter diameter, contact force, time, and status of mixing between saline and blood.
Time, CFModel Mixed SalineModel Unmixed
7 Fr7.5 Fr8 Fr7 Fr7.5 Fr8 Fr
D (Depth, mm)30 s, 10 g5.365.295.275.935.845.77
60 s, 10 g6.996.916.847.637.507.47
30 s, 20 g6.346.166.096.766.636.55
60 s, 20 g8.067.967.808.568.458.36
MW
(Maximum width, mm)
30 s, 10 g8.298.208.159.058.988.97
60 s, 10 g10.0910.0710.0410.9510.8610.78
30 s, 20 g9.319.279.229.999.949.92
60 s, 20 g11.3311.2511.1712.1112.0612.00
DW
(Depth at maximum width, mm)
30 s, 10 g2.232.132.052.322.282.23
60 s, 10 g3.032.852.783.213.113.09
30 s, 20 g2.722.572.542.742.692.63
60 s, 20 g3.473.323.263.533.483.37
Maximum temperature
(°C)
30 s, 10 g78.3176.0775.6790.6386.7583.36
60 s, 10 g84.7282.4782.1198.3594.1891.06
30 s, 20 g82.6379.7276.8091.7888.1884.80
60 s, 20 g90.2087.1383.8399.9096.6293.10
Publisher’s Note: MDPI stays neutral with regard to jurisdictional claims in published maps and institutional affiliations.

