
Estimation during Design Phases of Suitable SRAM Cells for PUF Applications Using Separatrix and Mismatch Metrics


Abstract
1. Introduction
2. SRAM as PUF
3. Metrics Definition
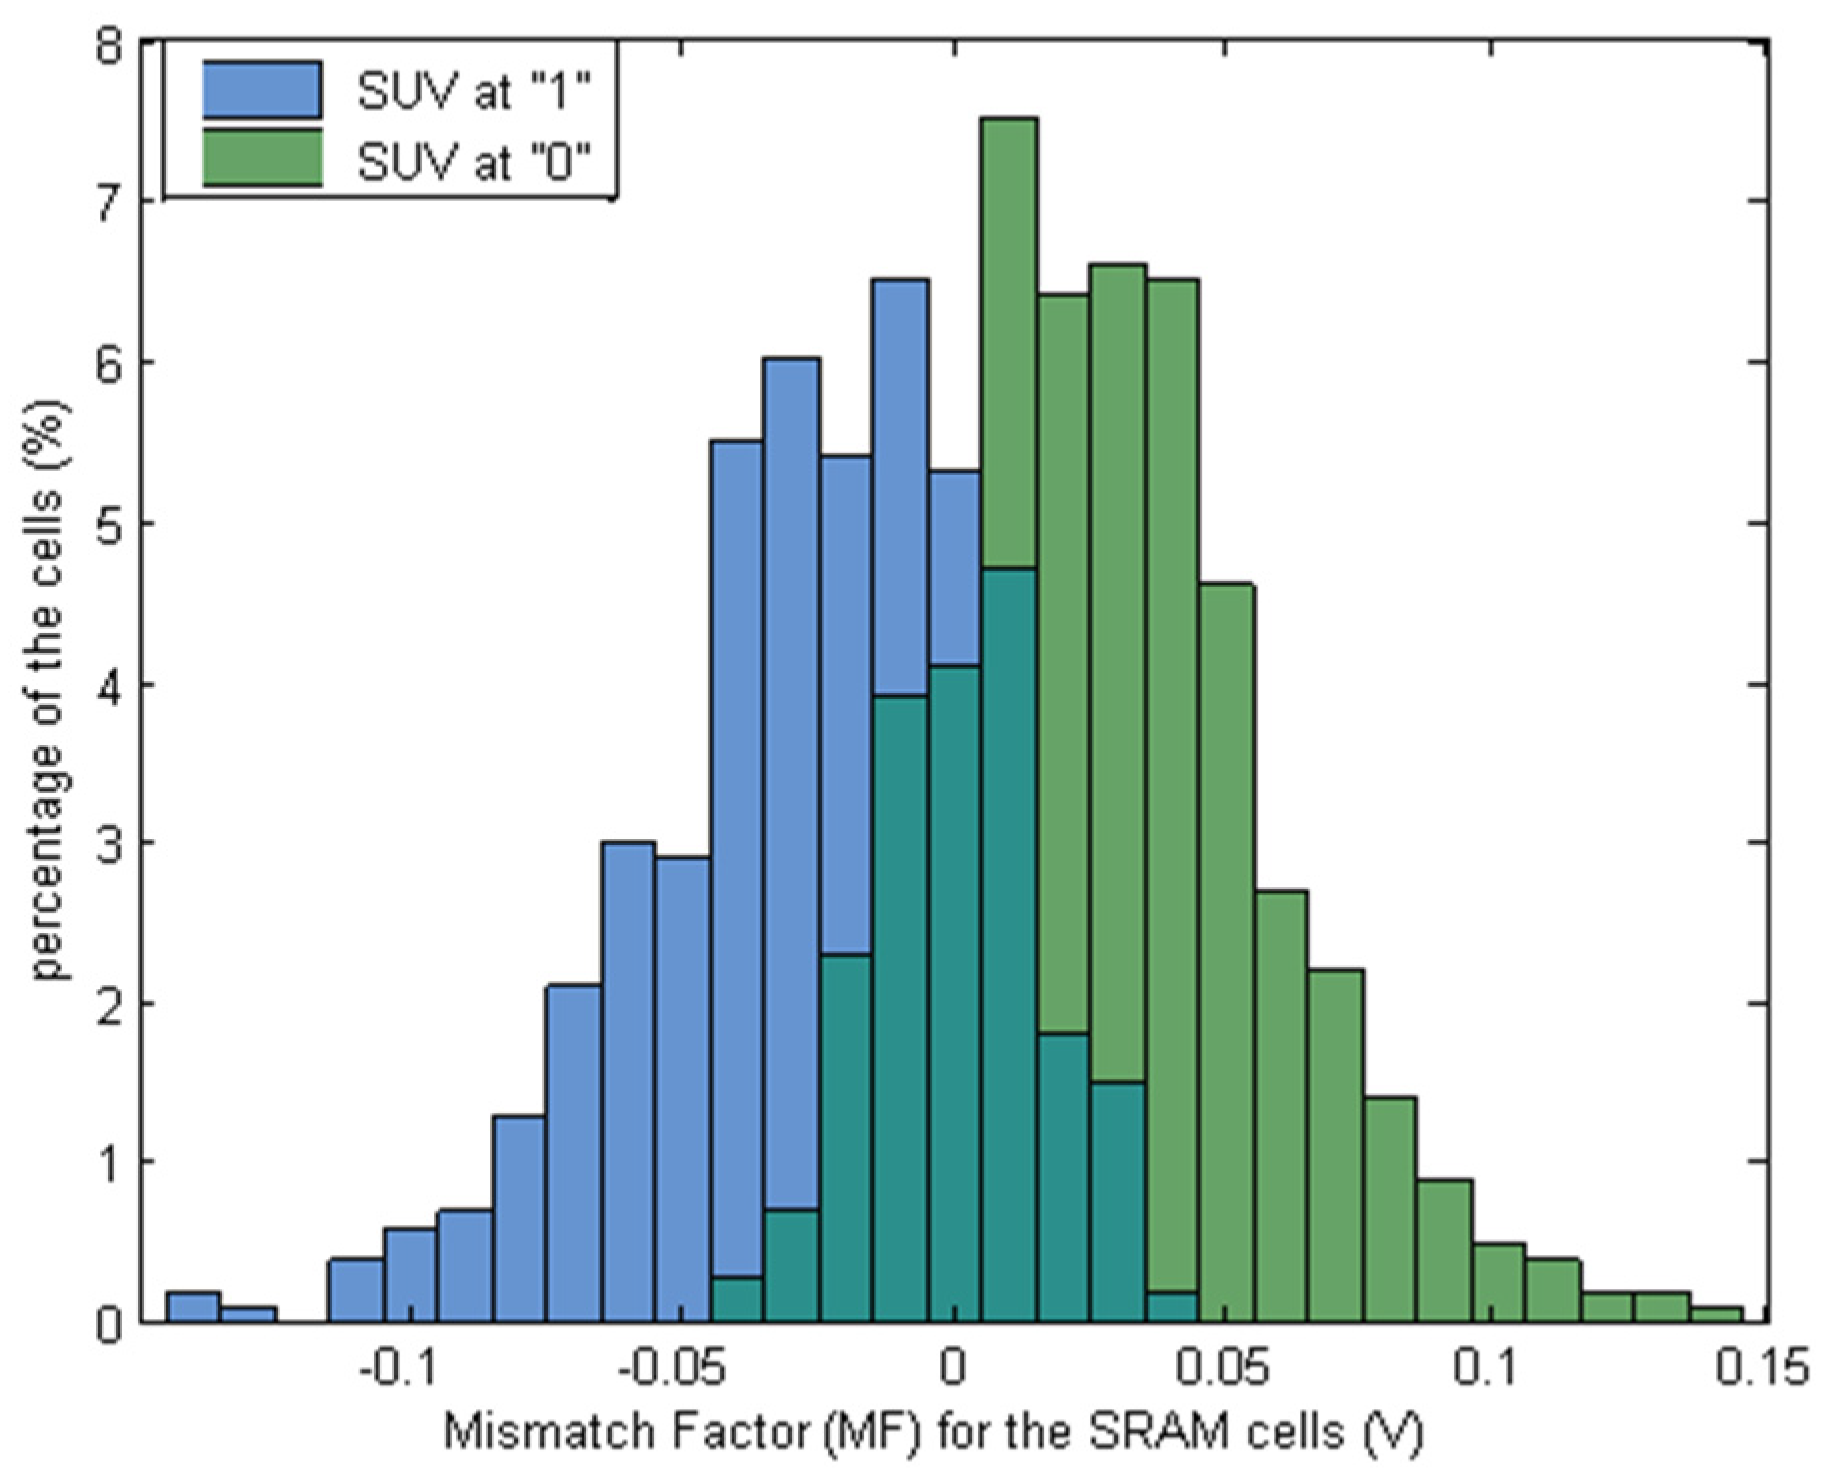
3.1. Mismatch-Based Metric
3.2. Separatrix-Based Metric
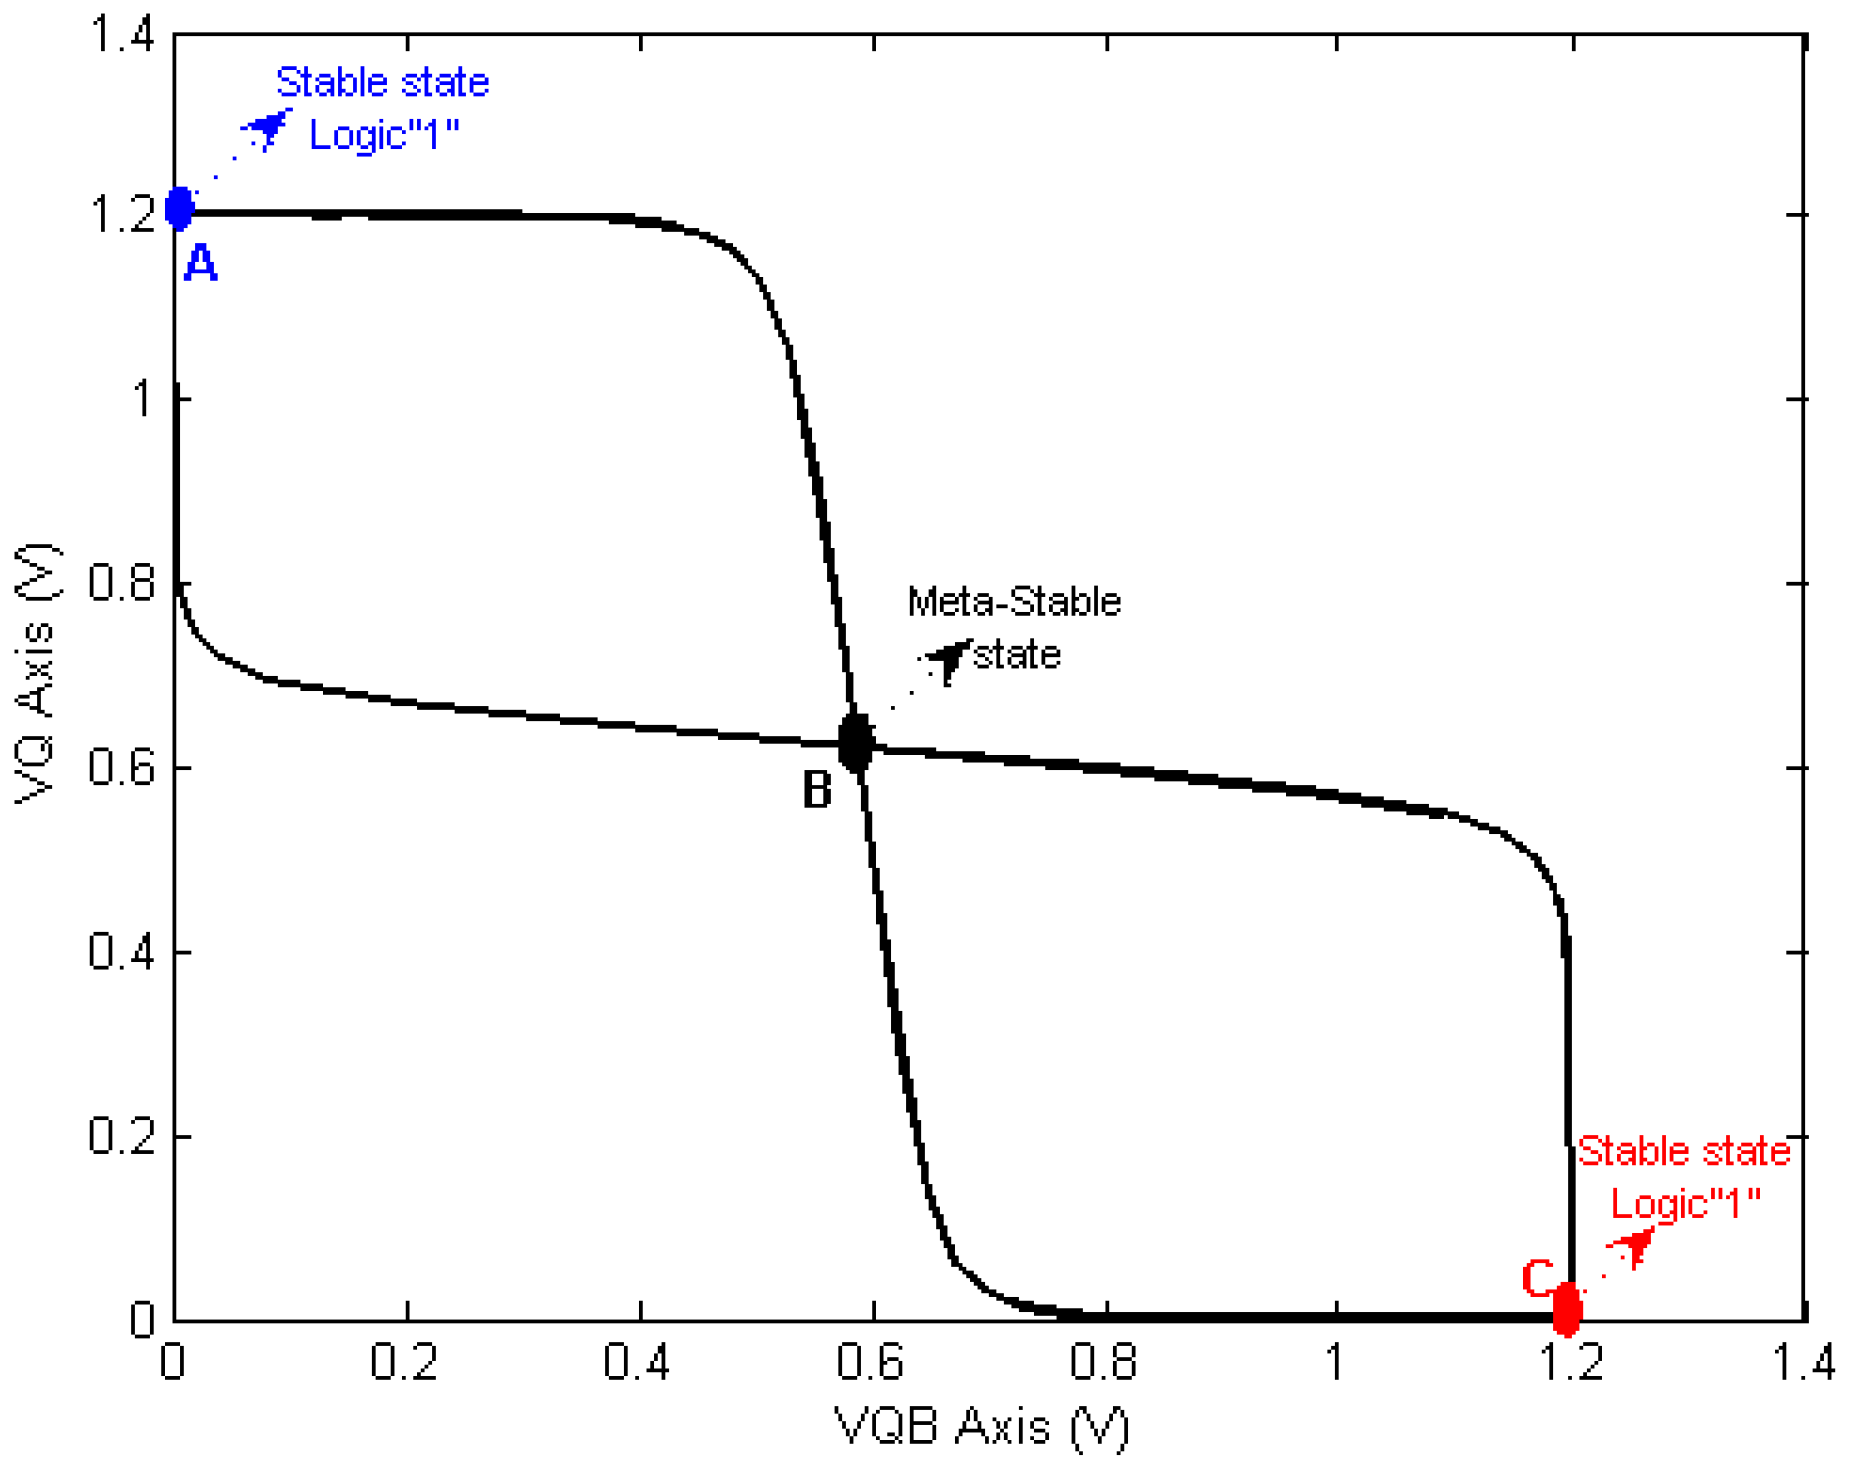
3.2.1. SRAM Separatrix Using State Space Representation
- The memory is initiated with the cells in the stable state S1 as their initial condition: setting node QBo = 0 V and node Qo = Vskew.
- The memory is set up again, but this time with cell starting conditions skewed towards the stable state S0: setting node QBo = Vskew and node Qo = 0 V.
3.2.2. Separatrix Intersection Distance (SID) Metric
- Three tests for each cell in the proposed memory are implemented to determine which axis the separatrix would intersect:
- ○
- Test 1: VQB = 0 V and VQ = 0 V are the initial conditions for the cell, as shown in Figure 6.
- ○
- Test 2: the cell is powered on with starting conditions highly skewed towards the stable state S0 (logic ‘0’), with VQB = Vdd/2 V and VQ = 0 V (see Figure 6). The initial VQBo value is set to identify the trend toward S0, even in highly symmetrical cells; a low initial condition value does not allow for the detection of low mismatched cells [18].
- ○
- Test 3: the cell is powered on with initial condition highly tilted towards the stable state S1 (logic ‘1’), where VQB = 0 V and VQ = Vdd/2 V (see Figure 6). Again, the initial VQo value is set to detect the trend towards S1.
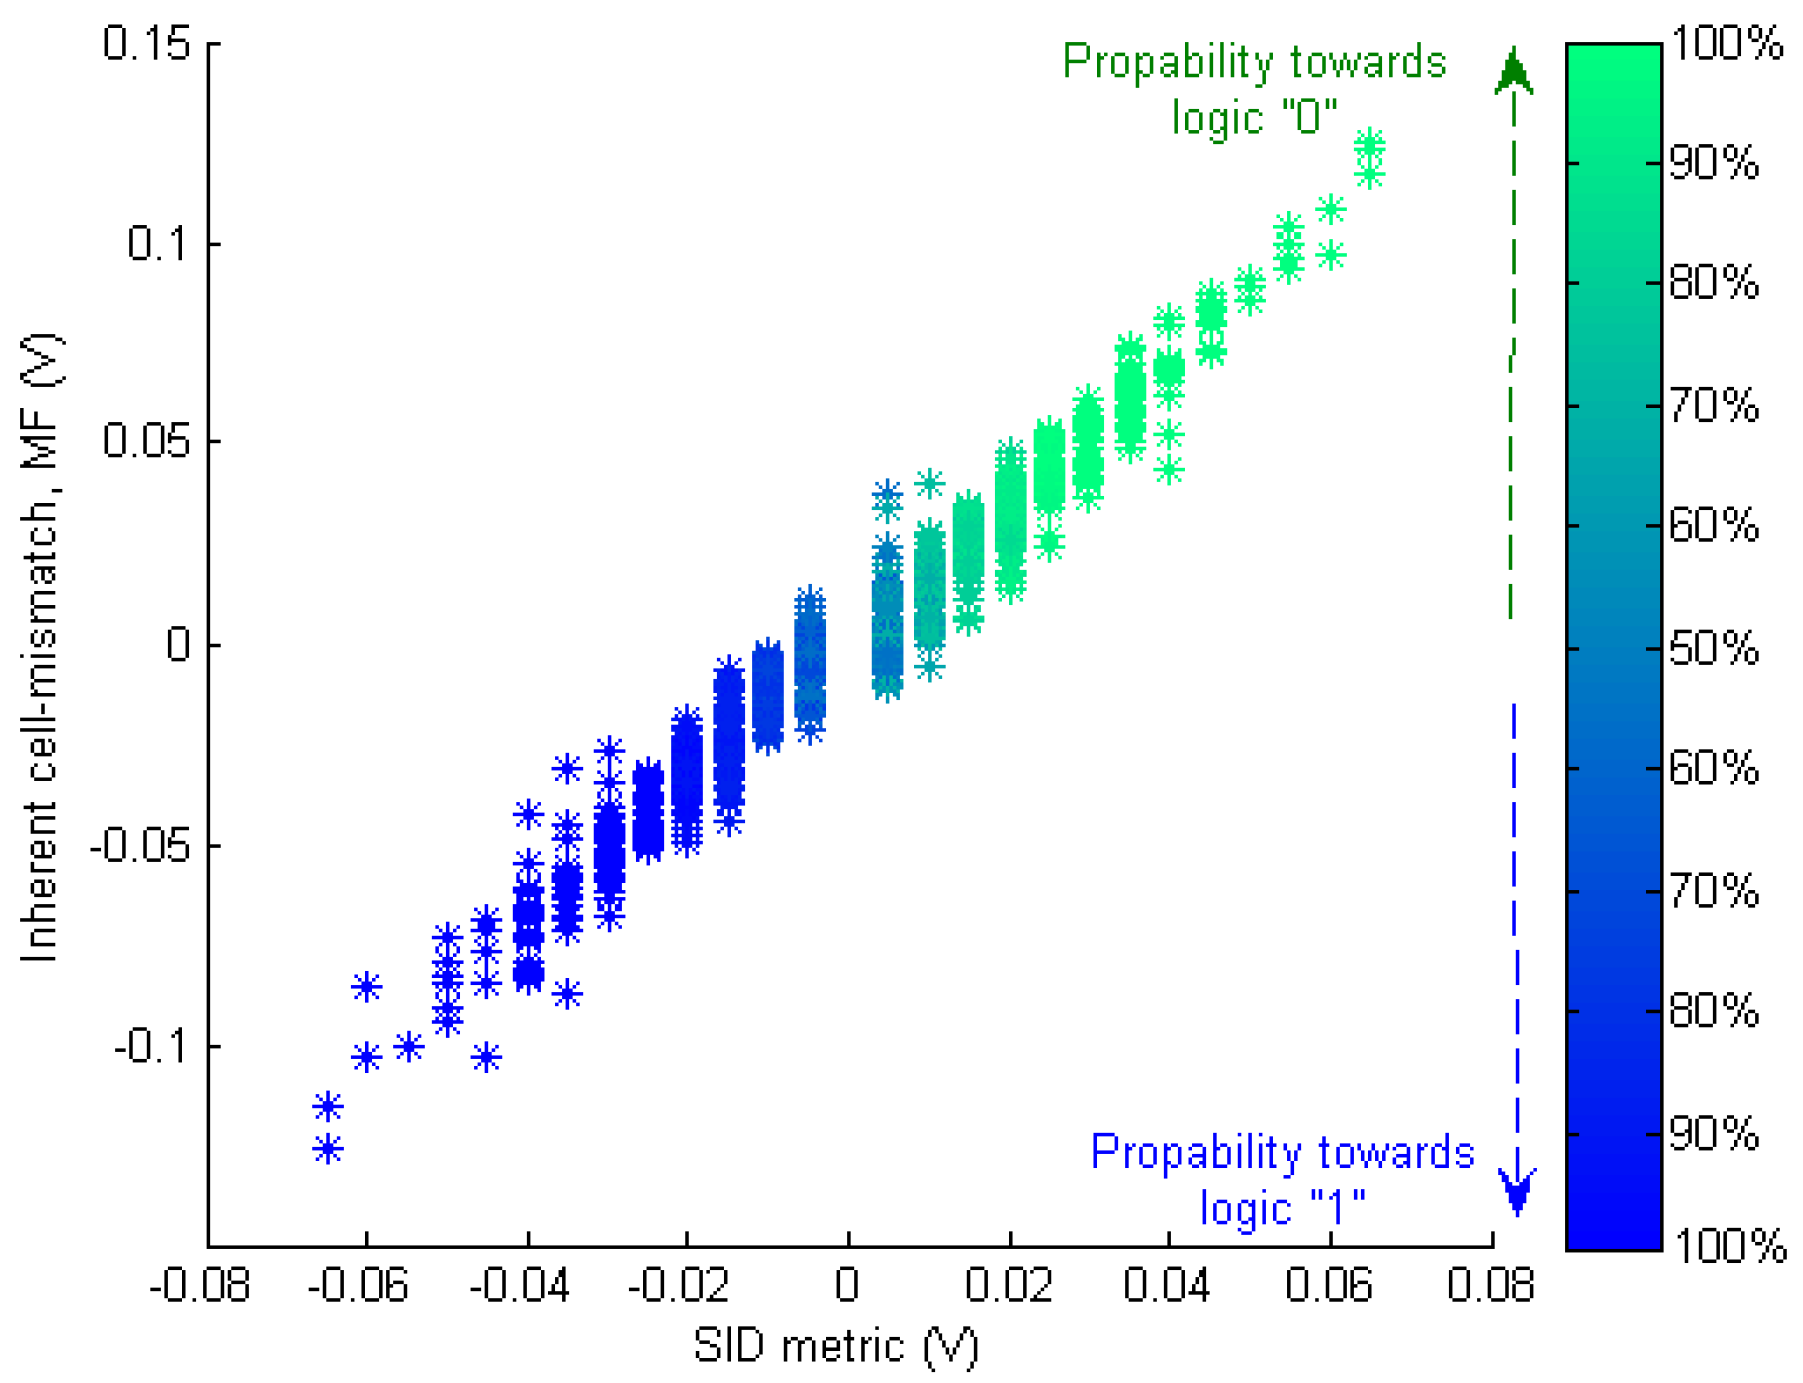
3.3. Relationship between the Proposed Metrics
4. The Impact of External and Internal Disturbances on SRAM-PUF
4.1. Noise Modeling in SRAM-PUF
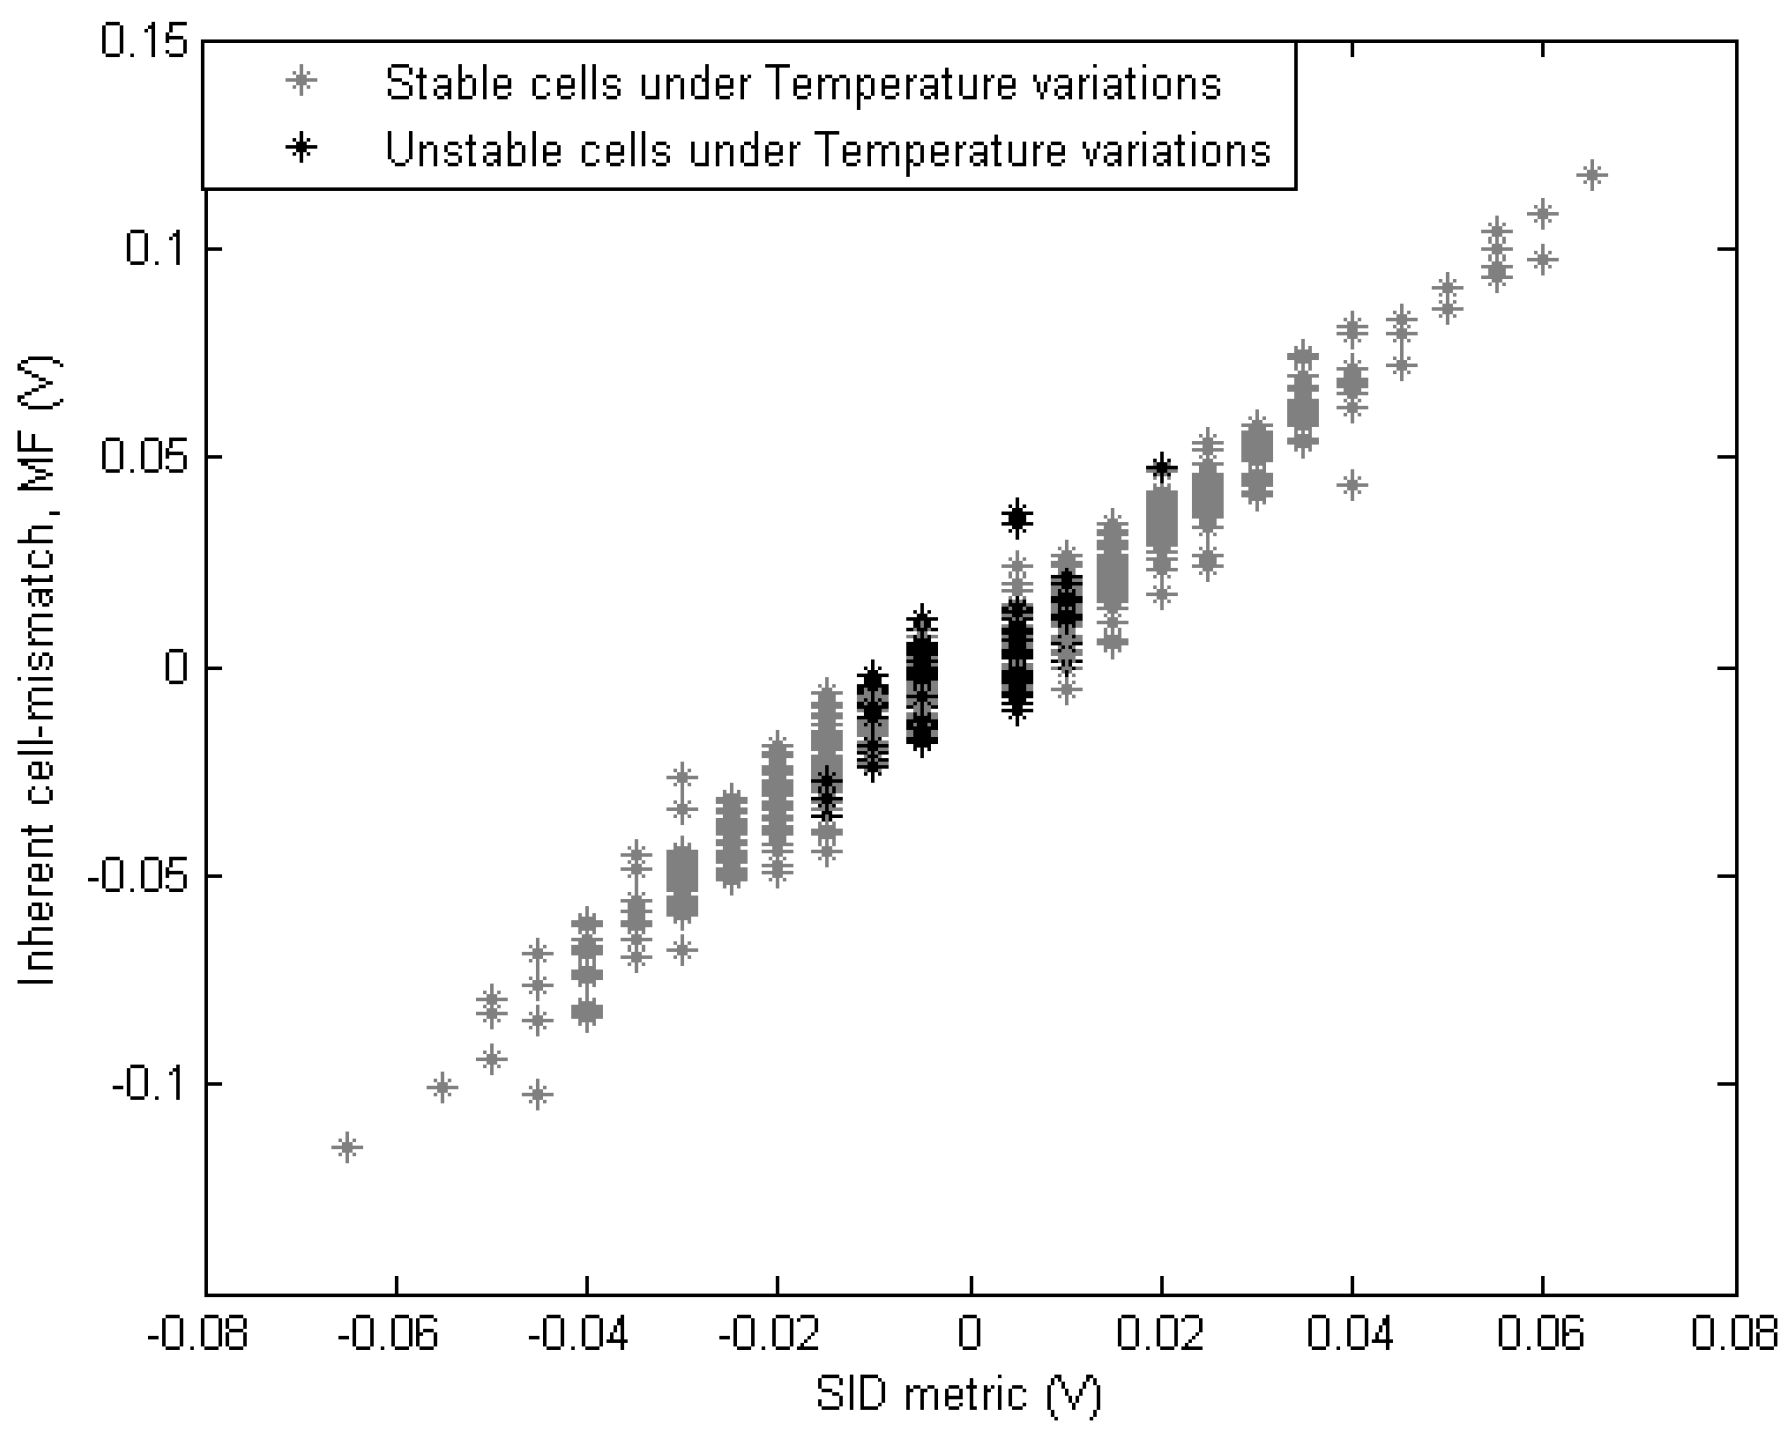
4.2. Impact of External Temperature Variations
5. Identification Reliable PUF Cells Using the Proposed Metrics
6. Conclusions
Author Contributions
Funding
Conflicts of Interest
References
- Gassend, B.; Clarke, D.; Van Dijk, M.; Devadas, S. Silicon physical random functions. In Proceedings of the 9th ACM Conference on Computer and Communications Security, Washington, DC, USA, 18–22 November 2002; pp. 148–160. [Google Scholar]
- Guajardo, J.; Kumar, S.S.; Schrijen, G.J.; Tuyls, P. FPGA intrinsic PUFs and their use for IP protection. In Cryptographic Hardware and Embedded Systems—CHES 2007; Springer: Berlin/Heidelberg, Germany, 2007; pp. 63–80. [Google Scholar]
- Herder, C.; Yu, M.; Koushanfar, F.; Devadas, S. Physical Unclonable Functions and Applications: A Tutorial. Proc. IEEE 2014, 102, 1126–1141. [Google Scholar] [CrossRef]
- Gołofit, K.; Wieczorek, P.Z. Chaos-Based Physical Unclonable Functions. Appl. Sci. 2019, 9, 991. [Google Scholar] [CrossRef]
- Gao, Y.; Al-Sarawi, S.F. Abbott, D. Physical unclonable functions. Nat. Electron. 2020, 3, 81–91. [Google Scholar] [CrossRef]
- Xu, T.; Potkonjak, M. Digital PUF using intentional faults. In Proceedings of the Sixteenth International Symposium on Quality Electronic Design, Santa Clara, CA, USA, 2–4 March 2015; pp. 448–451. [Google Scholar]
- Maurer, U.M. Secret key agreement by public discussion from common information. IEEE Trans. Inf. Theory 1993, 39, 733–742. [Google Scholar] [CrossRef]
- Böhm, C.; Hofer, M. Using the SRAM of a Microcontroller as a PUF. In Physical Unclonable Functions in Theory and Practice; Springer: Berlin/Heidelberg, Germany, 2013; pp. 249–259. [Google Scholar]
- Mathew, S.K.; Satpathy, S.K.; Anders, M.A.; Kaul, H.; Hsu, S.K.; Agarwal, A.; Chen, G.K.; Parker, R.J.; Krishnamurthy, R.K.; De, V.; et al. 16.2 A 0.19 pJ/b PVT-variation-tolerant hybrid physically unclonable function circuit for 100% stable secure key generation in 22 nm CMOS. In Proceedings of the 2014 IEEE International Solid-State Circuits Conference Digest of Technical Papers, San Francisco, CA, USA, 9–13 February 2014; pp. 278–279. [Google Scholar]
- Satpathy, S.; Mathew, S.K.; Suresh, V.; Anders, M.A.; Kaul, H.; Agarwal, A.; Hsu, S.K.; Chen, G.; Krishnamurthy, R.K.; De, V.K. A 4-fJ/b delay-hardened physically unclonable function circuit with selective bit destabilization in 14-nm trigate CMOS. IEEE J. Solid-State Circuits 2017, 52, 940–949. [Google Scholar] [CrossRef]
- Bota, S.A.; Torrens, G.; Verd, J.; Segura, J. Detailed 8-transistor SRAM cell analysis for improved alpha particle radiation hardening in nanometer technologies. Solid State Electron. 2015, 111, 104–110. [Google Scholar] [CrossRef]
- Takeuchi, K.; Mizutani, T.; Saraya, T.; Kobayashi, T.; Hiramoto, T.; Shinohara, H. Measurement of SRAM power-up state for PUF applications using an addressable SRAM cell array test structure. In Proceedings of the International Conference on Microelectronic Test Structures (ICMTS), Yokohama, Japan, 28–31 March 2016; pp. 130–134. [Google Scholar]
- Alheyasat, A.; Torrens, G.; Bota, S.; Alorda, B. Weak and Strong SRAM cells analysis in embedded memories for PUF applications. In Proceedings of the 34th Conference on Design of Circuits and Integrated Systems, Bilbao, Spain, 20–22 November 2019. [Google Scholar]
- Dong, W.; Peng, L.; Garng, M.H. SRAM dynamic stability: Theory, variability and analysis. In Proceedings of the 2008 IEEE/ACM International Conference on Computer-Aided Design, San Jose, CA, USA, 10–13 November 2008. [Google Scholar]
- Zhang, Y.; Peng, L.; Garng, M.H. Separatrices in high-dimensional state space: System-theoretical tangent computation and application to SRAM dynamic stability analysis. In Proceedings of the 47th Design Automation Conference, New York, NY, USA, 13–18 June 2010. [Google Scholar]
- Sharifkhani, M.; Sachdev, M. SRAM cell stability: A dynamic perspective. IEEE J. Solid State Circuits 2009, 44, 609–619. [Google Scholar] [CrossRef]
- Vatajelu, E.L.; Giorgio, D.N.; Paolo, P. Towards a highly reliable SRAM-based PUFs. In Proceedings of the 2016 Design, Automation & Test in Europe Conference & Exhibition (DATE), Dresden, Germany, 14–18 March 2016. [Google Scholar]
- Holcomb, D.E.; Kevin, F. Bitline PUF: building native challenge-response PUF capability into any SRAM. In International Workshop on Cryptographic Hardware and Embedded Systems; Springer: Berlin, Germany, 2014. [Google Scholar]
- Patil, V.C.; Arunkumar, V.; Daniel, E.H.; Sandip, K. Improving reliability of weak PUFs via circuit techniques to enhance mismatch. In Proceedings of the 2017 IEEE International Symposium on Hardware Oriented Security and Trust (HOST), Mclean, VA, USA, 1–5 May 2017. [Google Scholar]
- Holcomb, D.E.; Wayne, P.B.; Kevin, F. Initial SRAM state as a fingerprint and source of true random numbers for RFID tags. In Proceedings of the Conference on RFID Security, Graz, Austria, 13–15 July 2007. [Google Scholar]
- Cortez, M.; Said, H.; Ali, K.; Roel, M.; Geert-Jan, S. Intelligent voltage ramp-up time adaptation for temperature noise reduction on memory-based PUF systems. IEEE Trans. Comput. Aided Des. Integr. Circuits Syst. 2015, 34, 1162–1175. [Google Scholar] [CrossRef]


| Identification Methodology | Stable Temperature Cells | Cells with Highest Probability to Repeat the Same SUV | Reliable Cells |
|---|---|---|---|
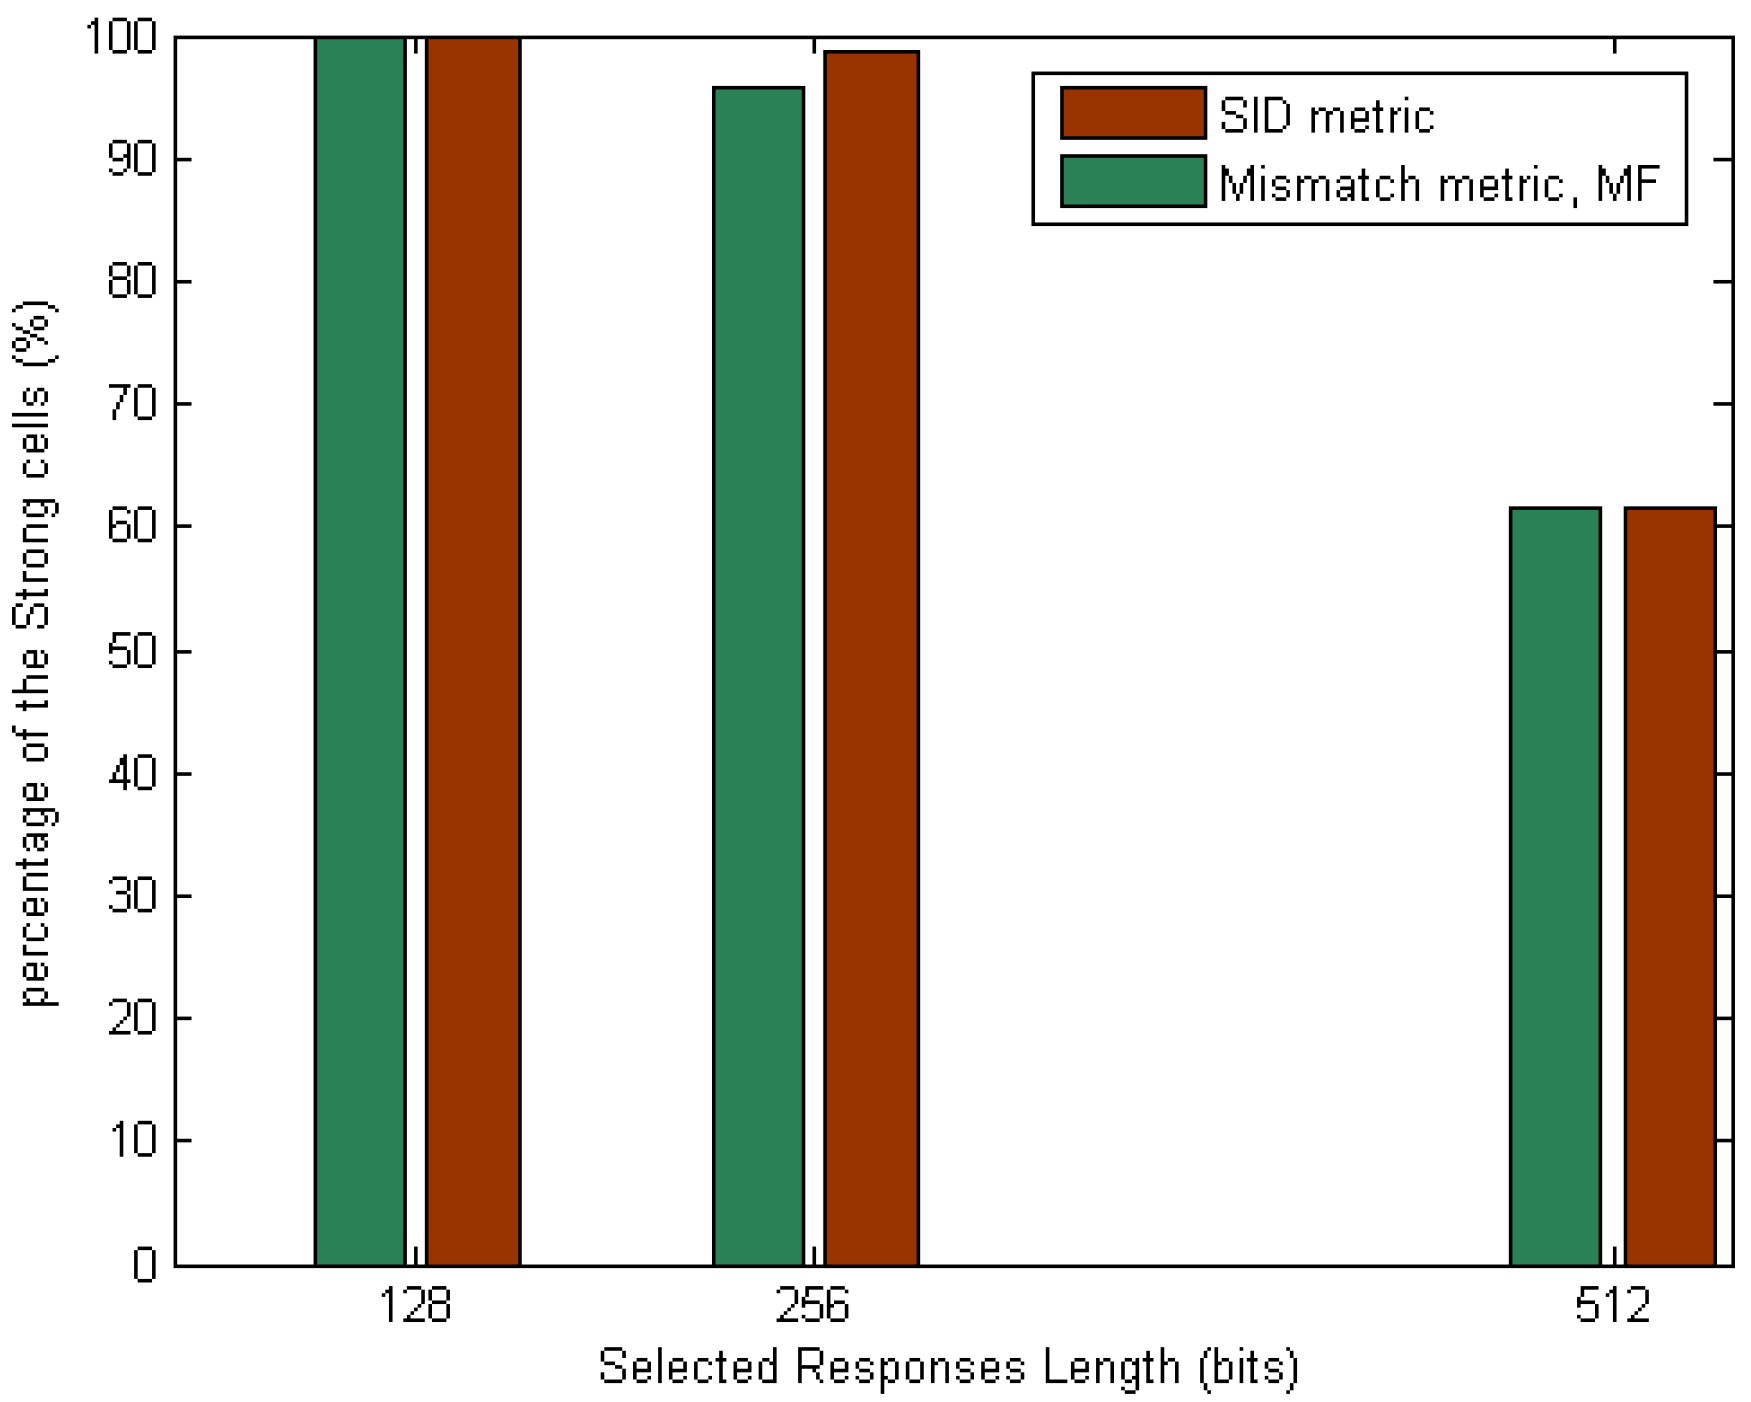
| MF (256 bit) | 100% (256 bits) | 95.7% (245 bits) | 95.7% (245 bits) |
| SID (256 bits) | 100% (256 bits) | 98.8% (253 bits) | 98.8% (253 bits) |
| Random cells (256 bits) | 76.6% (196 bits) | 33.2% (85 bits) | 30.9% (79 bits) |
Publisher’s Note: MDPI stays neutral with regard to jurisdictional claims in published maps and institutional affiliations. |
© 2021 by the authors. Licensee MDPI, Basel, Switzerland. This article is an open access article distributed under the terms and conditions of the Creative Commons Attribution (CC BY) license (https://creativecommons.org/licenses/by/4.0/).
Share and Cite
Alheyasat, A.; Torrens, G.; Bota, S.A.; Alorda, B. Estimation during Design Phases of Suitable SRAM Cells for PUF Applications Using Separatrix and Mismatch Metrics. Electronics 2021, 10, 1479. https://doi.org/10.3390/electronics10121479
Alheyasat A, Torrens G, Bota SA, Alorda B. Estimation during Design Phases of Suitable SRAM Cells for PUF Applications Using Separatrix and Mismatch Metrics. Electronics. 2021; 10(12):1479. https://doi.org/10.3390/electronics10121479
Chicago/Turabian StyleAlheyasat, Abdel, Gabriel Torrens, Sebastià A. Bota, and Bartomeu Alorda. 2021. "Estimation during Design Phases of Suitable SRAM Cells for PUF Applications Using Separatrix and Mismatch Metrics" Electronics 10, no. 12: 1479. https://doi.org/10.3390/electronics10121479
APA StyleAlheyasat, A., Torrens, G., Bota, S. A., & Alorda, B. (2021). Estimation during Design Phases of Suitable SRAM Cells for PUF Applications Using Separatrix and Mismatch Metrics. Electronics, 10(12), 1479. https://doi.org/10.3390/electronics10121479