Article

Precise Reactive Power-Voltage Droop Control of Parallel Virtual Synchronous Generators That Considers Line Impedance

1
Key Laboratory of Distributed Energy Storage and Micro-Grid in Hebei, North China Electric Power University, Baoding 071003, China
2
Department of Electrical Engineering, University of Sargodha, Sargodha 40100, Pakistan
*
Author to whom correspondence should be addressed.
Electronics 2021, 10(11), 1344; https://doi.org/10.3390/electronics10111344
Submission received: 14 May 2021 / Revised: 30 May 2021 / Accepted: 2 June 2021 / Published: 3 June 2021

Abstract

:
Problems such as high power coupling, low distribution accuracy, and insufficient reactive power-voltage droop accuracy occur when distributed generators are operated in parallel due to the influence of line impedance. The precise control of output reactive power and voltage is difficult to achieve using traditional virtual synchronous generator (VSG) control. Taking this into consideration, this study proposes a virtual synchronous generator reactive power-voltage integrated control strategy that considers line parameters to solve this problem. First, the impedance voltage drop of the line is compensated for in accordance with local information control to ensure the consistency of the control voltage in parallel operation of distributed generators and to realize the precise droop control of reactive power and the voltage of the point of common coupling (UPCC). Second, virtual negative impedance control is added to change the equivalent output impedance characteristics of the system and achieve power decoupling. On this basis, the active frequency and reactive voltage decoupling control effect of the improved control strategy is quantified and analyzed using the relative gain matrix. The accuracy of reactive power distribution and droop control is theoretically derived and analyzed by establishing a small-signal model of a two-machine parallel system. Finally, the accuracy and effectiveness of the proposed integrated control strategy are verified via a simulation model and an experimental platform for parallel operation. Results show that the proposed integrated control strategy can effectively solve the problems of power decoupling and accurate distribution, reduce system loop current, and realize accurate reactive power-voltage droop. Compared with the traditional VSG control strategy, the dynamic deviation of UPCC is reduced by at least 40% when a large-scale load disturbance occurs.

1. Introduction

Microgrid technology has elicited considerable attention with the growing maturity of new energy generation technology. Microgrids contain distributed generators (DGs), energy storage units, converters, loads, and protection and control devices [1]. They can be connected to the main grid for grid-connected operation or isolated from it [2]. When a microgrid is in an island operation state, the control mode is divided into two types: master-slave control and peer-to-peer control [3]. Although the structure of master-slave control is simple, its disadvantages, such as poor system stability and high operation cost, cannot be disregarded and are not conducive for large-scale applications [4]. The peer-to-peer control mode can achieve independent control among different DGs and quickly complete load disturbance response without communication, considerably improving the reliability of the system power supply and the economy of the operation. Therefore, distributed microgrids with peer-to-peer control have become a research hotspot [5].
At present, distributed microgrids based on the peer-to-peer control mode adopt droop control for each distributed generation micro-source. However, considering the rapid development of microgrids, the operating characteristics of low inertia and underdamping cannot be disregarded. To improve the security and stability of microgrid operation, many scholars have proposed virtual synchronous generator (VSG) control [6]. Inertia and damping links are added based on droop control by simulating the external characteristics of a synchronous generator set. When load disturbance occurs, inertial support can be provided immediately to avoid the large-scale oscillation of a system [7]. Existing experiments and actual projects have verified the effectiveness of this control strategy [8]. However, the problem of accurate power allocation in a microgrid system when multiple DGs operate in parallel cannot be disregarded whether in droop control or VSG control. The output line impedance parameters of a system and the terminal control voltage cannot be matched due to the varying capacities and scattered locations among different DGs [9]. The power output of DGs is coupled, and the precise droop control of reactive power-voltage cannot be achieved. When power distribution deviation occurs in a system, circulating current is easy to produce, leading to an increase in system loss and affecting the power quality of a system.
Scholars have proposed various solutions to these problems based on the traditional VSG control [10,11,12,13,14,15,16,17,18,19]. The accuracy of the reactive power distribution of a system was improved by introducing virtual impedance control based on the analysis of power coupling in [10,11,12]. The virtual negative impedance control is introduced in [10]. By introducing the virtual impedance parameter to increase the inductance component of the system, the impedance parameter matching between different DGs is realized. In References [11,12], virtual positive impedance control is introduced to adjust the resistive component of equivalent output impedance. These methods can achieve power decoupling and ensure accurate power distribution. However, the introduction of virtual impedance will cause an excessive drop in the voltage of the point of common coupling (PCC) (UPCC), degrading the power quality of a system. The reactive power-voltage control strategy based on adaptive virtual impedance, which is realized by adding adaptive disturbance to virtual impedance, was reported in [13]. This technique uses a synchronous communication system to complete information interaction. Ensuring that the receiving time of each DG is consistent is necessary and requires a real-time communication link. An adaptive impedance control based on a consistent control algorithm was proposed to further improve the accuracy of reactive power distribution further [14]. In References [15,16], a control strategy with low real-time requirements for communication was presented to reduce power output deviation through the coupling relationship among powers. However, the action time of the synchronization signal was difficult to determine. The quality of the terminal voltage was improved by directly applying UPCC to the voltage feedback of a double-loop control system in [17]. This technique requires high accuracy of information transmission, and the delay in communication reduces the flexibility and stability of system control. Accurate reactive power allocation was achieved based on voltage droop control and bus voltage at PCC [18]. In References [2,19], the parameters of microgrid lines were used to modify the reactive power droop coefficient to achieve a reasonable reactive power distribution. Although these methods improve the power distribution accuracy of a system, the reactive power-voltage droop characteristic also changes.
In accordance with the analysis of the aforementioned control methods, current problems related to reactive power-voltage control caused by a difference in line impedance have not been resolved fully. Most control schemes focus on front-end reactive power distribution and the precise control of output voltage, and they highly depend on the stability of the communication link and the accuracy of information. The precise droop control effect of reactive power-voltage at the end of the line (i.e., the user side) and the effect of local information are seldom considered. To realize the “plug-and-play” and precise reactive power-voltage droop control effect of parallel DGs, a VSG reactive power-voltage integrated control strategy that considers line parameters is proposed in the current study. Combined with local information control, the line impedance voltage drop is compensated for, and the control voltage is moved forward to the PCC. Notably, the integrated control not only realizes the precise distribution of reactive power by matching the control voltages of different DGs, but it also achieves precise droop control of the voltage at PCC (UPCC). Simultaneously, power decoupling is achieved by introducing virtual negative impedance control to improve system dynamic performance. The output power decoupling control effect of the improved control strategy is quantified and compared with the first amplification factor matrix and the relative gain matrix. The small-signal model of a two-machine parallel system is developed to theoretically verify the deviation of reactive power distribution and the accuracy of reactive power-voltage droop control. Finally, the effectiveness of the proposed integrated control strategy is verified via simulation and an experimental platform.

2. Limitation Analysis of Traditional VSG Control

2.1. Traditional VSG Control

The VSG main circuit topology and control scheme adopted in the current study are illustrated in Figure 1. To simplify the analysis, the direct current (DC) side is replaced with a constant voltage source. The high-order harmonics of the voltage at the output side of the inverter bridge arm (Eabc) are eliminated using an LC filter to obtain the voltage at the output side of the VSG (Uabc). It supplies power to the public load at the PCC after the line impedance Zline. Udc is the voltage of the DC-side voltage source; Cdc is the capacitance value of the DC side; ifabc and iabc are the inductance current and VSG output current, respectively; L is the filter reactance; and C is the filter capacitor.
The VSG control scheme includes an active frequency control loop, a reactive voltage control loop, a three-phase modulated wave generator, and a space vector pulse width modulation regulator. The mathematical expressions for the active frequency control loop and the reactive voltage control loop are given in (1)–(3).
J d ω d t = P ref ω s P e ω s D p ( ω ω s )
θ = ω d t
K d E d t = Q ref Q e + D q ( E 0 U 0 )
where Pref and Qref are the given values of active and reactive power, respectively; Pe and Qe are the instantaneous output active and reactive power, respectively, of the VSG through a low-pass filter; Dp and Dq are the droop coefficient of the active frequency and reactive voltage, respectively; ω is the VSG output angular frequency; ωs is the system-rated angular frequency; E0 is the rated output voltage amplitude; U0 is the actual output voltage amplitude; J is the virtual moment of inertia; and K is the equivalent inertia coefficient.

2.2. Limitations of VSG Control Power Distribution

Using the parallel system of two VSGs as an example, the equivalent circuit diagram is shown in Figure 2. In the figure, Ei and δi (i = 1, 2) are the output amplitude and phase angle of the VSG equivalent voltage source. δi is usually small, and it can be approximately regarded as sinδi = δi, cosδi = 1. UPCC is the voltage amplitude of the PCC. Zi is the equivalent output impedance, and φi is the equivalent output impedance angle. Z0 is the load impedance. Ii, I0, and Icc are the VSG output current, load current, and system circulating current, respectively.
When the equivalent output impedance of a system is inductive (i.e., Xi >> Ri), the equivalent output impedance angle φi = 90° can be considered. At this moment, the expressions of the VSG single-phase output active power and reactive power are given in (4).
P e i = E i U PCC X i δ i Q e i = U PCC ( E i U PCC ) X i
From the preceding equation, when the equivalent output impedance is inductive, the active and reactive power of a system are related to the phase angle δi and voltage deviation (EiUPCC), respectively. The output adjustment of VSG active power can be realized by adjusting the phase angle, and reactive power can be improved by adjusting voltage deviation, meeting the basic principle of VSG control.
In accordance with the VSG control equation, considering that frequency is a global variable, active power distribution in steady-state operation is only related to the given values of active power Pref and droop coefficient Dp, which are unaffected by system line parameters. However, the output voltage of a system is not a global variable and is closely related to line parameters. When differences exist in line parameters among DGs, reactive power cannot be distributed in accordance with the rated capacity [20]. In the traditional VSG reactive voltage control strategy, the setting of the droop coefficient Dq is closely related to the output reactive power of VSG and the voltage in the first section of the line. However, the droop coefficient deviation caused by line impedance voltage drop and power loss cannot be disregarded [21]. The precise droop control effect of reactive power-voltage at the end of the line (i.e., user side) should be given increased attention.

3. Integrated Control Strategy

3.1. Improved VSG Reactive Voltage Control

The current study proposes an improved control scheme of reactive voltage based on local information control quantity. The output voltage U0 of the VSG in the reactive voltage control loop is compensated for by the line parameter voltage drop ΔUline and converted into voltage at the public load UPCC. It compensates for the voltage deviation caused by the difference in line impedance of various DGs and ensures the consistency of the control voltage. Simultaneously, precise droop control between reactive power and line terminal voltage is realized, and the public alternating current (AC) bus voltage is optimized, further satisfying the “plug-and-join” control requirements of different DGs.
The block diagram of the improved reactive voltage control of the VSG is shown in Figure 3.
In the improved control strategy, the reactive power expression is given in (5) when a system is in steady-state operation.
Q e = Q ref + D q ( E 0 ( U o - Δ U line ) ) = Q ref + D q ( E 0 U PCC )
As shown in Figure 3 and (5), when line impedance Zline is added to the reactive voltage control loop, reactive power distribution is only related to the rated output voltage amplitude E0 and the reactive droop coefficient Dq. The precise distribution of reactive power can be realized in steady-state, and voltage in the PCC at the end of the line can be controlled to enable it to work near the rated operating point. The problem of low UPCC caused by line impedance and virtual impedance can be avoided.

3.2. Virtual Negative Impedance Control

The traditional VSG control is designed when the equivalent output impedance is inductive. However, a distributed microgrid is in the low-voltage operation state, and its line parameters are typically resistive or resistive-inductive. Load power changes cause considerable power coupling and dynamic circulation, affecting the dynamic control performance of each DG and the accuracy of output power distribution [22].
To realize the decoupling of active and reactive power and independent control in the dynamic regulation process, many experts have introduced the control idea of “virtual negative impedance” [23,24]. The expression for the typical virtual negative impedance control in the Dq coordinate system is given in (6).
E * ref _ d = E ref _ d + R v i _ od s L v i _ od + ω s L v i _ oq E * ref _ q = E ref _ q + R v i _ oq s L v i _ oq ω s L v i _ od
where RV and LV are the virtual resistance and virtual inductance values, respectively; Eref_d and Eref_q are the d-axis and q-axis components of the reactive voltage loop output reference voltage, respectively; i_od and i_oq are the d-axis and q-axis components of the output current, respectively; and E*ref_d and E*ref_q are the references for the three-phase modulated wave generator after virtual impedance correction. The block diagram of the integrated control strategy is shown in Figure 4.

4. Analysis and Theoretical Verification of the Integrated Control Strategy Based on Relative Gain

To visually analyze the difference between the integrated control strategy and the traditional VSG control strategy in terms of power decoupling and the precise distribution of reactive power, the two parallel VSGs in Figure 2 are used as an example for analysis. First, the first amplification factor matrix and relative gain matrix [25] are introduced to quantitatively compare and analyze the decoupling control effects of the two different control strategies on the active frequency and reactive voltage. Second, the small-signal model of a two-machine parallel system is built to verify the degree of accurate distribution of reactive power theoretically.

4.1. Analysis of the Integrated Control Strategy Based on Relative Gain

The two parallel VSGs in Figure 2 are presented as examples. When the equivalent output impedance is resistive-inductive, the mutual influence between the two VSGs should be considered. At this moment, the expression of the single-phase output power of the VSG is given in (7) (the specific solution process can be found in Appendix A).
P e 1 = E 1 2 Z 13 cos θ 13 + E 1 2 Z 12 cos θ 12 E 1 E 2 cos ( δ 2 δ 1 θ 12 ) Z 12 P e 2 = E 2 2 Z 23 cos θ 23 E 1 2 Z 12 cos θ 12 + E 1 E 2 cos ( δ 2 δ 1 θ 12 ) Z 12 Q e 1 = E 1 2 Z 13 sin θ 13 + E 1 2 Z 12 sin θ 12 + E 1 E 2 sin ( δ 2 δ 1 θ 12 ) Z 12 Q e 2 = E 2 2 Z 23 sin θ 23 E 1 2 Z 12 sin θ 12 E 1 E 2 sin ( δ 2 δ 1 θ 12 ) Z 12
From (7), a conclusion can be drawn that the active and reactive power output of the parallel system not only exhibits a coupling relationship between Ei and δi but also interaction among different VSGs. Therefore, the single-machine small-signal model established in [13] cannot reflect the difference in power allocation among different DGs. The first amplification coefficient matrix and relative gain matrix are introduced to reflect the coupling degree [26].
The matrix expression of the first amplification factor of the parallel system is given in (8).
Δ P e 1 Δ Q e 1 Δ P e 2 Δ Q e 2 = K 11 K 12 K 13 K 14 K 21 K 22 K 23 K 24 K 31 K 32 K 33 K 34 K 41 K 42 K 43 K 44 Δ δ 1 Δ E 1 Δ δ 2 Δ E 2
where ΔPei, ΔQei, ΔEi, and Δδi (i = 1, 2) are the small disturbances of active power, reactive power, VSG output voltage, and phase angle, respectively. The specific expression of matrix element K is found in Appendix B. To illustrate the coupling situation of the two-machine parallel system intuitively and clearly, a detailed derivation of the first system’s amplification factor matrix to the relative gain matrix is presented in [26]. This derivation is used to reflect the intensity and coupling of different input-output control effects. The system parameters listed in Table 1 can be substituted into (8) to obtain the first amplification coefficient matrix expression of the system. Refer to Appendix B (A8). In addition, the expression for the relative gain matrix of the two-machine parallel system is given in (9) by using the method presented in [27].
Δ δ 1 Δ E 1 Δ δ 2 Δ E 2 Δ P e 1 Δ Q e 1 Δ P e 2 Δ Q e 2 0.0581 0.9419 0.0584 0.9416 0.9419 0.0581 0.9416 0.0584 0.0584 0.9416 0.0670 0.9330 0.9416 0.0584 0.9330 0.0670
In accordance with (9), when the line parameters are resistive-inductive, the output power of the parallel system of the two VSGs is coupled with each other, and output power ΔPei and ΔQei are considerably affected by ΔEi and Δδi, respectively, which do not meet the VSG control principle. The analytical formula (A8) shows that the coupling correlation between the output phase angle Δδi and reactive power ΔQei is considerably greater than the influence of voltage ΔEi on active power ΔPei. This conclusion was proven via theoretical analysis and experiments in [28].
Virtual negative impedance control is introduced to realize the independent control of active and reactive power and reduce power coupling and the dynamic circulating current of a system. The virtual negative impedance parameters are designed according to [10]. The expression of the first amplification factor matrix is found in Appendix B (A9), and the expression of the relative gain matrix is given in (10).
Δ δ 1 Δ E 1 Δ δ 2 Δ E 2 Δ P e 1 Δ Q e 1 Δ P e 2 Δ Q e 2 0.9968 0.0032 0.9974 0.0026 0.0032 0.9968 0.0026 0.9974 0.9974 0.0026 0.9970 0.0030 0.0026 0.9974 0.0030 0.9970
From (A9) and (10), a conclusion can be drawn that the coupling coefficients of ΔδiΔPei and ΔΕi − ΔQei are considerably larger than those of Δδi − ΔQei and ΔΕi − ΔPei, meeting the VSG control structure. The decoupling control of active and reactive power can be approximately regarded as realized. Thus, active and reactive power loops can be controlled independently.

4.2. Small-Signal Model of a Two-Machine Parallel System

To analyze the interaction among different VSGs in the system and verify the effectiveness of the integrated control strategy for accurate reactive power distribution, the following conditions are assumed to be satisfied by the system.
(1)
When the virtual negative impedance control is adopted, the equivalent output impedance of the system is approximately purely inductive, realizing the decoupling of active and reactive power.
(2)
The output phase angle difference of the two VSGs is extremely small and approximately regarded as δ1δ2 = 0.
The simplified first amplification factor matrix of VSG output power, phase angle, and voltage is shown in (11).
Δ P e 1 Δ Q e 1 Δ P e 2 Δ Q e 2 = K 11 0 K 13 0 0 K 22 0 K 24 K 31 0 K 33 0 0 K 42 0 K 44 Δ δ 1 Δ E 1 Δ δ 2 Δ E 2
Here, the specific expression of matrix element K’ is found in Appendix B (A10). By analyzing the small-signal models of the active frequency and reactive voltage control loops in (1)–(3), the theoretical expressions can be obtained as shown in (12)–(14) [29].
Δ ω = Δ P ref Δ P e J ω s s + D p ω s
Δ δ = Δ ω + Δ ω s s
Δ E = Δ Q ref Δ Q e K s + D q
When (11)–(14) are combined, the block diagram of the small-signal control of the two-machine parallel system can be obtained, as shown in Figure 5.
From Figure 5, the expressions of the reactive power output of the VSG are given in (15) and (16).
Δ Q e 1 = ( M 1 ( s ) + N ( s ) ) Δ Q ref 1
Δ Q e 2 = ( M 2 ( s ) + N ( s ) ) Δ Q ref 2
where Mi(s) is the transfer function formula of ΔQrefi to ΔQei considering the single VSGi. N(s) is the transfer function formula of ΔQrefi to ΔQei considering the interaction of different VSGs. The specific meanings of M1(s), M2(s), and N(s) in the formulas are as follows:
M 1 ( s ) = 2 E 1 Z 12 + E 2 Z 13 ( K 1 s + D q 1 ) Z 13 Z 12 + ( 2 E 1 Z 12 + E 2 Z 13 )
M 2 ( s ) = 2 E 2 Z 12 + E 1 Z 23 ( K 1 s + D q 1 ) Z 23 Z 12 + ( 2 E 2 Z 12 + E 1 Z 23 )
N ( s ) = E 1 E 2 ( K 1 S + D q 1 ) ( K 2 S + D q 2 ) Z 12 2 E 1 E 2
When the traditional VSG control strategy is adopted for two parallel systems with the same capacity, the average reactive power-sharing error is shown in (17).
Δ Q err = Δ Q e 1 - Δ Q e 2 = ( M 1 ( s ) M 2 ( s ) ) Δ Q ref 1
When the integrated control strategy is adopted, line impedance voltage drop ΔUline is added to the reactive control loop to compensate for the voltage drop on different line impedances that is equivalent to the feedback of UPPC. Considering the compensation of line impedance voltage drop, the matching equivalent of the impedance of different DG output lines can be realized (i.e., Z13 = Z23). Thus, the reactive power deviation expression can be obtained, as shown in (18).
M 1 ( s ) = M 2 ( s ) Δ Q err = 0
In summary, the integrated control strategy can realize the precise distribution of reactive power and power decoupling. The introduction of the local information control quantity can realize control voltage matching and the accurate droop control of user-side voltage. It can also optimize public AC bus voltage. It can meet the requirements for the “plug-and-play” control of distributed microgrids without the support of communication links.

5. Simulation and Experimental Results

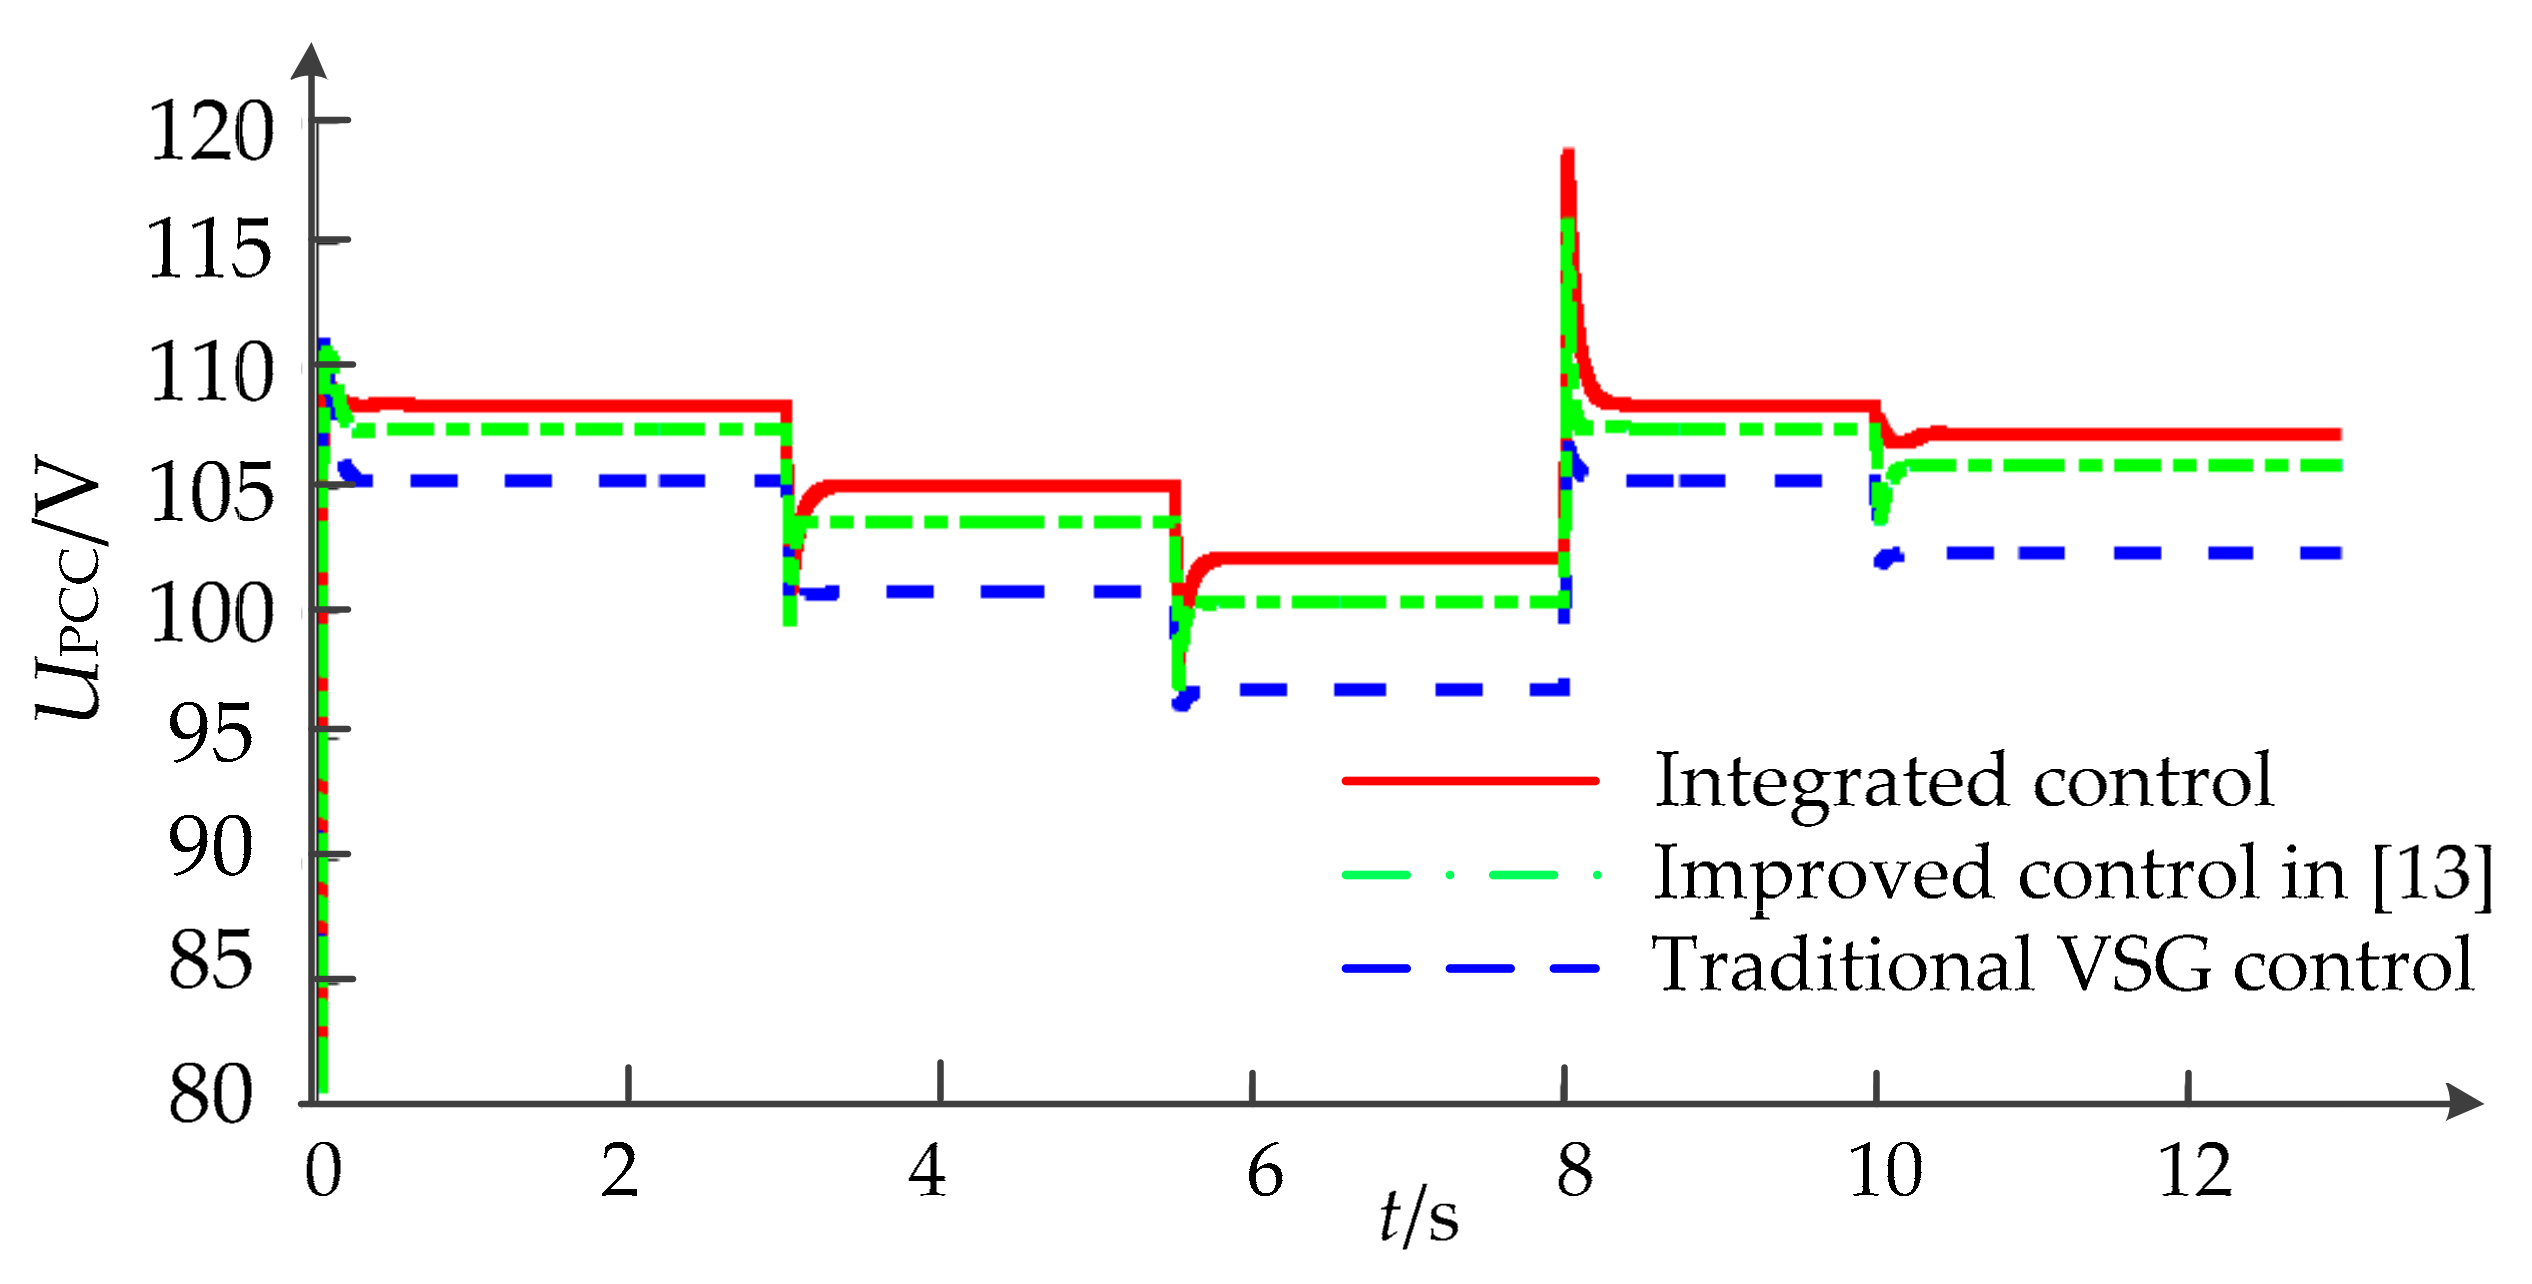
5.1. Simulation Verification

To verify the feasibility and scalability of the integrated control strategy proposed in this study, a system simulation model that consists of three VSGs is established on the MATLAB/Simulink platform. The parameters of the simulation system are provided in Table 1. The line parameter design of the two latter VSGs is consistent. The control system parameters of the three VSGs are listed in Table 2. The rated capacity of the three VSGs is set as 2:1:1, and the VSGs operate parallel to the supply power to common linear loads. The differences in output power and voltage among the traditional VSG control strategy, the improved control strategy in [13], and the integrated control strategy proposed in the current study are compared. The remaining simulation conditions are identical.
The simulation operating conditions are set as follows. The common load (6.2 kW + j3.8 kVar) is initially supplied by the three VSGs operating in parallel. When t = 3 s, the load suddenly increases; that is, the common load changes to (9.1 kW + j7 kVar). When t = 5.5 s, the load suddenly increases again; that is, the common load changes to (11.3 kW + j9.9 kVar). When t = 8 s, the common load returns to the initial operating state. When t = 10 s, VSG3 exits, and VSG1 and VSG2 share the common load.
The power output waveforms of the VSG with different control strategies are presented in Figure 6. By analyzing (a), (c), and (e) in Figure 6, when the three aforementioned control strategies are adopted, active power output is consistent with achieving accurate distribution matching with its own capacity. The distribution of active power is independent of the line impedance parameters. This finding is identical to the theoretical analysis results. However, in accordance with the analysis of the reactive power output waveform in Figure 6b, the traditional VSG control strategy cannot realize the precise distribution of reactive power due to the mismatch of line parameters. The steady-state values of reactive power with different control strategies are presented in Table 3. When the line impedance parameter exhibits resistive inductance, the reactive power output will present an operating state opposite to its own capacity (e.g., 1:1.62:1.62, 1:1.3:1.3). As shown in Figure 6d and Table 3, when the control strategy proposed in [13] is adopted, the precise distribution of reactive power can be realized by combining output reactive power with virtual reactance and adjusting virtual reactance adaptively. The reactive power output between the three VSGs meets the system-rated capacity setting (i.e., 2:1:1). However, when line impedance parameters differ considerably and exhibit pure resistance, the dynamic virtual reactance parameters are too large. Reactive power cannot be accurately allocated. Furthermore, the effect of the improved control strategy in [13] highly depends on the stability of the real-time communication equipment and the accuracy of the information, and thus, robustness is poor. As shown in Figure 6f and Table 3, the application of the integrated control strategy proposed in the current study can ensure the matching of different DG control voltages in the case of mismatched line impedance parameters to complete the precise distribution requirements of reactive power. By compensating the line impedance voltage ΔUline, the control of the voltage at the PCC is achieved. Compared with that in the control strategy proposed in [13], the percentage of reactive power output (Qei/(∑QeN)) of the integrated control strategy as shown in Table 3 is more accurate because the reference virtual impedance is not considered. This finding is consistent with the theoretical analysis in Chapter 4. It does not need the support of communication equipment, and it meets the control requirements of “plug-and-play” for the parallel operation of different DGs. However, excessive power fluctuations will occur when VSG3 exits. The reasons for this phenomenon have yet to be discussed and analyzed.
The root mean square (RMS) of UPCC with different control strategies is presented in Figure 7 and Table 4. As shown in Figure 7, the traditional VSG control cannot compensate for line impedance voltage drop, and voltage at the PCC deviates seriously from the rated value of 110 V. When load power suddenly increases, line impedance voltage drop ΔUline also increases, worsening the common bus voltage of the system. When the load power suddenly increases to (11.3 kW + j9.9 kVar), the voltage deviation of UPCCUPCC) will exceed 10%. The improved control strategy proposed in [13] dynamically adjusts the output voltage of a system by combining reactive power and virtual inductance. Compared with that in the traditional VSG control strategy, the ΔUPCC, as shown in Table 4, is smaller. However, this strategy does not consider the voltage drop of the benchmark virtual inductance. Moreover, it intensifies the voltage drop in the presence of a large load disturbance. The integrated control strategy proposed in the current study compensates for the line impedance voltage drop ΔUline based on the VSG output terminal voltage, and it equivalently realizes control voltage forward shift, avoiding the phenomenon of UPCC drop caused by a change in common load power and the introduction of virtual impedance. When the load power has a large-scale, sudden increase disturbance (e.g., 11.3 kW + j9.9 kVar), the percentage of voltage sag deviation of UPCC with the integrated control strategy is 40% and 18.9% lower than that with the other two control strategies, respectively. It realizes precise droop control between reactive output power and common load terminal voltage UPCC.

5.2. Experimental Verification

To verify further the correctness of the preceding theoretical analysis and simulation results, a two-machine parallel experimental platform is built in a laboratory, as shown in Figure 8. The AINO AN51030-600 DC source is used in the DC side, Danfoss is used in the inverter circuit, and the control signal is outputted by the dSPACE real-time simulation controller. The primary circuit and control parameters of the experimental platform are consistent with those in the simulation control system.
In the first experimental condition, the capacity ratio of the two VSGs is set as 1:1 to compare the differences in power distribution, output voltage, circulation, and other aspects between the traditional VSG control and the integrated control proposed in the current study. In the second experimental condition, the capacity ratio is set as 2:1 to illustrate further the differences between the two strategies and the effectiveness of the integrated control strategy.

5.2.1. Experimental Condition 1

For the two-machine parallel system with a capacity of 1:1, the initial state of operation is a two-machine parallel operation that provides power to the common load (1.5 Kw + j600 Var). Load surge occurs after 3 s, and the common load increases (1.6 kW + j1.2 kVar). It returns to the initial operation state after 2 s. The waveforms of the experimental results using different control strategies are shown in Figure 9, where the circulating current icc of the two VSGs is defined as ioa1ioa2.
In accordance with the analysis of the VSG output active power waveforms in Figure 9a,c, the active power output of the two-machine parallel system with different control strategies is consistent. This finding is identical to the analysis of the simulation results. The VSG control strategy exerts an effect on active power. However, the traditional VSG control strategy cannot achieve reactive power-sharing, as shown in Figure 9a,c, due to the considerable difference in voltage distribution caused by the difference in line impedance. When the improved control strategy is applied, the difference caused by the impedance voltage drop of various lines can be compensated for, realizing the accurate distribution of reactive power. The specific steady-state values of reactive power are provided in Table 5. When the traditional VSG control strategy is adopted, the steady-state output reactive power deviation ΔQerr is 550 Var during the initial state of the system. The reactive power deviation ΔQerr is 1170 Var after the disturbance occurs. However, when the integrated control strategy proposed in the current study is applied, the output reactive power deviation ΔQerr is 5 Var and 30 Var, respectively, and the reactive power-sharing effect is evident compared with that in the traditional VSG control strategy. By comparing the maximum output deviation of the instantaneous power dynamic response of the load disturbance in Figure 9a,c, a conclusion can be drawn that the control effect of the integrated control strategy is considerably better than that of the traditional VSG control strategy in suppressing reactive power dynamic deviation. The introduction of virtual negative impedance control realizes power decoupling control.
The VSG common load terminal A-phase voltage effective value and circulating current waveform are shown in Figure 9b,d. When the traditional VSG control strategy is initially adopted, the effective value of the PCC A-phase voltage UPCCa = 107.5 V. After the occurrence of load surge disturbance, UPCCa = 103.5 V. When the integrated control strategy is adopted, the output side voltage UPCCa = 108.5 V during the initial operating state and UPCCa = 107.5 V after the disturbance. A comparative analysis shows that the integrated control strategy is equivalent to adding the voltage of UPCC to the reactive voltage control loop, ensuring the robustness of UPCC when the load is disturbed and realizing the accurate droop control of the output reactive power and user-side voltage. In accordance with the analysis of the system circulating current waveform in Figure 9b,d, the circulating current of the traditional VSG control strategy caused by the inconsistent line impedance is considerably larger than the integrated improved control strategy, and its maximum value in the dynamic switching process is more than two times that of the steady-state working current, seriously endangering the safe and stable operation of a system. Adopting the integrated control strategy can remarkably reduce the circulating current of a system. This finding is consistent with the conclusion of the simulation analysis.

5.2.2. Experimental Condition 2

The capacity of the two-machine parallel system is set to 2:1, and the operating conditions are consistent with those of the former. The waveform diagrams of the power output results using the two different control strategies are presented in Figure 10. As shown in the figure, the two control strategies can complete the output of active power capacity configuration. However, when the traditional VSG control strategy is adopted, reactive power output does not meet the configuration requirements, and the ratio of output power to capacity is the opposite. This finding is consistent with the simulation results. The specific steady-state values of reactive power are provided in Table 6. When the integrated control strategy is adopted, the reactive power of the system basically meets the set value of 2:1, verifying the effectiveness of the control strategy in parallel with different capacities.

6. Conclusions

The precise droop control strategy of reactive power-voltage for DG parallel operation is studied in this work, and an integrated control strategy that considers line parameters is proposed. A MATLAB/Simulink model and an experimental platform are built to verify the rationality and effectiveness of the integrated control strategy. The specific conclusions are analyzed as follows.
(1)
The integrated control strategy can realize the precise distribution of reactive power when line impedance is not matched. The voltage of the common connection point UPCC is directly controlled by compensating for line impedance voltage drop. The integrated control strategy can realize precise drop control of reactive voltage, optimize public bus voltage, and improve the robustness of a system.
(2)
The relative gain matrix is introduced to quantify and compare the power coupling relationship before and after the improvement. The small-signal model of a two-machine parallel system is established, and the reactive power equipartition error of the integrated control strategy is derived theoretically.
(3)
The proposed control strategy does not require the support of a communication system, and it can respond to load changes quickly and flexibly, providing a theoretical reference for the “plug-and-join” control of DGs.
(4)
The next step is to verify the proposed improved control strategy experimentally under multiple machine operations involving three or more machines.

Author Contributions

Each author contributed extensively to the preparation of this manuscript. H.M. and X.Y. designed and developed the main research work, including designing the controller and simulation model. H.M., J.J. and W.A. have worked on the analysis of the obtained results and writing the original draft. C.W., S.Z. and B.L. provided some useful suggestions in organizing research contents and the construction of a paper. All the authors revised and approved the publication. H.M. wrote the paper. All authors have read and agreed to the published version of the manuscript.

Funding

This paper was supported by general projects of the Beijing Natural Science Foundation (3212037); Natural Science Funding of Hebei Province (E2018502134).

Acknowledgments

The authors gratefully thank the financial supports of the general projects of the Beijing Natural Science Foundation (3212037) and Natural Science Funding of Hebei Province (E2018502134). The authors of the article appreciate the referees for their valuable suggestions, which contributes to improving the paper.

Conflicts of Interest

The authors declare no conflict of interest.

Appendix A

When analyzing the interaction between different VSGs in the two-machine parallel system, the line impedance should be transformed through star-delta. The star equivalent circuit shown in Figure 2 is transformed into the delta equivalent circuit shown in Figure A1.
Figure A1. Schematic diagram of conversion equivalent parallel connection.
Electronics 10 01344 g0a1
After the star-delta equivalent change, the expression of equivalent impedance is as follows:
Z ˙ 12 = Z 1 Z 2 + Z 1 Z 0 + Z 2 Z 0 Z 0 = Z 12 θ 12
Z ˙ 13 = Z 1 Z 2 + Z 1 Z 0 + Z 2 Z 0 Z 2 = Z 13 θ 13
Z ˙ 23 = Z 1 Z 2 + Z 1 Z 0 + Z 2 Z 0 Z 1 = Z 23 θ 23
where, Z12, Z13, and Z23 are the equivalent output impedance amplitudes of conversion, θ12, θ13, and θ23 are equivalent impedance angles. From the above equation, the output power of each branch can be expressed as follows:
S 1 = P 1 + j Q 1 = E 1 2 Z 13 cos θ 13 + j E 1 2 Z 13 sin θ 13 S 2 = P 2 + j Q 2 = E 2 2 Z 23 cos θ 23 + j E 2 2 Z 23 sin θ 23 S 3 = P 3 + j Q 3 = E 1 δ 1 ( E 1 δ 1 E 2 δ 2 Z 12 θ 12 ) *
The single-phase output power of two VSGs is expressed as:
P e 1 = P 1 + P 3 = E 1 2 Z 13 cos θ 13 + E 1 2 Z 12 cos θ 12 E 1 E 2 cos ( δ 2 - δ 1 - θ 12 ) Z 12 P e 2 = P 2 P 3 = E 2 2 Z 23 cos θ 23 E 1 2 Z 12 cos θ 12 + E 1 E 2 cos ( δ 2 - δ 1 - θ 12 ) Z 12
Q e 1 = Q 1 + Q 2 = E 1 2 Z 13 sin θ 13 + E 1 2 Z 12 sin θ 12 + E 1 E 2 sin ( δ 2 - δ 1 - θ 12 ) Z 12 Q e 2 = Q 2 Q 3 = E 2 2 Z 23 sin θ 23 E 1 2 Z 12 sin θ 12 E 1 E 2 sin ( δ 2 - δ 1 - θ 12 ) Z 12

Appendix B

The expression of the first amplification factor matrix K of the two-machine parallel system is as follows:
K 11 = E 1 E 2 sin ( δ 2 δ 1 θ 12 ) Z 12     K 12 = 2 E 1 Z 13 cos θ 13 + 2 E 1 Z 12 cos θ 12 E 2 cos ( δ 2 δ 1 θ 12 ) Z 12 K 13 = E 1 E 2 sin ( δ 2 δ 1 θ 12 ) Z 12     K 14 = E 1 cos ( δ 2 δ 1 θ 12 ) Z 12 K 21 = E 1 E 2 cos ( δ 2 δ 1 θ 12 ) Z 12     K 22 = 2 E 1 Z 13 sin θ 13 + 2 E 1 Z 12 sin θ 12 + E 2 sin ( δ 2 δ 1 θ 12 ) Z 12 K 23 = E 1 E 2 cos ( δ 2 δ 1 θ 12 ) Z 12     K 24 = E 1 sin ( δ 2 δ 1 θ 12 ) Z 12 K 31 = E 1 E 2 sin ( δ 2 δ 1 θ 12 ) Z 12     K 32 = 2 E 1 Z 12 cos θ 12 + E 2 cos ( δ 2 δ 1 θ 12 ) Z 12 K 33 = E 1 E 2 sin ( δ 2 δ 1 θ 12 ) Z 12     K 34 = 2 E 2 Z 23 cos θ 23 + E 1 cos ( δ 2 δ 1 θ 12 ) Z 12 K 41 = E 1 E 2 cos ( δ 2 δ 1 θ 12 ) Z 12     K 42 = 2 E 1 Z 12 sin θ 12 E 2 sin ( δ 2 δ 1 θ 12 ) Z 12 K 43 = E 1 E 2 cos ( δ 2 δ 1 θ 12 ) Z 12     K 44 = 2 E 2 Z 23 sin θ 23 E 1 sin ( δ 2 δ 1 θ 12 ) Z 12
Δ δ 1 Δ E 1 Δ δ 2 Δ E 2 Δ P e 1 Δ Q e 1 Δ P e 2 Δ Q e 2 3711.3 96.6 3711.3 96.1 14890.2 23.9 14890.2 23.9 3711.3 96.1 3711.3 96.9 14890.2 23.9 14890.2 27.9
Δ δ 1 Δ E 1 Δ δ 2 Δ E 2 Δ P e 1 Δ Q e 1 Δ P e 2 Δ Q e 2 8210.8 3.5 8210.8 2.7 417.6 54.9 417.6 53 8210.8 2.7 8210.8 3.3 417.6 53 417.6 55
After introducing the virtual impedance control, the expression of the first amplification factor matrix K’ of the two-machine parallel system is as follows:
Δ δ 1 Δ E 1 Δ δ 2 Δ E 2 Δ P e 1 Δ Q e 1 Δ P e 2 Δ Q e 2 E 1 E 2 Z 12 0 E 1 E 2 Z 12 0 0 ( 2 E 1 Z 13 + E 2 Z 12 ) 0 E 1 Z 12 E 1 E 2 Z 12 0 E 1 E 2 Z 12 0 0 E 2 Z 12 0 ( 2 E 2 Z 23 + E 1 Z 12 )

References

  1. Fang, J.; Deng, H.; Goetz, S.M. Grid Impedance Estimation through Grid-Forming Power Converters. IEEE Trans. Power Electron. 2021, 36, 2094–2104. [Google Scholar] [CrossRef]
  2. Hashmi, K.; Mansoor Khan, M.; Jiang, H.; Umair Shahid, M.; Habib, S.; Talib Faiz, M.; Tang, H. A Virtual Micro-Islanding-Based Control Paradigm for Renewable Microgrids. Electronics 2018, 7, 105. [Google Scholar] [CrossRef] [Green Version]
  3. Lopes, J.A.P.; Moreira, C.L.; Madureira, A.G. Defining control strategies for microgrids islanded operation. IEEE Trans. Power Syst. 2006, 21, 916–924. [Google Scholar] [CrossRef] [Green Version]
  4. Fang, J.; Li, H.; Tang, Y.; Blaabjerg, F. Distributed Power System Virtual Inertia Implemented by Grid-Connected Power Converters. IEEE Trans. Power Electron. 2017, 33, 8488–8499. [Google Scholar] [CrossRef] [Green Version]
  5. Zhong, Q.; Weiss, G. Synchronverters: Inverters That Mimic Synchronous Generators. IEEE Trans. Ind. Electron. 2011, 58, 1259–1267. [Google Scholar] [CrossRef]
  6. Zhong, Q.C. Power-electronics-enabled autonomous power systems: Architecture and technical routes. IEEE Trans. Ind. Electron. 2017, 64, 5907–5918. [Google Scholar] [CrossRef]
  7. Rasool, A.; Yan, X.; Rasool, H.; Guo, H.; Asif, M. VSG Stability and Coordination Enhancement under Emergency Condition. Electronics 2018, 7, 202. [Google Scholar] [CrossRef] [Green Version]
  8. Yan, X.; Rasool, A.; Abbas, F.; Rasool, H.; Guo, H. Analysis and Optimization of the Coordinated Multi-VSG Sources. Electronics 2019, 8, 28. [Google Scholar] [CrossRef] [Green Version]
  9. Sands, T. Control of DC Motors to Guide Unmanned Underwater Vehicles. Appl. Sci. 2021, 11, 2144. [Google Scholar] [CrossRef]
  10. Wu, X.; Shen, C.; Iravani, R. Feasible Range and Optimal Value of the Virtual Impedance for Droop-Based Control of Microgrids. IEEE Trans. Smart Grid. 2017, 8, 1242–1251. [Google Scholar] [CrossRef]
  11. Zhang, H.; Kim, S.; Sun, Q.; Zhou, J. Distributed Adaptive Virtual Impedance Control for Accurate Reactive Power Sharing Based on Consensus Control in Microgrids. IEEE Trans. Smart Grid. 2017, 8, 1749–1761. [Google Scholar] [CrossRef]
  12. Yao, W.; Chen, M.; Matas, J.; Guerrero, J.M.; Qian, Z. Design and Analysis of the Droop Control Method for Parallel Inverters Considering the Impact of the Complex Impedance on the Power Sharing. IEEE Trans. Ind. Electron. 2011, 58, 576–588. [Google Scholar] [CrossRef]
  13. Bai, X.; Miao, H.; Zeng, C. Improved Droop Control Strategy for Reactive Power Sharing of Parallel Inverters in Low-Voltage Microgrid. In Proceedings of the 2019 IEEE Innovative Smart Grid Technologies-Asia (ISGT Asia), Chengdu, China, 21–24 May 2019; pp. 2538–2543. [Google Scholar]
  14. Li, Q.; Chen, F.; Chen, M.; Guerrero, J.M.; Abbott, D. Agent-Based Decentralized Control Method for Islanded Microgrids. IEEE Trans. Smart Grid. 2016, 7, 637–649. [Google Scholar] [CrossRef] [Green Version]
  15. He, J.; Li, Y.W.; Blaabjerg, F. An Enhanced Islanding Microgrid Reactive Power, Imbalance Power, and Harmonic Power Sharing Scheme. IEEE Trans. Power Electron. 2015, 30, 3389–3401. [Google Scholar] [CrossRef]
  16. Mahmood, H.; Michaelson, D.; Jiang, J. Accurate Reactive Power Sharing in an Islanded Microgrid Using Adaptive Virtual Impedances. IEEE Trans. Power Electron. 2015, 30, 1605–1617. [Google Scholar] [CrossRef]
  17. Zhu, Y.; Zhuo, F.; Wang, F.; Liu, B.; Zhao, Y. A Wireless Load Sharing Strategy for Islanded Microgrid Based on Feeder Current Sensing. IEEE Trans. Power Electron. 2015, 30, 6706–6719. [Google Scholar] [CrossRef]
  18. Liu, J.; Miura, Y.; Bevrani, H.; Ise, T. Enhanced Virtual Synchronous Generator Control for Parallel Inverters in Microgrids. IEEE Trans. Smart Grid 2017, 8, 2268–2277. [Google Scholar] [CrossRef]
  19. Milczarek, A.; Malinowski, M.; Guerrero, J.M. Reactive Power Management in Islanded Microgrid—Proportional Power Sharing in Hierarchical Droop Control. IEEE Trans. Smart Grid 2015, 6, 1631–1638. [Google Scholar] [CrossRef] [Green Version]
  20. Yang, S.; Fang, J.; Tang, Y.; Qiu, H.; Dong, C.; Wang, P. Modular Multilevel Converter Synthetic Inertia-Based Frequency Support for Medium-Voltage Microgrids. IEEE Trans. Ind. Electron. 2019, 66, 8992–9002. [Google Scholar] [CrossRef]
  21. Yan, X.; Cui, Y.; Cui, S. Control Method of Parallel Inverters with Self-Synchronizing Characteristics in Distributed Microgrid. Energies 2019, 12, 3871. [Google Scholar] [CrossRef] [Green Version]
  22. Xu, H.; Zhang, X.; Liu, F.; Shi, R.; Yu, C.; Cao, R. A Reactive Power Sharing Strategy of VSG Based on Virtual Capacitor Algorithm. IEEE Trans. Ind. Electron. 2017, 64, 7520–7531. [Google Scholar] [CrossRef]
  23. Chen, J.; Yue, D.; Dou, C.; Chen, L.; Weng, S.; Li, Y. A Virtual Complex Impedance Based P-V Droop Method for Parallel-Connected Inverters in Low-Voltage AC Microgrids. IEEE Trans. Ind. Informat. 2021, 17, 1763–1773. [Google Scholar]
  24. Wu, T.; Liu, Z.; Liu, J.; Wang, S.; You, Z. A Unified Virtual Power Decoupling Method for Droop-Controlled Parallel Inverters in Microgrids. IEEE Trans. Power Electron. 2016, 31, 5587–5603. [Google Scholar] [CrossRef]
  25. Rocabert, J.; Luna, A.; Blaabjerg, F.; Rodríguez, P. Control of Power Converters in AC Microgrids. IEEE Trans. Power Electron. 2012, 27, 4734–4749. [Google Scholar] [CrossRef]
  26. Zhang, B.; Yan, X.; Li, D.; Zhang, X.; Han, J.; Xiao, X. Stable Operation and Small-Signal Analysis of Multiple Parallel DG Inverters Based on a Virtual Synchronous Generator Scheme. Energies 2018, 11, 203. [Google Scholar] [CrossRef] [Green Version]
  27. Yan, X.; Zhang, X.; Li, J.; Han, J. Inverter coupling evaluation and decoupling method based on dynamic relative gain. In Proceedings of the 2017 IEEE Transportation Electrification Conference and Expo, Asia-Pacific (ITEC Asia-Pacific), Harbin, China, 7–10 August 2017; pp. 1–6. [Google Scholar]
  28. Gupta, Y.; Chatterjee, K.; Doolla, S. A Simple Control Scheme for Improving Reactive Power Sharing in Islanded Microgrid. IEEE Trans. Power Syst. 2020, 35, 3158–3169. [Google Scholar] [CrossRef]
  29. Wu, H.; Ruan, X.; Yang, D.; Chen, X.; Zhao, W.; Lv, Z.; Zhong, Q.C. Small-Signal Modeling and Parameters Design for Virtual Synchronous Generators. IEEE Trans. Ind. Electron. 2016, 63, 4292–4303. [Google Scholar] [CrossRef]
Figure 1. Topology and control scheme of the VSG.
Electronics 10 01344 g001
Figure 2. Equivalent circuit diagram of two parallel VSGs.
Electronics 10 01344 g002
Figure 3. Block diagram of the improved reactive voltage control of the VSG.
Electronics 10 01344 g003
Figure 4. Block diagram of the integrated control strategy.
Electronics 10 01344 g004
Figure 5. Block diagram of the small-signal control of the two-machine parallel system.
Electronics 10 01344 g005
Figure 6. Power output waveforms of the VSG under different control strategies. (a) The traditional VSG control strategy outputs active power. (b) The traditional VSG control strategy outputs reactive power. (c) The improved control strategy outputs active power. (d) The improved control strategy outputs reactive power. (e) The integrated control strategy presented in the current study outputs active power. (f) The integrated control strategy presented in the current study outputs reactive power.
Electronics 10 01344 g006
Figure 7. RMS of UPCC with different control strategies.
Electronics 10 01344 g007
Figure 8. Experimental platform for the parallel operation of two machines.
Electronics 10 01344 g008
Figure 9. Waveforms of the experimental results using different control strategies in experimental condition 1. (a) The traditional VSG control strategy outputs power waveform. (b) The traditional VSG control strategy outputs the voltage effective value of UPCCa and circulation waveform. (c) The integrated control strategy presented in this study outputs power waveform. (d) The integrated control strategy presented in this study outputs the voltage effective value of UPCCa and circulation waveform.
Electronics 10 01344 g009
Figure 10. Waveforms of experimental results using different control strategies in experimental condition 2. (a) The traditional VSG control strategy outputs power waveform. (b) The integrated control strategy presented in this study outputs power waveform.
Electronics 10 01344 g010
Table 1. System parameters.
ParameterValueParameterValue
DC-side voltage, Udc/V400Switching frequency, fpwm/kHz5
Filter inductance, L/mH4Rated frequency, fs/Hz50
Filter capacitor, C/uF10Common load impedance, Z025 + j70
Line impedance, Zline11.5 + j0.157Line impedance, Zline20.015 + j0.22
Virtual impedance, Zv1−1.35 + j1.257Virtual impedance, Zv2−0.01 + j1.257
Table 2. Simulation control system parameters.
ParameterValue
VSG1VSG2VSG3
Virtual moment of inertia, J/(kg⋅m2)0.40.20.2
Equivalent moment of inertia, K151515
Active droop coefficient, Dp5.062.532.53
Reactive droop coefficient, Dq350175175
Table 3. Steady-state values of reactive power with different control strategies.
Control StrategyTimeQei/VarQei/(∑QeN)/%Qe1:Qe2:Qe3
VSG1VSG2VSG3VSG1VSG2VSG3
Traditional VSG control0 ≤ t < 3 s
8 s ≤ t < 10 s
892.61445144521.238381:1.62:1.62
3 s ≤ t < 5.5 s18632423242326.634.634.61:1.3:1.3
5.5 s ≤ t <8 s27363264326427.633331:1.19:1.19
10 s ≤ t < 13 s1521203704053.601:1.34
Improved control in [13]0 ≤ t < 3 s
8 s ≤ t < 10 s
184392192148.524.224.22:1:1
3 s ≤ t < 5.5 s34761738173849.6524.824.82:1:1
5.5 s ≤ t < 8 s48662433243349.724.824.82:1:1
10 s ≤ t < 13 s24351218064.132.102:1
Integrated control0 ≤ t < 3 s
8 s ≤ t < 10 s
193692892850.924.424.42:1:1
3 s ≤ t < 5.5 s3501175017505025252:1:1
5.5 s ≤ t < 8 s49262463246349.824.924.92:1:1
10 s ≤ t < 13 s25421271066.933.402:1
Table 4. Steady-state RMS of UPCC with different control strategies.
Control Strategy0 ≤ t < 3 s or 8 s ≤ t < 10 s3 s ≤ t < 5.5 s5.5 s ≤ t < 8 s10 s ≤ t < 13 s
UPCC/VΔUPCC/%UPCC/VΔUPCC/%UPCC/VΔUPCC/%UPCC/VΔUPCC/%
Traditional VSG control105.40−4.18100.90−8.2797.02−11.8102.50−6.81
Improved control in [13]107.50−2.27103.80−5.64100.50−8.63106.00−3.64
Integrated control108.50−1.36105.20−4.36102.30−7.00107.30−2.45
Table 5. Steady-state values of reactive power with the same capacity.
Control StrategyReactive Power at Initial Steady-StateReactive Power at Steady-State Perturbation
Q1/VarQ2/VarQ1/VarQ2/Var
Traditional VSG control305802501420
Integrated control320315920890
Table 6. Steady-state values of reactive power with different capacities.
Control StrategyReactive Power at Initial Steady-StateReactive Power at Steady-State Perturbation
Q1/VarQ2/VarQ1/VarQ2/Var
Traditional VSG control−1307401601490
Integrated control4302101150550
Publisher’s Note: MDPI stays neutral with regard to jurisdictional claims in published maps and institutional affiliations.

