
Technology Acceptance of an Interactive Augmented Reality App on Resistive Circuits for Engineering Students


Abstract
1. Introduction
2. Theoretical Background and Hypotheses
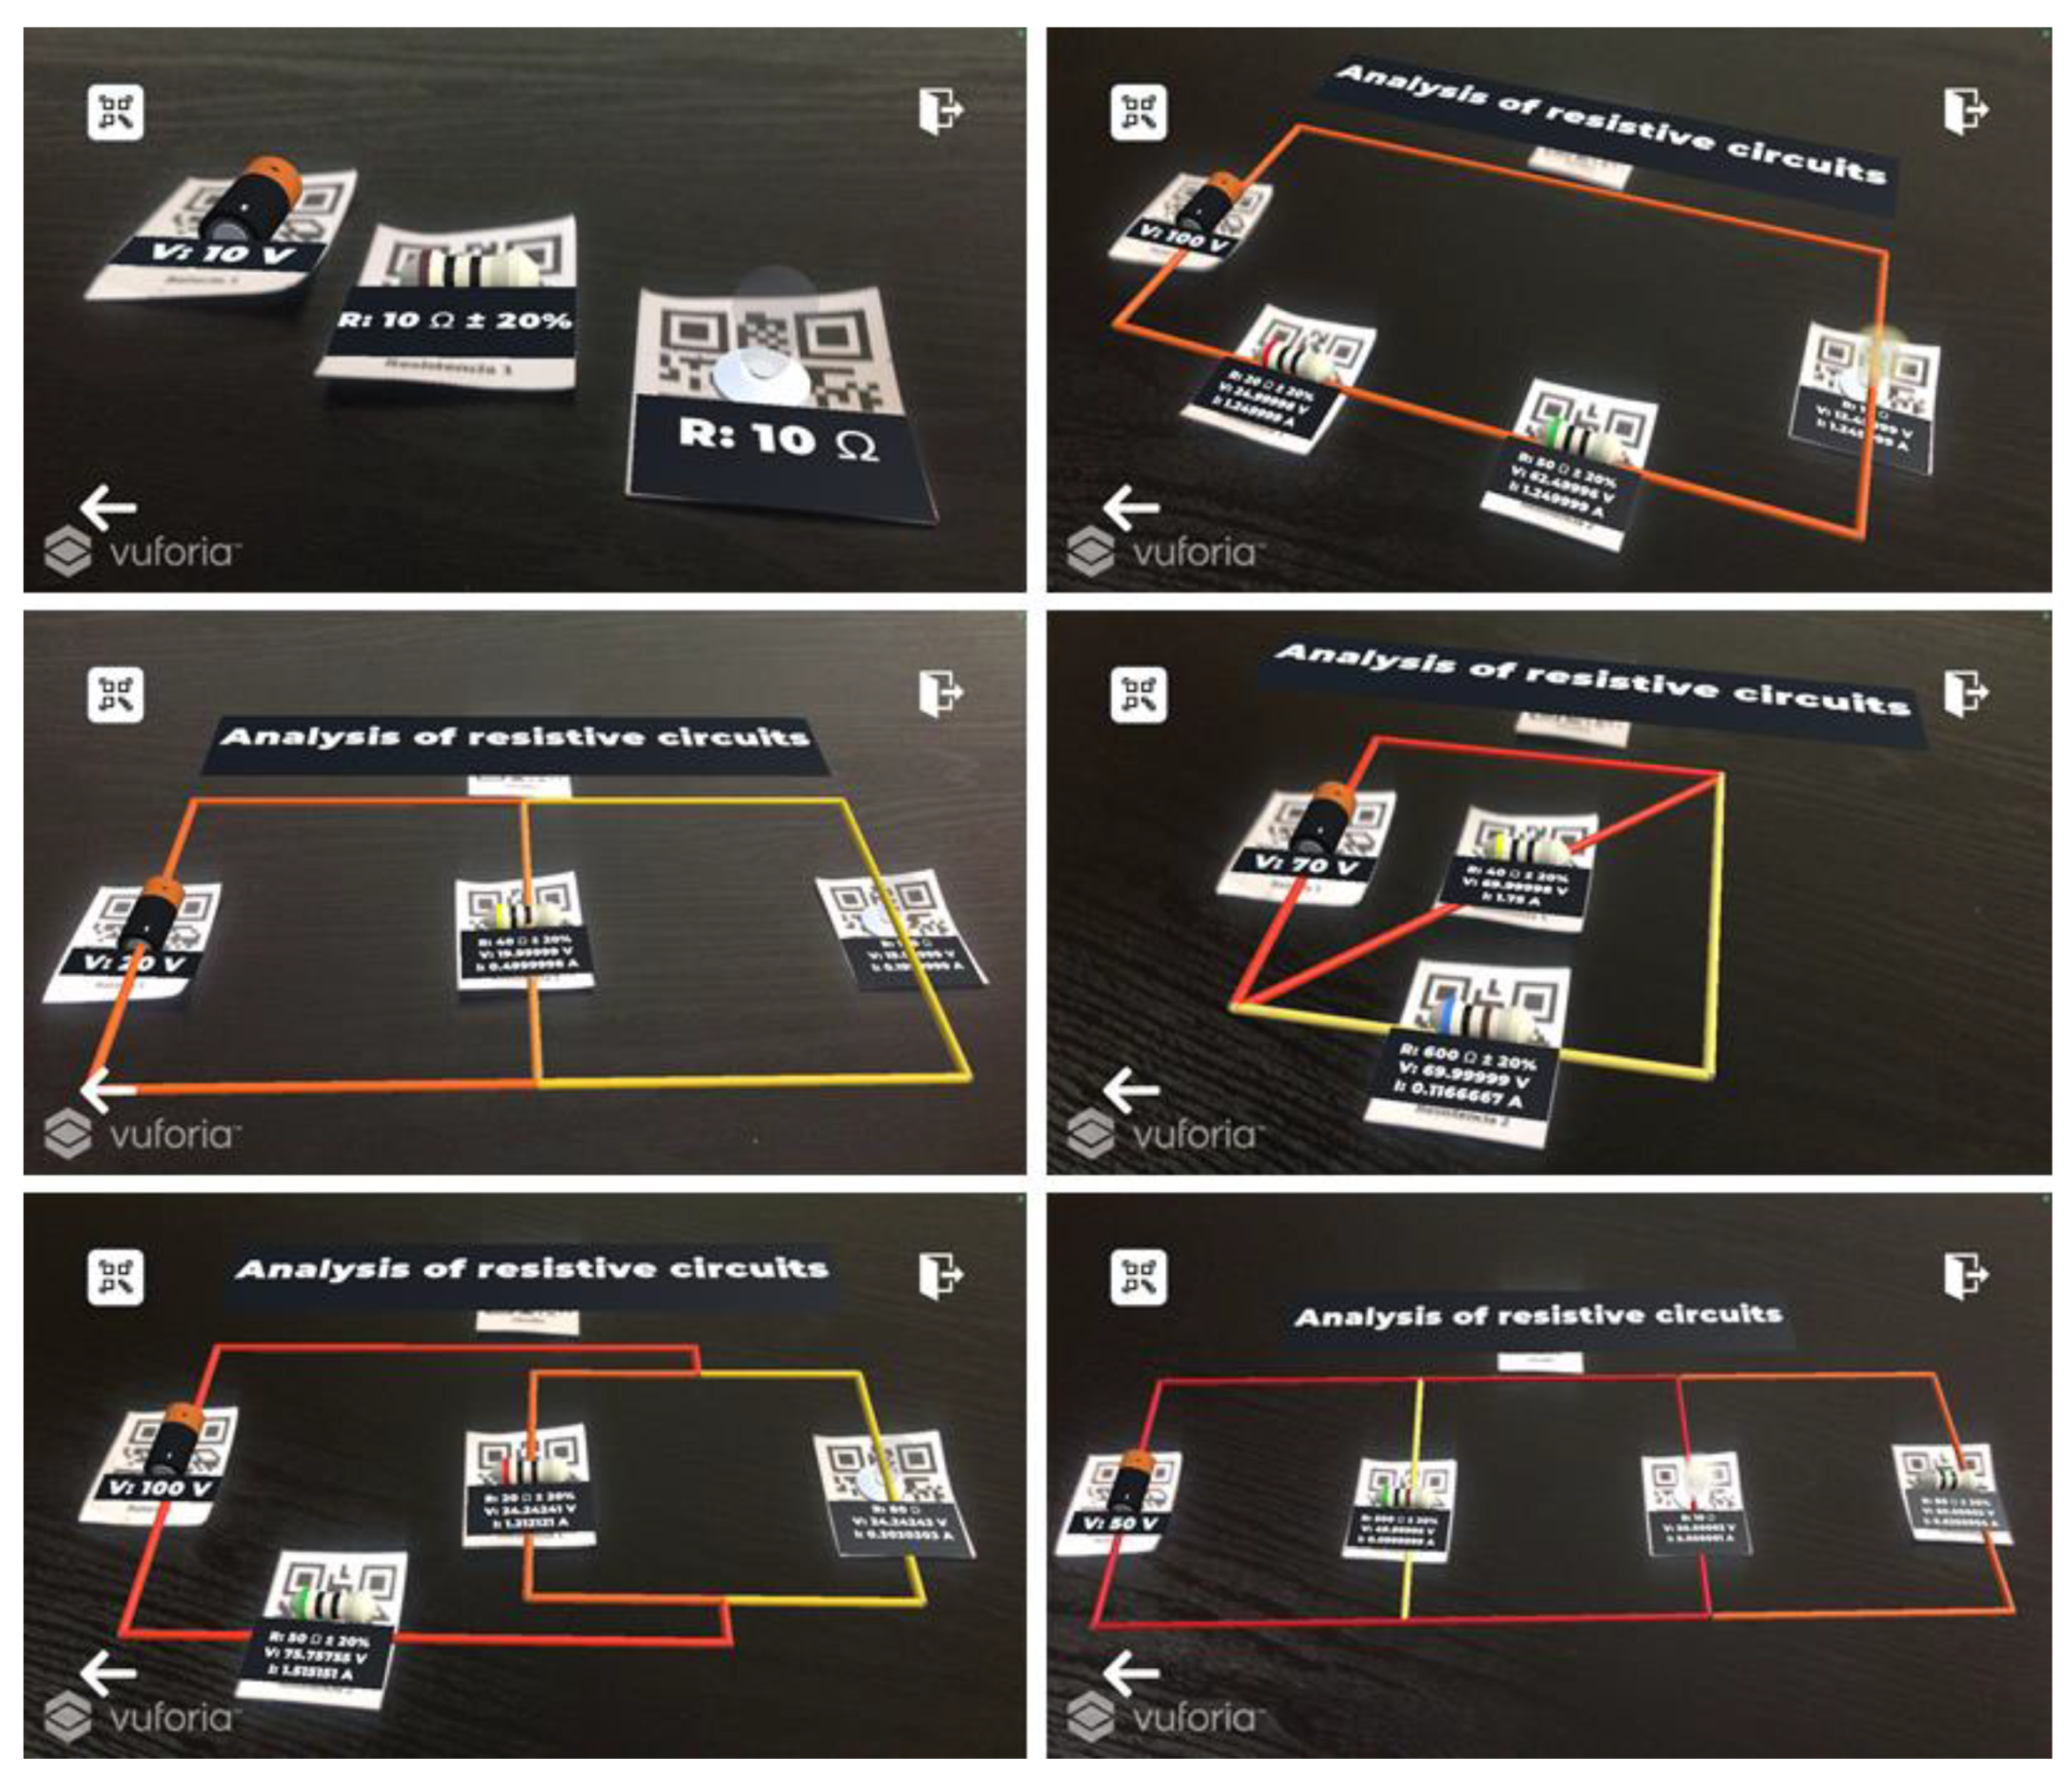
3. Interactive AR App
4. Methodology
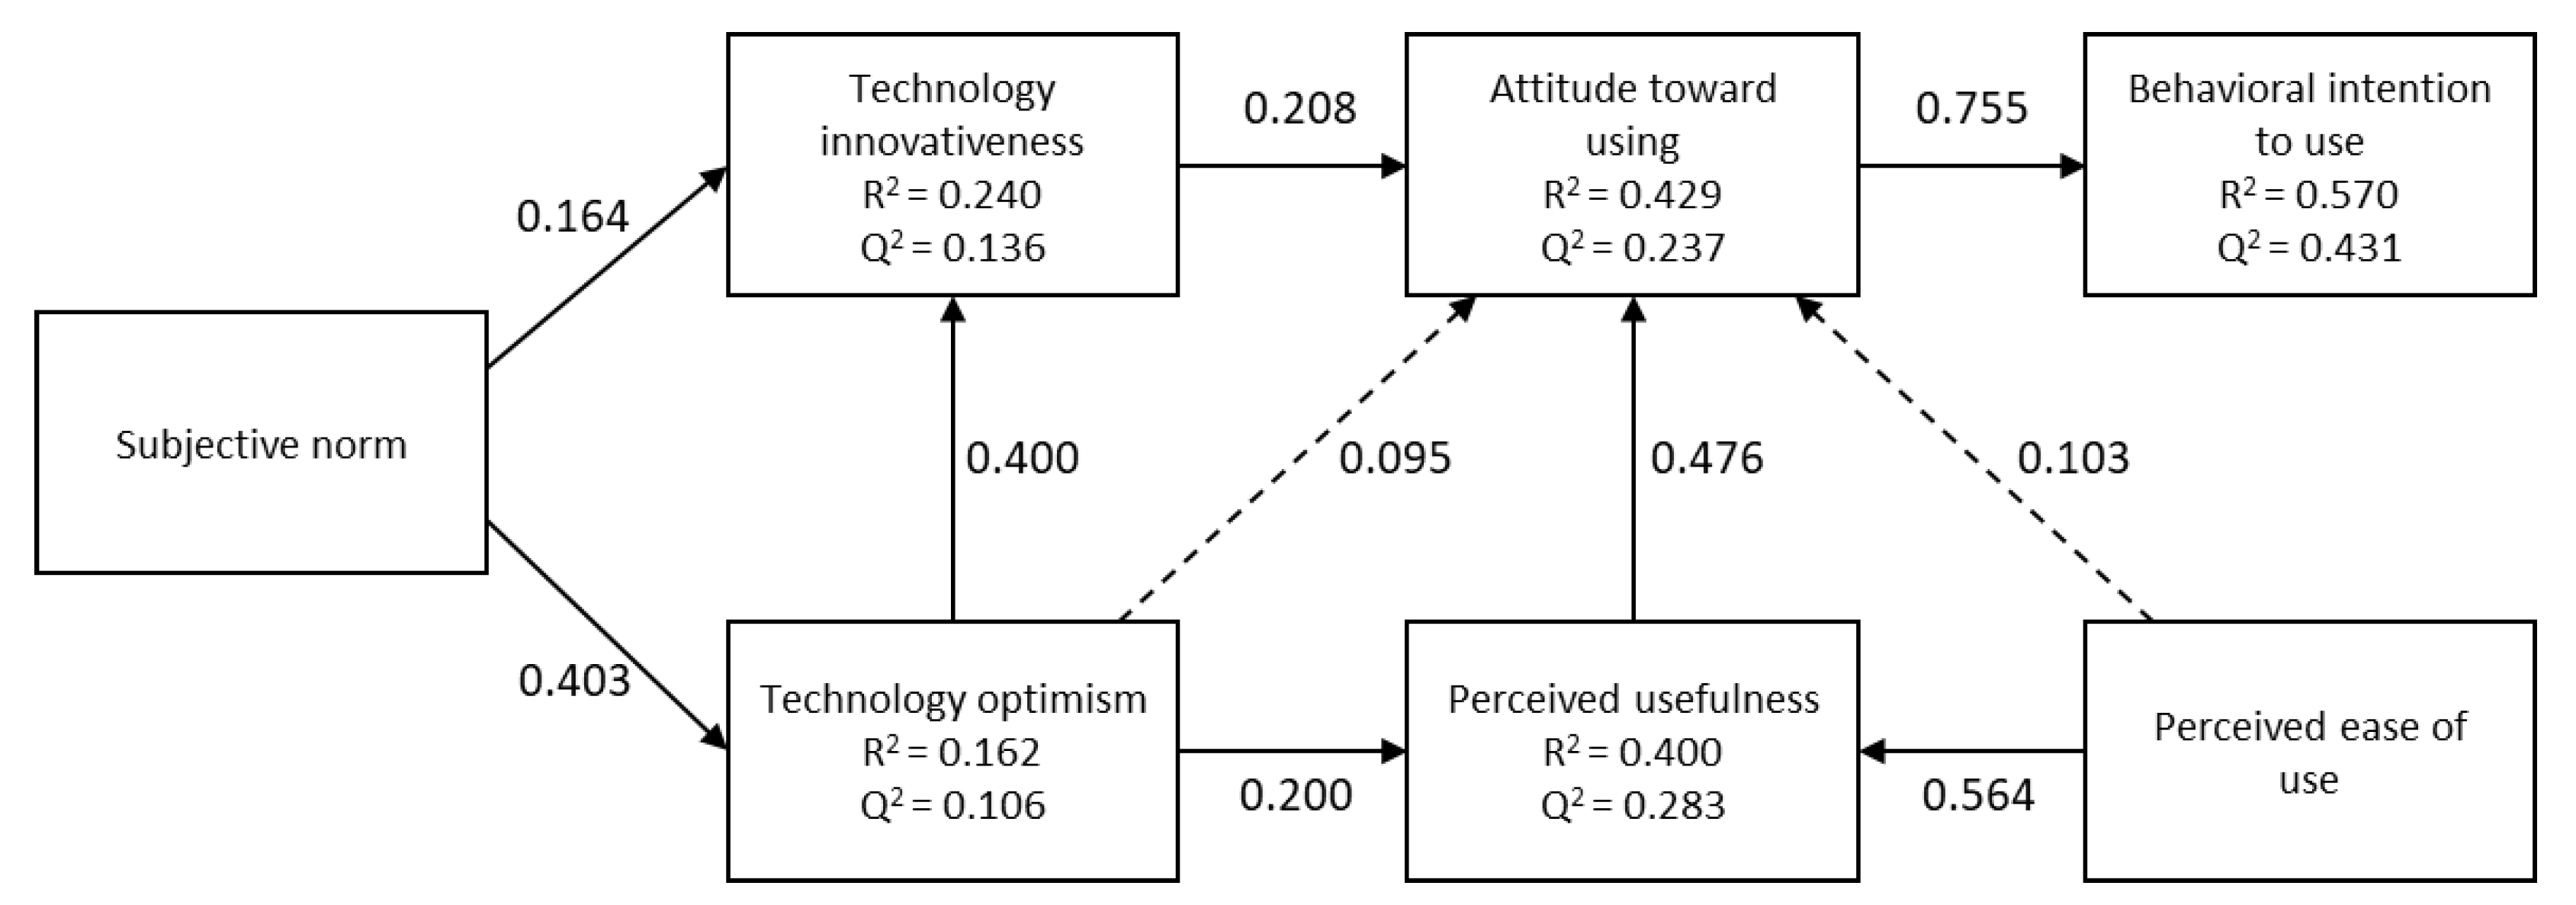
5. Results
6. Discussion
6.1. Theoretical Contributions
6.2. Practical Implications
7. Conclusions
Author Contributions
Funding
Data Availability Statement
Acknowledgments
Conflicts of Interest
References
- Pathomaree, N.; Charoenseang, S. Augmented reality for skill transfer in assembly task. In Proceedings of the IEEE International Workshop on Robot and Human Interactive Communication, Nashville, TN, USA, 13–15 August 2005; pp. 500–504. [Google Scholar] [CrossRef]
- Martín Gutiérrez, J.; Meneses Fernández, M. Applying augmented reality in engineering education to improve academic performance & student motivation. Int. J. Eng. Educ. 2014, 30, 625–635. [Google Scholar]
- Dey, A.; Billinghurst, M.; Lindeman, R.; Swan, J. A systematic review of 10 years of augmented reality usability studies: 2005 to 2014. Front. Robot. AI 2018, 5, 37. [Google Scholar] [CrossRef] [PubMed]
- Chatzopoulos, D.; Bermejo, C.; Huang, Z.; Hui, P. Mobile augmented reality survey: From where we are to where we go. IEEE Access 2017, 5, 6917–6950. [Google Scholar] [CrossRef]
- Akçayır, M.; Akçayır, G. Advantages and challenges associated with augmented reality for education: A systematic review of the literature. Educ. Res. Rev. 2017, 20, 1–11. [Google Scholar] [CrossRef]
- Alvarado, L.; Domínguez, E.; Velázquez, Y.; Isidro, S.; Toledo, C. Layered software architecture for the development of mobile learning objects with augmented reality. IEEE Access 2018, 6, 57897–57909. [Google Scholar] [CrossRef]
- Lin, P.; Chen, S. Design and evaluation of a deep learning recommendation based augmented reality system for teaching programming and computational thinking. IEEE Access 2020, 8, 45689–45699. [Google Scholar] [CrossRef]
- Žagar, M.; Frid, N.; Knezović, J.; Hofman, D.; Kovač, M.; Sruk, V.; Mlinarić, H. Work in progress: Embedded computer engineering learning platform capabilities. In Proceedings of the IEEE Global Engineering Education Conference (EDUCON), Tallinn, Estonia, 18–20 March 2015; pp. 751–753. [Google Scholar] [CrossRef]
- Haramaki, T.; Nishino, H. An engineering education support system using projection-based AR. In Proceedings of the 19th International Conference on Network-Based Information Systems (NBiS), Ostrava, Czech Republic, 7–9 September 2016; pp. 267–272. [Google Scholar] [CrossRef]
- Matcha, W.; Rambli, D. User preference in collaborative science learning through the use of Augmented Reality. In Proceedings of the 4th International Congress on Engineering Education, Porto, Portugal, 16–18 April 2012; pp. 64–68. [Google Scholar] [CrossRef]
- Restivo, M.; Rodrigues, J.; Chouzal, M. Let’s work with AR in DC circuits. In Proceedings of the International Conference on Interactive Collaborative Learning (ICL), Dubai, United Arab Emirates, 3–6 December 2014; pp. 884–885. [Google Scholar] [CrossRef]
- Akçayir, M.; Akçayir, G.; Pektaş, H.; Ocak, M. Augmented reality in science laboratories: The effects of augmented reality on university students’ laboratory skills and attitudes toward science laboratories. Comput. Hum. Behav. 2016, 57, 334–342. [Google Scholar] [CrossRef]
- Fraga-Lamas, P.; Fernández-Caramés, T.; Blanco-Novoa, Ó.; Vilar-Montesinos, M. A review on industrial augmented reality systems for the industry 4.0 Shipyard. IEEE Access 2018, 6, 13358–13375. [Google Scholar] [CrossRef]
- Hořejší, P.; Novikov, K.; Šimon, M. A Smart Factory in a Smart City: Virtual and augmented reality in a smart assembly line. IEEE Access 2020, 8, 94330–94340. [Google Scholar] [CrossRef]
- Rodrigues, J.; Ramos, C.; Pereira, J.; Sardo, J.; Cardoso, P. Mobile five senses augmented reality system: Technology acceptance study. IEEE Access 2019, 7, 163022–163033. [Google Scholar] [CrossRef]
- Davis, F.; Bagozzi, R.; Warshaw, P. User acceptance of computer technology: A comparison of two theoretical models. Manag. Sci. 1989, 35, 982–1003. [Google Scholar] [CrossRef]
- Davis, F. A Technology Acceptance Model for Empirically Testing New End-User Information Systems: Theory and Results; Massachussetts Institute of Technology: Cambridge, MA, USA, 1986. [Google Scholar]
- Fishbein, M.; Ajzen, I. Belief, Attitude, Intention and Behavior: An Introduction to Theory and Research; Addison-Wesley: Boston, MA, USA, 1975; ISBN 0201020890. [Google Scholar]
- Vishwakarma, P.; Mukherjee, S.; Datta, B. Travelers’ intention to adopt virtual reality: A consumer value perspective. J. Destin. Mark. Manag. 2020, 17, 100456. [Google Scholar] [CrossRef]
- Kim, H.-W.; Chan, H.; Gupta, S. Value-based adoption of mobile internet: An empirical investigation. Decis. Support Syst. 2007, 43, 111–126. [Google Scholar] [CrossRef]
- Al-Emran, M.; Al-Maroof, R.; Al-Sharafi, M.; Arpaci, I. What impacts learning with wearables? An integrated theoretical model. Interact. Learn. Environ. 2020, 1–21. [Google Scholar] [CrossRef]
- Al-Maroof, R.; Alfaisal, A.; Salloum, S. Google glass adoption in the educational environment: A case study in the Gulf area. Educ. Inf. Technol. 2020, 26, 2447–2500. [Google Scholar] [CrossRef]
- Cabero-Almenara, J.; Barroso-Osuna, J.; Llorente-Cejudo, C.; Fernández Martínez, M. Educational uses of augmented reality (ar): Experiences in educational science. Sustainability 2019, 11, 4990. [Google Scholar] [CrossRef]
- Ibili, E.; Resnyansky, D.; Billinghurst, M. Applying the technology acceptance model to understand maths teachers’ perceptions towards an augmented reality tutoring system. Educ. Inf. Technol. 2019, 24, 2653–2675. [Google Scholar] [CrossRef]
- Pittalis, M. Extending the technology acceptance model to evaluate teachers’ intention to use dynamic geometry software in geometry teaching. Int. J. Math. Educ. Sci. Technol. 2020, 1–20. [Google Scholar] [CrossRef]
- Al-Adwan, A. Investigating the drivers and barriers to MOOCs adoption: The perspective of TAM. Educ. Inf. Technol. 2020, 25, 5771–5795. [Google Scholar] [CrossRef]
- Virani, S.; Saini, J.; Sharma, S. Adoption of massive open online courses (MOOCs) for blended learning: The Indian educators’ perspective. Interact. Learn. Environ. 2020, 1–17. [Google Scholar] [CrossRef]
- Al-Rahmi, W.; Alzahrani, A.; Yahaya, N.; Alalwan, N.; Kamin, Y. Digital communication: Information and communication technology (ict) usage for education sustainability. Sustainability 2020, 12, 5052. [Google Scholar] [CrossRef]
- Hanif, A.; Jamal, F.; Imran, M. Extending the technology acceptance model for use of e-learning systems by digital learners. IEEE Access 2018, 6, 73395–73404. [Google Scholar] [CrossRef]
- Kuliya, M.; Usman, S. Perceptions of E-learning among undergraduates and academic staff of higher educational institutions in north-eastern Nigeria. Educ. Inf. Technol. 2021, 26, 1787–1811. [Google Scholar] [CrossRef]
- Pratama, A. Fun first, useful later: Mobile learning acceptance among secondary school students in Indonesia. Educ. Inf. Technol. 2021, 26, 1737–1753. [Google Scholar] [CrossRef]
- Qashou, A. Influencing factors in M-learning adoption in higher education. Educ. Inf. Technol. 2021, 26, 1755–1785. [Google Scholar] [CrossRef]
- Shodipe, T.; Ohanu, I. Electrical/electronics technology education teachers attitude, engagement, and disposition towards actual usage of Mobile learning in higher institutions. Educ. Inf. Technol. 2021, 26, 1023–1042. [Google Scholar] [CrossRef]
- Racero, F.; Bueno, S.; Gallego, M. Predicting students’ behavioral intention to use open source software: A combined view of the technology acceptance model and self-determination theory. Appl. Sci. 2020, 10, 2711. [Google Scholar] [CrossRef]
- Ibáñez, M.; Serio, Á.; Villarán, D.; Delgado-Kloos, C. The acceptance of learning augmented reality environments: A case study. In Proceedings of the IEEE 16th International Conference on Advanced Learning Technologies (ICALT), Austin, TX, USA, 25–28 July 2016; pp. 307–311. [Google Scholar] [CrossRef]
- Camilleri, A.; Camilleri, M. The students’ intrinsic and extrinsic motivations to engage with digital learning games. In Proceedings of the ACM International Conference Proceeding Series; Association for Computing Machinery: New York, NY, USA, 2019; pp. 44–48. [Google Scholar] [CrossRef]
- Parasuraman, A. Technology Readiness Index (Tri): A Multiple-Item scale to measure readiness to embrace new technologies. J. Serv. Res. 2000, 2, 307–320. [Google Scholar] [CrossRef]
- Liljander, V.; Gillberg, F.; Gummerus, J.; van Riel, A. Technology readiness and the evaluation and adoption of self-service technologies. J. Retail. Consum. Serv. 2006, 13, 177–191. [Google Scholar] [CrossRef]
- Mishra, A.; Maheswarappa, S.; Colby, C. Technology readiness of teenagers: A consumer socialization perspective. J. Serv. Mark. 2018, 32, 592–604. [Google Scholar] [CrossRef]
- Pedro, L.; Barbosa, C.; Santos, C. A critical review of mobile learning integration in formal educational contexts. Int. J. Educ. Technol. High. Educ. 2018, 15, 10. [Google Scholar] [CrossRef]
- Ajzen, I. The theory of planned behavior. Organ. Behav. Hum. Decis. Process. 1991, 50, 179–211. [Google Scholar] [CrossRef]
- Taneja, A. Assessing the Impact of Concern for Privacy and Innovation Characteristics in the Adoption of Biometric Technologies. In Proceedings of the Annual Conference of Decision Sciences Institute. 2006. Available online: http://www.swdsi.org/swdsi06/proceedings06/Papers/HCT03.pdf (accessed on 2 October 2020).
- Wu, I.-L.; Chen, J.-L. An extension of Trust and TAM model with TPB in the initial adoption of on-line tax: An empirical study. Int. J. Hum. Comput. Stud. 2005, 62, 784–808. [Google Scholar] [CrossRef]
- Ngafeeson, M.; Sun, J. E-book acceptance among undergraduate students: A look at the moderating role of technology innovativeness. Int. J. Web Based Learn. Teach. Technol. 2015, 10, 36–51. [Google Scholar] [CrossRef]
- Parasuraman, A.; Colby, C. Techno-Ready Marketing: How and Why Your Customers Adopt Technology; Free Press: New York, NY, USA, 2001; ISBN 1416576630. [Google Scholar]
- Karahanna, E.; Straub, D.; Chervany, N. Information technology adoption across time: A cross-sectional comparison of pre-adoption and post-adoption beliefs. MIS Q. 1999, 23, 183–213. [Google Scholar] [CrossRef]
- Chung, N.; Han, H.; Joun, Y. Tourists’ intention to visit a destination: The role of augmented reality (AR) application for a heritage site. Comput. Hum. Behav. 2015, 50, 588–599. [Google Scholar] [CrossRef]
- Wojciechowski, R.; Cellary, W. Evaluation of learners’ attitude toward learning in ARIES augmented reality environments. Comput. Educ. 2013, 68, 570–585. [Google Scholar] [CrossRef]
- Balog, A.; Pribeanu, C. Developing a measurement scale for the evaluation of AR-based educational systems. Stud. Inform. Control 2009, 18, 1220–1766. [Google Scholar]
- Davis, F. User acceptance of information technology: System characteristics, user perceptions and behavioral impacts. Int. J. Man Mach. Stud. 1993, 38, 475–487. [Google Scholar] [CrossRef]
- Pantano, E.; Rese, A.; Baier, D. Enhancing the online decision-making process by using augmented reality: A two country comparison of youth markets. J. Retail. Consum. Serv. 2017, 38, 81–95. [Google Scholar] [CrossRef]
- Aqel, M. The effect of different interaction levels on instructional design learners. Procedia Soc. Behav. Sci. 2013, 103, 1035–1043. [Google Scholar] [CrossRef]
- Floyd, T. Principles of Electric Circuits; Pearson Education, Inc.: New York, NY, USA, 2007; ISBN 013507309X. [Google Scholar]
- Ringle, C.; Wende, S.; Becker, J. SmartPLS 3; SmartPLS: Bönningstedt, Germany, 2015. [Google Scholar]
- Williams, L.; Vandenberg, R.; Edwards, J. 12 structural equation modeling in management research: A guide for improved analysis. Acad. Manag. Ann. 2009, 3, 543–604. [Google Scholar] [CrossRef]
- Sarstedt, M.; Hair, J.; Ringle, C.; Thiele, K.; Gudergan, S. Estimation issues with PLS and CBSEM: Where the bias lies! J. Bus. Res. 2016, 69, 3998–4010. [Google Scholar] [CrossRef]
- Barclay, D.; Higgins, C.; Thompson, R. The Partial Least Squares (PLS) Approach to Causal Modeling: Personal computer adoption and use as an illustration. Technol. Stud. 1995, 2, 285–309. [Google Scholar]
- Henseler, J.; Hubona, G.; Ray, P. Using PLS path modeling in new technology research: Updated guidelines. Ind. Manag. Data Syst. 2016, 116, 2–20. [Google Scholar] [CrossRef]
- Müller, T.; Schuberth, F.; Henseler, J. PLS path modeling—A confirmatory approach to study tourism technology and tourist behavior. J. Hosp. Tour. Technol. 2018, 9, 249–266. [Google Scholar] [CrossRef]
- Cepeda-Carrion, G.; Cegarra-Navarro, J.; Cillo, V. Tips to use partial least squares structural equation modelling (PLS-SEM) in knowledge management. J. Knowl. Manag. 2019, 23, 67–89. [Google Scholar] [CrossRef]
- Teo, T.; Lee, C.; Chai, C. Understanding pre-service teachers’ computer attitudes: Applying and extending the technology acceptance model. J. Comput. Assist. Learn. 2008, 24, 128–143. [Google Scholar] [CrossRef]
- Chang, C.-T.; Hajiyev, J.; Su, C.-R. Examining the students’ behavioral intention to use e-learning in Azerbaijan? The General Extended Technology Acceptance Model for E-learning approach. Comput. Educ. 2017, 111, 128–143. [Google Scholar] [CrossRef]
- Balog, A.; Pribeanu, C. The role of perceived enjoyment in the students’ acceptance of an augmented reality teaching platform: A structural equation modelling approach. Stud. Inform. Control 2010, 19, 319–330. [Google Scholar] [CrossRef]
- Lee, I.-J.; Chen, C.-H.; Su, C.-Y. App based souvenirs and entry tickets: A new means of enhancing post visit memories: A case study from Taiwan. Tour. Manag. Perspect. 2017, 24, 177–185. [Google Scholar] [CrossRef]
- Rese, A.; Baier, D.; Geyer-Schulz, A.; Schreiber, S. How augmented reality apps are accepted by consumers: A comparative analysis using scales and opinions. Technol. Forecast. Soc. Chang. 2017, 124, 306–319. [Google Scholar] [CrossRef]
- Jung, T.; Lee, H.; Chung, N.; Tom Dieck, M. Cross-cultural differences in adopting mobile augmented reality at cultural heritage tourism sites. Int. J. Contemp. Hosp. Manag. 2018, 30, 1621–1645. [Google Scholar] [CrossRef]
- Voinea, G.; Postelnicu, C.; Duguleana, M.; Mogan, G.; Socianu, R. Driving performance and technology acceptance evaluation in real traffic of a smartphone-based driver assistance system. Int. J. Environ. Res. Public Health 2020, 17, 7098. [Google Scholar] [CrossRef] [PubMed]
- Miranda Bojórquez, E.; Vergara Villegas, O.; Cruz Sánchez, V.; García-Alcaraz, J.; Favela Vara, J. Study on mobile augmented reality adoption for mayo language learning. Mob. Inf. Syst. 2016, 2016, 1069581. [Google Scholar] [CrossRef]
- Henseler, J.; Dijkstra, T.; Sarstedt, M.; Ringle, C.; Diamantopoulos, A.; Straub, D.; Ketchen, D.; Hair, J.; Hult, G.; Calantone, R. Common beliefs and reality about PLS: Comments on Rönkkö and Evermann (2013). Organ. Res. Methods 2014, 17, 182–209. [Google Scholar] [CrossRef]
- Hair, J.; Risher, J.; Sarstedt, M.; Ringle, C. When to use and how to report the results of PLS-SEM. Eur. Bus. Rev. 2019, 31, 2–24. [Google Scholar] [CrossRef]
- Hair, J.; Hult, G.; Ringle, C.; Sarstedt, M. A Primer on Partial Least Squares Structural Equation Modeling (PLS-SEM); Sage Publications: London, UK, 2016; ISBN 1452217440. [Google Scholar]
- Henseler, J.; Ringle, C.; Sarstedt, M. Testing measurement invariance of composites using partial least squares. Int. Mark. Rev. 2016, 33, 405–431. [Google Scholar] [CrossRef]
- Henseler, J. Partial least squares path modeling: Quo vadis? Qual. Quant. 2018, 52, 1–8. [Google Scholar] [CrossRef]
- Dijkstra, T.; Henseler, J. Consistent and asymptotically normal PLS estimators for linear structural equations. Comput. Stat. Data Anal. 2015, 81, 10–23. [Google Scholar] [CrossRef]
- Ringle, C.; Sarstedt, M.; Straub, D. Editor’s comments: A critical look at the use of PLS-SEM in “MIS Quarterly”. MIS Q. 2012, 36, iii–xiv. [Google Scholar] [CrossRef]
- Falk, R.; Miller, N. A Primer for Soft Modeling; University of Akron Press: Akron, OH, USA, 1992; ISBN 0962262846. [Google Scholar]
- Gefen, D.; Straub, D.; Boudreau, M. Structural equation modeling and regression: Guidelines for research practice. Commun. Assoc. Inf. Syst. 2000, 4. [Google Scholar] [CrossRef]
- Hair, J.; Sarstedt, M.; Hopkins, L.; Kuppelwieser, V. Partial least squares structural equation modeling (PLS-SEM). Eur. Bus. Rev. 2014, 26, 106–121. [Google Scholar] [CrossRef]
- Hair, J.; Ringle, C.; Sarstedt, M. Partial Least Squares Structural Equation Modeling: Rigorous applications, better results and higher acceptance. Long Range Plann. 2013, 46, 1–12. [Google Scholar] [CrossRef]
- Bazelais, P.; Doleck, T.; Lemay, D. Investigating the predictive power of TAM: A case study of CEGEP students’ intentions to use online learning technologies. Educ. Inf. Technol. 2018, 23, 93–111. [Google Scholar] [CrossRef]
- Unal, E.; Uzun, A. Understanding university students’ behavioral intention to use Edmodo through the lens of an extended technology acceptance model. Br. J. Educ. Technol. 2021, 52, 619–637. [Google Scholar] [CrossRef]
- Arvanitis, T.; Williams, D.; Knight, J.; Baber, C.; Gargalakos, M.; Sotiriou, S.; Bogner, F. A human factors study of technology acceptance of a prototype mobile augmented reality system for science education. Adv. Sci. Lett. 2011, 4, 3342–3352. [Google Scholar] [CrossRef]


| Construct | Study | Indicator |
|---|---|---|
| Subjective norm | [61] | People whose opinions I value encourage me to use new technologies. |
| People who are important to me help me use new technologies. | ||
| Technology optimism | [47] | The products and services that use the newest technologies are much more convenient to use. |
| I prefer to use the most advanced technology available. | ||
| Technology makes my work more efficient. | ||
| Technology innovativeness | [62] | If I discover that new technologies exist, I find ways to test them. |
| Among my classmates, I am generally the first to try new technologies. | ||
| I like to experiment with new technologies. | ||
| Perceived ease of use | [51] | I found the app to be very easy to use. |
| The app was intuitive to use. | ||
| Learning how to use the app was easy. | ||
| Handling the app was easy. | ||
| Perceived usefulness | [48] | The use of the app improves learning in the classroom. |
| Using the app during lessons would facilitate the understanding of certain concepts. | ||
| I believe that the app is helpful when learning. | ||
| Attitude toward using | [51] | I think using the app in the class would be positive. |
| The app is so interesting that you want to learn more about it. | ||
| Using the app for the study of electrical circuits is logical. | ||
| The app is a good idea. | ||
| Behavioral intention to use | [63] | I would like to have this app if I had to study electrical circuits. |
| I would intend to use this app to learn about electrical circuits. | ||
| I would recommend other students use this app to study electrical circuits. |
| Construct/Indicator | Variance Inflation Factor | Cronbach’s Alpha | Dijkstra–Henseler’s Rho | Composite Reliabilities | Average Variance Extracted |
|---|---|---|---|---|---|
| Subjective norm (SN) | - | 0.788 | 0.798 | 0.904 | 0.824 |
| SN1 | 1.732 | - | - | - | - |
| SN2 | 1.732 | - | - | - | - |
| Technology optimism (TO) | - | 0.773 | 0.774 | 0.869 | 0.688 |
| TO1 | 1.757 | - | - | - | - |
| TO2 | 1.752 | - | - | - | - |
| TO3 | 1.411 | - | - | - | - |
| Technology innovativeness (TI) | - | 0.721 | 0.745 | 0.841 | 0.639 |
| TI1 | 1.604 | - | - | - | - |
| TI2 | 1.384 | - | - | - | - |
| TI3 | 1.377 | - | - | - | - |
| Perceived ease of use (PEOU) | - | 0.790 | 0.840 | 0.860 | 0.607 |
| PEOU1 | 1.816 | - | - | - | - |
| PEOU2 | 1.508 | - | - | - | - |
| PEOU3 | 1.510 | - | - | - | - |
| PEOU4 | 1.669 | - | - | - | - |
| Perceived usefulness (PU) | - | 0.855 | 0.856 | 0.912 | 0.776 |
| PU1 | 1.774 | - | - | - | - |
| PU2 | 2.529 | - | - | - | - |
| PU3 | 2.542 | - | - | - | - |
| Attitude toward using (ATU) | - | 0.764 | 0.765 | 0.850 | 0.587 |
| ATU1 | 1.689 | - | - | - | - |
| ATU2 | 1.489 | - | - | - | - |
| ATU3 | 1.494 | - | - | - | - |
| ATU4 | 1.360 | - | - | - | - |
| Behavioral intention to use (BIU) | - | 0.859 | 0.861 | 0.914 | 0.780 |
| BIU1 | 2.218 | - | - | - | - |
| BIU2 | 2.591 | - | - | - | - |
| BIU3 | 1.958 | - | - | - | - |
| ATU | BIU | PEOU | PU | SN | TI | TO | |
|---|---|---|---|---|---|---|---|
| ATU | 0.766 | - | - | - | - | - | - |
| BIU | 0.743 | 0.883 | - | - | - | - | - |
| PEOU | 0.390 | 0.328 | 0.779 | - | - | - | - |
| PU | 0.611 | 0.423 | 0.560 | 0.881 | - | - | - |
| SN | 0.310 | 0.208 | 0.065 | 0.215 | 0.908 | - | - |
| TI | 0.296 | 0.311 | 0.105 | 0.115 | 0.332 | 0.800 | - |
| TO | 0.352 | 0.357 | 0.173 | 0.299 | 0.399 | 0.467 | 0.830 |
| ATU | BIU | PEOU | PU | SN | TI | TO | |
|---|---|---|---|---|---|---|---|
| ATU | - | - | - | - | - | - | - |
| BIU | 0.915 | - | - | - | - | - | - |
| PEOU | 0.472 | 0.378 | - | - | - | - | - |
| PU | 0.756 | 0.495 | 0.647 | - | - | - | - |
| SN | 0.403 | 0.253 | 0.084 | 0.266 | - | - | - |
| TI | 0.383 | 0.393 | 0.150 | 0.135 | 0.436 | - | - |
| TO | 0.455 | 0.440 | 0.209 | 0.367 | 0.509 | 0.616 | - |
| Construct | R2 | p-Value | Q2 |
|---|---|---|---|
| Technology innovativeness | 0.240 | 0.000 | 0.136 |
| Technology optimism | 0.162 | 0.001 | 0.106 |
| Perceived usefulness | 0.400 | 0.000 | 0.283 |
| Attitude toward using | 0.429 | 0.000 | 0.237 |
| Behavioral intention to use | 0.570 | 0.000 | 0.431 |
| Hypothesis | Path | t-Value | p-Value | Supported |
|---|---|---|---|---|
| H1: Subjective norm → Technology optimism | 0.403 | 6.043 | 0.000 | Yes |
| H2: Subjective norm → Technology innovativeness | 0.164 | 2.072 | 0.019 | Yes |
| H3: Technology optimism → Technology innovativeness | 0.400 | 5.107 | 0.000 | Yes |
| H4: Technology optimism → Perceived usefulness | 0.200 | 2.320 | 0.010 | Yes |
| H5: Technology optimism → Attitude toward using | 0.095 | 1.093 | 0.137 | No |
| H6: Technology innovativeness → Attitude toward using | 0.208 | 2.665 | 0.004 | Yes |
| H7: Perceived ease of use → Perceived usefulness | 0.564 | 5.606 | 0.000 | Yes |
| H8: Perceived ease of use → Attitude toward using | 0.103 | 1.088 | 0.138 | No |
| H9: Perceived usefulness → Attitude toward using | 0.476 | 4.764 | 0.000 | Yes |
| H10: Attitude toward using → Behavioral intention to use | 0.755 | 19.770 | 0.000 | Yes |
Publisher’s Note: MDPI stays neutral with regard to jurisdictional claims in published maps and institutional affiliations. |
© 2021 by the authors. Licensee MDPI, Basel, Switzerland. This article is an open access article distributed under the terms and conditions of the Creative Commons Attribution (CC BY) license (https://creativecommons.org/licenses/by/4.0/).
Share and Cite
Álvarez-Marín, A.; Velázquez-Iturbide, J.Á.; Castillo-Vergara, M. Technology Acceptance of an Interactive Augmented Reality App on Resistive Circuits for Engineering Students. Electronics 2021, 10, 1286. https://doi.org/10.3390/electronics10111286
Álvarez-Marín A, Velázquez-Iturbide JÁ, Castillo-Vergara M. Technology Acceptance of an Interactive Augmented Reality App on Resistive Circuits for Engineering Students. Electronics. 2021; 10(11):1286. https://doi.org/10.3390/electronics10111286
Chicago/Turabian StyleÁlvarez-Marín, Alejandro, J. Ángel Velázquez-Iturbide, and Mauricio Castillo-Vergara. 2021. "Technology Acceptance of an Interactive Augmented Reality App on Resistive Circuits for Engineering Students" Electronics 10, no. 11: 1286. https://doi.org/10.3390/electronics10111286
APA StyleÁlvarez-Marín, A., Velázquez-Iturbide, J. Á., & Castillo-Vergara, M. (2021). Technology Acceptance of an Interactive Augmented Reality App on Resistive Circuits for Engineering Students. Electronics, 10(11), 1286. https://doi.org/10.3390/electronics10111286