1. Introduction
Power line communication (PLC) is a versatile method using existing infrastructure like power cables for data transmission. This makes PLC an alternative and cost-efficient technology by the dual use of the powerline to other communication solutions like wireless radio frequency communication. The PLC modems can be installed plug and play on the existing power infrastructure without the need for other costly installation procedures. Typically the rooms on each floor and beyond are linked by the same power line infrastructure which can be used easily for PLC. However, the PLC transmission channel is a very rough environment and need special attention to the design of the PLC [
1,
2,
3]. PLC technology is a good alternative to wireless communication and is intended for use such as home automation, smart grid, city automation and cyber-physical systems as well as long-range communication. Another approaching field for PLC systems is given by the application in vehicular-, ship-, and aircraft- technology [
4,
5,
6,
7,
8,
9,
10,
11,
12,
13,
14].
Especially in vehicular technology CAN (Controller Area Network, ISO 11898) and LIN (Local Interconnect Network, ISO 17987 [
15,
16]) buses are used for communication links between different components. The CAN bus offers data rates up to 1 Mbit/s (high speed CAN) and the hard wiring between the CAN transceivers allows a lossless bitwise arbitration method which makes CAN suitable as a real-time prioritized communication system. This procedure also provides a hierarchy of messages among each other. The message with the lowest identifier may always be transmitted. For the transmission of time-critical messages, a high-priority identifier can be assigned in order to give the message priority during transmission. In vehicular technology LIN buses are typical used for low-speed and low priority communication between sub-systems. For cost-sensitive and low speed applications mainly the LIN bus is used in automotive applications. The LIN bus serves as a sub-bus for cost-effective networking of control devices in cars. LIN is used for simple sensor and actuator applications where the CAN bus was not an option for this cost-sensitive area, as the bandwidth and versatility are not required and the costs for networking with this bus are too high. Up to 16 bus subscribers can be networked in a LIN cluster, with a maximum data rate of 20 kbit/s. The LIN bus is typically used for non-critical safety components and sensors/actuators in cars where the application area includes comfort functions, such as window regulators, central locking, electric mirror adjustment, electric seat adjustment, rain sensor, light sensor, electric sunroof, or air conditioning control etc.
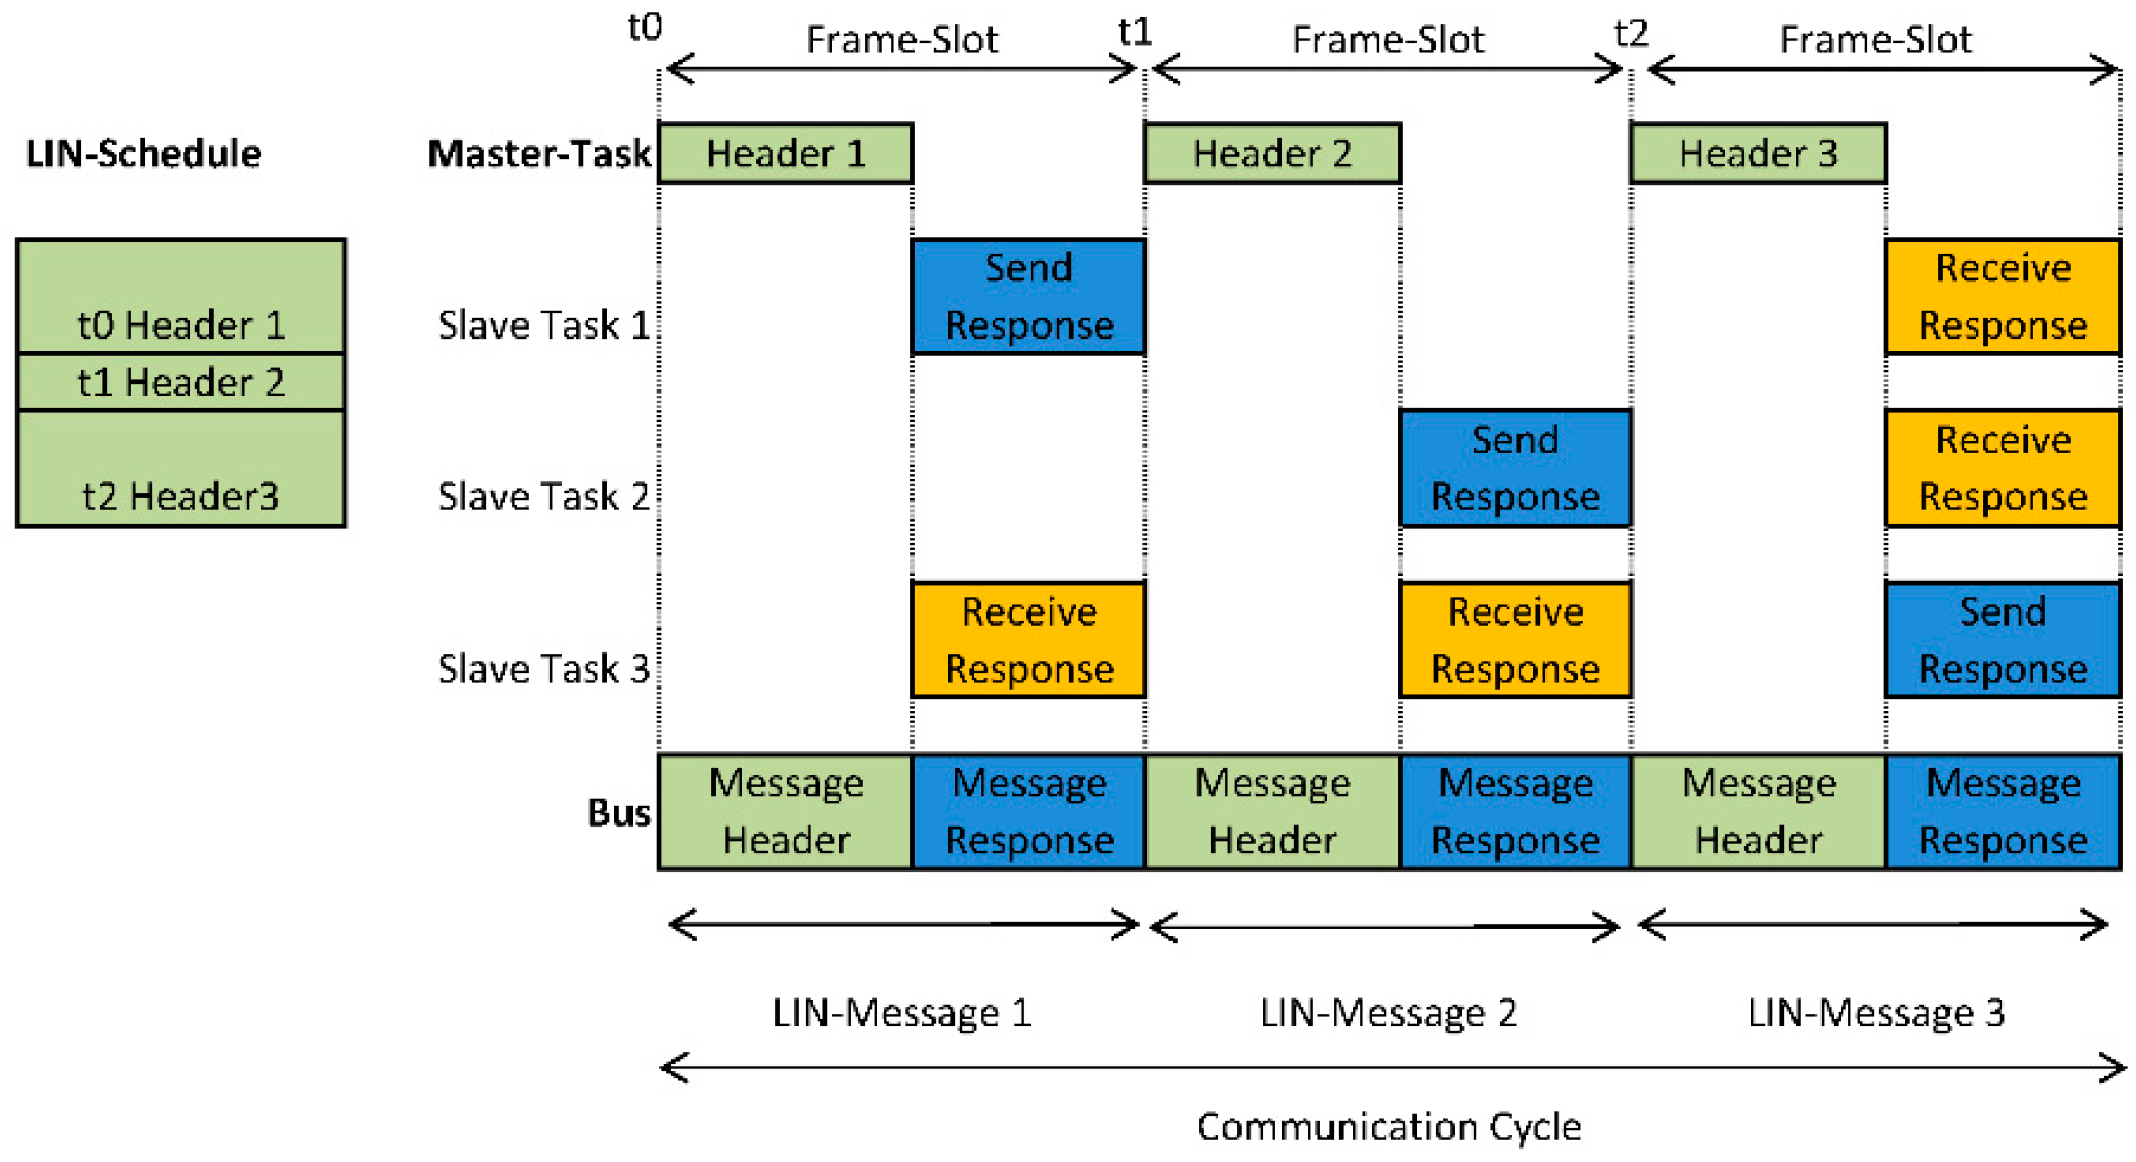
The LIN-Bus
With the demand for a cost-effective communication system for use in the sensor/actuator area, LIN found its way into the vehicle as a so-called “sub-bus”. LIN communication was very simple and does not require a communication controller or crystal oscillator for synchronization. The data transmission takes place via a single line (single wire). In order to meet the interference immunity requirements typical for motor vehicles, the transmission levels correspond to the battery voltage but with slew rates below 2 V/μs therefore limiting the symbol transmission rate to 20 kbit/s. The master-slave architecture makes LIN communication deterministic. A master controls the entire communication in a LIN cluster on the basis of a well-defined time table (
Figure 1). One LIN frame consists of the two parts header and response. The header is always sent by the LIN master, while the response is sent by either one dedicated LIN slave or the LIN master itself. A LIN slave addressed by the message responds with a frame which can consist of up to eight data bytes. Due to the six-bit wide identifier up to 64 LIN messages can be specified. In contrast to CAN, LIN is a centrally controlled message distribution system. A LIN message always begins with the so-called “break-field”. This helps all LIN slaves to synchronize and is used to activate all attached LIN slaves to listen to the following parts of the header. The “break-field” command consists of one start bit and several dominant bits with a length of at least 11-bit times. Data integrity is checked using parity bits in the message header and a checksum transmitted in the message response. In this study we focused on the replacement of the LIN bus by PLC systems for vehicular applications. Especially for low speed and low priority bus systems like the LIN bus, PLC modems can replace the wired interconnections between the sub-systems.
A further advantage is that the wiring of additional components or device upgrades is much easier, since only the power line and no additional LIN bus cables are required for data communication. After power connection of the new component, it logs on via the PLC at the master unit and immediately becomes part of the LIN network.
2. Performance of PLC Systems for LIN Data Transmission
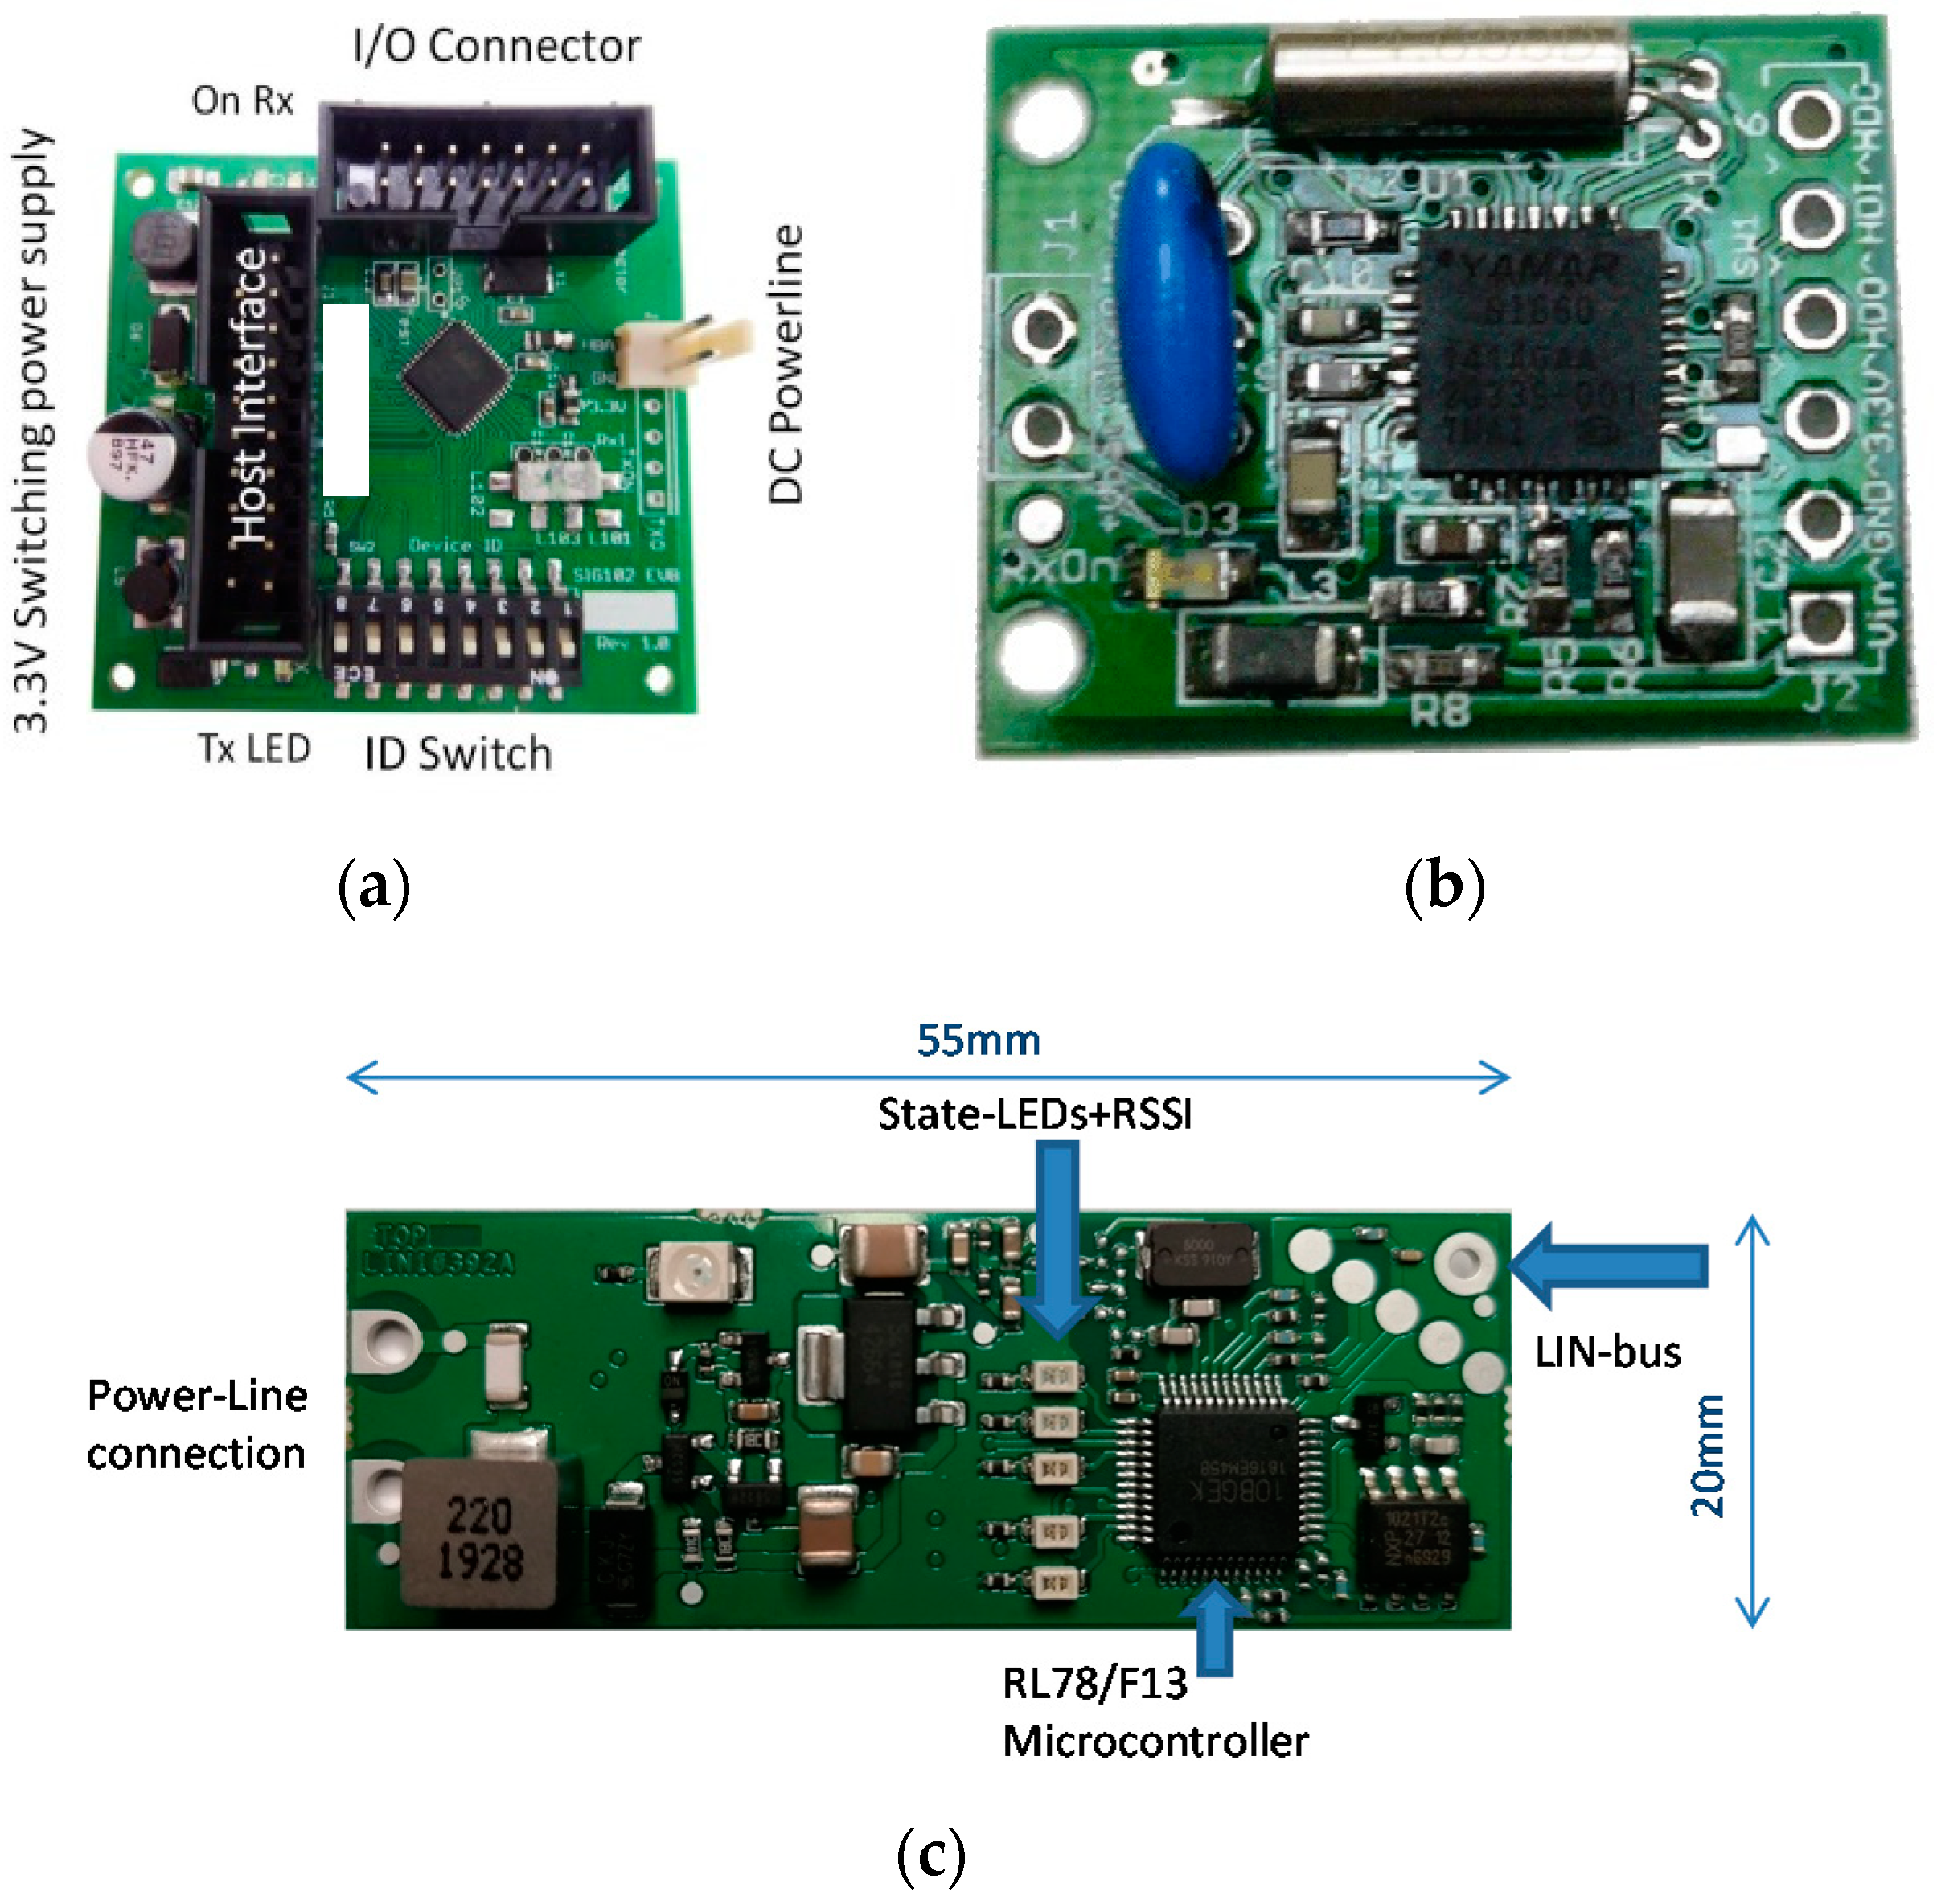
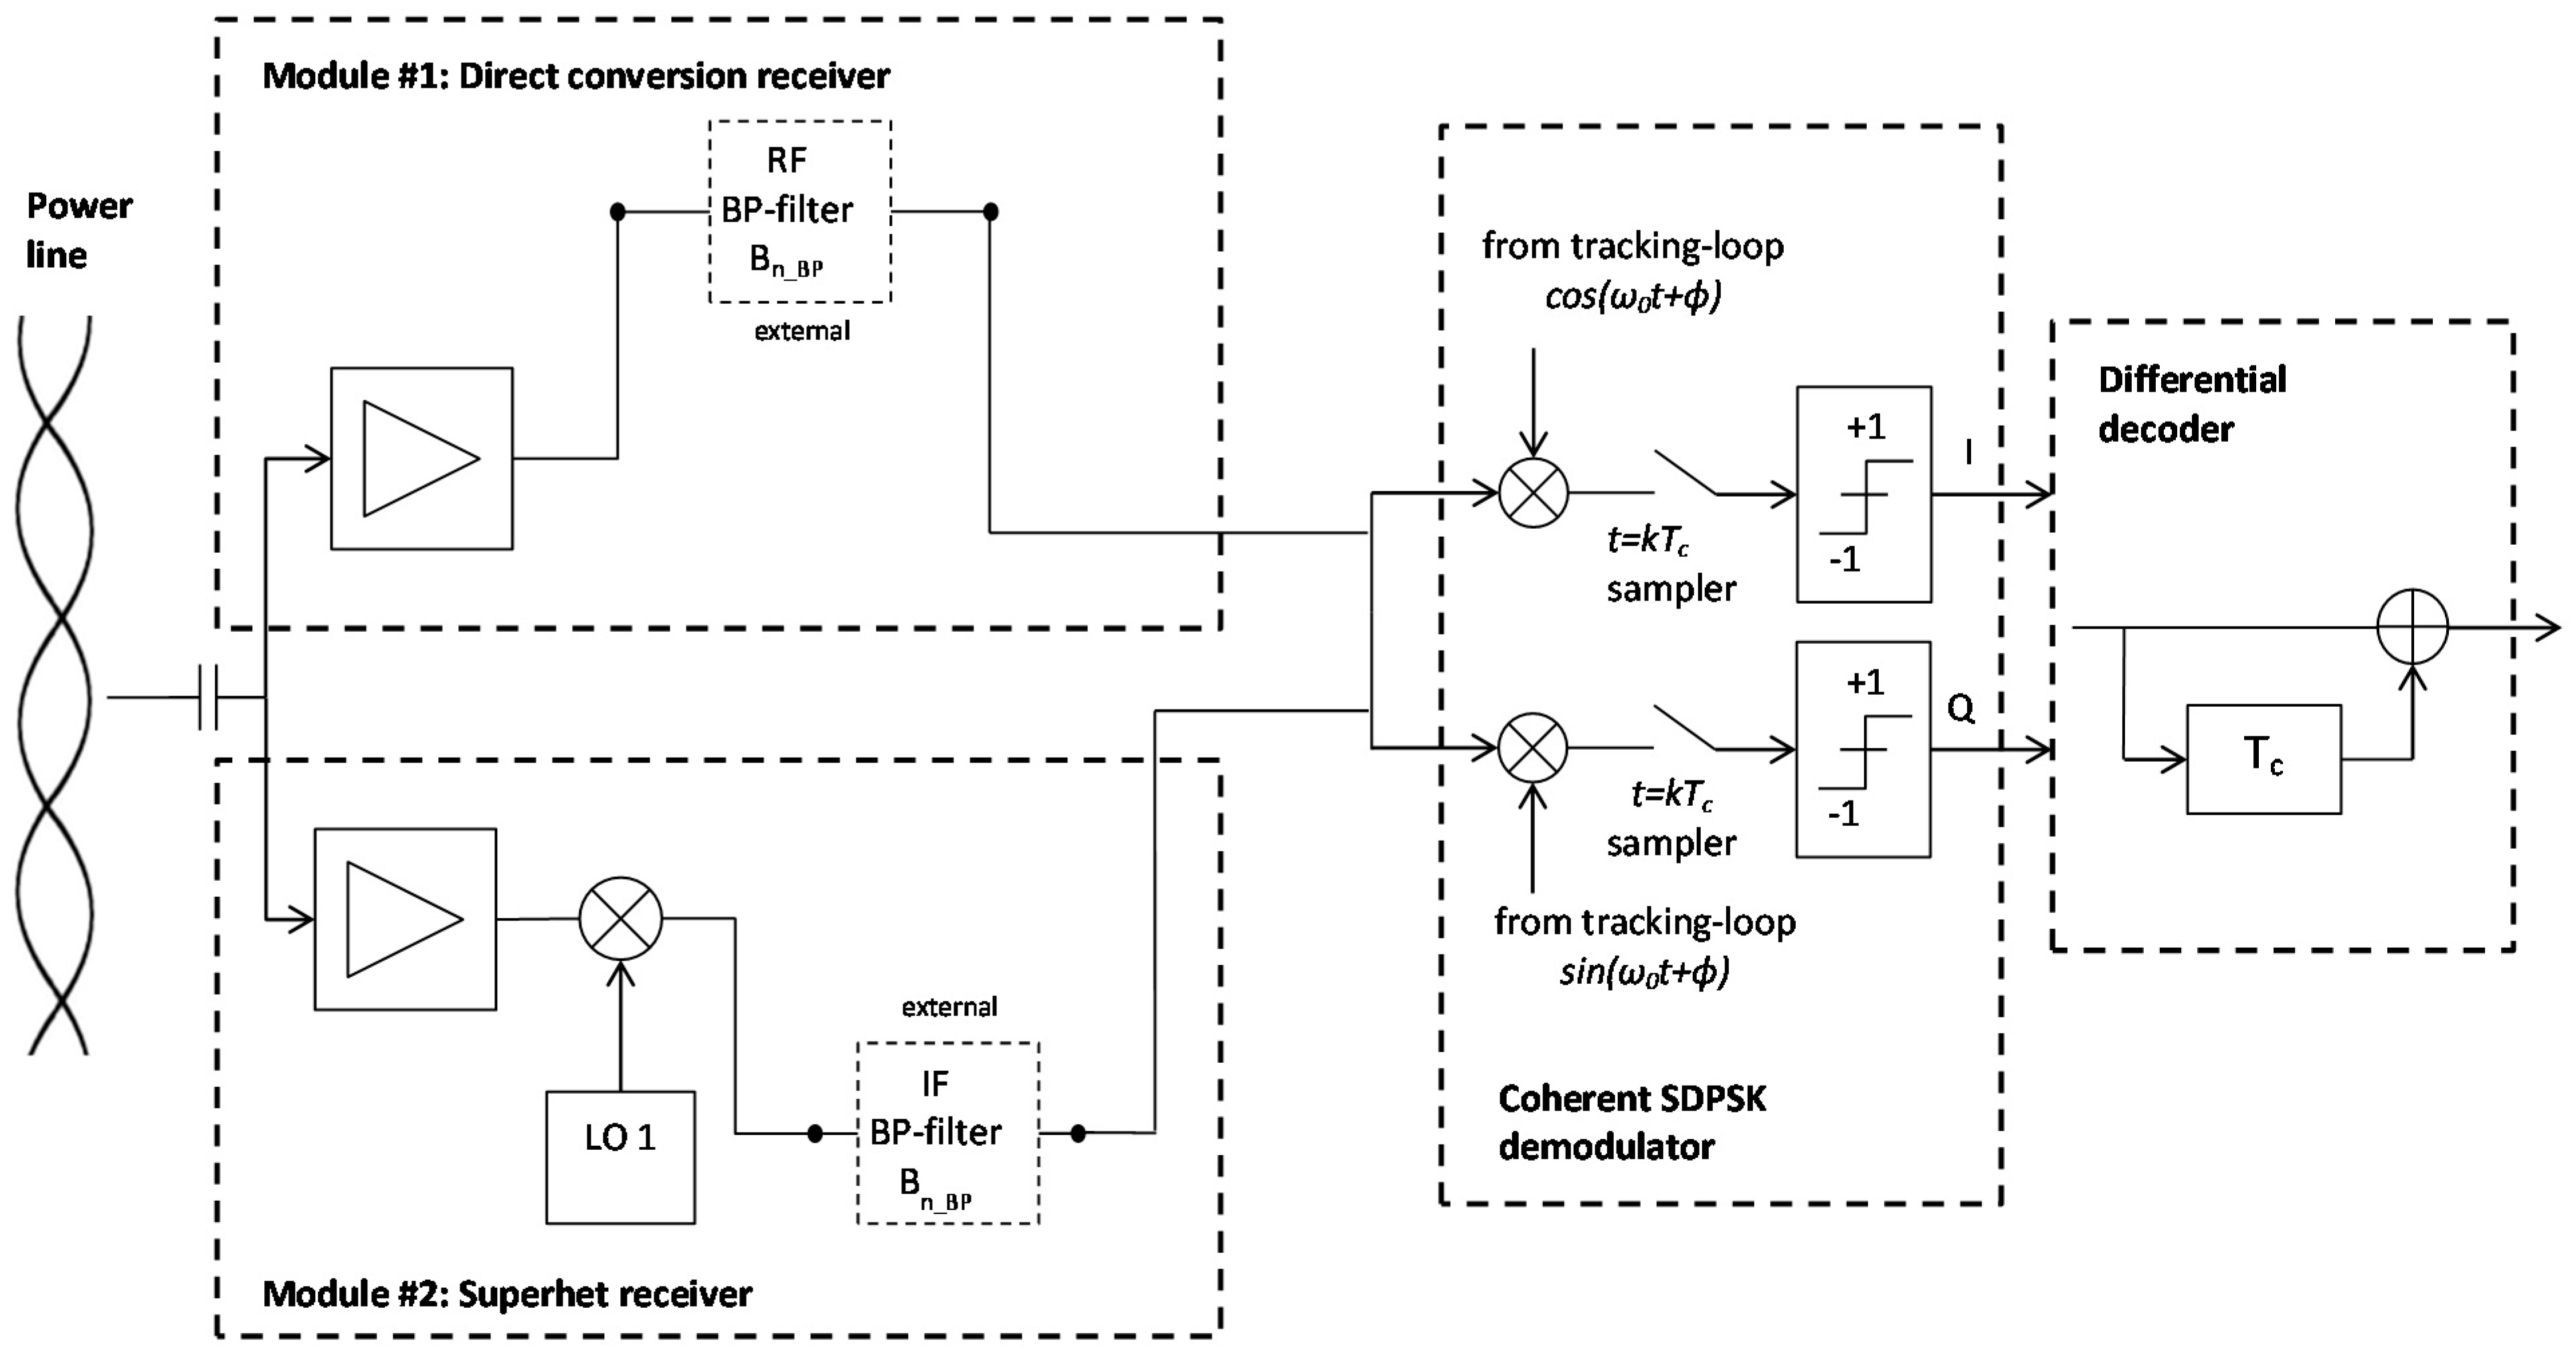
The goal of our development was to design a robust communication system for automotive applications and to radically reduce component costs to less than 1 Euro. For applications in the automotive industry, the cost of the components is of high importance and can be kept very low by almost complete system implementation in a low-cost microcontroller. Direct sequence spread spectrum (DSSS) is a promising technology for interference-resistant PLC data transmission, and because of its low computational power requirements, it can be easily implemented in a low-performance microcontroller. For evaluation of our cost optimized DSSS PLC system (
Figure 2c), it was compared to two commercial PLC modules #1 and #2 (
Figure 2a,b) which are dedicated for automotive use. The modules were analyzed regarding their sensitivity to single-tone interferers and additive white Gaussian noise (AWGN) on the transmission channel, as well as compared with theoretical results. Classical PLC modules which are used for low-voltage household networks (e.g., Homeplug-Standard IEEE-1901) were not used within this study because they are not qualified for automotive applications.
DSSS is a well-known and established data transmission method for robust transmission over distorted channels and is often used because of its easy implementation [
17,
18,
19,
20,
21,
22,
23,
24]. In spread spectrum technology, the signal to be transmitted is spread over a wide frequency range, with spreading being achieved by modulating the carrier frequency with a pseudostatistical spreading code. During spreading, the bits of the user data are spread with the spreading sequence.
This spreading results in a high-bit-rate code sequence, which is called a chip sequence to distinguish it from the bit sequence. The “chips” represent the smallest spread information units. The chip rate depends on the spreading factor which corresponds to the quotient of the chip rate to the bit rate. The wider the spread, the less susceptible the transmission is to interference from other signals. At the same time, spreading provides a certain degree of protection against unauthorized eavesdropping.
All modules operate with carrier modulation, where the carrier frequency is adjustable within a certain range. The carrier frequency of the DSSS modem is free adjustable but typically set to 8 MHz and depend on the clock-oscillator crystal frequency (
fcarrier =
fcrystal/4). Both commercial modules can operate on different carrier frequencies in the range from 1.75 MHz to 13 MHz in coarse steps (module #1) and from 5 MHz to 30 MHz with a spacing of 100 kHz for module #2. All modems are able to transfer the LIN bus specific data rate of 19.2 kbit/s. In our DSSS system an
N = 7 bit Barker code is used as spreading function which is modulo 2 added to the binary data sequence where
N is the length of the sequence. Each data bit is spread by a full 7 bit Barker sequence and therefore the chip duration
Tc is
Tb/
N of the bit duration
Tb (
Figure 3a). An overview about the proposed DSSS modem and first results were also given [
25]. The used Barker code has an optimal autocorrelation function which means that the autocorrelation peak has an amplitude of
N and the sidelobes are no larger than 1 (
Figure 3b) [
26]. An important performance parameter of spread spectrum systems is the processing gain
PG which is defined as the ratio of the signal bandwidth
Bs on the transmission channel after spreading in relation to the message signal bandwidth
Bm defined by the symbol rate Equation (1).
If BPSK modulation is used, the processing gain for the proposed barker code with length
N = 7 is
PG = 7 or 8.5 dB:
A simplified block structure of the DSSS transceiver is given in
Figure 4a. The LIN bus data stream with a data rate of
Rb = 19.2 kB/s is modulo 2 added to the
N = 7 Barker code. This means that the clock rate of the Barker code generator is
RC = N·
Rb. For transmission over the powerline the spread message signal is DE-BPSK (differential encoded binary phase-shift keying) [
27] modulated on an 8 MHz carrier by a balanced modulator. Incoherent detection, the receiver obtains its demodulation frequency and phase references using a carrier synchronization loop.
Such synchronization circuits can lead to a phase ambiguity in the detected phase, which can lead to wrong decisions in the demodulated bits. For example, the Costas loop has a phase ambiguity of integer multiples of pi-radians at the locking points. As a result, carrier recovery may lock into pi-radians out of phase, resulting in a situation where all detected bits are completely inverted compared to the bits at perfect carrier synchronization. Phase ambiguity can be efficiently addressed by applying differential coding at the input of the BPSK modulator and by performing differential decoding at the output of the coherent demodulator at the receiver side (
Figure 4b). Via capacitive coupling the modulated signal is fed onto the power line. In the receiver, the despreading is performed by synchronous multiplication of the received signal with a replica of the Barker code sequence as used in the transmitter. After despreading the bandpass signal is transferred into the baseband by synchronous demodulation. The carrier frequency synchronization and the time synchronization of the despreading code generator are done by carrier/code tracking loops. As noted previously, one of the advantages of spread spectrum is the ability to reject interferences which is very useful especially in a heavy electromagnetic polluted environment like automotive applications. If the interference is within the passband of the receiver input filter, the jammer will be spread by the Barker code sequence to the bandwidth
Bs of the spreading function. Therefore the power of the interfering signal
PJ is reduced by an amount called the bandwidth expansion factor
Bs/
Bm which is equal to the processing gain
PG [
28]. The total power
J0 of the interference at the output of the receiver is:
The reduction of interference power by the processing gain PG is one of the main advantages using spread spectrum transmission systems in interference polluted environments like automotive applications.
3. Test Setup and Results
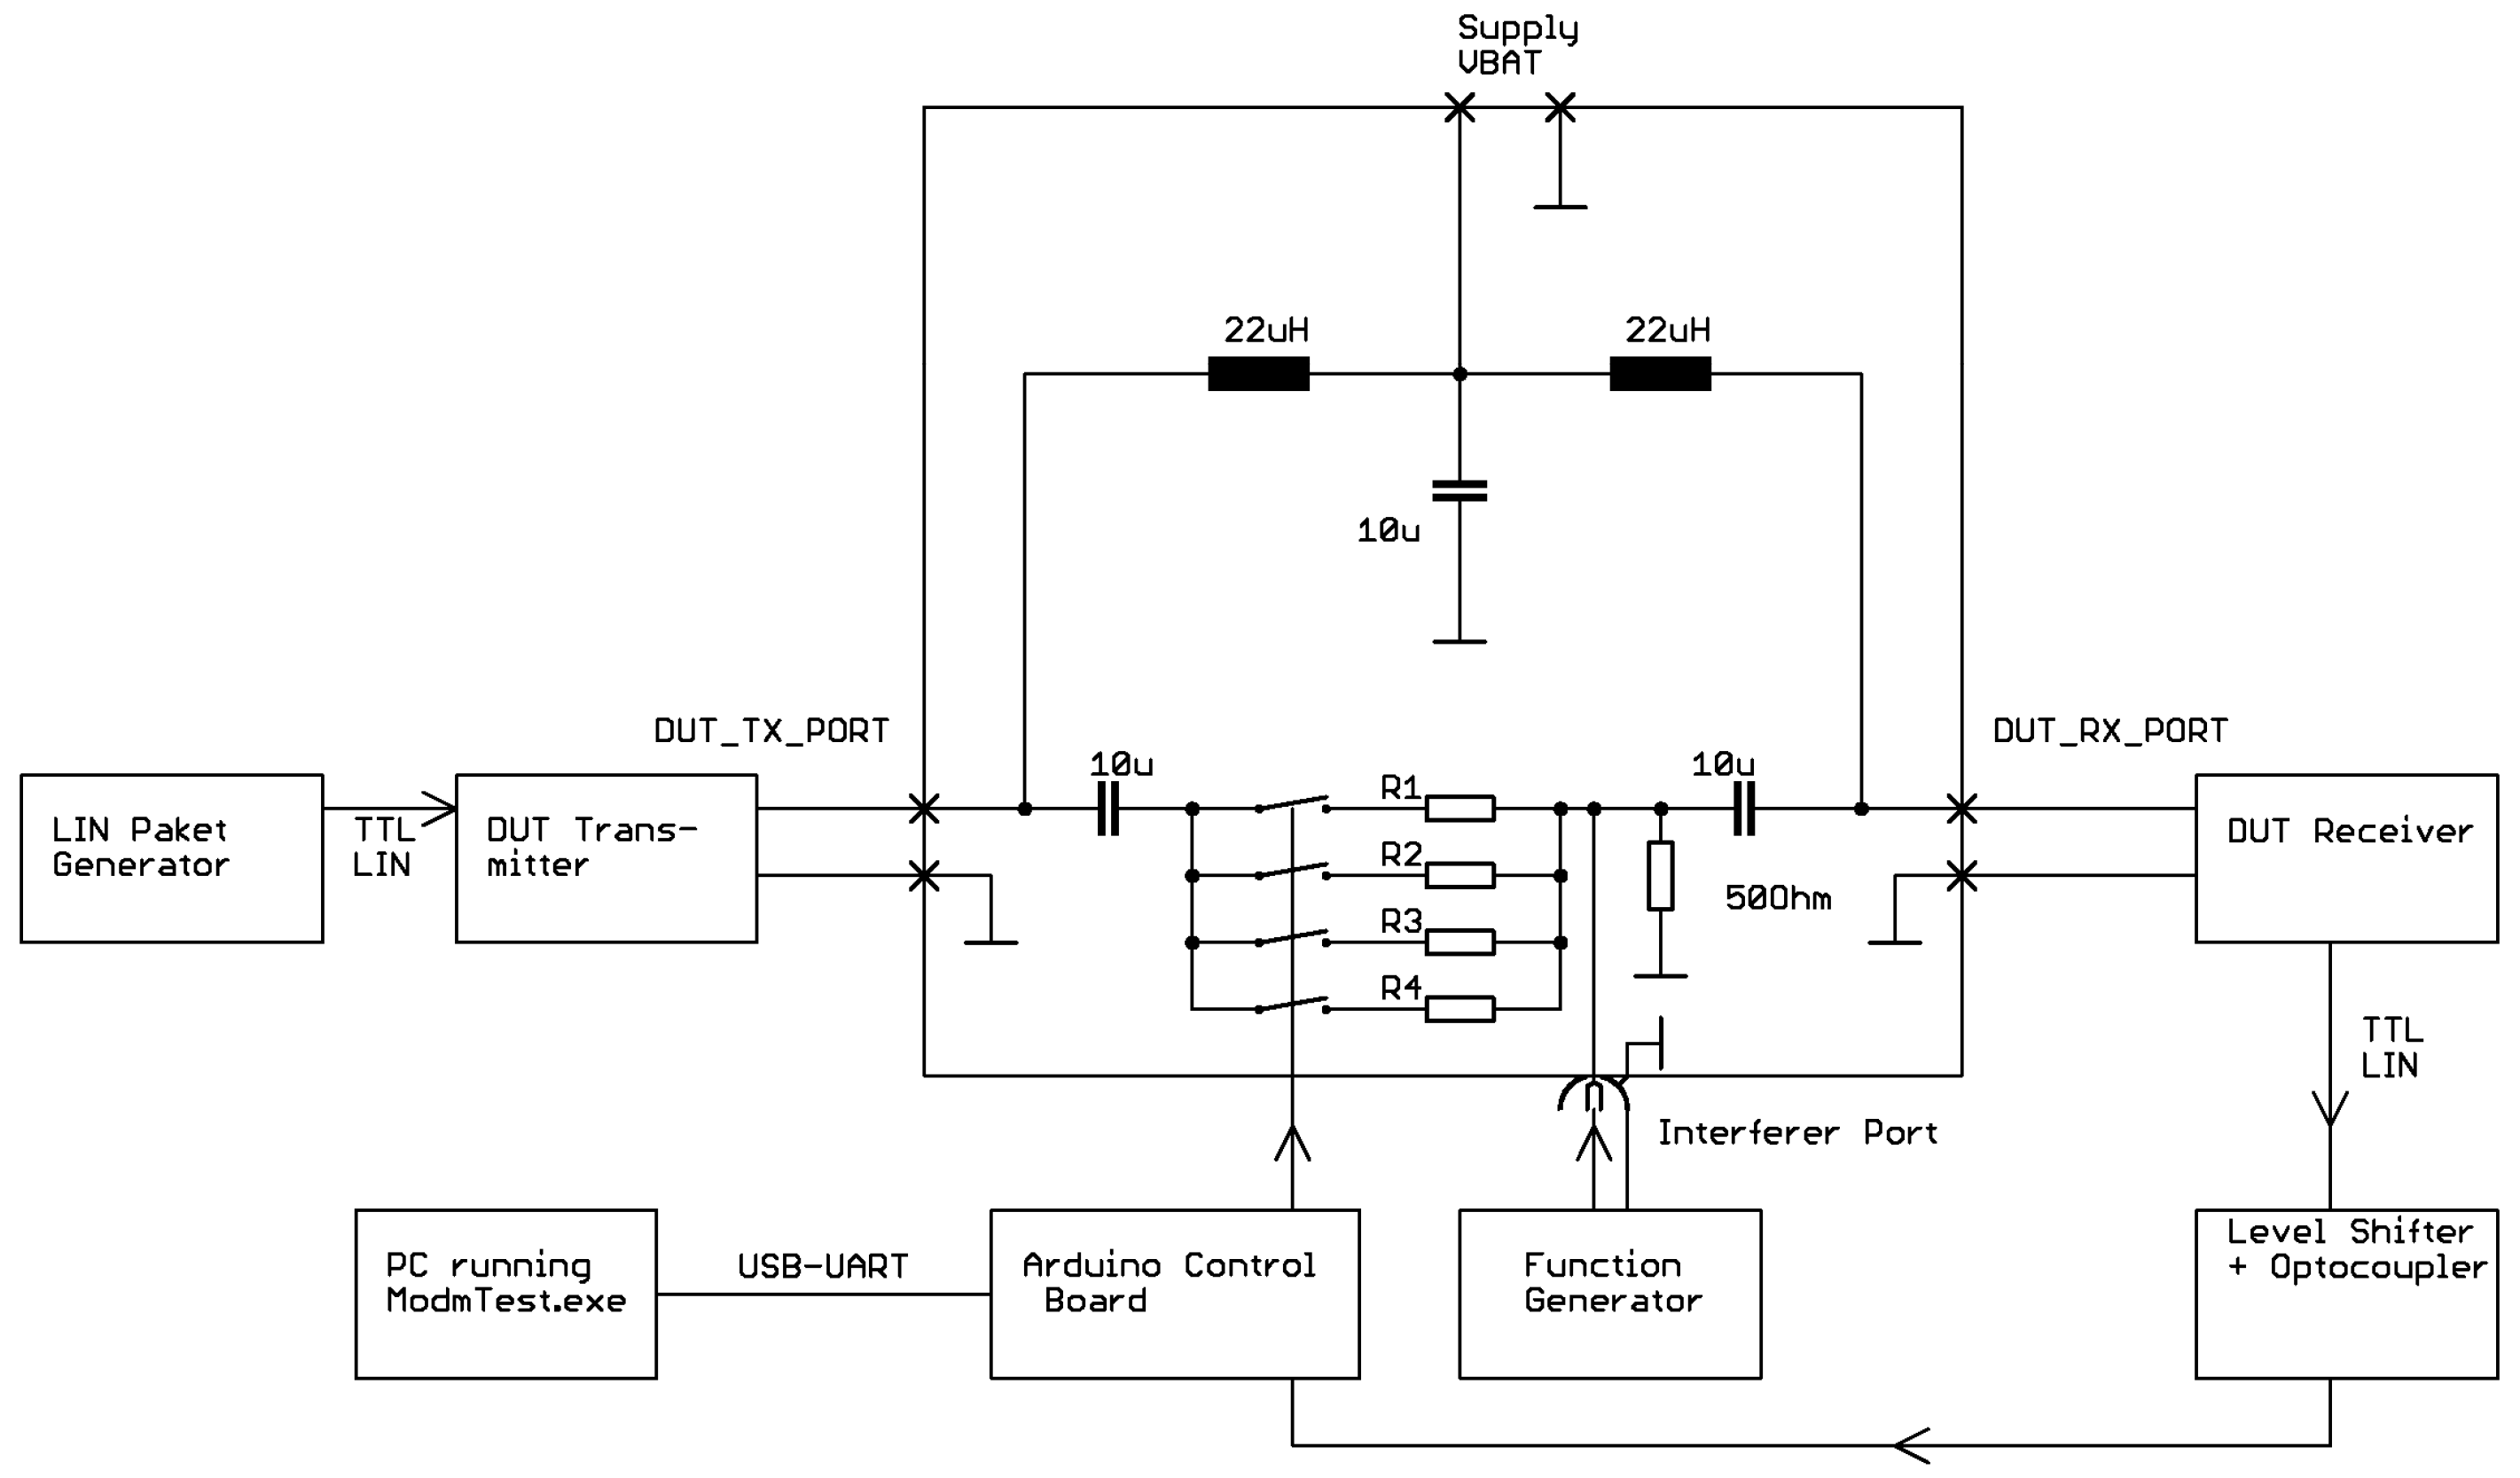
The test setup for characterizing the robustness of the different transceivers against single-tone interference and AWGN on the transmission channel is shown in
Figure 5.
The transmission channel was realized by a switchable resistive damping circuit where different attenuation factors can be adjusted for varying the signal to interference ratio (SIR) and the signal to noise ratio (SNR) on the receiver input. For electrical decoupling and avoidance of crosstalk between the transmitter and the receiver separated power supplies and optocouplers are used. Predefined LIN-packets are delivered from a LIN-packet generator.
The transmitted LIN-packets are designed to enable an asynchronous data transmission and packet error detection by transmitting an incrementing counter value in the payload and a checksum byte (
Figure 6) A LIN-packet error was detected if a counter error between two subsequent received packets or a CRC error occurs. LIN-packets were transmitted every 10 ms with data rate of
Rb = 19.2 kB/s. The LIN-packet error rate (
PER) was calculated from the number of faulty or missing packets output by the receiver to the number of packets sent.
3.1. Sensitivity to Single-Tone Interference
The PLC data communication in industrial or automotive environments is frequently corrupted by interferences based on harmonics from, e.g., switched power supplies and other electronic components coupling high-frequency radiation into power lines. To investigate the influence of narrowband interference on the quality of LIN data transmission, a sinusoidal interference signal was superimposed on the PLC signal on the transmission channel. A sine wave generated by a function generator (33250A, Keysight, Santa Rosa, CA, USA) was coupled to the transmission line and swept over a frequency band Δf = ±200 kHz around the PLC carrier center frequency. The SIR was calculated from the RMS amplitude of the PLC signal and the RMS amplitude of the interferer on the transmission channel. Depending on the design of the PLC transceivers, the sensitivity to interference depends on the absolute amplitude of the received PLC signal which can be caused by amplifier saturation, amplifier slew rate, etc.
The SIR was also measured in dependency of the PLC signal attenuation over the transmission channel. All PLC modules show a threshold sensitivity in
PER to the amplitude of the single-tone interferer where the
PER rises in a very close interval from low values to 1 (
Figure 7). The differences of the evaluated PLC modules in interference sensitivity are mainly based on the used filters for interference rejection and the spreading gain for DSSS systems. In the DSSS module a 2nd-order LC bandpass (BP) filter at the PLC center frequency is used in front of the receiver and a 10 kHz 2nd-order active lowpass (LP) filter builds a signal matched filter in front of the ADC [
25]. Module #1 and module #2 PLC transceivers are using commercial high-Q ceramic BP-filters where module #1 is operating with a 6.5 MHz ± 80 kHz frontend BP-filter (#773–0065, Oscilent Corporation, Irvine, CA, USA) and module #2 with a 10.7 MHZ ± 165 kHz IF-filter (#762-0107-A20, Oscilent Corporation, Irvine, CA, USA) in the standard configuration, respectively. Module #2 is an evolution of module #1 and uses instead of a direct conversion receiver which needs for each adjusted PLC center frequency a different ceramic frontend filter, a superhet receiver with a fixed intermediate frequency (IF) at 10.7 MHz with the advantage that the PLC carrier frequency can be adjusted independently of the filter center frequency.
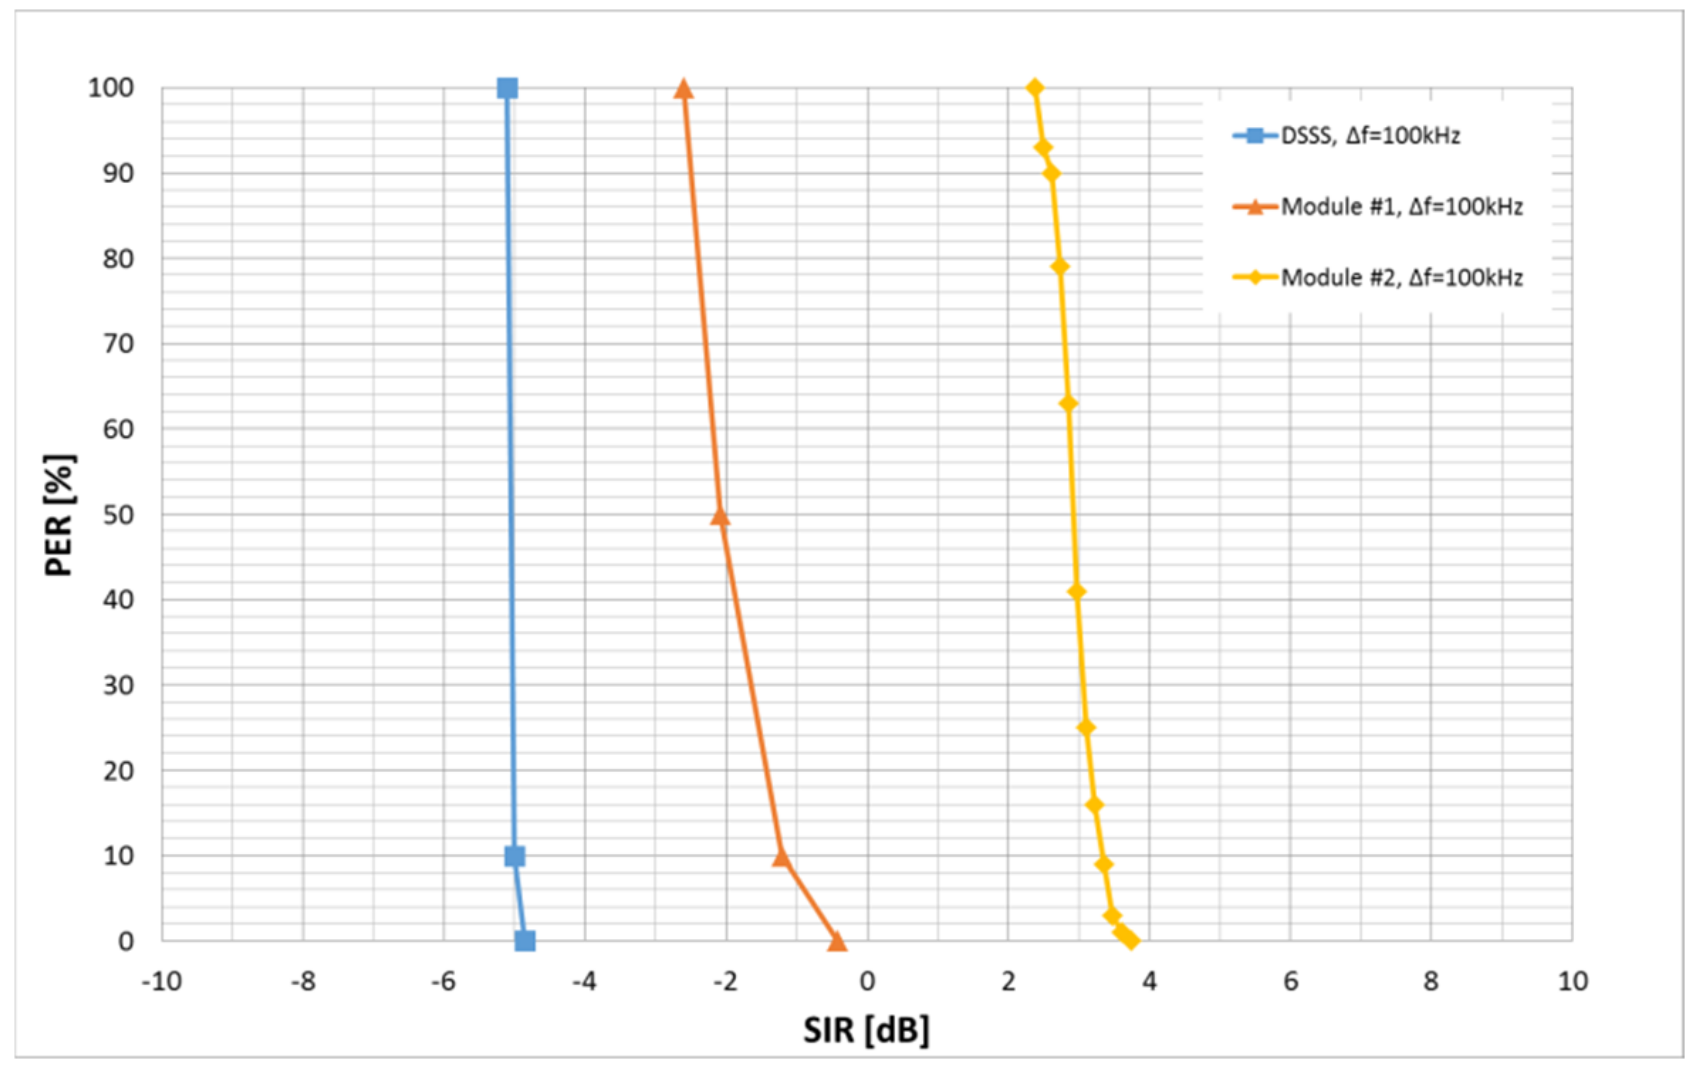
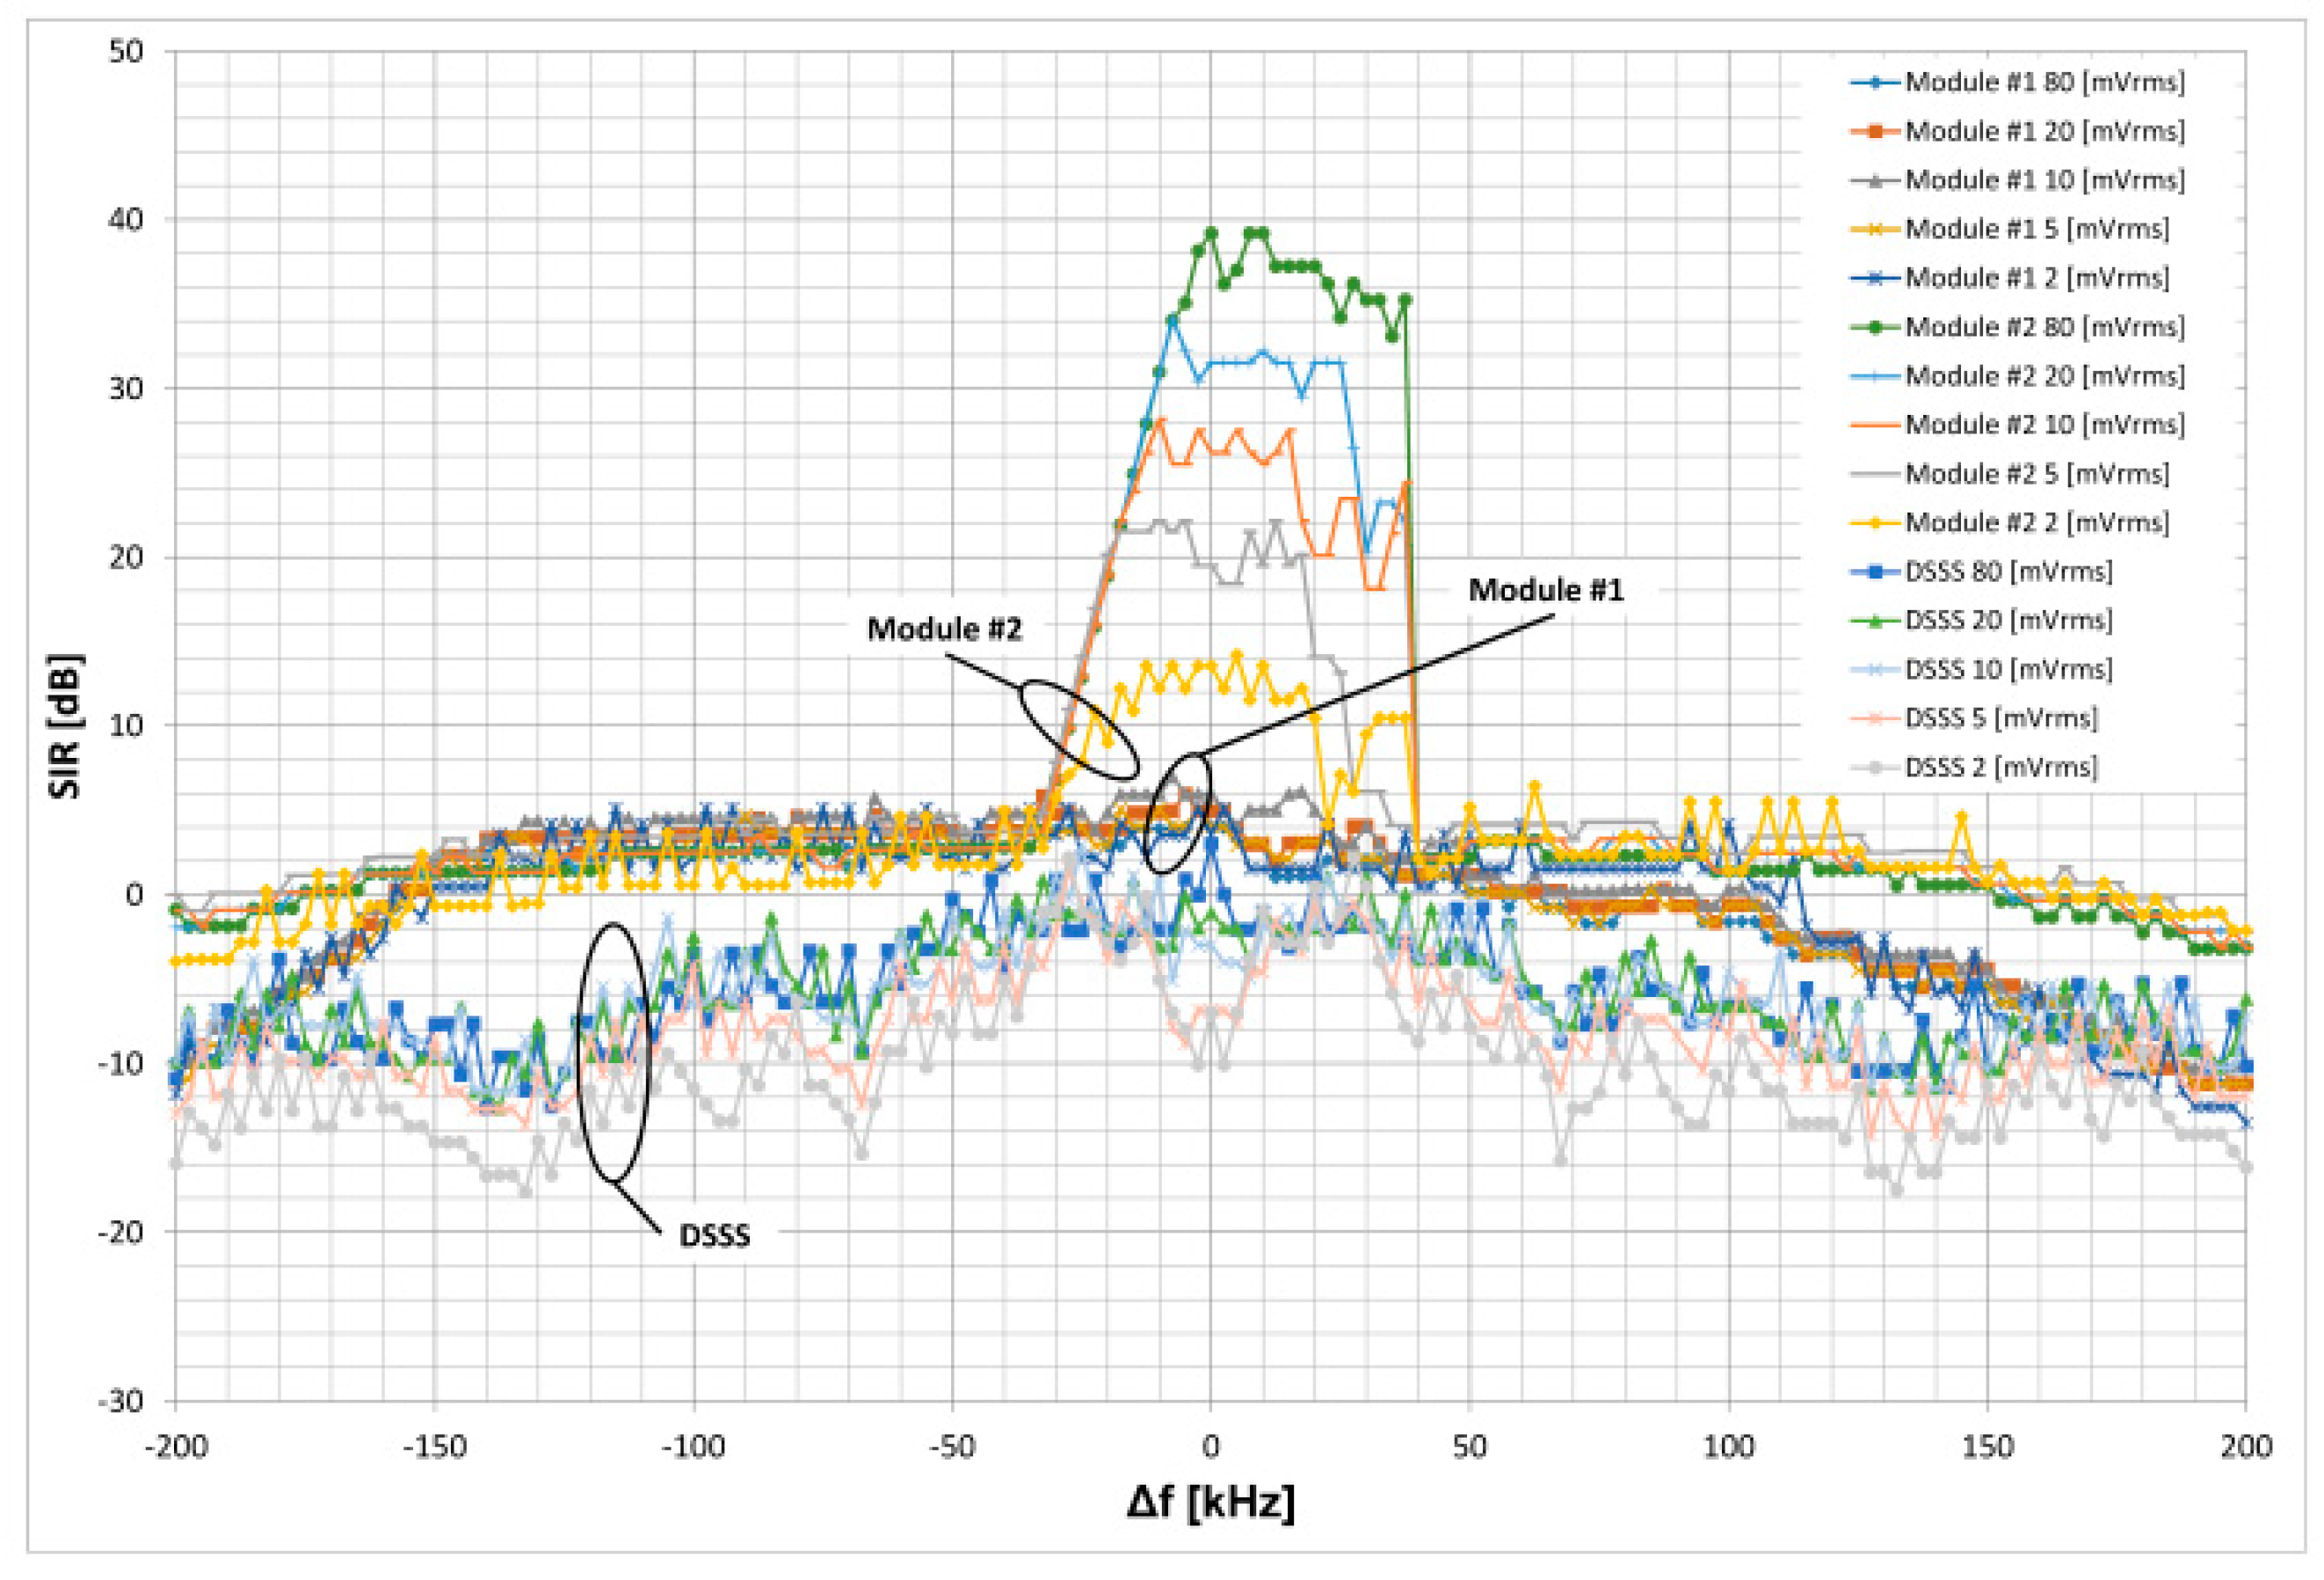
In
Figure 8, the SIR threshold level, where no further data transmission was possible (
PER = 1), of the different PLC modules against single-tone interference is depicted. The single-tone interferer was a sine wave generated by a function generator at different frequency offsets to the transmission center frequency Δ
f =
fcarrier −
finterferer and a
SIR adjusted by different channel attenuations of the PLC signal. Theoretically, the robustness of a DSSS system against single-tone interference must be by the process-gain
PG better than that of a conventional receiver.
As expected, the DSSS module had an on average 7 dB better
SIR performance (
SIRaverage ± 80 kHz = −4 dB) within the signal bandwidth
fc ±
Bs/2 =
fc ± 70 kHz. The DSSS process gain is as shown in
Figure 8 in dependency of the received signal amplitude because of the nonlinear characteristic of the pre-amplifier where for increasing signal amplitudes the gain decreases [
25]. Therefore, the best performance was found for low signal amplitudes (DSSS 2 mVrms and DSSS 5 mVrms). PLC module #1 show within the receiver bandwidth
fc ± 80 kHz given by the frontend BP-filter an about constant mean sensitivity of
SIRaverage ± 80 kHz = +3 dB against single-tone interference. Module #2 is designed as a superhet receiver with fix intermediate frequency of 10.7 MHz and an IF-filter bandwidth of ±165 kHz.
Module #2 shows a strong sensitivity against single-tone interferer located in a range of about ±30 kHz around the carrier frequency and is independent on the IF-filter properties. We assume that the carrier tracking of the internal carrier recovery loop is probably shifted to the single-tone interferer and not to the carrier; therefore additional bit errors occur and the properties of the loop filter are mirrored in
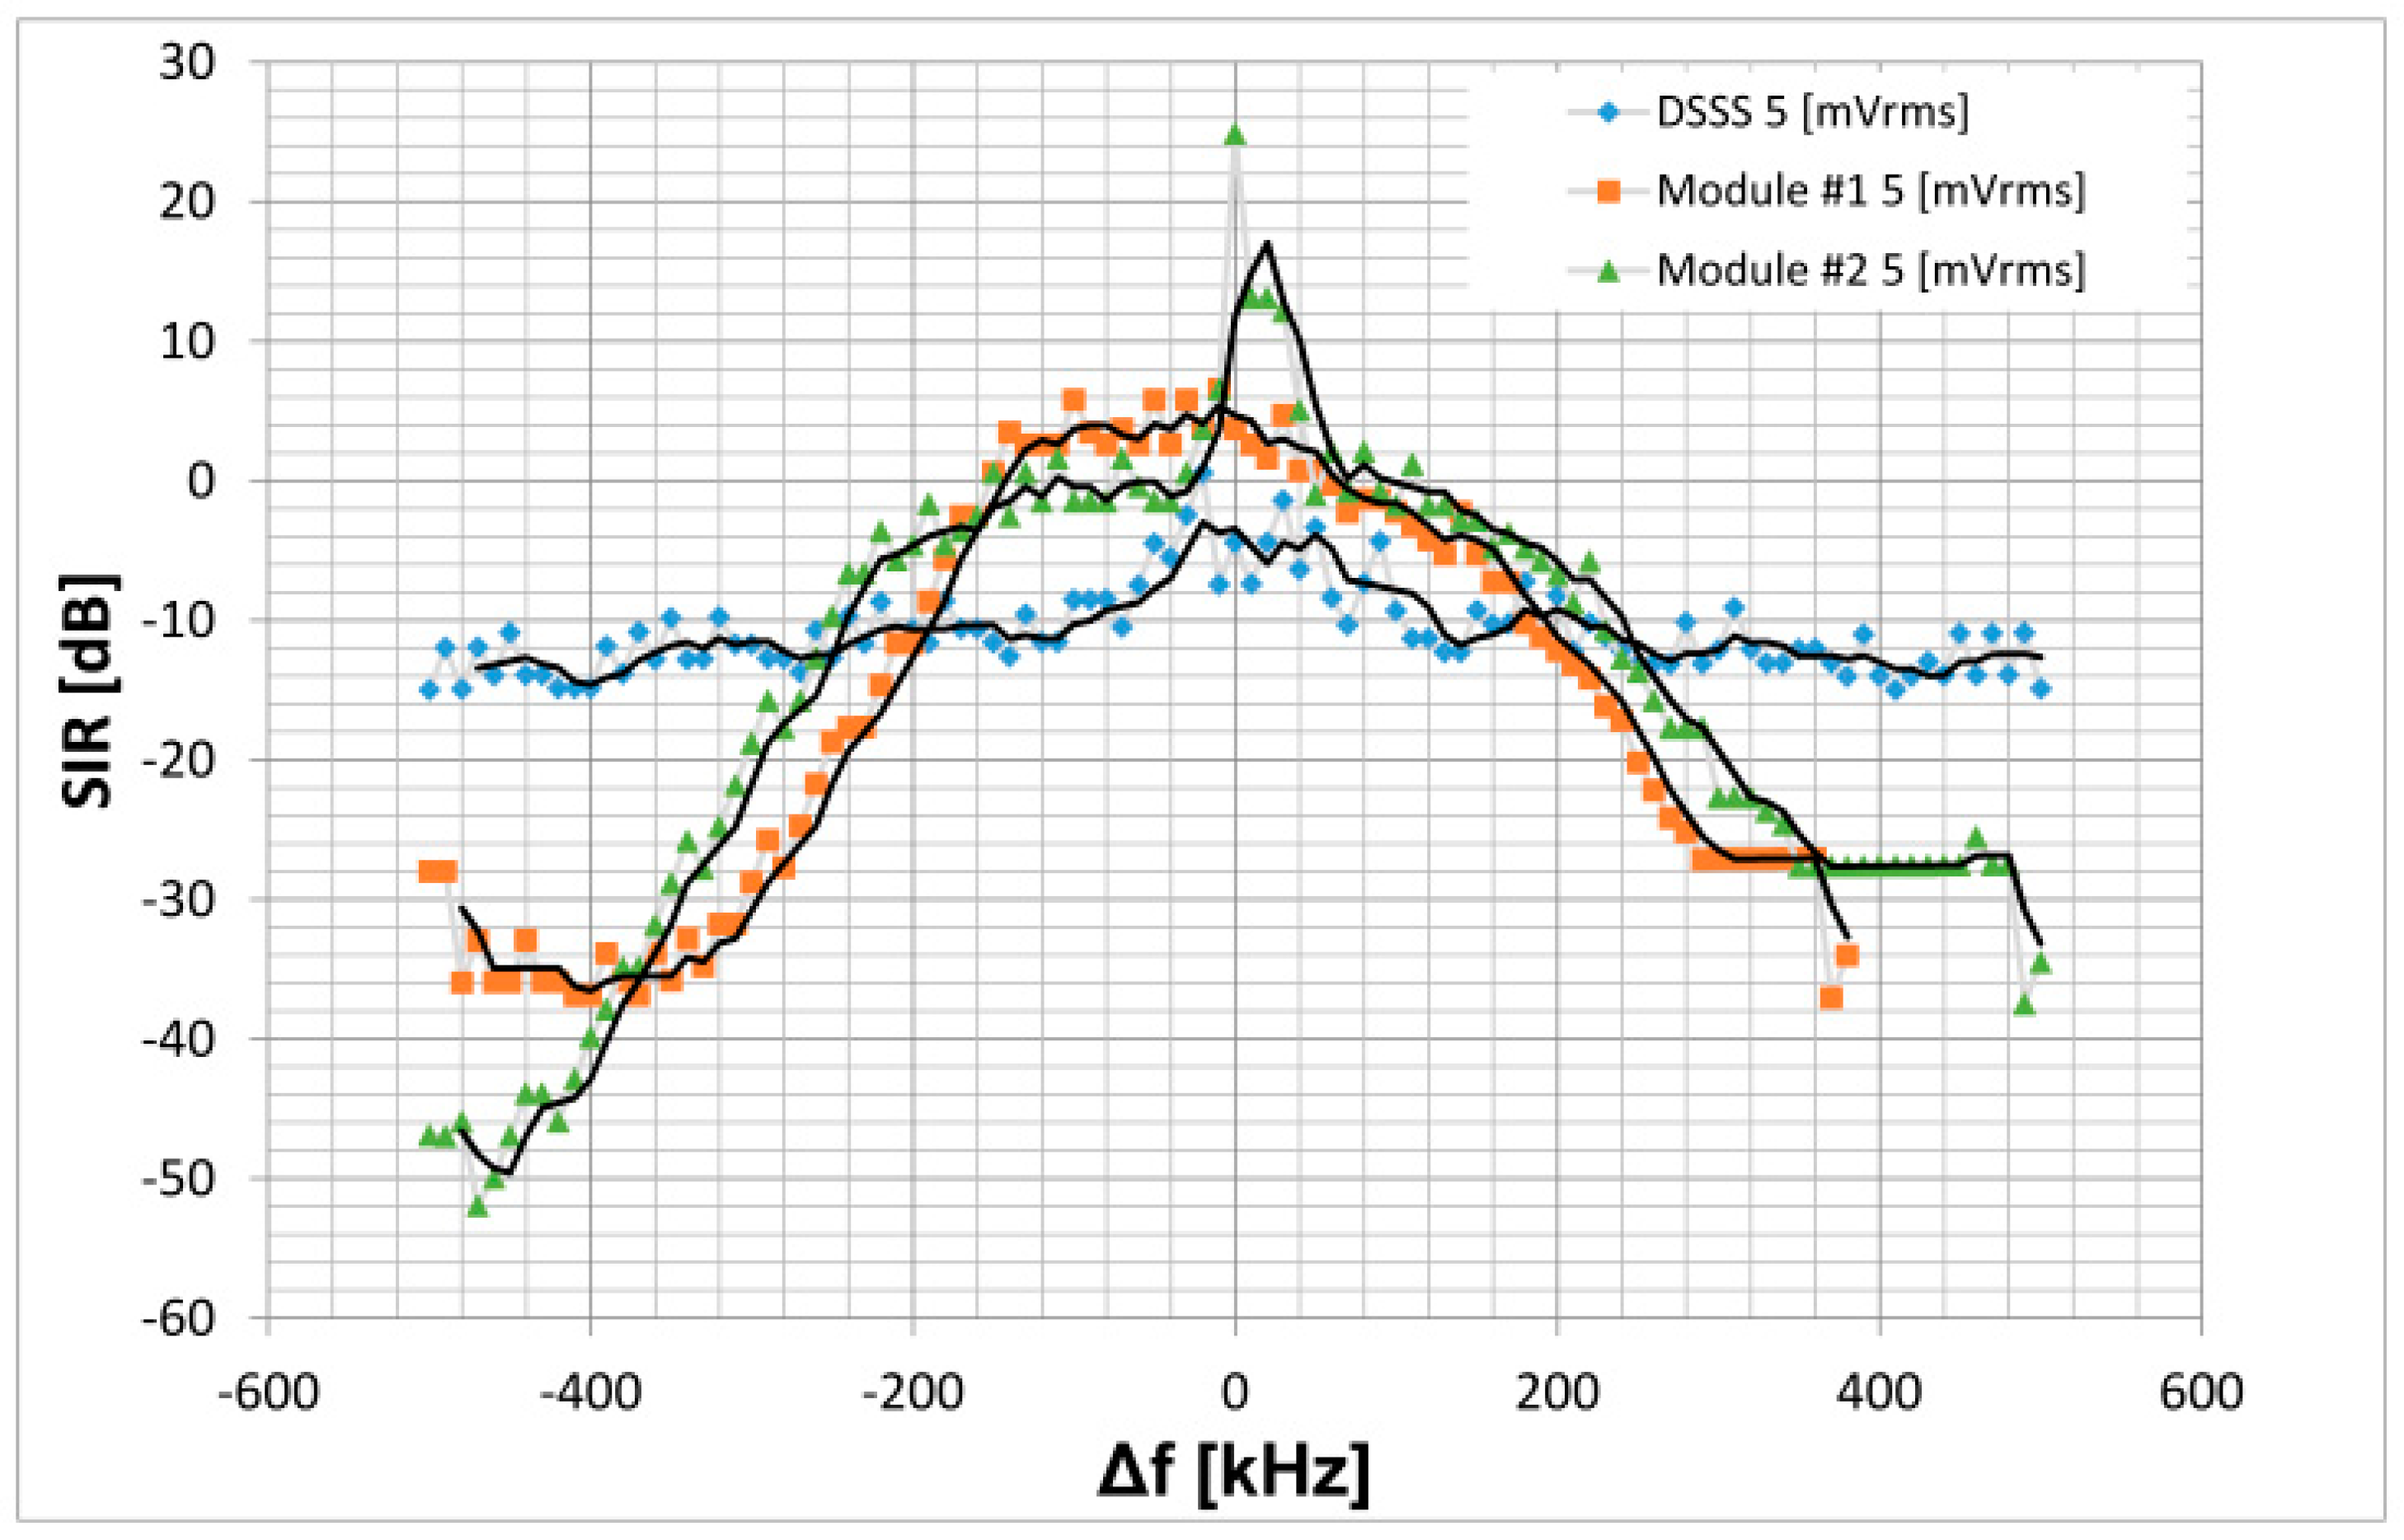
Figure 8. In general, the sensitivity to single-tone interference follows the characteristics of the BP-filter used and is highest in the passband (
Figure 9). Transmission methods having a process gain like DSSS can significant reduce the sensitivity to interferences. The low order and quality of the input filters of the DSSS system compared to module #1 and module #2, which uses ceramic filters of high quality, shows clear disadvantages against interference reduction for signals that are several hundred kHz away from the carrier. This fact should be improved in the next evolution of the DSSS system.
3.2. Sensitivity to AWGN on the Transmission Channel
The effect on bit, byte and packet errors under influence of additive white Gaussian noise (AWGN) on the transmission channel was investigated for all transceiver modules. The noise source for all measurements was a function generator (33250A, Keysight, Santa Rosa, CA, USA) with a noise bandwidth of 50 MHz. The transmission channel was modeled by a resistive damping network and the noise was supplied to the test setup as shown in
Figure 5. The numbers of corrupted bits, bytes, and LIN data packets were counted during transmission and the corresponding error rates were calculated. In general the
SNR on the transmission channel (
SNRc) can be calculated from the effective values of the modulation signal
usignal_rms and the noise signal
un_rms at the input of the receiver which were measured with a high-speed sampling oscilloscope:
The noise power was calculated by:
where
N0 is the single-sided spectral noise power density and
Bn is the noise bandwidth of the generator.
The noise bandwidth
Bn of the function generator used is 50 MHz according to the data sheet which was also validated by measurements. A simplified performance comparison of different transceiver modules under AWGN conditions can be made based on the
SNR on the transmission channel (
SNRc) and on the resulting data error rates
Pe which are depicted in
Figure 10. However, this comparison does not take into account the different system designs with regard to the possible data transmission rates and the necessary filter/noise bandwidths.
The DSSS transceiver is designed for a maximum data rate of 19.2 kbit/s where the commercial modules are designed for maximum data rates up to 115 kbit/s and, therefore, their receiving filter bandwidths. For data rates below the maximum possible data rate, the filter bandwidths of the receivers are not matched to the transmitted data rate. Compared to an ideally matched filter, there is an excess bandwidth which leads to a deterioration of the
SNR at the receiver’s decision unit. The
SNR per bit (
Eb/
N0) at the receiver’s sampler can be approximated by:
where
Rm is the symbol rate at the noise limiting filter. The filter used depends on the system design and can be for the baseband case a LP-filter or for the passband case a BP-filter. The message bandwidth
Bm is defined by the modulation format and the data rate. The noise bandwidth of the receiver filter used is
Bn_filter and
af is a factor that depends on the power loss of the message signal due to signal shaping by the receiver filter. The specific system parameters are given in
Table 1. As shown in
Figure 4, the noise bandwidth of the DSSS system is given by the integration filter which is realized by a 2nd-order active Sallen-Key low pass filter with a corner frequency of 8.8 kHz which is about
Rb/2. The noise bandwidth of the LP filter was found to be about 19.2 kHz. The low pass filter shapes the almost rectangular modulation signal into an approximately sinusoidal signal where the signal power changes by the factor
af.
The noise power limitation of transceiver module #1 is done by a 160 kHz BP-filter at the receiver’s frontend. A possible receiver structure for the used SDPSK modulation format is given in
Figure 11. As described in chapter II module #1 and #2 transmit a data bit by 3 chips with a chip time
Tc =
Tb/3. Therefore, the symbol rate
Rm on the channel is 3
Rb resulting in a passband message bandwidth
Bm of 3
Rb. Since a high-quality ceramic BP-filter is used (#773-0065, Oscilent Corporation, Irvine, CA, USA) the filter noise bandwidth of module #1 can be approximated with the filter bandwidth
Bn_filter =
BBP = 160 kHz. The signal shaping by the BP-filter can be neglected with respect to the message bandwidth due to the high excess bandwidth and, therefore,
af = 0 dB.
3.3. Calculation of the Bit Error Rate (Pe)
In all modules investigated, synchronous detection of the differential encoded symbols is done by a suppressed carrier tracking loop which is restoring the phase ambiguity (
Figure 4 and
Figure 11). For coherent detection of differentially encoded signals, the assumption is that the channel phase characteristic is constant during the
N-1th and the nth transmission intervals which is equivalent to requiring that the loop does not lose synchronism for at least two symbol periods. A general solution of the error probability
Pe for coherent detection of differentially encoded binary PSK signals [
29] is given by:
In the DSSS module, coherent demodulation of the differentially encoded phase-modulated signal (DE-BPSK) is used. Under AWGN conditions the probability of a bit error for DE-BPSK is given by
where the Euclidian distance for antipodal signal constellations like in DE-BPSK (
Figure 12)
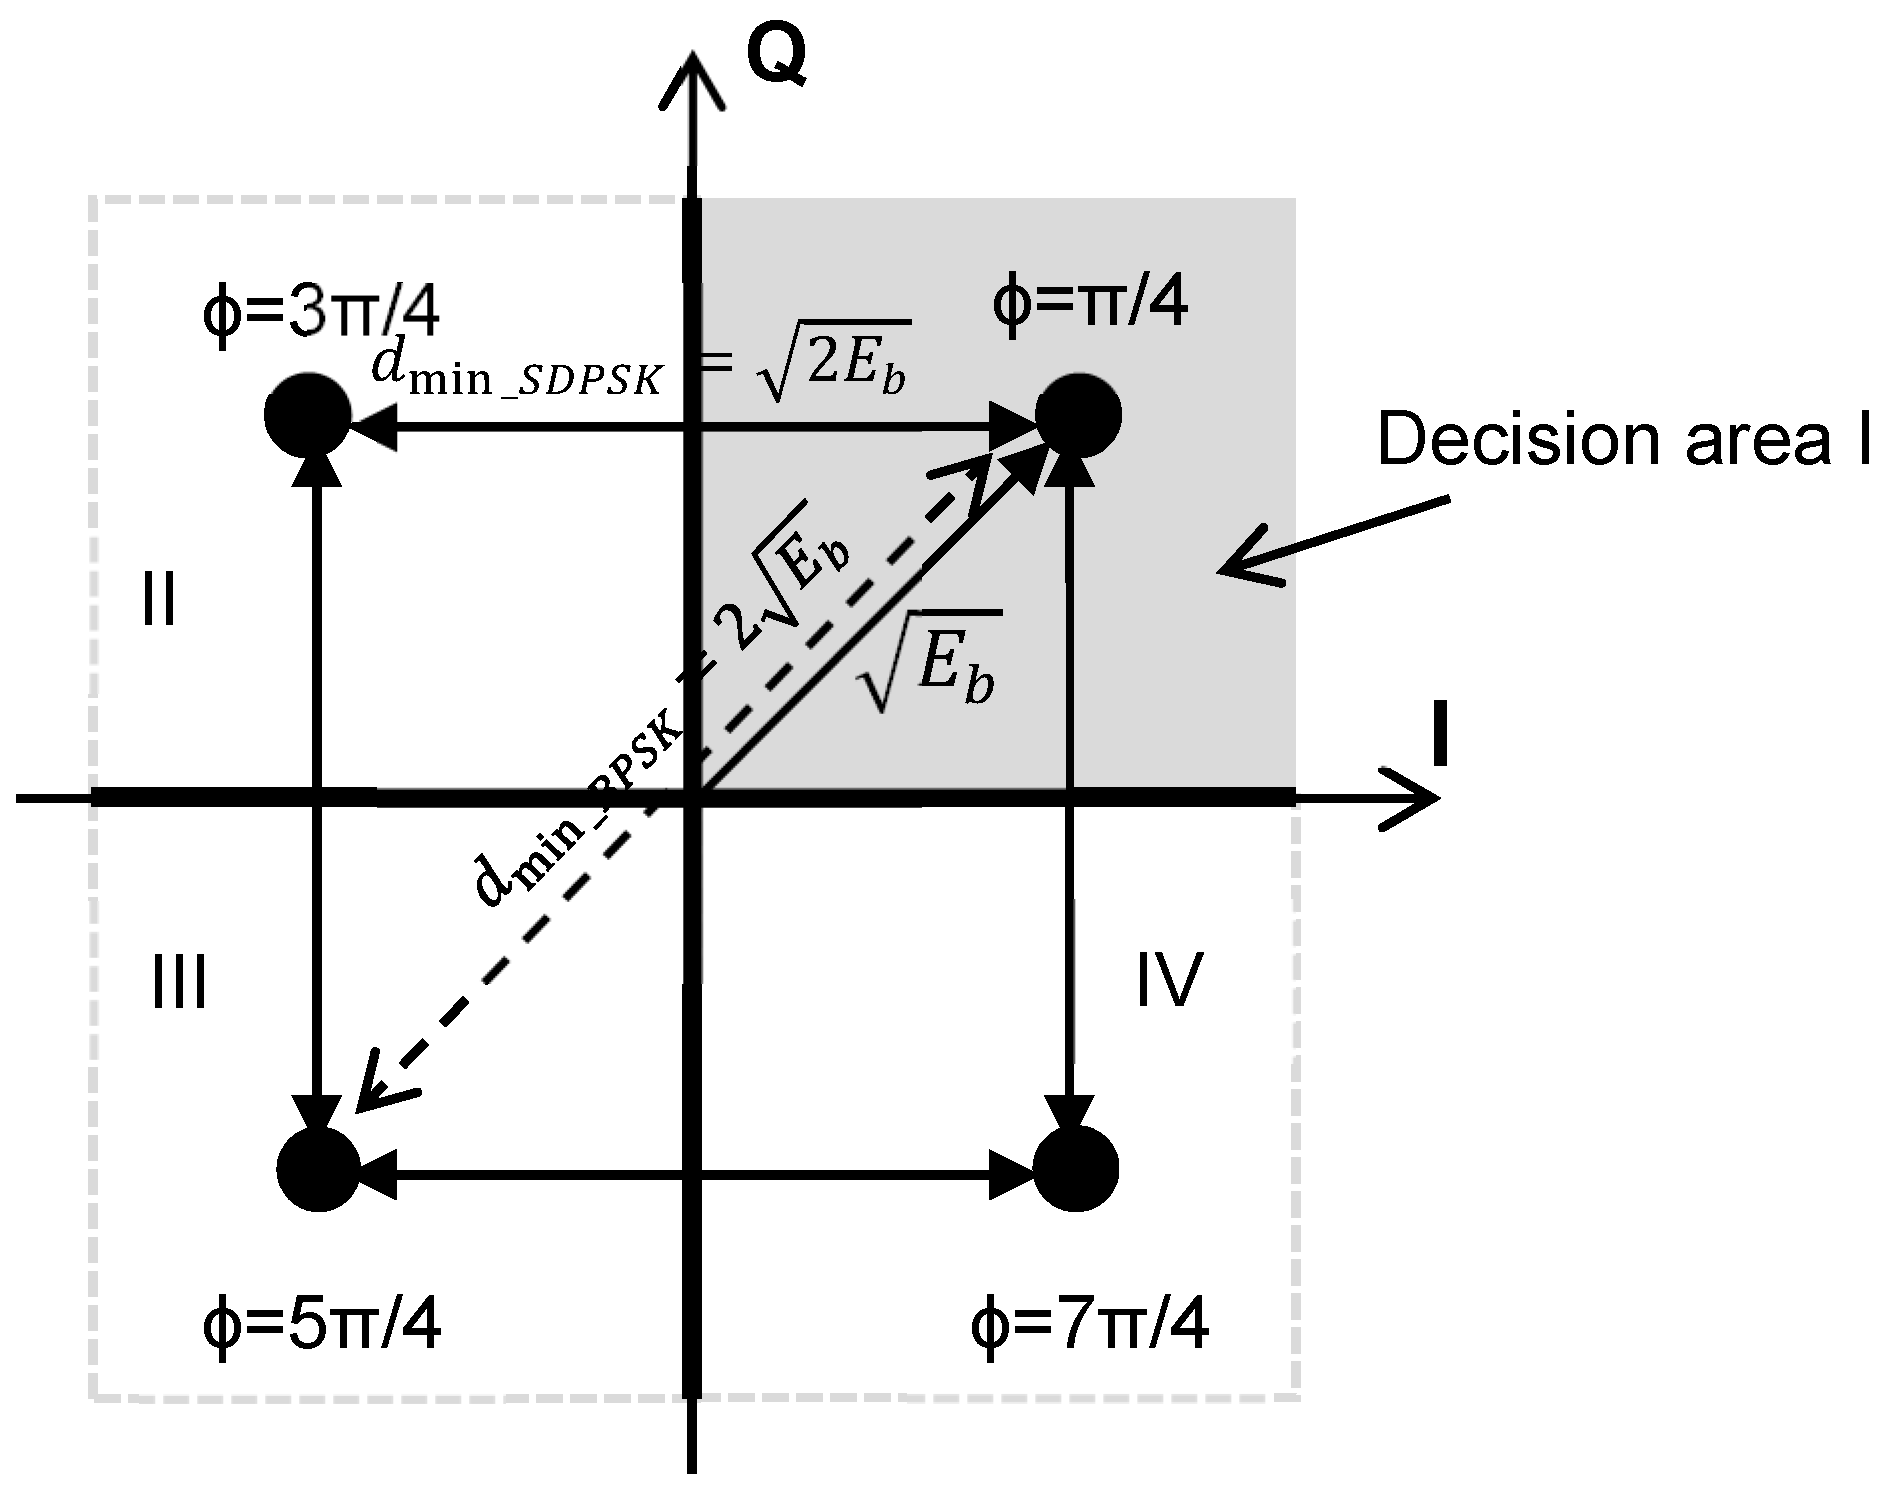
was substituted in Equation (6). The modulation format used in module #1 and #2 is SDPSK. In SDPSK the present symbol is either +π/2 or −π/2 in phase from the previous symbol, depending on whether an input data is ‘l’ or ‘0’. For symbol reconstruction 4 decision areas are necessary (
Figure 12). In DE-BPSK the Euclidian distance
dmin between 2 antipodal signal points is
despite to SDPSK where the distance is
because of the 4 decision areas necessary. Since coherent demodulation with differential decoding is used, Equation (6) is also valid for SDPSK under the assumption that
and therefore the bit error rate is:
The
SNR per bit (
Eb/
N0) at the receiver’s decision unit is calculated for all modules with Equation (5) and using
Table 1.
3.4. Calculation of the Byte Error Rate (Pe_byte)
If the bit transmission errors occur randomly and independently with probability
Pe the binomial frequency functions give the probability of errors in an
n-bit word:
The probability of at least one error in an
n-bit word without using forward error correction (FEC) is, therefore:
The DSSS modem transmits in the UART-mode single data bytes where each data byte is led by a start-bit and followed by two stop bits. A transmitted data byte, therefore, consists of a total of 11 bits, whereby each bit failure leads to a byte error. The probability of a byte error by given bit error probability
Pe_DE-BPSK is:
and is shown in the following figures.
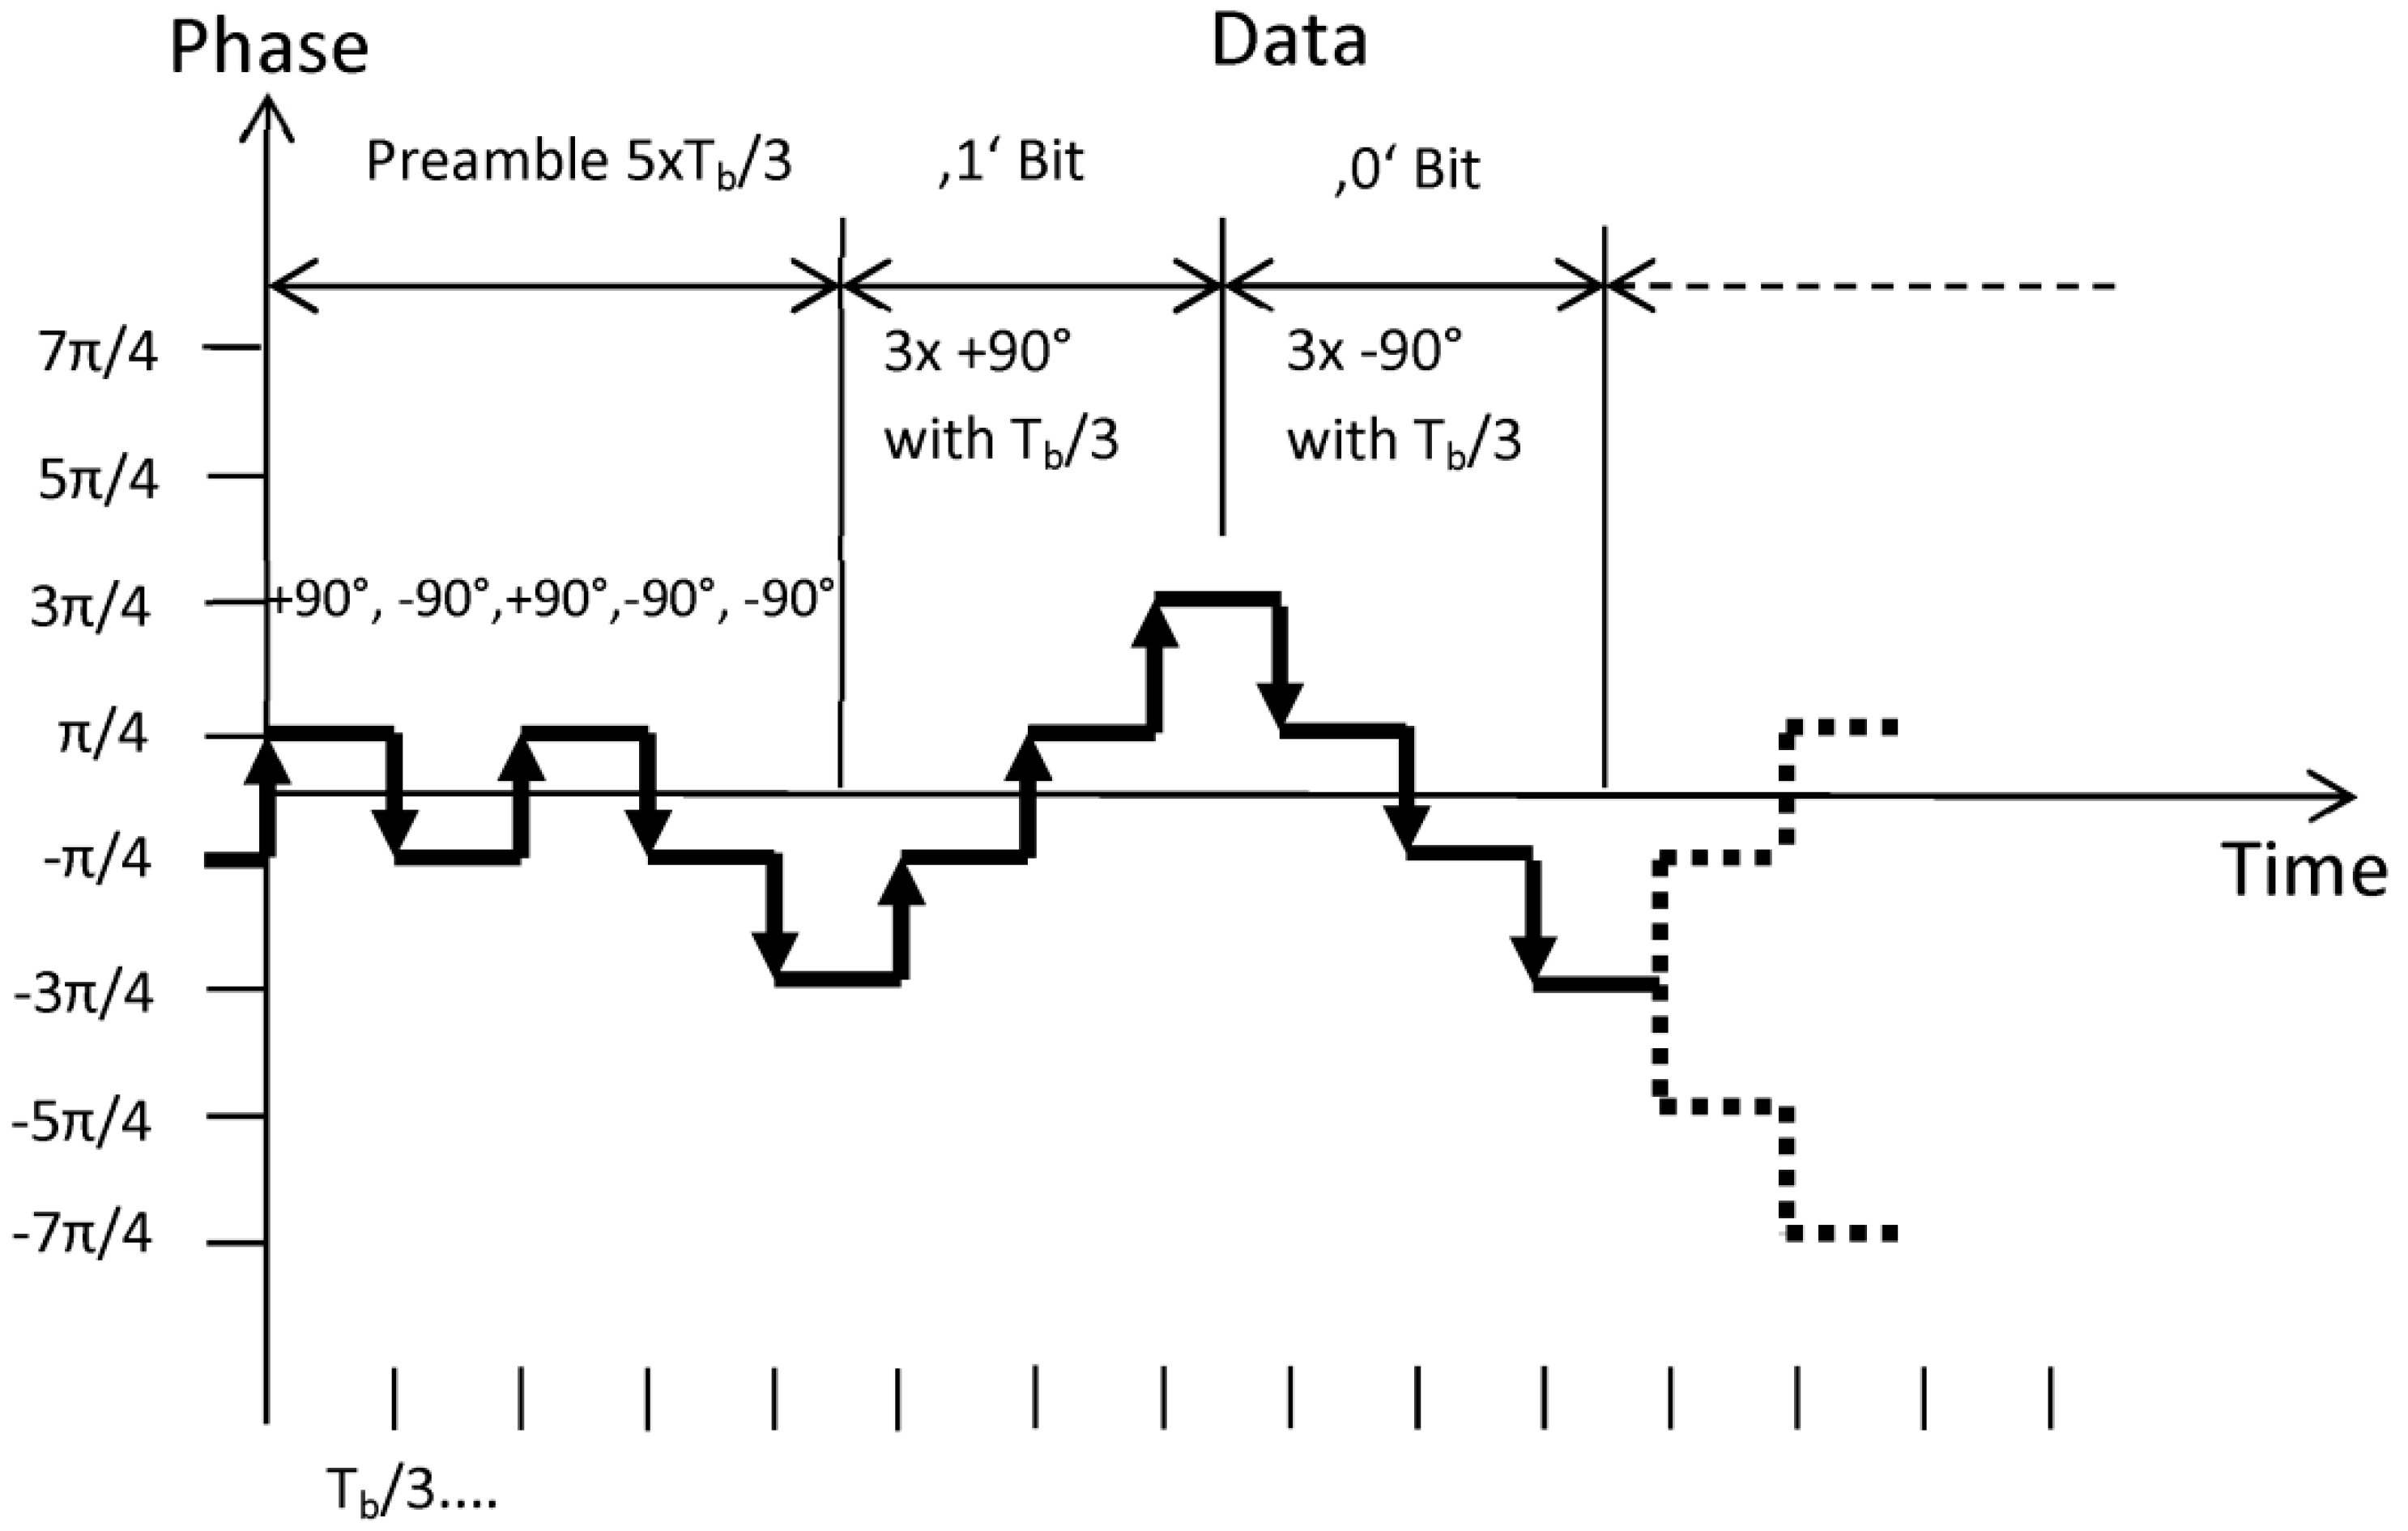
A different situation is given at module #1 and #2. The data transmission principle is based on symmetric differential phase-shift keying (SDPSK) [
30]. Symmetric DPSK is a quadrature version of differential phase-shift keying (DPSK) where the relative phase shift between successive symbols is either +90 or −90 degrees depending on whether a logic ‘1’ or ‘0’ is to be sent. Each data byte transmitted by modules #1 and #2 is started with a preamble consisting of 5 chips with a chip time duration
Tc =
Tb/3. A data bit is transmitted by three consecutive phase shifts of +90° for a ‘1′ data bit and three consecutive phase shifts of −90° for a ‘0’ data bit. Each phase shift has a time duration of
Tb/3 (
Figure 13). The preamble which is sent in front of each data byte consists of five chips with phase changes [+,−,+,−,−]·90° and total time duration 5·
Tc.
Each transmitted data byte is preceded by a preamble of five chips with chip time duration
Tc =
Tb/3. For this word (preamble) consisting of five chips the error probability can be calculated by:
where
Pe_SDPSK_chip is calculated from Equation (8) substituting the
Eb/
N0 by the SNR per chip
Ec/
N0 =
Eb/3
N0.
Subsequent to the preamble, a data byte with 11 bits where each bit consists of three chips with chip time duration
Tb/3 (
Figure 13) is transmitted. For a data bit consisting of three chips, a triple repetition code was used where a ‘1’ bit is represented by 111 chips and a ‘0’ bit is represented by 000 chips. With this encoding method a lower error probability is expected. Based on the majority-rule decoding of the triple repetition code, a single chip error can be corrected. That means and at least two of the three chips per bit must be correctly transmitted. Only double and triple errors result in a decoding error which can be formulated by:
The probability of a data byte error where the byte consist equal to the DSSS modem of a leading start-bit, eight data bits, and two stop bit is then:
As previously described a transmitted frame for a data byte by module #1 and #2 consists in total of a five-chip preamble and eight data bits with an additional one start and two stop bits. Thus, the total error probability of the transmitted frame is a combination of the preamble error probability
Pe_pre_M and the data bit error probability
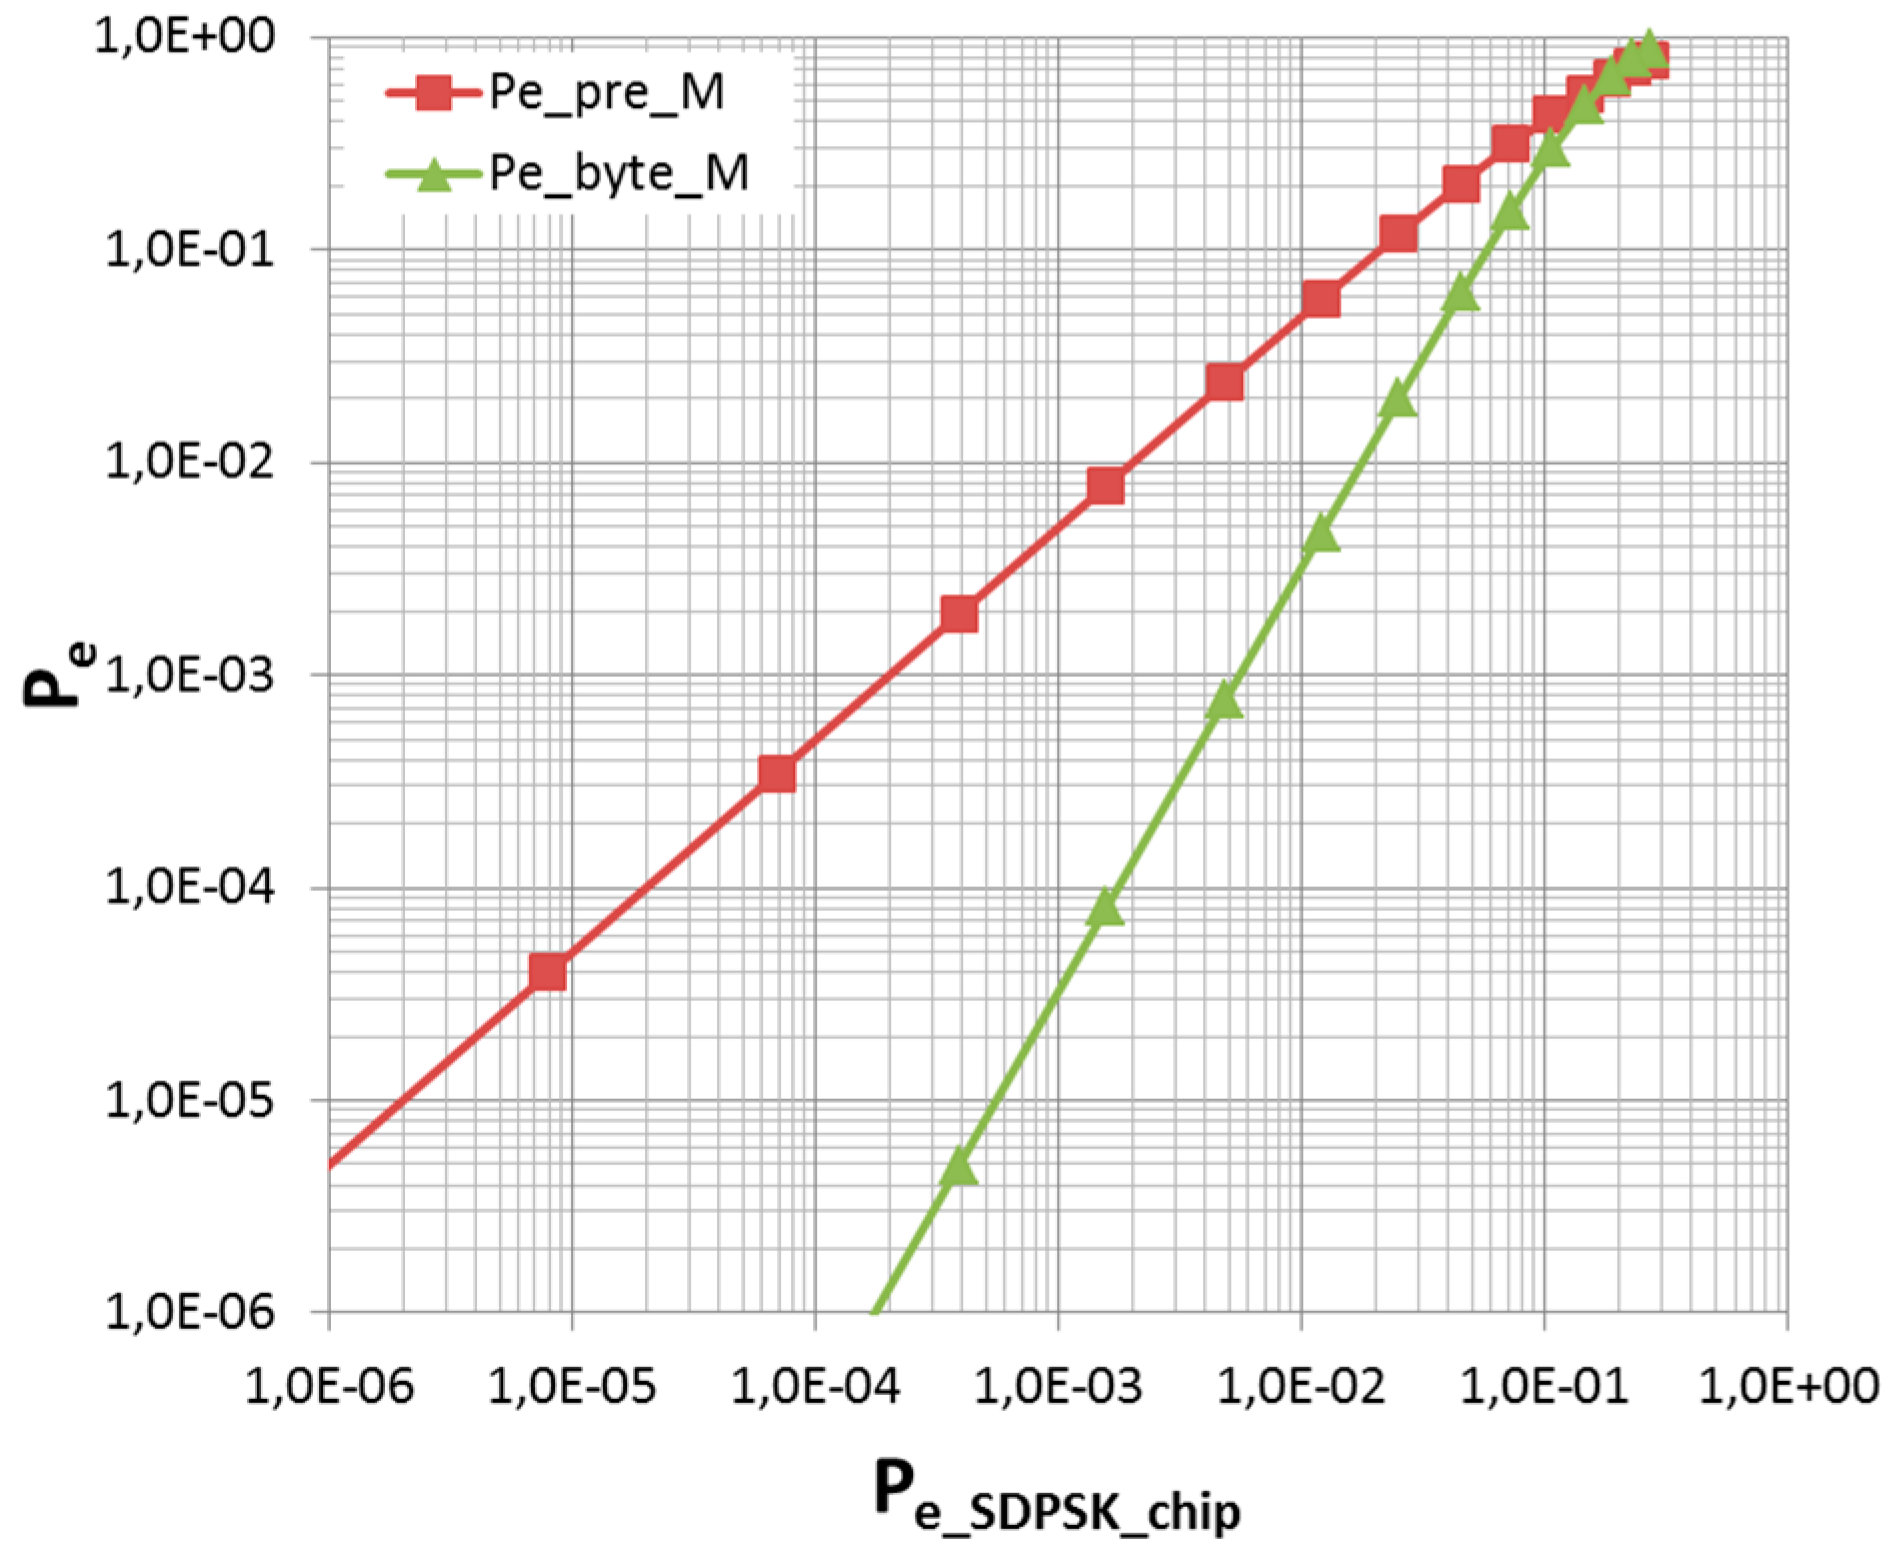
Pe_byte_M. Since a triple repetition code is used for the data bits, the probability of an error in the preamble is much greater than that of a data bit error. However, a single chip error in the preamble leads to a preamble error and thus to a loss of the full data byte. Both error probabilities are depicted in
Figure 14 for comparison. From theoretical calculations, it was found that the error probability of a data frame consisting of a five-chip preamble and a data byte depends mainly on the error probability of the preamble.
For a rough but reasonable performance estimate, the probability of a byte frame decoding error is given by the approximation:
In Equation (15), the number of decisions required to decode a preamble is given by Npre (Npre = 5), the number of decisions required to decode a data byte is Nbyte (Nbyte = 11) and Nframe is the total number of decisions required to decode a data byte frame, which is the sum of Npre and Nbyte.
3.5. LIN-Packet Error Rate (PER)
The format of a transmitted LIN-packet is given in
Figure 6. A LIN-packet error (
PER) was counted if the LIN preamble or one or more bytes of the transmitted LIN-packet payload were corrupted. The theoretical LIN-packet error rate was calculated under the assumption that in a corrupted LIN-packet at least one preamble chip or data bit is incorrect. The preamble of a LIN-packet consists of the ‘break-field’ (13 bit low) and the bytes B0 and B1 of 11 bit each. The ‘break-field’ is not part of the error analysis. The LIN preamble is followed by 8 payload data bytes and a terminating CRC byte where each byte contains an additional 1 start and 2 stop bits. Therefore, the total number of bits of a transmitted LIN-packet is
n = 121 bits (
Figure 6). The probability of at least one error in a transmitted LIN-packet of
n = 11 bytes·11 bits = 121 bits transmitted with the DSSS system and, thus, a LIN-packet error can be calculated by:
The commercial modules #1 and #2 transmit each of the 11 LIN-packet bytes with an additional preamble of 5 chips as discussed in chapter III.B.2. Due to the error correction capability by the triple repetition coding of the data bits, a LIN-packet error is therefore mainly caused by chip errors in the 11 data byte preambles with each consisting of five chips. The
PER based on chip errors in the preambles of one LIN-packet is given by:
and the
PER based on bit errors is given by:
For module #1 and #2 the overall probability of a LIN-packet error caused by an error in the preamble or a data bit error is:
where
NLIN_pre = 11 × 5 = 55 indicates the number of decisions necessary to decode all preambles,
NLIN_bit = 11 × 11 = 121 indicates the number of decisions necessary to decode all bits and
NLIN is the total number of decision necessary to decode a LIN-packet (
NLIN =
NLIN_pre +
NLIN_bit = 176).
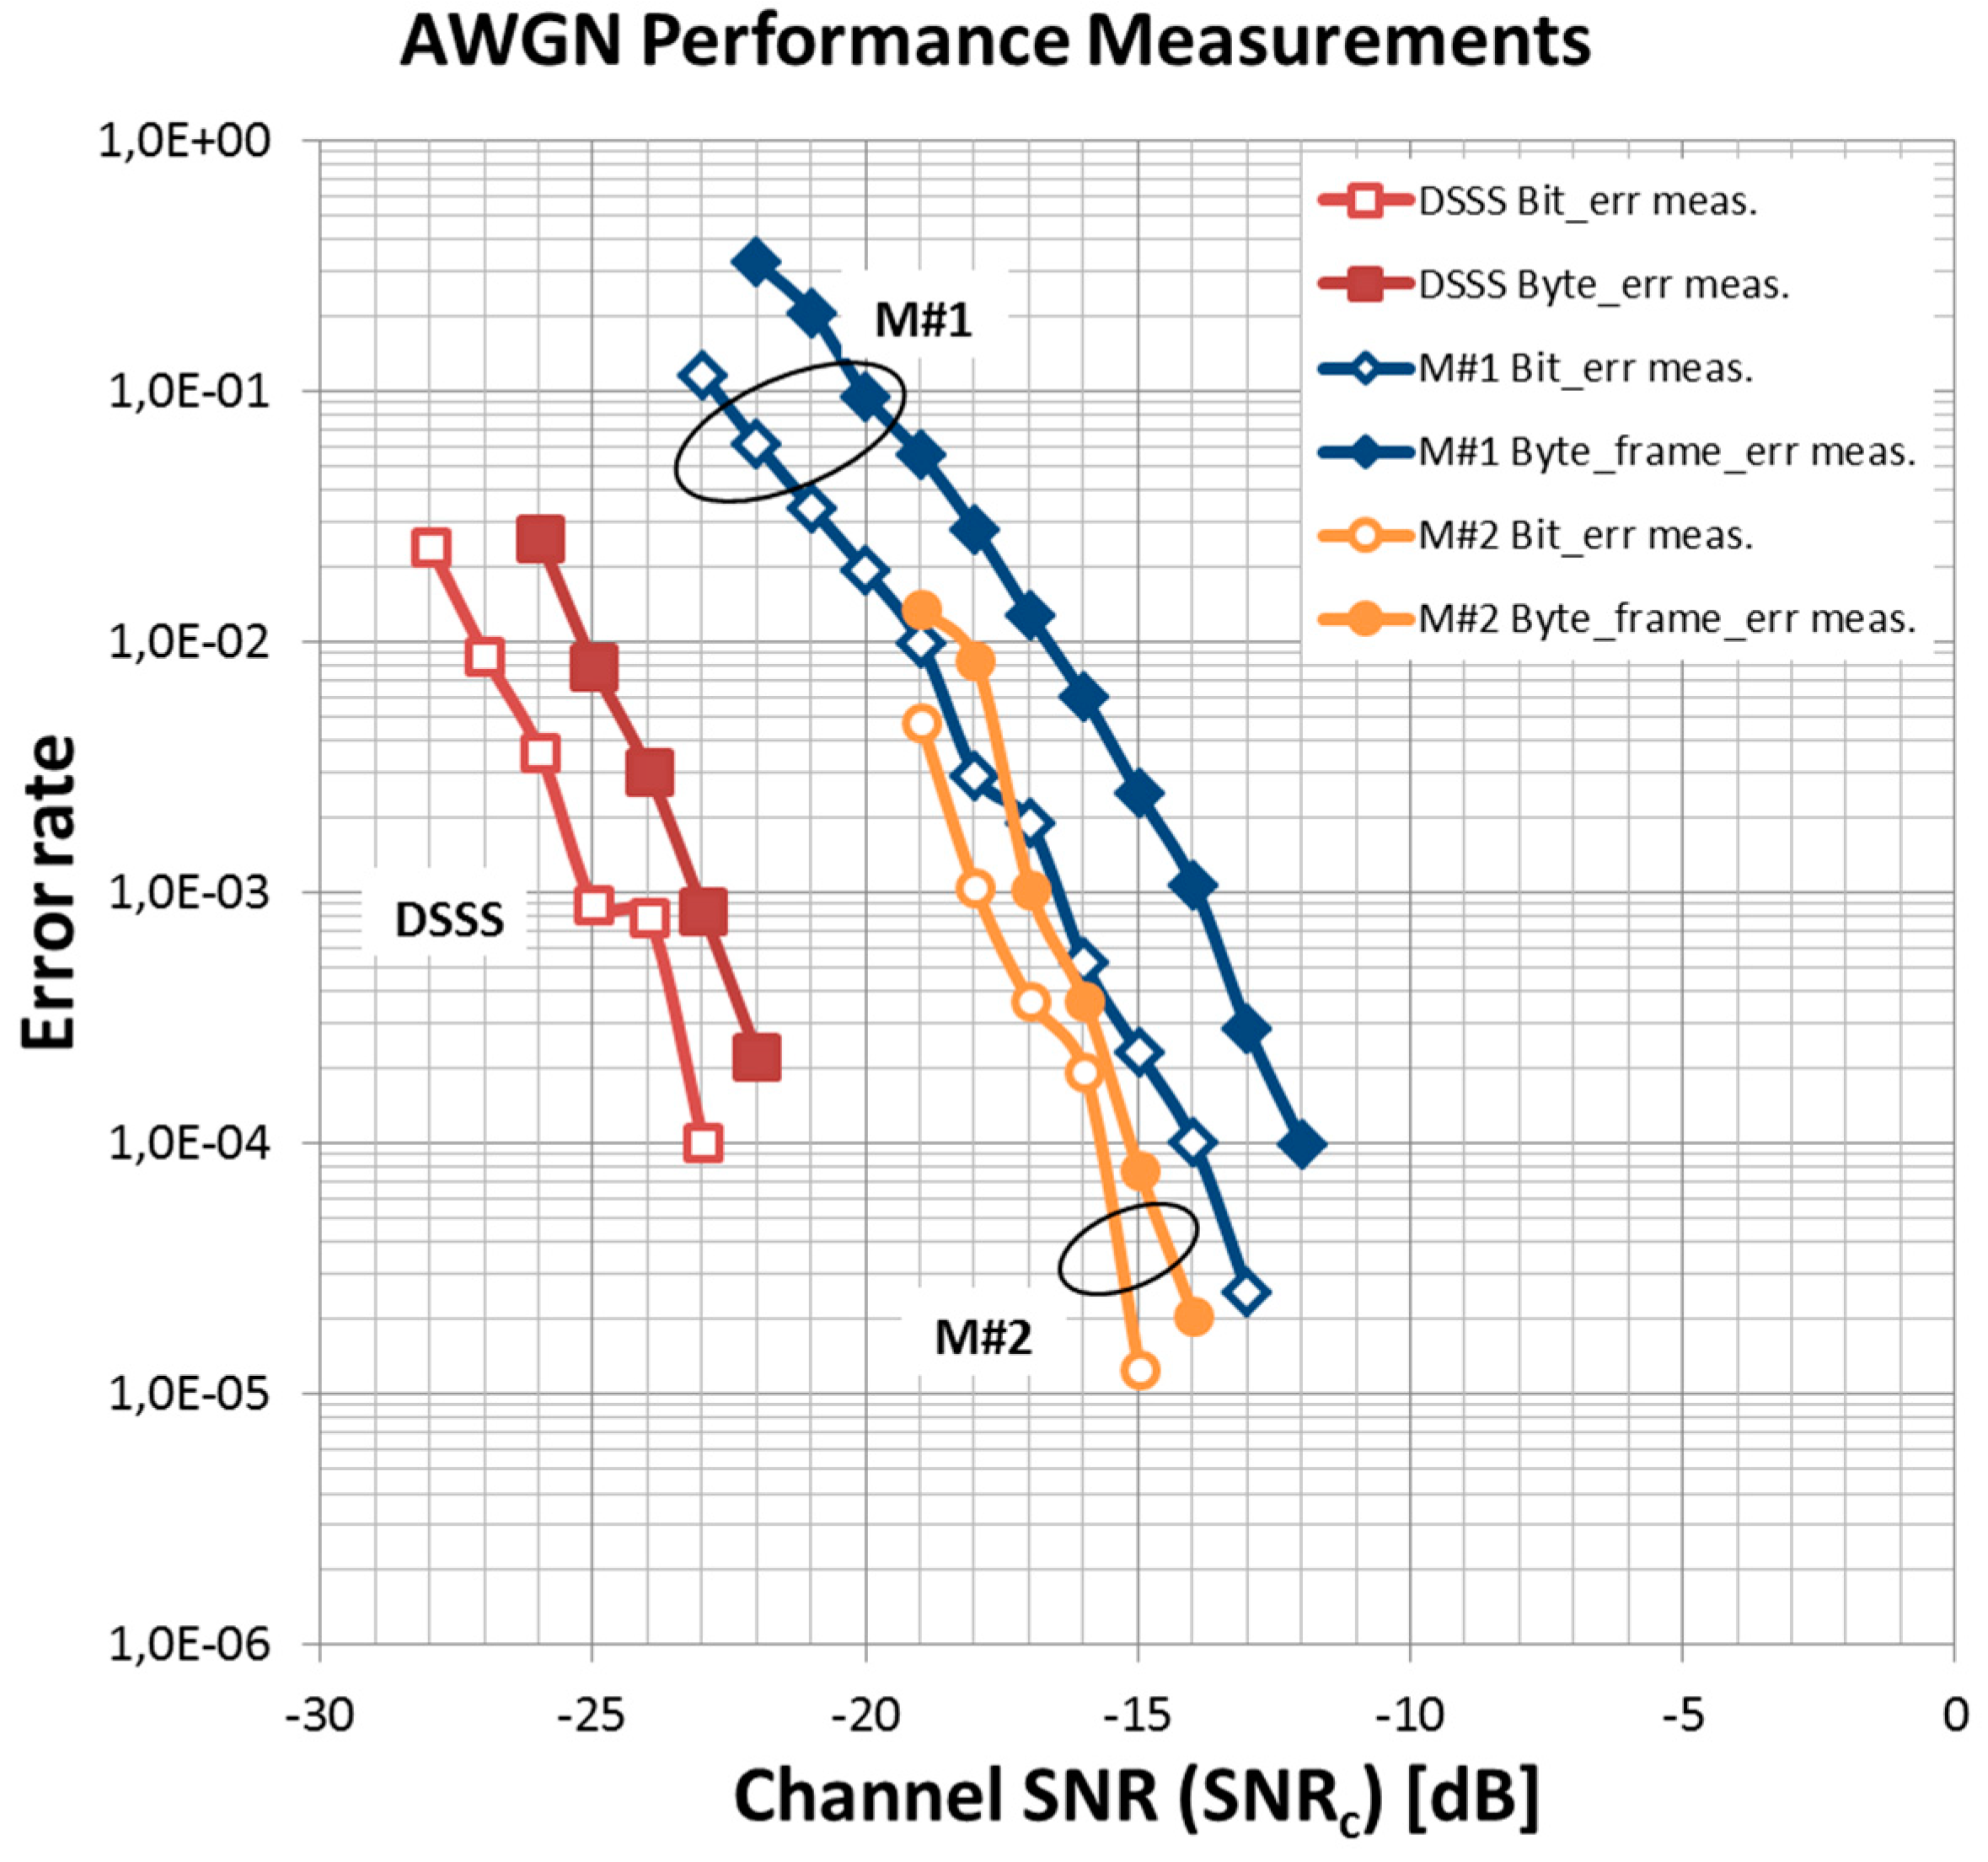
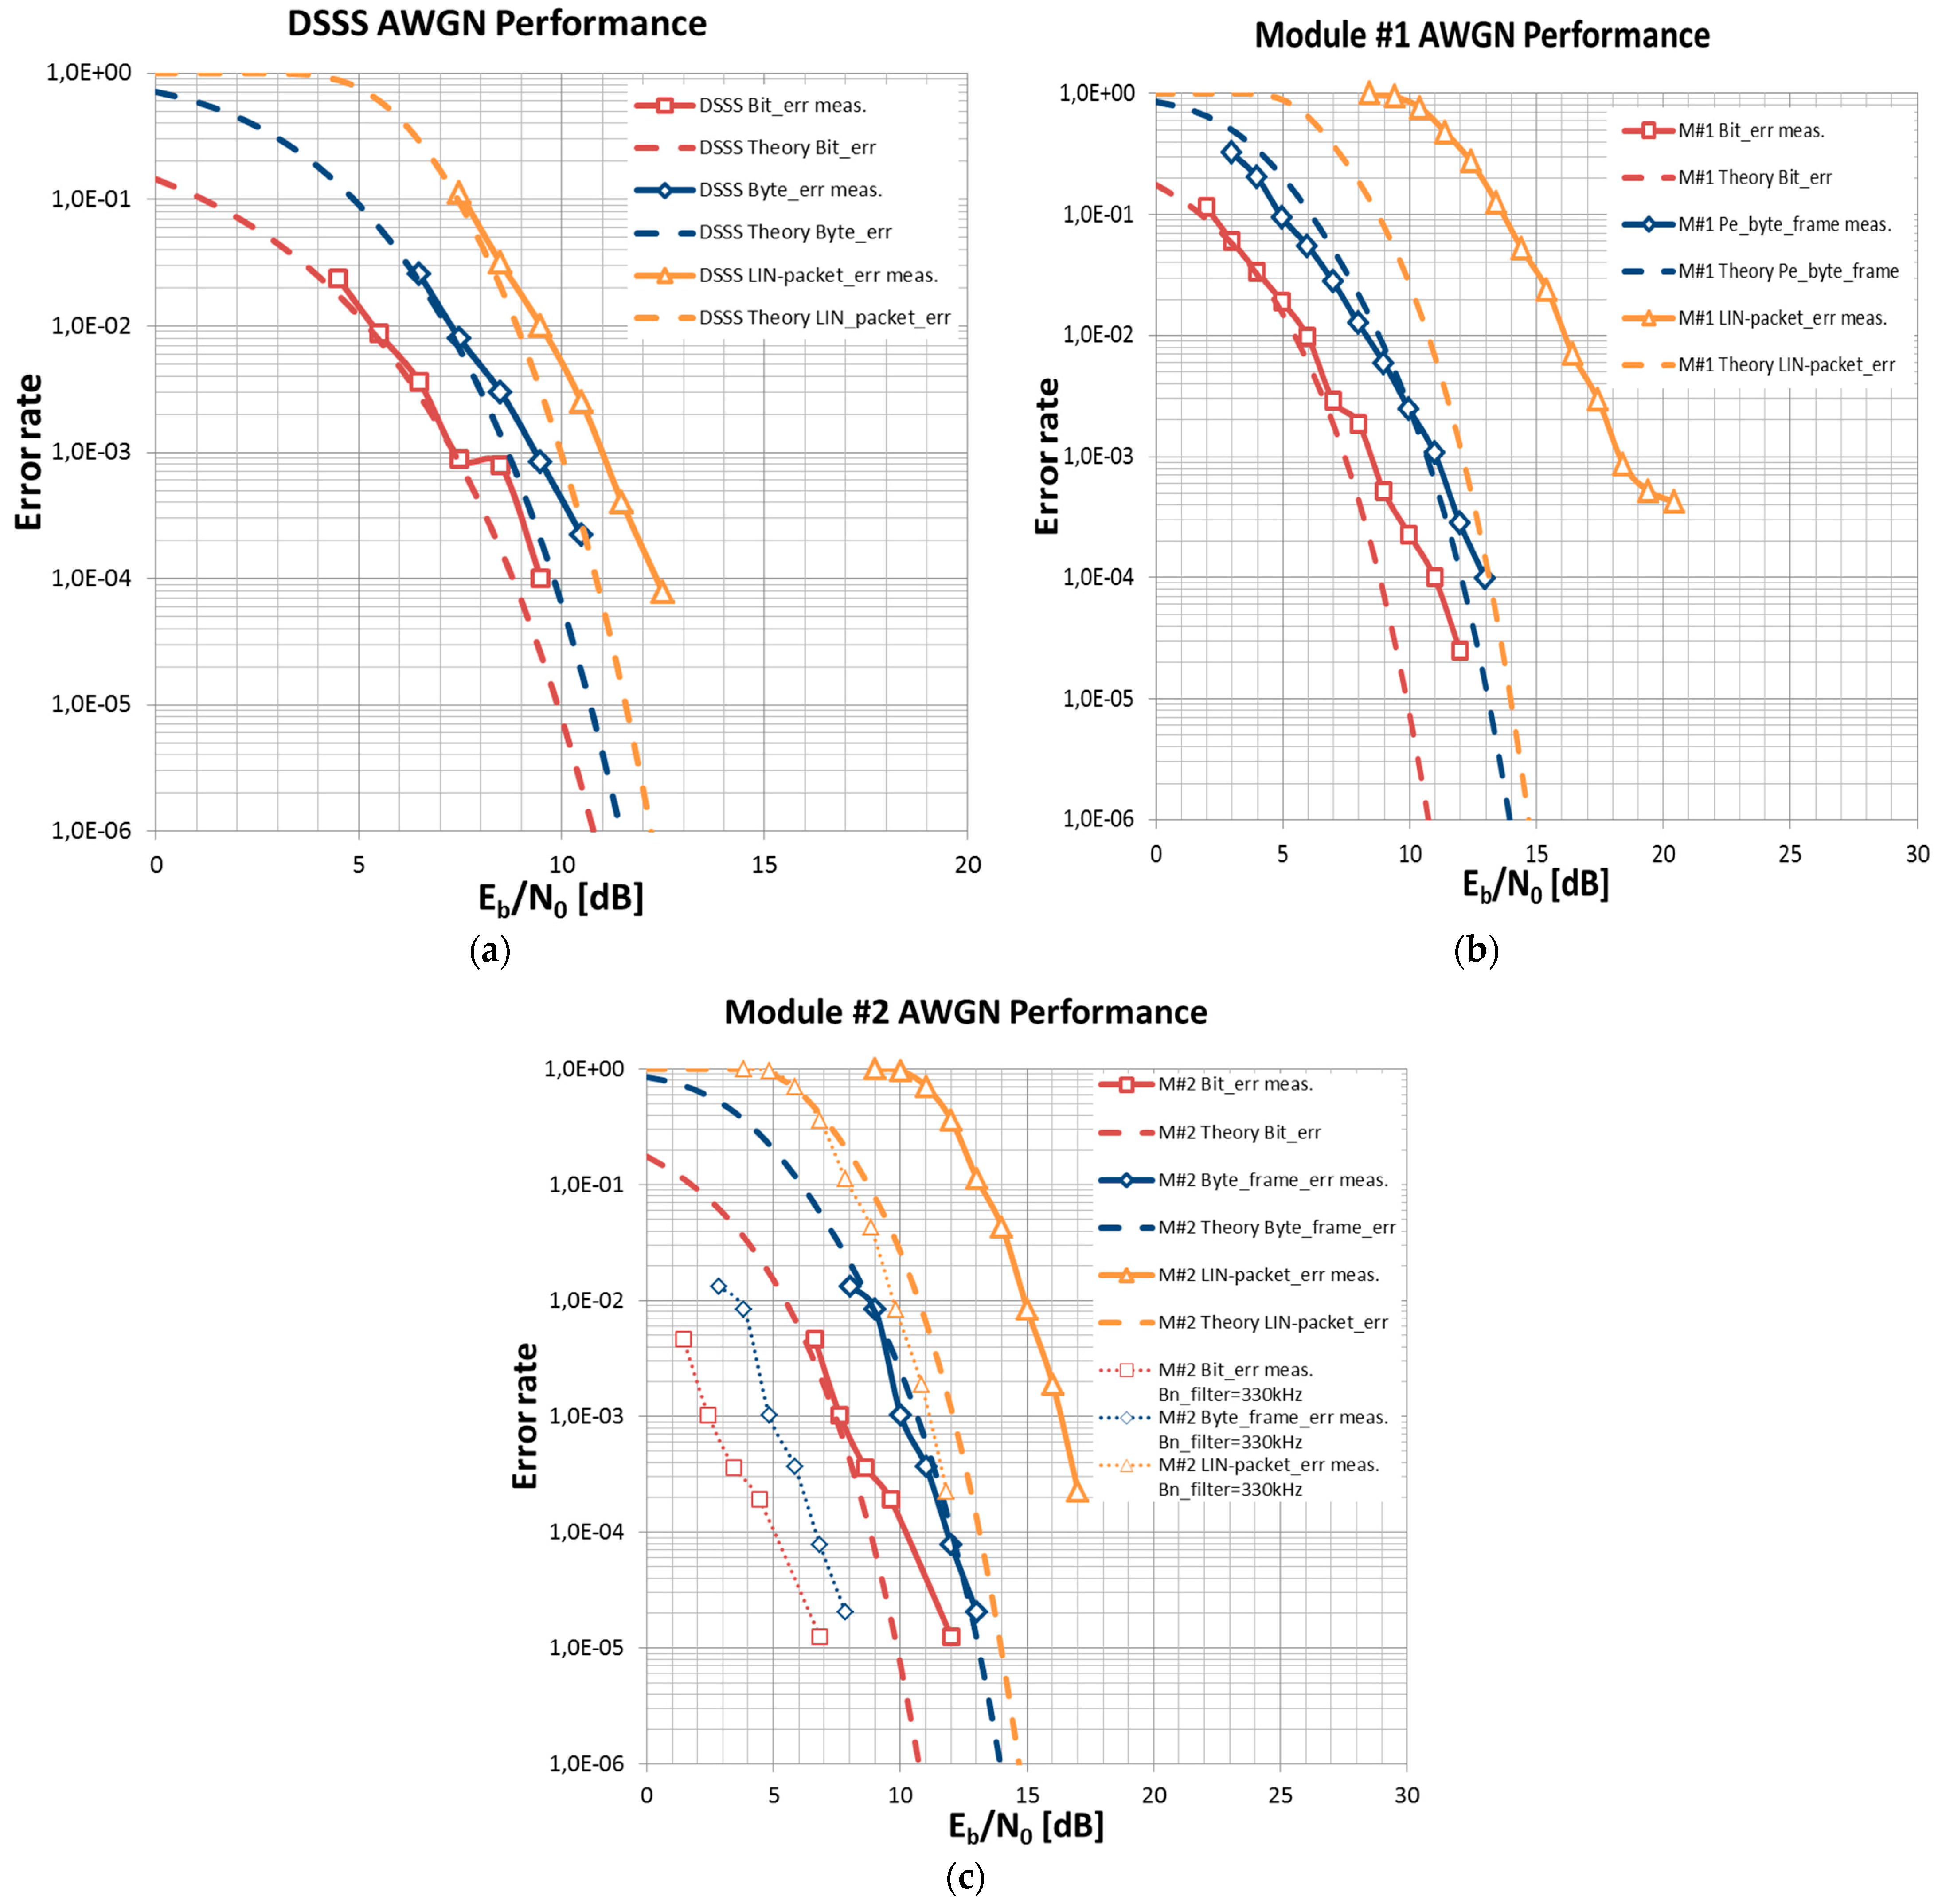
In
Figure 15a–c a comparison of the theoretical and the measured bit error rates (
BER), byte error rates (
Byte_err) and packet error rates (
PER) for all transceiver modules are given. All measurements were repeated three times and the mean values are depicted. The AWGN performance of the DSSS transceiver
Figure 15a fits excellent with theories given in Equations (8), (11), and (16) using the system parameters given in
Table 1. Only for low error rates do the measurements show a degradation in performance with respect to the theory. This might be caused by jitter in the carrier recovery loop.
The AWGN performance of the commercial modules #1 and #2 is given in
Figure 15b,c. A direct conversion receiver is used in module #1 and a superhet receiver in module #2. The performance of the bit-error rate and the byte-frame error rate of module #1 show a good fit to the theoretical calculations which are given in Equations (13), (15), and (19) using the system parameters of
Table 1. From the measurements, we found that the noise filter bandwidth of module #1 was determined by the bandwidth of the ceramic frontend filter (
Table 1) and fit excellently to the theoretical predictions. However, in module #2 the obtained measurement results do not match to the noise bandwidth of the IF filter (
Table 1, dotted lines in
Figure 15c). Based on the measurement results, we assume that module #2 contains an internal digital filter with a filter noise bandwidth of about 100 kHz in addition to the IF filter. This assumption also supports the minimum channel spacing of 100 kHz mentioned in the datasheet. Based on the assumption of an approximate filter noise bandwidth of
Bn_filter = 100 kHz, the measurements obtained fit exactly to the theoretical prediction shown in
Figure 15c. This confirms that the system design of the commercial modules has been largely optimized. The significant deviation of the LIN-packet error rate from the theoretical prediction for both modules could not be clearly explained. Especially for module #1 it could be found that, at a low SNR, a valid preamble was erroneously detected in transmission breaks and, thus, the following noise was erroneously decoded as a data byte leading to an increased error rate. If these de-coding errors occur during LIN-packet transmission, LIN-packets are erroneously decoded and the packet error rate can increase considerably.


