Article

An Accuracy Improvement Method Based on Multi-Source Information Fusion and Deep Learning for TSSC and Water Content Nondestructive Detection in “Luogang” Orange

1
Public Monitoring Center for Agro-Product of Guangdong Academy of Agricultural Sciences, Guangzhou 510640, China
2
Guangdong Academy of Agricultural Sciences, Guangzhou 510640, China
3
College of Engineering, South China Agricultural University, Guangzhou 510640, China
4
Department of Plant Pathology, University of Florida, 2550 Hull Road, Gainesville, FL 32611, USA
*
Author to whom correspondence should be addressed.
Electronics 2021, 10(1), 80; https://doi.org/10.3390/electronics10010080
Submission received: 6 December 2020 / Revised: 25 December 2020 / Accepted: 27 December 2020 / Published: 4 January 2021
(This article belongs to the Collection Electronics for Agriculture)

Abstract

:
The objective of this study was to find an efficient method for measuring the total soluble solid content (TSSC) and water content of “Luogang” orange. Quick, accurate, and nondestructive detection tools (VIS/NIR spectroscopy, NIR spectroscopy, machine vision, and electronic nose), four data processing methods (Savitzky–Golay (SG), genetic algorithm (GA), multi-source information fusion (MIF), convolutional neural network (CNN) as the deep learning method, and a partial least squares regression (PLSR) modeling method) were compared and investigated. The results showed that the optimal TSSC detection method was based on VIS/NIR and machine vision data fusion and processing and modeling by SG + GA + CNN + PLSR. The R2 and RMSE of the TSSC detection results were 0.8580 and 0.4276, respectively. The optimal water content detection result was based on VIS/NIR data and processing and modeling by SG + GA + CNN + PLSR. The R2 and RMSE of the water content detection results were 0.7013 and 0.0063, respectively. This optimized method largely improved the internal quality detection accuracy of “Luogang” orange when compared to the data from a single detection tool with traditional data processing method, and provides a reference for the accuracy improvement of internal quality detection of other fruits.

1. Introduction

The “Luogang” orange [1] is a national geographical indication product of China (No. DB44/T1258-2013), and is famous for its high total soluble solid content (TSSC) and water content. In recent years, the cultivated area and yield for this type of orange has decreased from a previous high of 1067 hectares and 20,000 tons to current levels of 607 hectares and 2500 tons. The reason for this decline is due to the uneven color and rough texture of “Luogang” orange pericarp, which leads the consumer to mistakenly believe that the product is of poor quality inside. “Luogang” orange are mainly planted by private investors with no unified planting standard, and this result in highly variable fruit quality. Thus, market competitiveness promotion is vital for saving the “Luogang” orange industry. Today, accurate nondestructive detection technology plays an increasingly important role in the fruit industry, and usually involves spectroscopy [2,3], machine vision [4,5], and electronic nose [6,7], etc., to acquire the quality information of fruit quickly, accurately, and nondestructively. With efficient nondestructive detection technology, the TSSC and water content of “Luogang” orange can be quantified to highlight its advantages, and defective fruit can be eliminated to guarantee uniform fruit quality at the market. However, the internal quality nondestructive detection effect of fruit like “Luogang” orange is usually unsatisfied due to the uneven appearance would affect the stability of detection signal.
Currently, visible/near infrared spectroscopy (VIS/NIR) is the most efficient nondestructive TSSC [8] and water content [9] detection method, and has been widely applied for the quality detection of fruits like orange [10], apple [11], peach [12], pear [13], watermelon [14], kiwi [15], etc. The absorbance of VIS/NIR is mainly affected by the stretched vibration overtones and combination modes of hydrogen-containing groups (X–H) including O–H, N–H, C–H, S–H [16], which makes VIS/NIR sensitive to TSSC and water content differences. However, nondestructive detection is a complex process and the computation from sensor signal to detected value can be influenced by many factors like irrelevant component content, texture, shape, color differences, etc. [17,18,19]. Thus, as a variety with large external physical differences between individual fruit, the feasibility of the nondestructive detection of TSSC and water content of “Luogang” orange by VIS/NIR has not yet been reported. The external features of fruit acquired by machine vision [20] are insufficient for the detection of internal qualities such as TSSC and water content.
Likewise, the electronic nose [21], which is a method for the nondestructive acquisition of fruit volatiles, produces a signal inadequate for the detection of internal fruit quality. Even though the fruit appearance and volatile features acquired by machine vision and electronic nose are not independently capable of providing an accurate prediction of internal quality, some correlation has been found [22,23]. Thus, multi-source information fusion (MIF) [24] could be a potential way to improve TSSC and water content detection accuracy. MIF is a sophisticated estimation process that allows users to assess complex situations more accurately by effectively combining core evidence from the combined, but sometimes diverse and conflicting data sets received from multiple sources. Deep learning [25] is part of a broader family of machine learning methods based on artificial neural networks with representation learning which uses multiple layers to progressively extract higher level features from raw data. Compared to MIF, which improves detection accuracy by acquiring more comprehensive information from multi-sources, deep learning improves detection accuracy by mining information more rigorously than regular machine learning methods can achieve. Our previous research [26] proved that a combination of MIF and deep learning can usually improve internal fruit detection accuracy; however, it also can introduce redundant information which may ultimately reduce the detection accuracy. Thus, whether MIF combined with deep learning can achieve reliable and accurate nondestructive “Luoang” orange TSSC and water content detection requires further research. Comparing with our previous research, which proved the efficiency of VIS/NIR and E-nose data fusion to improve the accuracy of tea quality detection, this research would add machine vision as a new fused data, which can guarantee the detection speed in the meanwhile (E-nose cannot), if the accuracy improvement is possible.
In this study VIS/NIR, machine vision, and electronic nose were all individually used to acquire physical characteristic data from “Luogang” orange, and the accuracy of TSSC and water content detection of each method was compared. Then, traditional data preprocessing, MIF and deep learning was applied to test for an improvement in detection accuracy. The research results provide an efficient “Luogang” orange TSSC and water content detection method for the industry.

2. Materials and Methods

2.1. ”Luogang”Orange Samples

All “Luogang” oranges were harvested in the Luogang district, in the city of Guangzhou, Guangdong province, China, and immediately shipped to our lab. A total of 106 defect-free orange samples were picked out, stems and leaves were removed, the outside of fruit were cleaned with a wet cloth, and finally fruit were stored at 25 °C indoors for 3 h before sampling.

2.2. Nondestructive Sampling Platforms

Our lab developed a VIS/NIR spectrum platform which was applied for orange internal information sampling. To reduce external light, orange samples were measured in a dark box. In consideration of the practical needs for rapid assembly line detection, a movable tray was applied to convey and stabilize each tested orange. Light from a 100W halogen lamp was transmitted through the orange and translated into a digital signal by two spectrometers (QE PRO with wavelengths of 400–1100 nm and NIR QUEST with wavelengths of 900–1700 nm, Ocean Optics Inc., Dunedin, FL, USA). Combined, transmitted light between 400 and 1700 nm was recorded. For sampling, light was transmitted through orange fruit along three axes (from stem end to blossom end, from blossom end to stem end, and equatorial), with spectrum signal wavelengths of 400–1050 and 1050–1700 nm acquired by the QE PRO and the NIR QUEST spectrometers, respectively. The pre-sampling process was: (1) measure value of darkness D, (2) offset the darkness value (D of NIR QUEST plus the difference between D from the QE PRO and D from the NIR QUEST at 1050 nm), and (3) measure a reference value R (3.6 cm thick calibrated barium sulfate spectral panel). Finally, with the orange sampling detector response value P, the orange transmissivity was equal to (P−D)/(R−D).
Our lab-developed machine vision platform was used for sampling the outside features of the oranges. The machine vision platform includes a commercial RGB camera (DFK 33GP006, The Imaging Source Asia Co., Ltd. Taipei City, Taiwan, China) with a 8 mm focal length c-mount lens (M0814-MP, CBC Co., Ltd., Tokyo, Japan). Two linear ring-shaped lights (1.92 W) were mounted above the fruit level and adjusted manually at an angle of about 45° to illuminate the camera’s field of view. Two linear strip-type lights (0.96 W) were mounted on opposite sides of the fruit and adjusted manually to an angle of about 15° to eliminate shadow. All of the components were fixed inside the dark box to reduce external light. To conduct measurements, orange samples were placed on the tray, the tray was placed in the dark box, and pictures from three different sides (stem end, blossom end, and along the equatorial plane) of each fruit were taken and recorded.
A portable electronic nose (PEN 3.5, AIRSENSE Inc., Schwerin, Germany) was used for the sampling of volatile features of orange samples. This electronic nose is composed of a sensor array, a sampling and cleaning channel, and a data acquisition unit. The sensor array contains 10 metal oxide gas sensors that are sensitive to different type of volatiles. Each orange sample was put in a 500 mL glass beaker, which was then sealed with a double layer of preservative film, and was stored at 25 °C for 30 min. Before sampling, zero gas (room air that had been filtered through standard activated carbon) was pumped into the cleaning channel to reset the sensors. The operating parameters of the electronic nose were set at a sampling interval of 1 s; flush time of 60 s; zero-point trim time of 10 s; measurement time of 60 s; pre-sampling time of 5 s; and injection flow of 240 mL/min.

2.3. TSSC and Water Content Test

After VIS/NIR, machine vision, and electronic nose sampling, orange samples were peeled to directly observe the fruit flesh. The fruit sweetness usually be expressed ed by TSSC in food research field, due to more than 75–85% of TSSC is sugar. Half of the fruit flesh was processed for TSSC detection, while the other half was utilized for water content measurement. The TSSC was measured by using a digital pocket refractometer (PAL-1, ATAGO co. Ltd., Tokyo, Japan). For refractometer measurement, the flesh was crushed and homogenized, and the juice was filtered through gauze. Two drops of juice were taken to measure the TSSC. Each sample was measured three times, and the TSSC for that sample was recorded as the average of these three values. Between each measurement, the refractometer was calibrated with distilled water. For water content measurement, an initial weight of flesh was recorded, then the sample was placed in a 50 °C drying oven for 24 h, after which the weight was recorded again. The sample’s water content, as a percent of initial weight, was calculated as follows: (fresh weight before drying—fresh weight after drying)/fresh weight before drying.

2.4. Data Analysis

2.4.1. Analysis Procedure

Partial least squares regression (PLSR) [27],a widely used modeling method due to its relatively simple structure and good linear/nonlinear fitting ability, was utilized in this study to compare the orange TSSC and water content detection accuracy of the various methods. To determine which data set resulted in the most accurate prediction after PLSR modeling, data from VIS/NIR, NIR, machine vision, and E-nose was collected for the detection of TSSC and water content. Typically, data incorporating the continuous signal from a sensor (spectrometer and E-nose) will contain an amount of interfering noise, and the entire data set collected from a sensor (spectrometer, machine vision, and E-nose) will contain redundant information. Many previous studies showed that Savitzky–Golay (SG) is useful for noise reduction and genetic algorithm (GA) is useful for identifying the most relevant data among redundant results [28,29]. Therefore, SG + GA was performed on data for accuracy improvement. Multi-source information fusion (MIF), which was previously demonstrated as being capable of improving the accuracy of detection methods by collecting information from different sources, was applied in this study (SG + GA + PLSR). Convolutional neural network (CNN) [30], a deep learning algorithm, was implemented to dig more deeply to identify features which improve detection accuracy that other algorithms would miss (SG + GA + CNN + PLSR). The implementation of all these analyses were conducted with the aim to find the optimal method for the most accurate nondestructive TSSC and water content detection of “Luogang” orange.

2.4.2. Initial Feature Formation

The initial features measured should include as much sensor information as possible to avoid the omission of information useful for detection. Therefore, all of the raw data from the spectrometer was included. However, the data obtained from machine vision and E-nose are not one-dimensional, and, therefore, feature extraction is required.
Twenty initial features (4 size features, 12 color features, 4 texture features) were extracted from each orange. The four size features included horizontal diameter, vertical diameter, ratio of horizontal and vertical diameters, and surface area. The 12 color features included the first, second, and third moment of R (Red), G (Green), and B (Blue) color gray level, and H (Hue), V (Value), and S (Saturation) color gray level. The four texture features included contrast, correlation, energy, and homogeneity. Even some of the parameters may correlated with each other, but they cannot take place with each other, more useful parameters from different angles can improve the stability of detection model.
For machine vision initial feature formation, the gray value of the R channel showed better contrast effect between the orange and the background than the G and B channels. Median filter algorithm was applied to the R channel gray level image to reduce image noise. Binarization processing with a threshold value of 0.13 was applied to separate the orange and background. Target region extraction algorithm with a threshold value of 90,000 was implemented to reduce the noise points from the background in order to lock the orange target area. The horizontal diameter and vertical diameter are expressed by the maximal pixel distances of target area at X and Y directions, respectively. The surface area is expressed by the pixel number of the target area. To avoid interference from the stem and navel and improve computation efficiency, the orange target area was separated into left and right sections, with the central area of each section (0.4–0.6 inches of X axis and 0.45–0.55 inches of Y axis, centered at the intersection of the horizontal and vertical axis for each section) taken for color and texture measurement. The average of the left and right sections is used to express the color/texture feature of the whole orange. The first/second/third moment of R, G, and B color gray levels are the average/variance/skewness of gray levels in R, G, and B channels. The H, V, and S color gray levels were acquired by switching RGB color space to HSV color space. Contrast represents the sharpness of texture. Correlation is the similarity of the row and column of the gray level concurrence matrix. Energy is the quadratic sum of gray level concurrence matrix element values. Homogeneity represents the roughness of the texture.
Five commonly used E-nose feature extraction methods were applied in this study. They include: 55 s value (the stable time of E-nose sensors’ response data for “Luogang” orange sampling), average value, average of differential value, integral value, and maximum value. The 55 s value is the value of the E-nose response curve at 55 s for each sampling time. The average value is the average of a complete response value. The average of the differential value is the mean value of the differential of the E-nose response curve for each sampling time. The integral value is the area formed by the E-nose response curve and coordinate axis.

2.4.3. Feature Vector Conversion for CNN Input

The feature format of VIS/NIR, machine vision, and E-nose are vectors which fit to the input of traditional machine learning but not CNN. In accordance with previous research [31], feature vector (X) was converted to feature matrix (XXT) to fit the requirements of CNN input.

2.4.4. Detection Effect Evaluation

For PLSR modeling, there were 106 orange samples in total, 76 of which were selected randomly for the calibration set, with the remaining 30 samples allocated to the validation set (Figure A1). The fit of the correlation coefficient (R2) is the key parameter for evaluating the correlation between the predicted value and the actual value of PLSR results. The range of R2 is from 0 to 1, where a greater R2 equates to better predictive ability. Additionally, the root mean squared error (RMSE) is the subsidiary parameters for detection ability evaluation. A RSME value closer to 0 indicate superior predictive ability. The detection result of the validation set represents the detection ability for practical applications. Therefore, the R2 and RMSE values of the PLSR analysis of the validation set were used as the major factors with which to judge the predictive ability of the different data collection methods.

2.4.5. Software

All data analyses were conducted using Matlab R2017a (MathWorks Inc., Natick, MA, USA) [32] using programmed functions and the built-in toolbox.

3. Results and Discussion

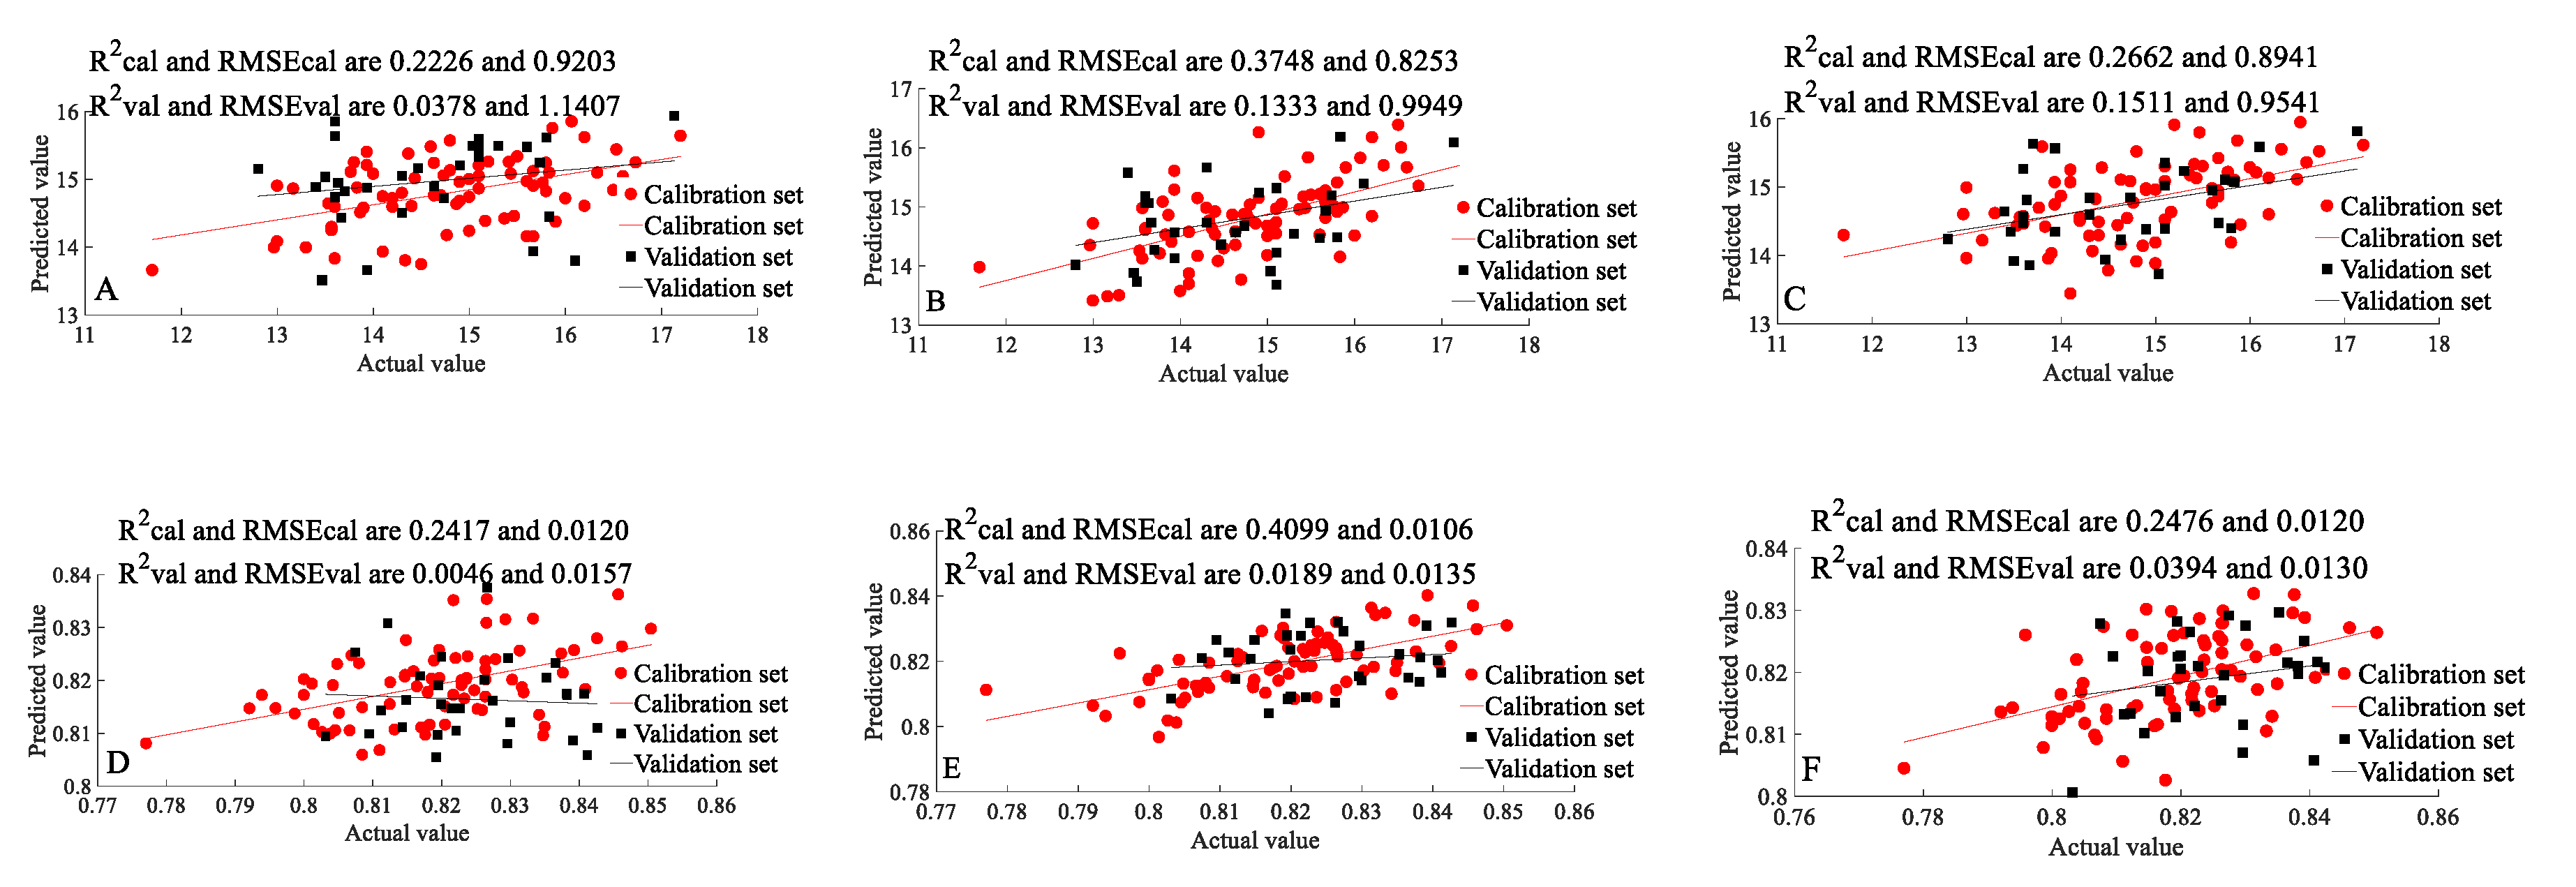
3.1. Detection Based on Raw Data Of Single Detectors

3.1.1. Detection Based on VIS/NIR Spectrometer (400–1100 nm)

The raw data from the VIS/NIR spectrometer (400–1100 nm) were processed to determine the orange TSSC and water content, and the results are shown in Figure 1. The best TSSC and water content detection results were obtained when sampling from the stem side position, with sampling from the blossom side position and the equator position producing the second and third best results, respectively. Previous research also found the stem position to be optimal for citrus TSSC detection based on spectrometer measurement [33]. However, both the TSSC and water content detection of “Luogang” orange from the stem position spectrometer measurement were considered unsatisfactory, with the R2 and RSME of the validation set being 0.4170 and 0.8589 for TSSC detection, respectively, and 0.2629 and 0.0110 for water content detection.

3.1.2. Detection Based on NIR Spectrometer (900–1700 nm)

The raw data from the NIR spectrometer (900–1700 nm) were processed to determine the orange TSSC and water content, and the results are shown in Figure 2. Similar with the VIS/NIR spectrum analysis results, the optimal TSSC and water content detection results were also obtained measuring from the stem side position, followed by the navel side position, and the equator side position. However, the ability of both TSSC and water content detection via NIR spectrometry were even worse than via VIS/NIR, with the R2 and RSME of the validation set being 0.2849 and 0.9785 for TSSC detection, respectively, and 0.1526 and 0.0140 for water content detection. The reason for this may be due to light with a wavelength between 900–1700 nm having weaker transmissivity than light with wavelengths between 400–1100 nm which results in a higher signal to noise ratio for the data set from the transmission of light at wavelengths between 900–1700 nm. This is the reason why the internal quality of relatively large agricultural products is usually detected based on a 400–1100 nm spectrum [34,35], and a 900–1700 nm spectrum is more often applied for the detection of superficial qualities [36] or the internal quality of small agricultural products [37].

3.1.3. Detection Based on Machine Vision

The raw data from machine vision acquisition were processed to determine orange TSSC and water content, and the results are shown in Figure 3. The optimal TSSC and water content detection results were obtained from on the blossom end position. Nevertheless, both the TSSC and water content detection ability was unsatisfactory, with the R2 and RSME of the validation set being 0.1511 and 0.9541, respectively, for TSSC detection, and 0.0394 and 0.0130 for water content detection. Machine vision features were higher related to TSSC than to water content. Previous studies found that the features measured by machine vision have the potential to help determine superficial TSSC and water content [23,38], but no evidence indicates that machine vision can be applied to detect internal TSSC and water content of a fruit with thick peel like an orange.

3.1.4. Detection Based on Electronic Nose

The raw data from electronic nose were processed to determine the orange TSSC and water content, and the results are shown in Figure 4. Both the TSSC and water content detect ability using E-nose were unsatisfactory, with the R2 and RSME of the validation set being 0.0279 and 1.2196, respectively, for TSSC detection, and 0.1509 and 0.0178 (negative correlation) for water content. Thus, the features measured by E-nose have a negligible relationship to either the TSSC or the water content of orange. E-nose may be a feasible means to detect the TSSC of a fruit with thin peel or from fruit pulp where the volatile of the target can be full accessed [22,39], however, due to its thick peel, the TSSC of orange is infeasible for detection via E-nose. Likewise, there are no studies indicating that fruit water content can be detected by an E-nose.

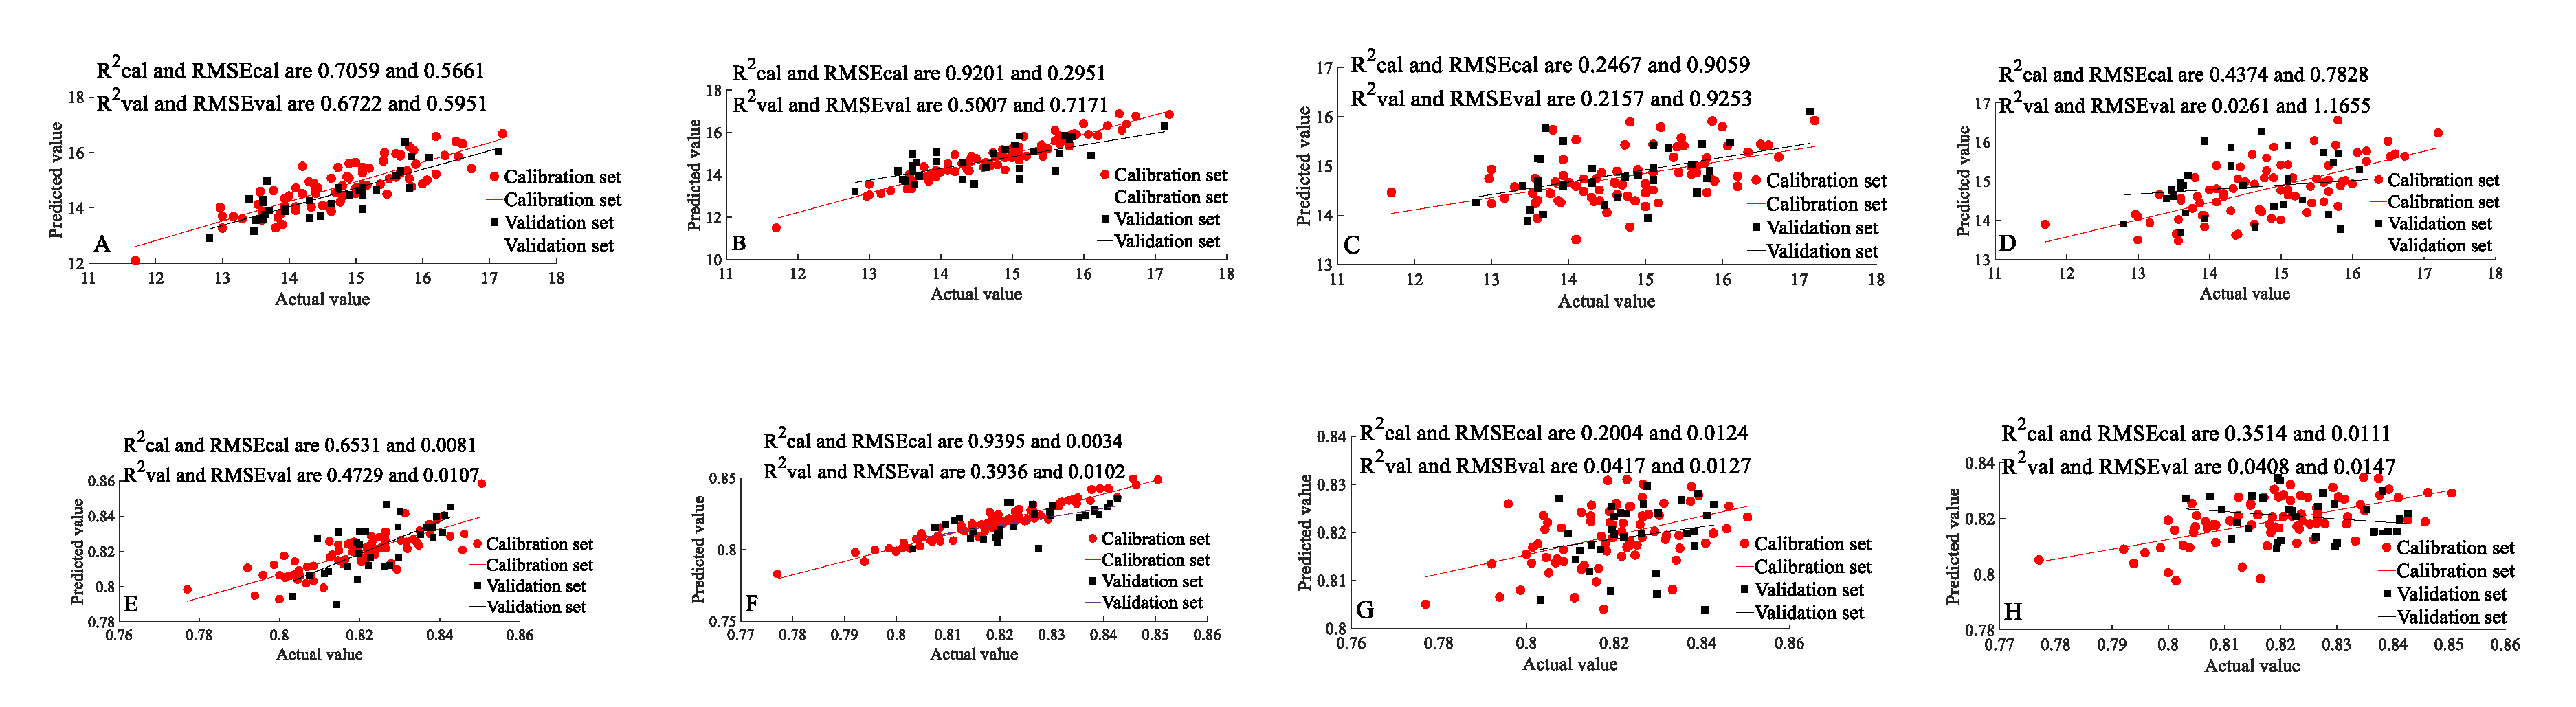
3.1.5. Detection after SG and GA Preprocessing

The traditional data preprocessing methods SG and GA were applied in this study to reduce noise and redundant information in order to improve detection ability. The third-order seven-point SG was applied for VIS/NIR (400–1100 nm) data noise reduction, and the top 30 and 35 features as ranked by the GA results were selected for TSSC and water content detection, respectively. For VIS (900–1700 nm) data, fifth-order nigh-point SG was applied for data noise reduction, and the top 300 and 410 features as ranked by the GA results were selected for TSSC and water content detection, respectively. For machine vision feature extraction, the first 10 features as ranked by the GA results were selected for both TSSC and water content detection. For E-nose feature extraction, the first 19 and 15 features as ranked by the GA results were selected for TSSC and water content detection, respectively. All the parameters of GA in this study were: an initial population number of 70, a crossover probability of 0.5, a mutation probability equal to 0.01, and 100 iterations.
After SG and GA processing, as shown in Figure 5, the R2 of the validation set TSSC and water content detection results from VIS/NIR (400–1100 nm) increased from 0.4170 and 0.2629 to 0.6722 and 0.4729, respectively. The R2 of the validation set TSSC and water content detection results from NIR (900–1700 nm) increased from 0.2849 and 0.1526 to 0.5007 and 0.3936, respectively. The R2 of the validation set TSSC and water content detection results from machine vision increased from 0.1511 and 0.0394 to 0.2157 and 0.0417, respectively. However, the R2 from E-nose barely improved after SG + GA processing. We can infer that a spectrometer measuring 400–1100 nm is the optimal for orange TSSC and water content detection, followed by 900–1700 nm spectrometer measurement, machine vision, and finally E-nose. Even though a spectrometer measuring 900–1700 nm should be sufficiently sensitive to measure TSSC and water content, the transmissivity of light between 900 and 1700 nm is weaker than that between 400 and 1100 nm, which is likely the primary reason for the inferior detection ability of “Luogang” orange TSSC and water content.

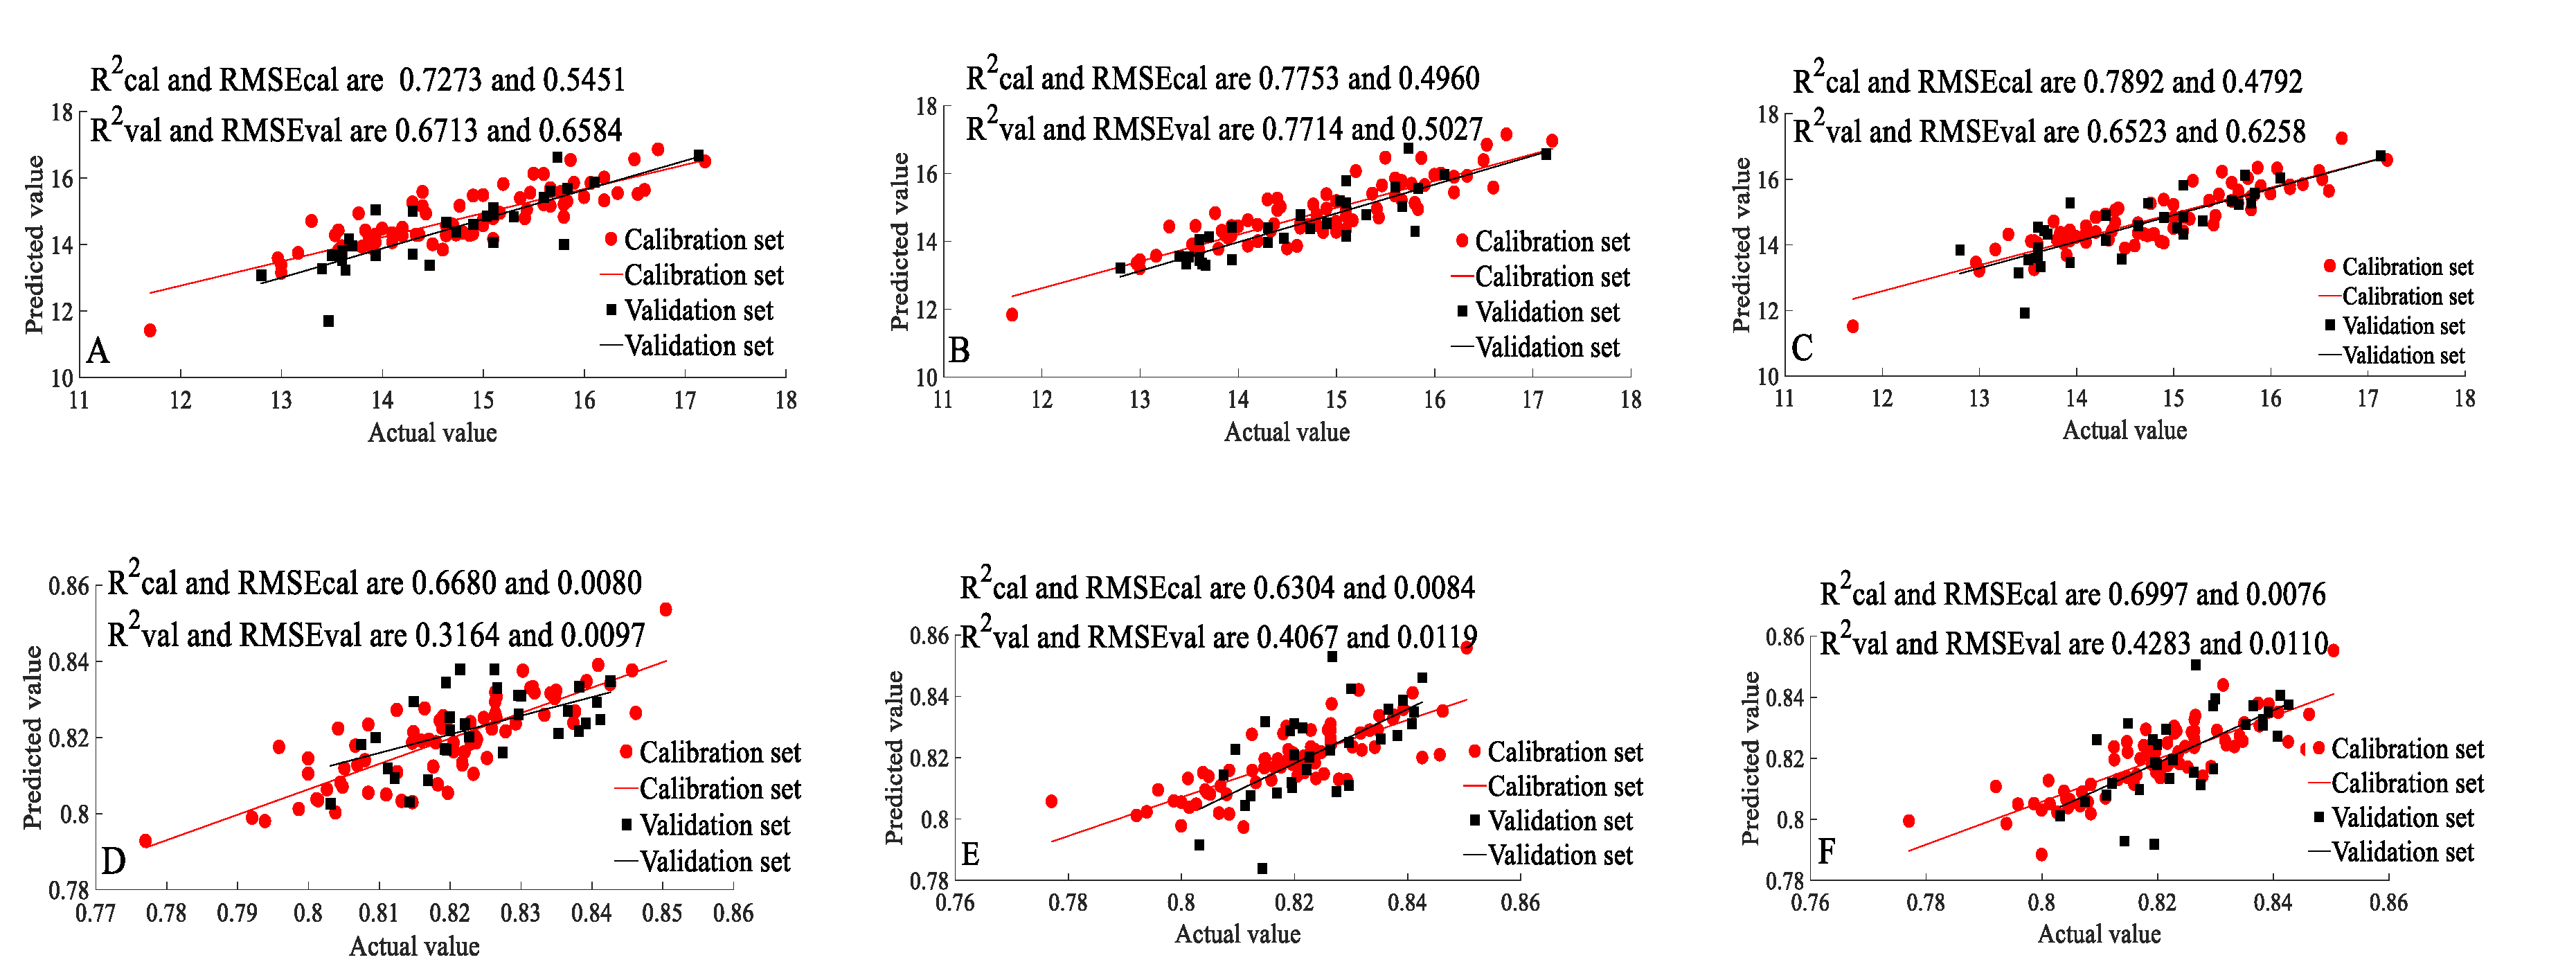
3.2. Detection Based on MIF

MIF was applied to further improve the detection accuracy of orange TSSC and water content. Due to VIS/NIR (400–1100 nm) exhibiting the best detection ability of all tested methods, the SG + GA selected VIS/NIR data were selected as the primary information source for MIF, with the SG + GA selected NIR (900–1700 nm), machine vision, or E-nose data input as the supplementary information source. Information fusion was conducted by merging SG and GA processes and selected features. To avoid the information overlap of VIS/NIR and NIR, only the 1100–1700 nm spectrum of the NIR data were supplied. The MIF analysis results are shown in Figure 6. The TSSC detection ability increased after VIS/NIR and machine vision data fusion (R2 and RMSE of the validation set are 0.7714 and 0.5027, respectively), while the detection ability of the other methods decreased in sensitivity. Even so, the detection ability needs further improvement. In many cases, MIF can help to increase detection accuracy [40]; however, the detection accuracy decreased when the supplementary features were too similar to the primary features (like the NIR-based supplementary data for TSSC and water content detection), or contained too much junk information (like the E-nose-based supplementary data for TSSC and water content detection or the machine vision-based supplementary information for water content detection) [26]. Previous research proved the internal TSSC of pomelo is related to its external features [41]. Our unpublished data found the machine vision feature has potential for use to predict the internal quality of pineapple. In this study, VIS/NIR and machine vision data fusion is the optimal way for the detection of “Luogang” orange TSSC. The water content of “Luogang” orange is optimally detected using only VIS/NIR-based data.

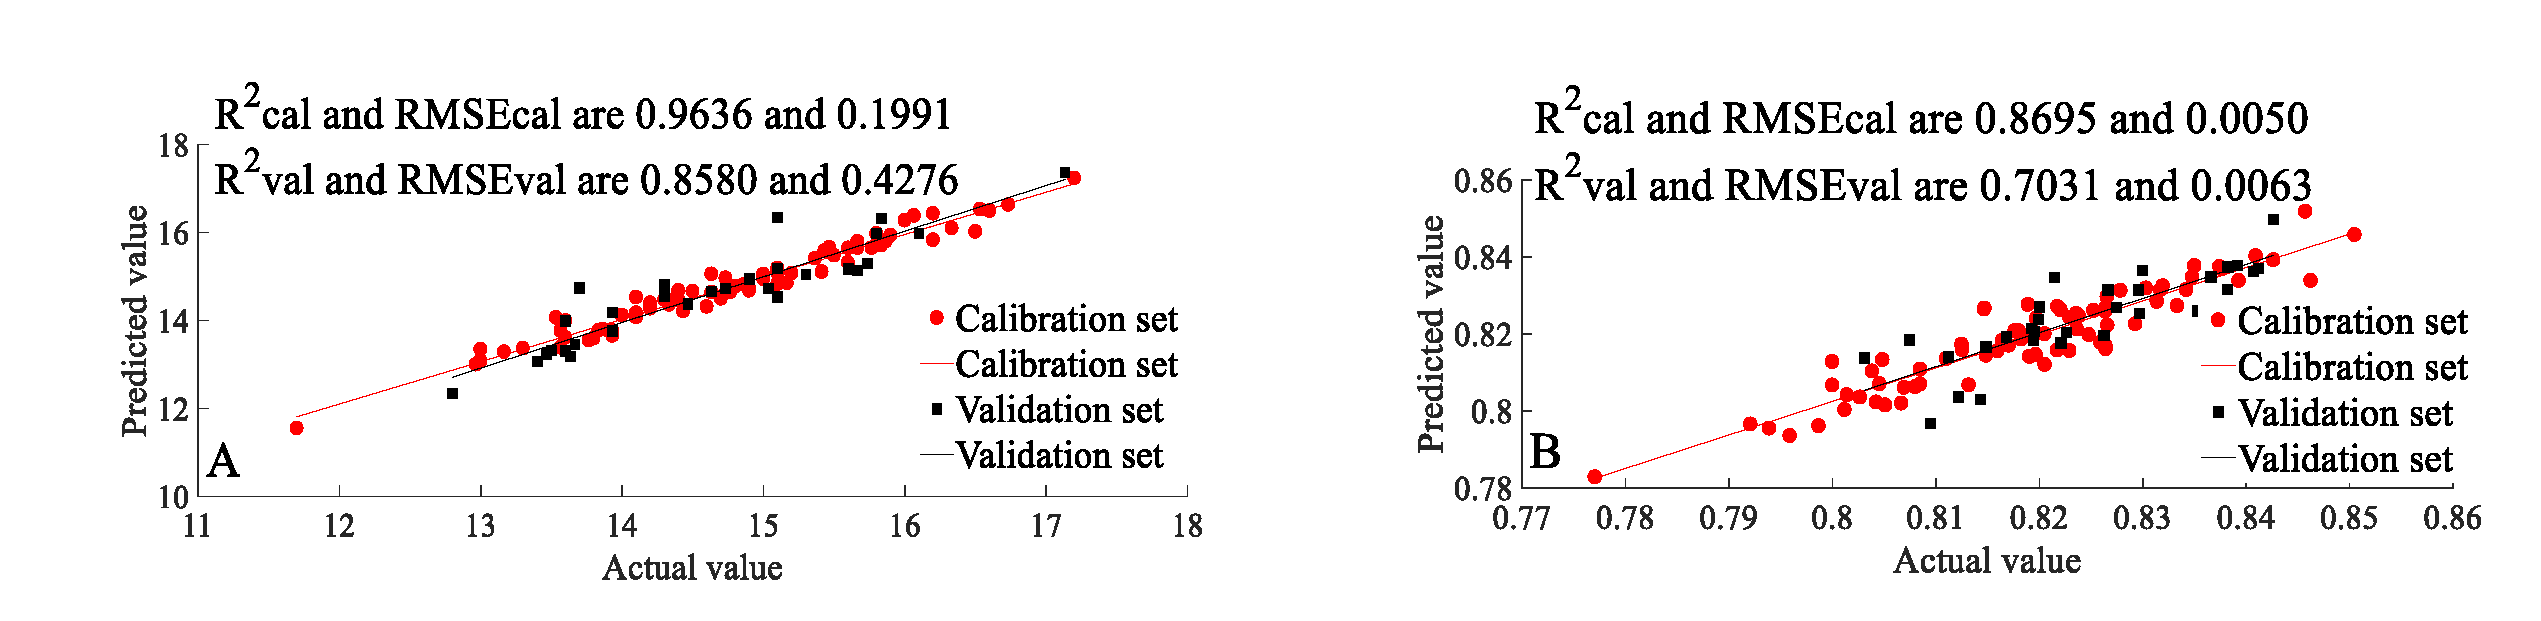
3.3. Detection Based on MIF and Deep Learning

As the detection ability of TSSC and water content of “Luogang” orange still requires further improvement, a deep learning method (CNN, Figure A2) was applied for a more exhaustive examination of MIF data (VIS/NIR and machine vision data fusion). The 40 × 1 VIS/NIR and machine vision fusion vector feature (optimal data set for TSSC detection) and 35×1 VIS/NIR vector feature (optimal data set for water content detection) were converted to 40 × 40 and 35 × 35 matrices, respectively, to satisfy the input requirements of CNN. After repeated runs, the optimal feature extraction network parameters of CNN for TSSC and water content detection were determined, and they are shown in Table 1.
The SG + GA + MIF + CNN + PLSR detection results are shown in Figure 7. The R2 of the validation sets for TSSC and water content detection results increased from 0.7714 and 0.4729 to 0.8580 and 0.7031, respectively. Therefore, the TSSC and water content can be feasibly detected quickly, intelligently and nondestructively. Previous studies also showed that CNN can improve the detection ability of VIS/NIR in other cases [31,42]. VIS/NIR should be able to detect water content (H2O) due to its sensitivity to hydrogen-containing groups (X–H) including O–H, N–H, C–H, and S–H. However, many other compounds also have an O–H group, which can interfere with the accurate detection of water content. Thus, it is usually hard to obtain accurate water content detection ability.

4. Conclusions

The present study demonstrates that the TSSC and water content of “Luogang” orange can be feasibly detected quickly, intelligently and nondestructively. VIS/NIR spectroscopy (400–1100 nm), NIR spectroscopy (900–1700 nm), machine vision, and electronic nose were applied to find the optimal detection tool. Savitzky–Golay (SG), genetic algorithm (GA), multi-source information fusion (MIF), and convolutional neural network (CNN) were applied for data preprocessing before partial least squares regression (PLSR) modeling to develop an improved detection method. The optimal TSSC detection results obtained were based on VIS/NIR and machine vision data fusion, and processing and modeling by SG + GA + CNN +PLSR. The R2 and RMSE of the validation set for TSSC detection results were 0.8580 and 0.4276, respectively. The optimal water content detection results were based on VIS/NIR data, and processing and modeling by SG + GA + CNN +PLSR. The R2 and RMSE of the validation set for water content detection results were 0.7031 and 0.0063, respectively. These results demonstrate an efficient detection method for the internal quality of “Luogang” orange, and provide a reference for the accuracy improvement of internal quality detection for other fruits.

Author Contributions

H.L. designed the reported study, evaluated the results, and prepared and reviewed the manuscript. Q.Z. helped S.X. in the experimental setup and to conduct the experiments. S.X. was responsible for the entire experiment, analyzed the results, and prepared the manuscript. C.F. helped to analyze the experimental data and revised the manuscript. All authors both read and approved the manuscript. All authors have read and agreed to the published version of the manuscript.

Funding

This research was funded by the Guangzhou Municipal Science and Technology Project (No. 201904010199), the National Natural Science Foundation of China (No. 31901404), the Special Project for Research and Development in Key areas of Guangdong Province (No. 2018B0202240001), the New Developing Subject Construction Program of Guangdong Academy of Agricultural Science (No. 201802XX), the Presidential Foundation of Guangdong Academy of Agricultural Science (No. 201920), the Presidential Foundation of Guangdong Academy of Agricultural Science (No. 202034), and the Special Fund for Science and Technology Innovation Strategy (Construction of High-Level Agricultural Academy).

Conflicts of Interest

The authors declare no conflict of interest.

Appendix A

Figure A1. Matlabcode for training set and validation set separation of 106 orange samples.
Electronics 10 00080 g0a1
Figure A2. The architecture of convolutional neural network (CNN).
Electronics 10 00080 g0a2

References

  1. Huang, S.P.; Yue, X.J.; Hong, T.S.; Cai, K.; Lin, S.L. Hyperspectrum based models for monitoring phosphorus content of Luogang Orange leaf using Wavelet Denoising and Least Squares Support Vector Regression Analysis. Guangdong Agric. Sci. 2013, 2013, 37–40. [Google Scholar]
  2. Khodabakhshian, R.; Emadi, B.; Khojastehpour, M.; Golzarian, M.R. A comparative study of reflectance and transmittance modes of Vis/NIR spectroscopy used in determining internal quality attributes in pomegranate fruits. J. Food Meas. Charact. 2019, 13, 3130–3139. [Google Scholar] [CrossRef]
  3. Shen, F.; Zhang, B.; Cao, C.; Jiang, X. On-line discrimination of storage shelf-life and prediction of post-harvest quality for strawberry fruit by visible and near infrared spectroscopy. J. Food Process Eng. 2018, 41, e12861–e12866. [Google Scholar] [CrossRef]
  4. Shahir, S.; Visvanathan, R.; Nambi, V.E.; Chandrasekar, V. Mathematical modeling of physical properties of banana fruit for machine vision systems using image processing method. JARDCS 2018, 10, 611–617. [Google Scholar]
  5. Chong, V.K.; Kondo, N.; Ninomiya, K.; Nishi, T.; Monta, M.; Namba, K.; Zhang, Q. Features Extraction for Eggplant Fruit Grading System Using Machine Vision. Appl. Eng. Agric. 2008, 24, 675–684. [Google Scholar] [CrossRef]
  6. Brezmes, J.; Llobet, E.; Vilanova, X.; Orts, J.; Saiz, G.; Correig, X. Correlation between electronic nose signals and fruit quality indicators on shelf-life measurements with pinklady apples. Sens. Actuators B Chem. 2001, 80, 41–50. [Google Scholar] [CrossRef]
  7. Baietto, M.; Wilson, A.D. Electronic-Nose Applications for Fruit Identification, Ripeness and Quality Grading. Sensors 2015, 15, 899–931. [Google Scholar] [CrossRef]
  8. Zhang, D.; Xu, L.; Wang, Q.; Tian, X.; Li, J. The Optimal Local Model Selection for Robust and Fast Evaluation of Soluble Solid Content in Melon with Thick Peel and Large Size by Vis-NIR Spectroscopy. Food Anal. Method 2019, 12, 136–147. [Google Scholar] [CrossRef]
  9. Bag, S.K.; Srivastav, P.P.; Mishra, H.N. FT-NIR spectroscopy: A rapid method for estimation of moisture content in bael pulp. Br. Food J. 2011, 113, 494–504. [Google Scholar] [CrossRef]
  10. Long, X.; Jing, L.; Muhua, L. Nondestructive Detection of Soluble Solids Content on Navel Orange with Vis/NIR Based on Genetic Algorithm. Laser Optoelectron. Prog. 2019, 47, 123001. [Google Scholar] [CrossRef]
  11. Fan, G.; Zha, J.; Du, R.; Gao, L. Determination of soluble solids and firmness of apples by Vis/NIR transmittance. J. Food Eng. 2009, 93, 416–420. [Google Scholar] [CrossRef]
  12. Shao, Y.; Bao, Y.; He, Y. Visible/near-infrared spectra for linear and nonlinear calibrations: A case to predict soluble solids contents and pH value in peach. Food Bioprocess Technol. 2011, 4, 1376–1383. [Google Scholar] [CrossRef]
  13. Li, J.; Huang, W.; Zhao, C.; Zhang, B. A comparative study for the quantitative determination of soluble solids content, pH and firmness of pears by Vis/NIR spectroscopy. J. Food Eng. 2013, 116, 324–332. [Google Scholar] [CrossRef]
  14. Han, D.; Chang, D.; Song, S.; Jiang, S.; Zhao, H. Information collection of mini watermelon quality using near-infrared non-destructive detection. Nongye Jixie Xuebao = Trans. Chin. Soc. Agric. Mach. 2013, 44, 174–178. [Google Scholar]
  15. Yang, B.; Guo, W.; Li, W.; Li, Q.; Liu, D.; Zhu, X. Portable, visual, and nondestructive detector integrating Vis/NIR spectrometer for sugar content of kiwifruits. J. Food Process Eng. 2019, 42, e12981–e12982. [Google Scholar] [CrossRef]
  16. OZAKI, Y. Near-Infrared Spectroscopy-Its Versatility in Analytical Chemistry. Anal. Sci. Int. J. Jpn. Soc. Anal. Chem. 2012, 28, 545–563. [Google Scholar] [CrossRef] [PubMed] [Green Version]
  17. Wang, A.; Hu, D.; Xie, L. Comparison of detection modes in terms of the necessity of visible region (VIS) and influence of the peel on soluble solids content (SSC) determination of navel orange using VIS–SWNIR spectroscopy. J. Food Eng. 2014, 126, 126–132. [Google Scholar] [CrossRef]
  18. Xu, X.; Mo, J.; Xie, L.; Ying, Y. Influences of Detection Position and Double Detection Regions on Determining Soluble Solids Content (SSC) for Apples Using On-line Visible/Near-Infrared (Vis/NIR) Spectroscopy. Food Anal. Method 2019, 12, 2078–2085. [Google Scholar] [CrossRef]
  19. Vaudelle, F.; l’Huillier, J.P. Influence of the size and skin thickness of apple varieties on the retrieval of internal optical properties using Vis/NIR spectroscopy: A Monte Carlo-based study. Comput. Electron. Agric. 2015, 116, 137–149. [Google Scholar] [CrossRef] [Green Version]
  20. Kondo, N.; Ahmad, U.; Monta, M.; Murase, H. Machine vision based quality evaluation of Iyokan orange fruit using neural networks. Comput. Electron. Agric. 2000, 29, 135–147. [Google Scholar] [CrossRef]
  21. Gobbi, E.; Falasconi, M.; Concina, I.; Mantero, G.; Bianchi, F.; Mattarozzi, M.; Musci, M.; Sberveglieri, G. Electronic nose and Alicyclobacillus spp. spoilage of fruit juices: An emerging diagnostic tool. Food Control 2010, 21, 1374–1382. [Google Scholar] [CrossRef]
  22. Su, M.; Zhang, B.; Ye, Z.; Chen, K.; Guo, J.; Gu, X.; Shen, J. Pulp volatiles measured by an electronic nose are related to harvest season, TSSC concentration and TSSC/TA ratio among 39 peaches and nectarines. Sci. Hortic. 2013, 150, 146–153. [Google Scholar] [CrossRef]
  23. Pothula, A.K.; Igathinathane, C.; Shen, J.; Nichols, K.; Archer, D. Machine Vision Analysis for Industrial Beet Color Change Kinetics and Total Soluble Solid Content. In 2014 ASABE Intersectional Meeting; The American Society of Agricultural and Biological Engineers: St. Joseph, MI, USA, 2014; Volume 2014. [Google Scholar]
  24. Xu, S.; Lu, H.; Zhou, Z.; Lü, E.; Jiang, Y. Identification for Guava Mechanical Damage Based on Combined Hyper-spectrometer and Electronic Nose. Trans. Chin. Soc. Agric. Mach. 2015, 46, 214–219. [Google Scholar]
  25. LeCun, Y.; Bengio, Y.; Hinton, G. Deep learning. Nature 2015, 521, 436–444. [Google Scholar] [CrossRef] [PubMed]
  26. Xu, S.; Sun, X.; Lu, H.; Zhang, Q. Detection of Type, Blended Ratio, and Mixed Ratio of Pu’er Tea by Using Electronic Nose and Visible/Near Infrared Spectrometer. Sensors 2019, 19, 2359. [Google Scholar] [CrossRef] [PubMed] [Green Version]
  27. Liu, Y.; Peng, J.; Wang, Y. Application of partial least squares regression in detecting the important landscape indicators determining urban land surface temperature variation. Landsc. Ecol. 2018, 33, 1133–1145. [Google Scholar] [CrossRef]
  28. Mcleod, G.; Clelland, K.; Tapp, H.; Kemsley, E.K.; Wilson, R.H.; Poulter, G.; Coombs, D.; Hewitt, C.J. A comparison of variate pre-selection methods for use in partial least squares regression: A case study on NIR spectroscopy applied to monitoring beer fermentation. J. Food Eng. 2009, 90, 300–307. [Google Scholar] [CrossRef] [Green Version]
  29. Xu, S.; Lu, H.; Ference, C.; Zhang, Q. Visible/near Infrared Reflection Spectrometer and Electronic Nose Data Fusion as an Accuracy Improvement Method for Portable Total Soluble Solid Content Detection of Orange. Appl. Sci. 2019, 9, 3761. [Google Scholar] [CrossRef] [Green Version]
  30. Cheng, P.M.; Tran, K.N.; Whang, G.; Tejura, T.K. Refining Convolutional Neural Network Detection of Small-Bowel Obstruction in Conventional Radiography. Am. J. Roentgenol. 2018, 212, 342–350. [Google Scholar] [CrossRef]
  31. Du, J.; Hu, B.L.; Liu, Y.Z.; Wei, C.Y.; Zhang, G.; Tang, X.J.; Hu, B.R.A.C. Study on Quality Identification of Macadamia nut Based on Convolutional Neural Networks and Spectral Features. Spectrosc. Spectr. Anal. 2018, 38, 1514–1519. [Google Scholar]
  32. Trefethen. Spectral Methods in MATLAB; SIAM: Philadelphia, PA, USA, 2000. [Google Scholar]
  33. Jie, D.F.; Yang, J.; Peng, Y.X.; Lian, Y.X.; Zhang, D.; University, H.A. Research on the detection model of sugar content in different position of citrus based on the hyperspectral technology. Food Mach. 2017, 33, 51–54. [Google Scholar]
  34. Ncama, K.; Opara, U.L.; Tesfay, S.Z.; Fawole, O.A.; Magwaza, L.S. Application of Vis/NIR spectroscopy for predicting sweetness and flavour parameters of ‘Valencia’ orange (Citrus sinensis) and ‘Star Ruby’ grapefruit (Citrus x paradisi Macfad). J. Food Eng. 2017, 193, 86–94. [Google Scholar] [CrossRef]
  35. Chia, K.S.; Rahim, H.A.; Rahim, R.A. Prediction of soluble solids content of pineapple via non-invasive low cost visible and shortwave near infrared spectroscopy and artificial neural network. Biosyst. Eng. 2012, 113, 158–165. [Google Scholar] [CrossRef]
  36. Huang, H.; Liu, L.; Ngadi, M.O.; Gariépy, C.; Prasher, S.O. Near-Infrared Spectral Image Analysis of Pork Marbling Based on Gabor Filter and Wide Line Detector Techniques. Appl. Spectrosc. 2014, 68, 332–339. [Google Scholar] [CrossRef]
  37. Liu, G.; He, J.; Wang, S.; Luo, Y.; Wang, W.; Wu, L.; Si, Z.; He, X. Application of Near-Infrared Hyperspectral Imaging for Detection of External Insect Infestations on Jujube Fruit. Int. J. Food Prop. 2016, 19, 41–52. [Google Scholar] [CrossRef]
  38. Zhang, Y.; Sakae, S.; Li, M. Prediction of tomato inner quality based on machine vision. Trans. Chin. Soc. Agric. Eng. 2010, 26, 366–370. [Google Scholar]
  39. Jian, L.I.; Zheng, L.; Lin, H.; Zheng, F.; Hui, G. Study of Red-heart Plum Total Soluble Solids Content Predicting Method Using Electronic Nose. J. Nucl. Agric. Sci. 2015, 29, 2360–2365. [Google Scholar]
  40. Li, L.; Wang, J.; Cao, Z.; Zhong, E. An information-fusion method to identify pattern of spatial heterogeneity for improving the accuracy of estimation. Stoch. Environ. Res. Risk A 2008, 22, 689–704. [Google Scholar] [CrossRef]
  41. Feng, R.H.; Kang, W.Q.; Da-Peng, Y.E. The Design of a Nondestructive Testing Device for Pomelo Sugar Based on Partial Least Square Method. J. Anhui Agric. Sci. 2016, 44, 262–264. [Google Scholar]
  42. Le, B.T.; Xiao, D.; Mao, Y.C.; Song, L.; He, D.K.; Liu, S.J. Coal classification based on visible near-infrared spectroscopy and CNN-ELM algorithm. Spectrosc. Spectr. Anal. 2018, 38, 2107–2112. [Google Scholar]
Figure 1. TSSC and water content detection based on raw spectrometer data from 400–1100 nm at the (A,D) stem end position, (B,E) equator position, (C,F) blossom end position; (AC) TSSC detection, (DF) water content detection.
Electronics 10 00080 g001
Figure 2. TSSC and water content detection based on raw spectrometer datafrom 900–1700 nm from the (A,D) stem end position, (B,E) equator position, (C,F) blossom end position; (AC) TSSC detection, (DF) water content detection.
Electronics 10 00080 g002
Figure 3. TSSC and water content detection based on machine vision data from the (A,D) stem side position, (B,E) equator position, (C,F) blossom side position; (AC) TSSC detection, (DF) water content detection.
Electronics 10 00080 g003
Figure 4. TSSC and water content detection based on electronic nose. (A) TSSC detection, (B) water content detection.
Electronics 10 00080 g004
Figure 5. TSSC and water content detection after SG + GA processing. (A,E) VIS/NIR, (B,F) NIR, (C,G) machine vision, (D,H) E-nose, (AD) TSSC detection, (EH) water content detection.
Electronics 10 00080 g005
Figure 6. TSSC and water content detection based on MIF data. (A,D) whole spectral data 400–1700 nm, (B,E) VIS/NIR and machine vision fusion, (C,F) VIS/NIR and E-nose fusion, (AC) TSSC detection, (D–F) water content detection.
Electronics 10 00080 g006
Figure 7. TSSC and water content detection based on deep learning. (A) TSSC detection; (B) water content detection.
Electronics 10 00080 g007
Table 1. Parameter setting for CNN feature extraction.
CNN Network StructureLearning RateIterations
Layer 1Layer 2
FMNFMSPSFMNFMSPS
TSSC6324220.85300
Water content7323220.80500
Note: FMN is the number of feature maps; FMS is the size of feature map; PS is the size of the pooling layer.
Publisher’s Note: MDPI stays neutral with regard to jurisdictional claims in published maps and institutional affiliations.

