Abstract
Extracting speaker’s personalized feature parameters is vital for speaker recognition. Only one kind of feature cannot fully reflect the speaker’s personality information. In order to represent the speaker’s identity more comprehensively and improve speaker recognition rate, we propose a speaker recognition method based on the fusion feature of a deep and shallow recombination Gaussian supervector. In this method, the deep bottleneck features are first extracted by Deep Neural Network (DNN), which are used for the input of the Gaussian Mixture Model (GMM) to obtain the deep Gaussian supervector. On the other hand, we input the Mel-Frequency Cepstral Coefficient (MFCC) to GMM directly to extract the traditional Gaussian supervector. Finally, the two categories of features are combined in the form of horizontal dimension augmentation. In addition, when the number of speakers to be recognized increases, in order to prevent the system recognition rate from falling sharply, we introduce the optimization algorithm to find the optimal weight before the feature fusion. The experiment results indicate that the speaker recognition rate based on the feature which is fused directly can reach 98.75%, which is 5% and 0.62% higher than the traditional feature and deep bottleneck feature, respectively. When the number of speakers increases, the fusion feature based on optimized weight coefficients can improve the recognition rate by 0.81%. It is validated that our proposed fusion method can effectively consider the complementarity of the different types of features and improve the speaker recognition rate.
1. Introduction
Over the last two decades, with the rapid development of artificial intelligence, voiceprint, iris, fingerprint, face and other biometrics have been of wide concern [1,2,3]. Speech is the most common way to communicate and convey information in people’s daily life. A person’s vocal tract structure determines that person’s unique vocal characteristics. This makes speaker recognition possible. Speaker recognition technology is a kind of biometrics technology, which automatically distinguishes the speaker’s identity information through the unique features contained in the voice. Generally speaking, the speaker recognition mainly comprises two important branches: speaker identification and speaker verification [4]. The former is to select the speaker with the highest similarity by comparing the speech of the speaker to be recognized with the trained models. It is a multi-classification problem. However, the latter is to determine whether the input speech belongs to the specific trained speaker model. It is a binary judgment problem. The technologies of speaker identification have been widely discussed in recent years.
The speaker identification system mainly consists of three parts: speech signal preprocessing, feature parameters extraction, and classification [5]. Since human beings are influenced by their own physical conditions and external environment in the course of communication, the extraction of the distinguishable information from complex speech is a challenging task. Mel-Frequency Cepstral Coefficient (MFCC) [6,7,8,9,10], Linear Prediction Cepstrum Coefficient (LPCC) [11,12], Perceptual Linear Predictive (PLP) [13]) and Linear Predictive Coding (LPC) [14] are the most frequently used traditional features in speaker recognition. Wu and Cao [6] replaced the logarithmic transformation in the standard MFCC analysis with a combined function to improve the noisy sensitivity. The experiments showed that MFCC-based feature reduced the error rate significantly under the noisy environment. Sahidullah and Saha [9] proposed a novel windowing technique to compute MFCC. The method was based on the fundamental property of Discrete Time Fourier Transform (DTFT) related to differentiation in the frequency domain and it achieved good substance and consistency. In Reference [10], a novel algorithm of extracting MFCC for speech recognition was proposed. They modified the filter bank and added the filter bank to generate the power coefficient. It could effectively reduce the consumption of computer hardware. There were also some classical models such as Gaussian Mixture Model (GMM)-Support Vector Machine (GMM-SVM) [15], GMM-Universal Background Model (GMM-UBM) [16] and Probabilistic Linear Discriminant Analysis/i-vector (PLDA/i-vector) [17] applied to speaker recognition. In recent years, more and more researchers have used deep networks to complete speaker recognition. Shahin et al. [18] proposed a new classifier called cascaded Gaussian mixture model-deep neural network. They used the GMM to generate the emotional tags of each speaker under each emotional speaking condition, and then the new vector of features was used as the input of the Deep Neural Network (DNN) classifier. Lastly, the output of the DNN was the final classification results. The performance of the system was tested on the Emirati speech database and “speech under simulated and actual stress” English dataset. Work in [19] used the neural network for classification and wavelet transform to extract feature parameters. The result demonstrated that the performance was better than the Multi-Layer Perceptron (MLP)-based classification in the aspect of recognition accuracy, average precision, average recall and root mean square error. Matejka et al. [20] investigated combining the deep bottleneck features with the traditional MFCC features to complete the speaker identification. In Reference [21], they utilized the DNN to extract the deep feature for automatic speaker recognition and language recognition. The results showed that a 55% reduction in equal error rate for the 2013 Domain Adaptation Challenge out-of-domain condition and a 48% reduction on the NIST 2011 language recognition evaluation 30 s test condition.
The several different speaker identification methods described above have been widely accepted and applied for their respective special advantages and good recognition performance, but there are still some shortcomings. The traditional features only reflect the speaker’s physical information and represent shallow characteristics of the speech. They cannot fully exploit the deep structural information of speech signals [22]. The deep neural network can extract deep features of speech segments by simulating the structure of the human brain, but it ignores the most basic physical layer characteristics. Therefore, in order to fully express the features of speech signals and take advantage of each model, some studies have proposed different fusion strategies to complete speaker recognition in recent years. Omar et al. [23] proposed an MLP network based on feature fusion to train the recognition system. The LPC and MFCC were fused and then input into the MLP, which was used as a classifier for speaker identification system. In the paper [24], they took full account of the complementarity between different levels of speech signals and proposed the fusion method of deep and shallow features for the speaker verification system. Compared with the baseline system, the EER was reduced by 54.8%. When the training speech is short utterances, the GMM is failing to achieve a good performance. For the sake of find a solution to the problem, work in [25] utilized the Convolutional Neural Network (CNN) to process the spectrogram of speech signal and combined it with the GMM for scoring fusion. In order to improve the robustness of the speaker verification under noisy environments, Asbai and Amrouche [26] proposed a new method of weighted score fusion. These studies fully prove that the fusion method can effectively improve the performance of the speaker recognition system.
Since the deep and shallow features reflect the speaker’s information from different aspects, the speaker’s characteristics can be more comprehensively represented by effective fusion. Therefore, we propose a new speaker recognition method based on the fusion of deep and shallow Gaussian supervector. In this method, the MFCC is firstly obtained from the input speech signal, and then DNN is used to obtain the bottleneck features, which are used to acquire the deep Gaussian supervector. On the other hand, we input the MFCC into the GMM directly to obtain the traditional Gaussian supervector. Lastly, we fuse the two kinds of features to form a new vector to train the SVM and complete the speaker classification.
The main contributions made in this paper can be summarized here: (1) We design a DNN network to extract the deep bottleneck features that contain more discriminative information from different speakers. (2) In order to take into account the complementarity between different hierarchical features, we propose a novel fusion model to form a new Gaussian supervector for speaker recognition. (3) We propose a speaker recognition system based on optimization weight coefficient, which improves the robustness of the system. (4) We explore the factors that affect the performance of the system recognition and utilize the Fisher criterion to filter redundant information.
The remainder of the paper is organized as follows: Section 2 describes the proposed speaker identification system based on fusion features, MFCC, recombined Gaussian supervector and feature selection strategy, respectively. Section 3 mainly elaborates on the speaker identification system based on optimized weight coefficients. The experimental results and analysis are presented in the Section 4. Finally, the conclusion of this work is given in Section 5.
2. Proposed Speaker Recognition System
In a speaker identification system, it is vital to extract some features that can indicate speaker identity information, and then these features are used to train the classification model. Finally, the model is used for identification. Therefore, the performance of the speaker’s recognition system is directly impacted by the quality of features. A single feature often cannot fully reflect the speaker’s personality information, resulting in a low recognition rate. The traditional acoustic characteristics mostly consider the information of the physical layer of speech signal, and more reflect the shallow features of the human auditory perception and vocal tract. Therefore, it is difficult to represent the high-level information of speech segments. In recent years, the DNN have adopted a multi-layer network structure to simulate human brains, which can fully deeper identity information related to the speaker. However, it does not involve the most intuitive acoustic features of the physical layer, which may also lead to poor system performance. Thus, in order to further improve the performance of the speaker identification system, we propose a novel recognition method that fuses the depth features and traditional acoustic features to accurately recognize the speaker’s identity. The system block diagram of the proposed model is shown in Figure 1.

Figure 1.
Proposed speaker recognition model based on the fusion of deep and shallow features.
In the training stage, the input speech signal is preprocessed by endpoint detection, pre-emphasis, framing, and windowing. Then, the MFCC is obtained from the processed signals to train the DNN. After the training process is completed, we extract the deep bottleneck features. Since the GMM achieves excellent performance in the field of speaker recognition, we use GMM to further get the deep Gaussian supervector of speech. On the other hand, in order to obtain the traditional acoustic characteristics, we input the MFCC to the GMM directly to obtain the traditional Gaussian supervector. The Gaussian supervector reflects the mean statistical characteristics of speech signals separately, but they ignore the relevance of different frames. Therefore, we recombine the extracted traditional and deep Gauss supervectors. Finally, the obtained deep and traditional recombined supervectors are fused in the form of the augmented vector dimension. That is, the traditional Gaussian mean supervector is horizontally spliced in the depth supervector to form a new vector with higher dimension and more personalized information. The new fused features are used to train the classifier SVM. In the test stage, we also get the fusion supervector of the test speech data according to the processing method of the training phase, and then input them into the trained SVM to obtain the classification results.
2.1. Recombined Gaussian Supervector
In the previous work, the traditional features such as MFCC [27], Gaussian statistical characteristics [15] were often applied to speaker identification, which had good performance. In this paper, we extract 48-dimension MFCC from the input speech and calculate the Gaussian statistics as the input feature to train the SVM.
2.1.1. MFCC
If the speech lasts no more than 30 ms and the frame shift is 10 ms, this voice is considered to short-term stable. Therefore, before extracting the MFCC, we often need to preprocess it first. The preprocessing mainly includes endpoint detection, pre-emphasis, framing, and windowing.
The pre-emphasis part can be realized by a high-pass filter, which is equivalent to
where is the pre-emphasis coefficient (usually in the interval [0.9, 1]).
In the process of experiment, we adopt the Hamming window to smooth edge of framed signals and make it periodic. The window function is defined as follows,
MFCC represents the transient power range of human speech [15]. Mel frequency reflects the conversion relationship between actual frequency and perceptual frequency. It can be obtained by using the formula [28]
where is the actual frequency and its unit is Hz.
The specific steps and flow chart of the extraction process are shown in Figure 2. Firstly, the continuous speech signal in time domain is transformed into discrete digital signal by sampling, framing and windowing, and then FFT or DFT transformation is applied to each frame to obtain the corresponding linear spectrum. Secondly, the actual frequency is converted into Mel frequency scale, and the linear spectrum is input into the Mel filter bank for filtering to obtain Mel spectrum. Next, logarithmic power spectrum is obtained by logarithmic operation. Finally, the correlation between the components is eliminated by DCT transformation, and the MFCC parameters are obtained. In addition, the first-order difference parameters ∆MFCC describing the dynamic features are also selected as speech features.

Figure 2.
Flow chart of extracting Mel-Frequency Cepstral Coefficient (MFCC).
2.1.2. Extraction of Recombined Gaussian Supervector
GMM has been widely utilized in speaker recognition. In this paper, we mainly adopt the GMM to extract the Gaussian mean supervector. The parameters are estimated from input data using the Expectation Maximum (EM) algorithm [29]. The M-order GMM Gaussian probability formula is given by
where X is a D-dimensional random vector, and is the density function represented in the vector space , is the mixed weight and satisfies . The density is given by
where refer to the mean vector and covariance matrix, respectively. Therefore, we usually use the model to represent the kth mixture component.
Given a feature vectors set , the aim of applying the GMM is to compute the necessary statistics. We first set the Gaussian component number and initial value, and then use the EM algorithm to estimate a new parameter . The new model parameters are input to the next training until the model converges. The parameters are shown as follows
In this paper, we mainly use the mean vector of each Gaussian component. In order to make the input vector contain more personality information, we connect them to form the mean supervector. It can be represented as follows: , where the is the mean vector of i-th component. If we consider each mean vector separately, the correlation between them will be ignored. If the Gaussian correlation number is too large, the performance of the system will be reduced due to the decrease of the feature correlation between multiple frames. Therefore, it is important to select an appropriate Gaussian correlation number to recombine the feature vector. The first new mean vector obtained is . According to this rule, the recombined supervector is obtained by traversing the entire supervector in turn. Finally, we will get reconstructed supervectors. The relationship between and satisfies the following equation
where M is the number of original Gaussian supervectors. The new traditional recombined vector can be expressed by , where represents the each recombined supervector.
2.2. Deep Recombined Gaussian Supervector
Since the traditional features such as MFCC, LPCC and Gaussian supervector simply represent the shallow physical information of the speaker’s voice, they cannot extract the features on a deeper level. Therefore, it is necessary to get the feature vector, which can remove redundant information and reflect the speaker’s identity information more deeply. DNN has achieved an overall success in automatic speaker recognition [30,31]. There are two major applications of DNN: one is used as a classifier and the other is to extract speech features frame by frame. In our work, we design a DNN to obtain deep bottleneck features.
2.2.1. Deep Neural Network Model
The DNN is an MLP with multiple hidden layers, each of which is implemented by Restricted Boltzmann Machine (RBM) [32]. The value of the input and hidden units is generally binary which obey the Bernoulli distribution. The energy function is defined by
where represents the state of the visible and hidden layer, respectively. The parameter denotes the connection weights between visible and hidden unit as and the biases of the visible and hidden layers.
The training of DNN can be divided into two stages: pre-training and fine-tuning. In the pre-training stage, we adopt an unsupervised method to finish the initialization of DNN. Contrastive Divergence (CD) [33] is used to estimate the parameters of RBM. In the fine-tuning stage, we adopt the Back Propagation (BP) algorithm to finely adjust the network parameters. In this process, the parameter of the network is adjusted supervised. Thus, it is necessary to align each frame of training data with corresponding speaker labels.
2.2.2. Extraction of Deep Recombined Gaussian Supervector
In general, the DNN is composed of the input layer, the output layer and the hidden layer. We mainly extract deep bottleneck features from raw speech. The Figure 3 shows the DNN structure used in this paper. We design five layers’ network to train the speech signal, including the input layer, three hidden layers and the output layer. The structure of the network is 200-200-48-200-10. The number of neuron nodes in the output layer is the total number of speakers to be identified. Firstly, MFCC features of the training speech signals after preprocessing are extracted as the input of DNN. After the pre-training and fine-tuning stage are completed, the bottleneck layer is regarded as the new output. Thus, the traditional characteristic parameters are converted into the deep bottleneck features.
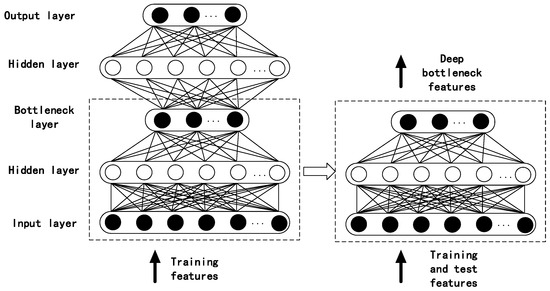
Figure 3.
Deep Neural Network (DNN) model for extracting deep bottleneck features.
After the deep bottleneck features are obtained, we use them as the input of GMM to get the Gaussian mean vector. Since there are some correlations between the Gaussian mean vectors of different frames, we further recombine these vectors according to the rules mentioned in Section 2.1.2. The new deep recombined Gaussian supervector is expressed by , where represents each recombined component.
2.3. Classification Based on Fusion Features
In order to consider the complementarity between deep and shallow recombination supervector, we splice the traditional recombined supervector horizontally behind the deep recombined Gaussian supervector. Through and , we can get the new fusion features as follows,
after the fusion vectors are obtained, we input them into the SVM so as to achieve a judgement.
2.3.1. Support Vector Machine Classifier
The target of SVM training is to find the maximum margin hyperplane for learning samples that can distinguish different speaker identity information. When the input sample data has linear separability, the learning of SVM can be achieved by solving the following optimization problems
where represent the weight vector. If the data set is nonlinear, we need to introduce the kernel function which can map the original data to a new feature space. The dimension of the new feature space is higher than that of the former one. In addition, since the Radial Basis Function (RBF) has shown its unique advantages in pattern recognition, the RBF is used in the proposed model. The formula of RBF is as follows
which is a radial symmetric scalar function. It is usually defined as a monotone function of Euclidian distance between any point and a certain center in a space, which can be denoted as .
In our work, speaker recognition is a multi-classification task. One-to-one and one-to-many are the two main methods to realize the multiple classification problem in SVM. Since the speed of the former is much faster, we adopt the One-to-one to finish speaker recognition.
2.3.2. Fisher Criterion Selection
In the fusion model, the dimension of feature fusion input into SVM classifier may be very large, which will increase the modeling time. Therefore, an effective dimension reduction strategy should be taken to remove the useless speaker identity information and reduce the computational complexity of the model. We choose the Fisher criterion [34] to complete the feature selection of the deep and shallow recombination Gaussian supervector. The main idea of Fisher criterion selection is that the Euclidean distance between the same category is smaller, while the distance between different features is larger. We define the q-dim feature of the i-th emotion as and the Fisher criterion discriminant coefficient can be calculated by
where represents the total number of speakers, and are the mean and variance of the vector . In our proposed method, after the deep and shallow recombined supervector are fused, we calculate the Fisher coefficients between fusion features of the different identified speakers. Next, we sort them in ascending order and remove the corresponding features with smaller coefficients. Finally, the reserved features form a new vector and some irrelevant information can be eliminated.
3. Optimization of Feature Weight Coefficient
In the above speaker recognition system, when the two types of feature are fused, they are directly spliced in the horizontal direction. That is to say, we default that the two parameters have the same contribution to the system, and there is no processing in the subsequent steps. It is found that when the number of speakers increases, the difficulty of recognition will increase. Therefore, the recognition accuracy of the system will decrease. For each speaker, the contribution of different parameters to the final recognition result is different, so the importance of each parameter will be involved. When several types of features are fused, the weight coefficients between them will be considered to further improve the recognition rate and reduce the probability of misjudgment. Therefore, in order to measure the weight of each feature more accurately, we use two common optimization algorithms—Genetic Algorithm (GA) [35] and Simulated Annealing (SA) [36] algorithm to find the most appropriate weights. The system block diagram is shown in Figure 4.
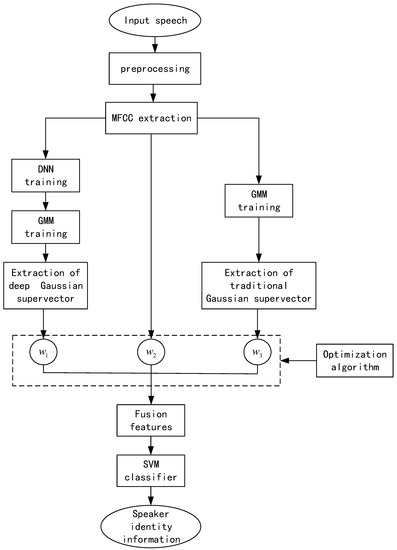
Figure 4.
Speaker recognition system based on optimized weight coefficients.
When the number of speakers increases, using only two features is not enough to describe the speakers comprehensively. In order to more fully describe the identity information, in the system shown in Figure 4, three different characteristics are used to obtain the fusion features. In the above system, we use three features: deep recombined Gaussian supervector, traditional recombined Gaussian supervector and MFCC. Assuming that the i-th feature is expressed by , the corresponding weight coefficients is . The fused features of optimized weight coefficients can be expressed as follows
where the represents the fused feature, and N is the number of features. In this paper, the value of N is 3.
In the training stage, the GA or SA algorithms can be used to find the optimal weights of three types of features, and then they are multiplied by their respective coefficients. Lastly, they are spliced horizontally to form a new feature. In the test stage, we also use the method of training phase to obtain the fusion characteristics of the test set. When the training feature and test feature are obtained, and then input them into the classifier SVM to obtain the identity information of the speakers.
4. Experiments and Results
4.1. Database Description and Experiment Setup
In order to verify the effectiveness of the proposed method, we choose to conduct experiments on the database that is recorded in Chinese. The database, which is widely used in speaker recognition, derives from the national 863 key projects (2006AA010102) and it contains 210 speakers totally. To make our research more representative, we select 10 speakers randomly for the following experiment. There are five male and five female participants. Each speaker reads 180 utterances that last about five seconds. We randomly choose 80 utterances, of which 60 files are used as the training samples and the rest samples are used as the test samples. Since the SVM classifier has good performance in the field of speaker recognition, we utilize the LIBSVM toolbox (https://www.csie.ntu.edu.tw/~cjlin/libsvm/) by Professor Lin Zhiren of Taiwan University to realize the classification.
We do the endpoint detection in advance of the extraction of speech characteristic parameters. In general, speech signals are considered to be invariant in a short time. Therefore, the input samples need to be framed into small segments. We divide them in the form of 256 points length and 128 points shift. The features used in this work is the MFCC, which include 24 order MFCC and dynamic characteristics 24-∆MFCC. The DNN structure and training parameters are obtained by experiment. Firstly, the parameters of the input layer are the original acoustic characteristic MFCC, which contains 48 dimensions, and then there are three hidden layers after the input layer. Lastly, the output layer is used for classification, and the number of neurons is the same as the number of people to be identified.
4.2. Experimental Results and Analysis
4.2.1. The Impact of Deep Network Parameters on the System
For the pattern classification problem, the feature parameters are the important factor that determines the system performance. Therefore, in order to get the best performance of the fusion model, we perform the experiment by changing the network structure and training parameters to find the optimal deep network.
(1) In the process of deep network training, the batch size is a key factor affecting the extraction of depth features. With setting the batch values to 5, 10, 15, 20 and 25, six groups of experiments are designed to search the best value of batch size. The network structure is 48-200-48-200-10. The recognition rate is shown in Figure 5. As can be seen from the Figure 5, when the batch size is greater than 10, the recognition rate will decrease with the increase of batch value. It can be explained by the fact that the oversize batch value may lead to the overfitting of network training. In other words, the network has poor generalization performance. On the other hand, the batch size is too small to speed up the convergence, which will greatly increase the training time. Therefore, an appropriate batch value is important for network training. When the value is set to 10, the recognition rate of the system reaches the peak. Thus, in the subsequent experiment, we set the batch size to 10.
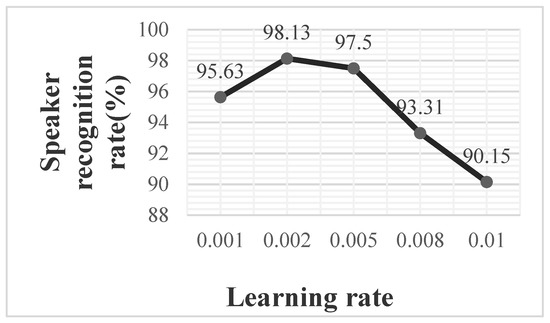
Figure 5.
Speaker recognition rate with different batch sizes.
(2) Previous studies have found that the learning rate of DNN also has a significant impact on system performance. In our work, a group of comparative experiments with different learning rates are conducted. From the result shown in Figure 6, it is indicated that the performance of speaker recognition is improved with the increase of learning rate as the learning rate is not higher than 0.002. When the learning rate is smaller, the speed of convergence will be slower, which will cause large time consumption. On the contrary, if we set the learning rate too big, the optimal value may be missed in the iteration process and the extracted features will be undesirable. It is not difficult to find that the most suitable learning rate is 0.002 from the experiment results. Thus, in this paper, the learning rate is set to 0.002.
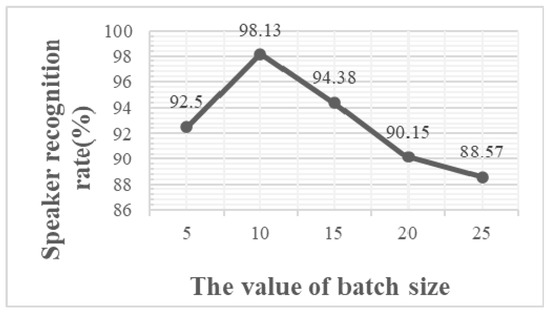
Figure 6.
Speaker recognition rate with different learning rate.
(3) Due to the position of the bottleneck layer is also an important factor affecting the system performance. To find the best network structure, by changing the location of the bottleneck layer and the number of Gaussian correlations, three sets of comparative experiments are carried out. We set the first hidden layer, second hidden layer, third hidden layer as bottleneck layer, respectively. That is to say, the network structures are 48-48-200-200-10, 48-200-48-200-10 and 48-200-200-48-10. The Gaussian component is 1024. Table 1 shows the system recognition rate with the bottleneck layer at different locations. It is not difficult to find that the system performance achieves the best when the second hidden layer is set as the bottleneck layer. It can be explained that some important features may be neglected if the extracted features are located farther ahead. Conversely, if the position is later, the features may be redundant, which will also affect the performance of the system. Moreover, by observing the data of each row in the table, for different network structures, when the number of correlations is 64 and the parameters of the second hidden layer are used as bottleneck layer features, the system has the highest recognition rate. These also illustrate the importance of the correlation between features. Therefore, we will adopt the structure 48-200-48-200-10 in the following experiment.

Table 1.
Speaker recognition rate with bottleneck layer at different positions (%).
4.2.2. The Superiority of Bottleneck Features
As an important modern tool for feature extraction, the deep neural network has shown its unique advantages. There are more than two layers in the deep network. The output of each layer can be used as a type of feature, which represents the information of input signal at different levels. Therefore, it is an important issue to choose which layer of output has the depth feature. In this paper, there are five layers in the deep network. The third layer is set as the bottleneck layer and the number of Gaussian components is 1024. In addition, we extract the characteristics from the first, second and third hidden layers respectively for experiments.
According to the Figure 7, when the Gaussian correlation number is lower than 64 and the bottleneck features are adopted as the training feature, the system recognition rate is similar to that of the system with the feature from the first or third layer. However, when the correlation number is higher than 64, the performance of the bottleneck feature is significantly better than that of other layers. Evidently, it turns out that the bottleneck feature is superior to the other depth features. It can be explained that the deep bottleneck feature removes the redundant part of input features and has a more concise and abstract representation. As a further step to compare the performance between the traditional features and deep bottleneck features, we conduct a series of comparative experiments using the MFCC and bottleneck features. In the MFCC-based system, we use MFCC as the input of GMM directly, and then recombine the mean supervector to finish judgment by SVM. In the system based on the bottleneck feature, we first obtain the deep bottleneck feature by using MFCC as the input of DNN, and then the subsequent process is the same as the traditional recombination supervector. Finally, we still use SVM for decision classification. The results of the two kinds of features are displayed in Table 2.
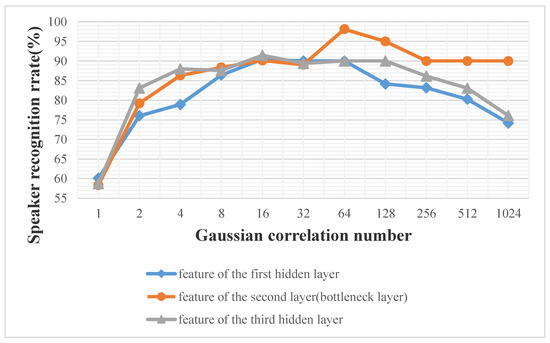
Figure 7.
Speaker recognition rate with features from different hidden layers.

Table 2.
Comparison of recognition results between MFCC and bottleneck features (%).
It can be seen from Table 2 that the DNN-based system is far better than the traditional features in most cases. It can be proved that the feature extracted from the DNN can excavate the deeper identity information and contain more distinguishable characteristic. Moreover, the dimension of bottleneck layer is far less than the other layers. This also fully displays that it can effectively compress identity-related information in the bottleneck layer. Therefore, in this paper, we make full use of its advantages and select the bottleneck feature as the deep feature.
4.2.3. Performance of Speaker Recognition Using the Proposed Fusion Model
In the speaker recognition system, although the traditional acoustic features and depth features show their own respective advantages, few researchers have considered the complementarity between them. As a further method toward improving the performance of speaker recognition, we have proposed to fuse the shallow and deep features displayed in Section 2. According to the research findings in the Section 4.2.1 and Section 4.2.2, we have obtained the optimal depth characteristics and network parameters. Therefore, we will set the network at 200-200-48-200-10, the learning rate is 0.002, and the batch value is 10. On one side, we used the bottleneck features to train the GMM. On the other side, we use the MFCC to obtain traditional Gaussian supervector. Lastly, we combine them to train the classifier. In order to verify the validity of the fusion model, we compare the fusion model with MFCC, deep recombined supervector and i-vector [37]. In our work, after the deep bottleneck features are obtained, we input them to the GMM-UBM to extract the i-vector. We set the dimension of MFCC as 24. Combining its first-order difference, the total dimension of acoustic characteristics is 48. The component of UBM is 1024. The dimension of i-vector is 400. After the i-vector is extracted, it is input into SVM for classification to complete speaker identification. A more detailed introduction can be found in [38,39]. The results of the comparative experiments are displayed in Figure 8 and Figure 9.
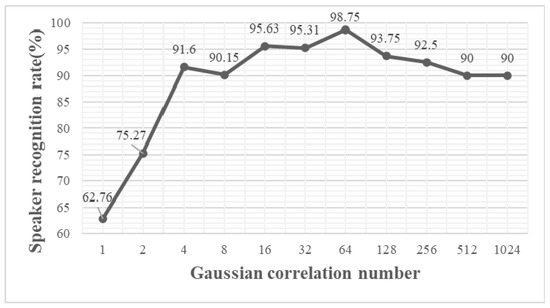
Figure 8.
Speaker recognition results based on the proposed fusion model.
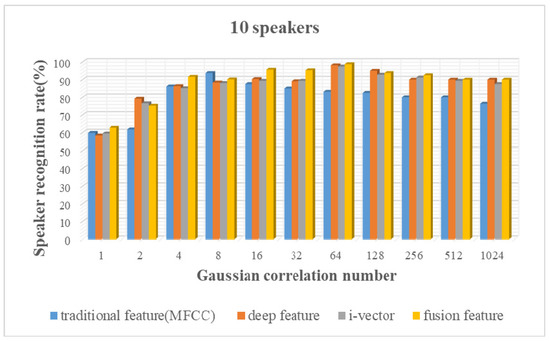
Figure 9.
Speaker recognition rate based on four types of features (10 speakers).
From the above experimental results, it is easy to find that the recognition of the proposed fusion feature is significantly better than the other three features in most cases. In particular, when the Gaussian correlation number is set to 64, the performance of the proposed fusion model reaches the peak with a 98.75% recognition rate. Compared to the method based on the traditional feature and deep feature, the proposed fusion method outperforms them by 5% and 0.62%, respectively. This concludes that the performance of speaker recognition system is better in terms of accuracy rate when the traditional feature and deep feature are combined together. It also proves that the proposed fusion method takes into account the complementarity between different categories of features.
In general, the number of speakers may affect the system performance. In the above experiment, we select only 10 speakers to conduct the comparative experiment. Therefore, in order to improve the system robustness, we enlarge the number of speakers to 20 and they are selected randomly from the database. We extract the traditional Gaussian supervector and deep Gaussian supervector in the same way, and then fuse the two kinds of vectors as the new acoustic feature. The other parameters are the same as the 10 speaker’s recognition system. We compare the performance of shallow feature, deep feature and the fused feature, respectively. The experimental results are shown in Figure 10.
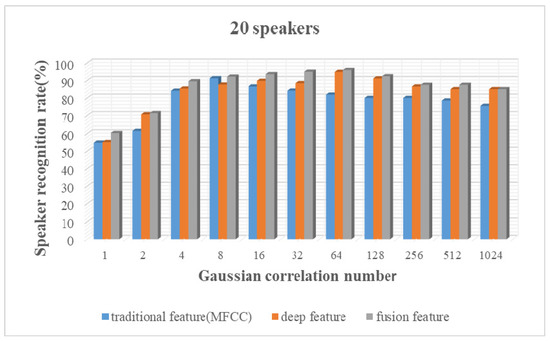
Figure 10.
Speaker recognition rate based on three types of features (20 speakers).
From the above result, when the Gaussian component number is 1024 and the correlation number is 64, the proposed system can reach the highest recognition rate of 95.94%. Compared with the other two methods, the newly proposed method is improved by 4.71% and 1.06%, respectively. As the number of people increases, the highest recognition rate of the system will decrease to some extent. However, the performance of our proposed system is better them even if the number of people increases. At the same time, it can be seen that the new method can work well when the training data sample is small. This also can prove that our proposed method has good generalization ability and the result is not a special case.
As a further step to verify the influence of Gaussian component number, we set it in the fusion model to 256, 512, 1024 and 2048 to carry out a set of experiments. The number of speakers is 10 and the parameters of the network are the same as the Section 4.2.3.
As we can see from Figure 11, when the Gaussian correlation number is greater than 32, the larger Gaussian component number is, the better of the performance will be. When the Gaussian component number is 256 and correlation numbers is less than 32, the system recognition rate is better, but it is still unsatisfactory. This also indicates that the performance of the system can be enhanced when the Gaussian component is large enough. However, the recognition rate cannot be improved indefinitely. The recognition rate can reach 98.75%, when the Gaussian component number is 1024 and the correlation numbers is 64. As the number of components increases, the computational complexity and the training time will also grow to a certain extent. Thus, choosing a suitable number of Gaussian components is also an important factor in the speaker recognition model.
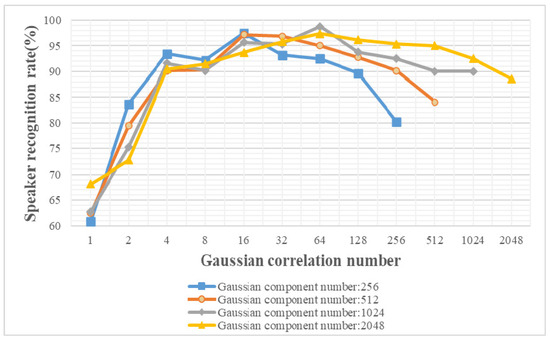
Figure 11.
Speaker recognition rate of different Gaussian component number.
In the proposed model, there may be some redundancy in the fusion features. On the one hand, when the original Gaussian mean vectors are recombined, the dimension of the vector will be enlarged by splicing the mean vector. On the other hand, the process of fusing the deep and shallow recombination vectors also expands the dimension of the vector. It will increase the computational complexity and classification time. Therefore, in order to eliminate the influence of fusion feature redundancy, we adopt Fisher criterion to filter out some useless information. Through the above experiments, it can be found that the performance is best when the correlation number is 64. Thus, in the following experiments, we mainly focus on the case where the Gaussian mixture number is 1024 and the correlation number is 64. The experimental results are displayed in Figure 12.
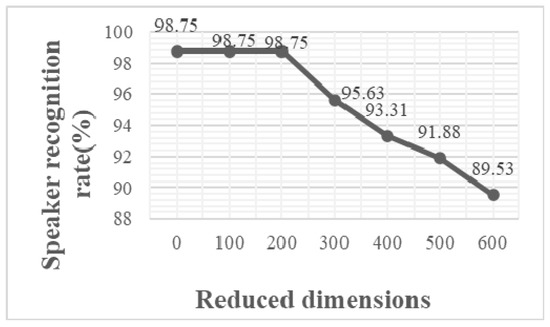
Figure 12.
Speaker recognition rate based on Fisher criterion feature selection.
We can find that the performance of the system remains unchanged when the reduced dimension is less than 200. However, when the reduced dimension is higher than 200, the recognition rate will decrease gradually. It can be concluded that the Fisher criterion can only filter the redundant information of fusion features to a limited degree. There is plenty of room for performance improvement, so further search for better algorithms is needed to reduce the dimensions of features.
4.2.4. Performance of Speaker Recognition Based on the Optimized Weight Coefficients
In the Section 4.2.3, when we enlarge the number of speakers to 20, the highest recognition rate can reach 95.94%. Compared to the case of 10 speakers, the performance of the system decreases to some extent. Therefore, in order to prove the superiority of the fusion feature based on the optimized weight coefficients, this section conducts relevant comparative experiments on the system proposed in the Section 3. The total speakers are 20 and the three types of feature are deep recombination Gaussian supervector, traditional Gaussian supervector and MFCC. The setting of relevant parameters is the same as Section 4.2.3. The dimension of MFCC is 48 and the number of Gaussian components is 1024. When the GA algorithm is used for optimization, the maximum number of individuals in the population is 50, the number of iterations is 500, the crossover probability is set to 0.45, and the mutation probability is set to 0.02. In SA, the annealing rate is 0.95, the number of iterations is 500, and the step size of the metropolis is 0.02. We conduct experiments on traditional Gaussian supervectors, deep Gaussian supervectors, directly fused features, and fused features with weighted coefficients. Figure 13 shows the recognition rate of different types of features under different correlation numbers.
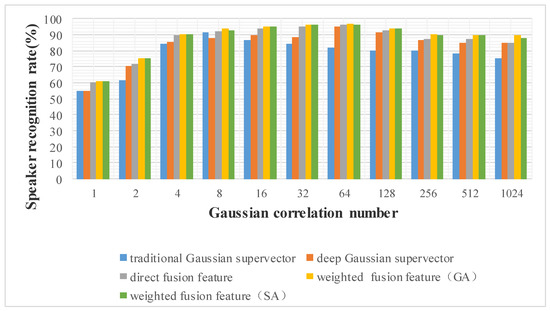
Figure 13.
Speaker recognition rate based on different types of features (20 speakers).
The last two bars in the Figure 13 represent the performance of using GA and SA algorithms for weight optimization. As can be seen from the figure, the highest recognition rates corresponding to different features are 91.23%, 94.88%, 95.94%, 96.75%, 96.3%. The performance of the fused feature with weighted coefficients is better than the other three kinds of features. Compared to the performance of directly fused features, the corresponding recognition rate is increased by 0.81% and 0.36% when we use GA or SA, respectively. In addition, under different Gaussian correlation numbers, the performance is better than the system with a single feature. It also proves the effectiveness of the weighted fusion feature method using the optimization algorithm in Section 3 of the multi-user scenario. In the case of different correlation numbers, the speaker recognition rate obtained by using the GA is generally higher than the SA. Therefore, in the application scenario of speaker recognition in this paper, GA is more suitable for weight optimization than SA.
Based on the study of Section 4.2.3, it is found that there will be some redundancy in the fusion features. In the system proposed in Section 3, three kinds of features are fused. This is more likely to cause feature redundancy. Therefore, in order to reduce the adverse effects of excessively high fusion feature dimensions, in the speaker recognition system based on GA, two dimensionality reduction strategies are used to screen the redundant features, and then input them into the classifier for training, so as to realize the speaker identification.
The experimental results in Figure 14 show that when the dimension of filtered feature is less than 200, the recognition rate of Fisher screening method does not decrease, and the change of the recognition rate is not obvious in the PCA-based system. When the subtracted dimension is greater than 200, the corresponding performance of two methods decline rapidly, and the change of PCA method’s recognition rate is more obvious. The above results show that there is a certain amount of redundant information in the fusion features, which needs to be selected reasonably, so as to ensure that the performance will not decline while removing the redundant information.
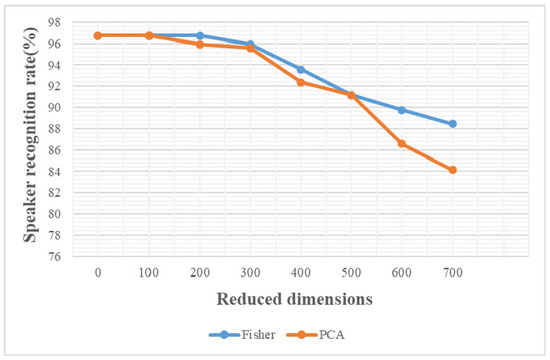
Figure 14.
Speaker recognition rate of the weighted fusion feature based on two feature selection methods (20 speakers).
5. Conclusions
In this paper, we present a novel speaker recognition model based on deep and shallow recombined Gaussian supervector, which can effectively improve the system’s performance. In this proposed approach, we first extract MFCC from the original speech signal, and then input them into the DNN to extract the depth bottleneck feature to obtain the depth Gaussian supervector further. On the other hand, we directly use the MFCC to train the Gaussian mixture model to get the traditional Gaussian supervector. Finally, they are recombined and spliced horizontally to form a higher dimension fusion feature. New features are used to train SVM for final judgment. In order to obtain the best performance, we adjust the network parameters and select the optimum depth characteristics through experiments. To assess the new approach, we compare it with the system based on depth features or traditional features alone. The finding results show that the fusion method can enhance the system performance effectively. In addition, when the number of speakers to be recognized increases, in order to prevent the system recognition rate from falling sharply, we introduce the optimization algorithm to find the optimal weight before the feature fusion. The experimental results demonstrate that the fusion feature based on optimized weight coefficients can improve the recognition rate by 0.81%. Due to feature fusion, the vector dimensions input into SVM will be enlarged, resulting in higher system complexity and longer running time. The Fisher criterion can merely reduce a small part of redundant information. Therefore, the key focus of our next research direction is to find a superior algorithm to further optimize the time and computational complexity of the system.
Author Contributions
Conceptualization, L.S. and B.Z.; Methodology, L.S.; Software, B.Z.; Validation, Y.B., B.Z. and S.F.; Formal Analysis, P.L. and Y.B.; Investigation, S.F.; Resources, B.Z. and S.F.; Data Curation, Y.B.; Writing—Original Draft Preparation, L.S. and B.Z.; Writing—Review & Editing, L.S., Y.B. and B.Z.; Visualization, Y.B.; Supervision, P.L.; Project Administration, L.S.; Funding Acquisition, L.S. All authors have read and agreed to the published version of the manuscript.
Funding
This research was funded by the National Natural Science Foundation of China (No. 61901227, No.61671252), the Natural Science Foundation of the Jiangsu Higher Education Institutions of China (No. 19KJB510049), and Research Project of NJUPT (No. JG06219JX08).
Institutional Review Board Statement
Not applicable.
Informed Consent Statement
Not applicable.
Data Availability Statement
Not applicable.
Acknowledgments
The authors would like to thank the anonymous reviewers for their comments and suggestions.
Conflicts of Interest
The authors declare no conflict of interest.
References
- Pravallika, P.; Prasad, K.S. SVM classification for fake biometric detection using image quality assessment: Application to iris, face and palm print. In Proceedings of the 2016 International Conference on Inventive Computation Technologies (ICICT), Coimbatore, India, 26–27 August 2016; pp. 1–6. [Google Scholar] [CrossRef]
- Khokher, R.; Singh, R.C.; Kumar, R. Footprint Recognition with Principal Component Analysis and Independent Component Analysis. Macromol. Symp. 2015, 347, 16–26. [Google Scholar] [CrossRef]
- Galbally, J.; Marcel, S.; Fierrez, J. Image Quality Assessment for Fake Biometric Detection: Application to Iris, Fingerprint and Face Recognition. IEEE Trans. Image Process. 2014, 23, 710–724. [Google Scholar] [CrossRef] [PubMed]
- Zinchenko, K.; Wu, C.-Y.; Song, K.-T. A Study on Speech Recognition Control for a Surgical Robot. IEEE Trans. Ind. Inform. 2017, 13, 607–615. [Google Scholar] [CrossRef]
- Wang, J.-F.; Kuan, T.-W.; Wang, J.-C.; Sun, T.-W. Dynamic Fixed-Point Arithmetic Design of Embedded SVM-Based Speaker Identification System; Lecture Notes in Computer Science; Springer: Berlin/Heidelberg, Germany, 2010; Volume 6064, pp. 524–531. [Google Scholar] [CrossRef]
- Wu, Z.; Cao, Z. Improved MFCC-based feature for robust speaker identification. Tsinghua Sci. Technol. 2005, 10, 158–161. [Google Scholar] [CrossRef]
- Murty, K.S.R.; Yegnanarayana, B. Combining evidence from residual phase and MFCC features for speaker recognition. IEEE Signal Process. Lett. 2006, 13, 52–55. [Google Scholar] [CrossRef]
- Zhao, X.; Wang, D.L. Analyzing Noise Robustness of MFCC and GFCC Features in Speaker Identification. In Proceedings of the 2013 IEEE International Conference on Acoustics, Speech and Signal Processing, Vancouver, BC, Canada, 26–31 May 2013; pp. 7204–7208. [Google Scholar] [CrossRef]
- Sahidullah, M.; Saha, G. A Novel Windowing Technique for Efficient Computation of MFCC for Speaker Recognition. IEEE Signal Process. Lett. 2013, 20, 149–152. [Google Scholar] [CrossRef]
- Han, W.; Chan, C.-F.; Choy, C.-S.; Pun, K.P. An Efficient MFCC Extraction Method in Speech Recognition. In Proceedings of the 2006 IEEE International Symposium on Circuits and Systems, Island of Kos, Greece, 21–24 May 2006; pp. 145–148. [Google Scholar] [CrossRef]
- Atal, B.S. Effectiveness of linear prediction characteristics of the speech wave for automatic speaker identification and verification. J. Acoust. Soc. USA 2005, 55, 1304–1312. [Google Scholar] [CrossRef]
- Zbancioc, M.; Costin, M. Using Neural Networks and LPCC to Improve Speech Recognition. Signals, Circuits and Systems; International Symposium: Iasi, Romania, 2003; Volume 2, pp. 445–448. [Google Scholar] [CrossRef]
- Cai, S.; Li, X.; Zou, X.; Pan, J.; Yan, Y. Power normalized perceptional linear predictive feature for robust automatic speech recognition. Biochim. Biophys. Acta (BBA)-Protein Struct. 2005, 670, 110–123. [Google Scholar]
- Paul, A.K.; Das, D.; Kamal, M.M. Bangla Speech Recognition System Using LPC and ANN. In Proceedings of the 2009 Seventh International Conference on Advances in Pattern Recognition, Kolkata, India, 4–6 February 2009; pp. 171–174. [Google Scholar] [CrossRef]
- Zergat, K.Y.; Amrouche, A. New scheme based on GMM-PCA-SVM modelling for automatic speaker recognition. Int. J. Speech Technol. 2014, 17, 373–381. [Google Scholar] [CrossRef]
- He, Q.; Wan, Z.; Zhou, H.; Yang, J.; Zhong, N. Speaker Verification Method Based on Two-Layer GMM-UBM Model in the Complex Environment. In Proceedings of the International Conference on Brain Informatics, Beijing, China, 16–18 November 2017; pp. 149–158. [Google Scholar] [CrossRef]
- Zeinali, H.; Sameti, H.; Burget, L. HMM-Based Phrase-Independent i-Vector Extractor for Text-Dependent Speaker Verification. IEEE/ACM Trans. Audio Speech Lang. Process. 2017, 25, 1421–1435. [Google Scholar] [CrossRef]
- Shahin, I.; Nassif, A.B.; Hamsa, S. Novel cascaded Gaussian mixture model-deep neural network classifier for speaker identification in emotional talking environments. Neural Comput. Appl. 2018, 32, 2575–2587. [Google Scholar] [CrossRef]
- Srinivas, V.; Santhirani, C.; Madhu, T. Neural Network based Classification for Speaker Identification. Int. J. Signal Process. Image Process. Pattern Recognit. 2014, 7, 109–120. [Google Scholar] [CrossRef]
- Matejka, P.; Glembek, O.; Novotny, O.; Plchot, O.; Grézl, F.; Burget, L.; Cernocky, J.H. Analysis of DNN approaches to speaker identification. In Proceedings of the 2016 IEEE International Conference on Acoustics, Speech and Signal Processing (ICASSP), Shanghai, China, 20–25 March 2016; pp. 5100–5104. [Google Scholar] [CrossRef]
- Richardson, F.; Reynolds, D.; Dehak, N. Deep Neural Network Approaches to Speaker and Language Recognition. IEEE Signal Process. Lett. 2015, 22, 1671–1675. [Google Scholar] [CrossRef]
- Liang, C.; Yang, L.; Zhou, R.; Yan, Y. Modeling prosodic features with probabilistic linear discriminant analysis for speaker verification. Acta Acust. 2015, 40, 28–33. [Google Scholar]
- Omar, N.M.; Hawary, M.E. Feature fusion techniques based training MLP for speaker identification system. In Proceedings of the 30th Canadian Conference on Electrical and Computer Engineering (CCECE), Windsor, ON, Canada, 30 April–3 May 2017; pp. 1–6. [Google Scholar] [CrossRef]
- Zhong, W.F.; Fang, X.; Fan, C.H.; Wen, Z.Q.; Tao, J.H. Fusion of deep shallow features and models for speaker recognition. Acta Acust. 2018, 43, 263–272. [Google Scholar] [CrossRef]
- Liu, Z.; Wu, Z.; Li, T.; Li, J.; Shen, C. GMM and CNN Hybrid Method for Short Utterance Speaker Recognition. IEEE Trans. Ind. Inform. 2018, 14, 3244–3252. [Google Scholar] [CrossRef]
- Asbai, N.; Amrouche, A. A novel scores fusion approach applied on speaker verification under noisy environments. Int. J. Speech Technol. 2017, 20, 417–429. [Google Scholar] [CrossRef]
- Ali, H.; Tran, S.N.; Benetos, E.; Avila, G.A.S. Speaker recognition with hybrid features from a deep belief network. Neural Comput. Appl. 2016, 29, 13–19. [Google Scholar] [CrossRef]
- Bosch, L.T. Emotions, speech and the ASR framework. Speech Commun. 2003, 40, 213–225. [Google Scholar] [CrossRef]
- Lung, S.-Y. Improved wavelet feature extraction using kernel analysis for text independent speaker recognition. Digit. Signal Process. 2010, 20, 1400–1407. [Google Scholar] [CrossRef]
- Lei, Y.; Scheffer, N.; Ferrer, L.; McLaren, M. A novel scheme for speaker recognition using a phonetically-aware deep neural network. In Proceedings of the 2014 IEEE International Conference on Acoustics, Speech and Signal Processing (ICASSP), Florence, Italy, 4–9 May 2014; pp. 1695–1699. [Google Scholar] [CrossRef]
- Liu, Y.; Qian, Y.; Chen, N.; Fu, T.; Zhang, Y.; Yu, K. Deep feature for text-dependent speaker verification. Speech Commun. 2015, 2015, 1–13. [Google Scholar] [CrossRef]
- Hinton, G.E. A Practical Guide to Training Restricted Boltzmann Machines. Momentum 2010, 9, 926–947. [Google Scholar] [CrossRef]
- Fischer, A.; Igel, C. Bounding the Bias of Contrastive Divergence Learning. Neural Comput. 2011, 23, 664–673. [Google Scholar] [CrossRef]
- Sun, L.; Fu, S.; Wang, F. Decision tree SVM model with Fisher feature selection for speech emotion recognition. EURASIP J. Audio Speech Music Process. 2019, 2019. [Google Scholar] [CrossRef]
- Zhan, Y.; Leung, H.; Kwak, K.; Yoon, H. Automated Speaker Recognition for Home Service Robots Using Genetic Algorithm and Dempster–Shafer Fusion Technique. IEEE Trans. Instrum. Meas. 2009, 58, 3058–3068. [Google Scholar] [CrossRef]
- Chen, C.M.; Dai, X.M.; Zhan, Y.H.; Zheng, J. Implementation of Simulated Annealing Algorithm in Neural Net. Mod. Comput. (Prof. Ed.) 2009, 2009, 34–36. [Google Scholar]
- Bahmaninezhad, F.; Hansen, J.H.L. i-Vector/PLDA speaker recognition using support vectors with discriminant analysis. In Proceedings of the 2017 IEEE International Conference on Acoustics, Speech and Signal Processing (ICASSP), New Orleans, LA, USA, 5–9 March 2017; pp. 5410–5414. [Google Scholar] [CrossRef]
- Mak, M.-W.; Pang, X.; Chien, J.-T. Mixture of PLDA for Noise Robust I-Vector Speaker Verification. IEEE/ACM Trans. Audio Speech Lang. Process. 2016, 24, 130–142. [Google Scholar] [CrossRef]
- Lei, L.; Kun, S. Speaker Recognition Using Wavelet Packet Entropy, I-Vector and Cosine Distance Scoring. J. Electr. Comput. Eng. 2017, 2017, 1–9. [Google Scholar] [CrossRef]
Publisher’s Note: MDPI stays neutral with regard to jurisdictional claims in published maps and institutional affiliations. |
© 2020 by the authors. Licensee MDPI, Basel, Switzerland. This article is an open access article distributed under the terms and conditions of the Creative Commons Attribution (CC BY) license (http://creativecommons.org/licenses/by/4.0/).