Abstract
Vitamin C is widely use in cosmetics and pharmaceutics products for its active properties. However ascorbic acid shows unfavourable chemical instability such as oxidation leading to formulation problems. Therefore, carriers, such as micro- and nanoparticles, have been widely investigated as delivery systems for vitamin C to improve its beneficial effects in skin treatment. However, none of the previous studies have been able to produce microparticles with a high encapsulation entrapment of vitamin C. The aim of the present study is to use an experimental design to optimize the synthesis of polyamide microparticles for the delivery of ascorbic acid. The effect of four formulation parameters on microparticles properties (size and morphology, encapsulation efficiency and yield, release kinetics) were investigated using a surface response design. Finally, we were able to obtain stable microparticles containing more than 65% of vitamin C. This result confirms the effectiveness of using design of experiments for the optimisation of microparticle formulation and supports the proposal of using them as candidate for the delivery of vitamin C in skin treatment.
1. Introduction
Vitamin C is an active ingredient widely used in several applications such as cosmetic, food, and pharmaceutical [1,2,3,4] for various properties of a human being. Ascorbic acid (vitamin C) is essential for numerous biological processes in the human body. These include its role as antioxidant by reducing reactive oxygen species (ROS) such as superoxide radicals [5]. It is also well known that, applied on the skin, vitamin C acts as a stimulus for collagen synthesis [6] or as a skin whitener [7]. This is why ascorbic acid is widely used in cosmetic formulation, especially in anti-aging products [8,9,10].
The main issue with vitamin C is its short half-life and its quick degradation kinetics (first-order) [11,12,13,14,15]. Smuda et al. [16] have shown that 75% of vitamin C degradations are induced by the Maillard reaction caused by oxidation triggered by light and heat. The end products are carbonyl and dicarbonyl compounds, carboxylic acids, and amides. Among other compounds, they identified N6-xylonyl lysine, N6-lyxonyl lysine, and N6-threonyl lysine as unique and characteristic end-products of vitamin C degradation through Maillard systems. Such phenomena that occur in products lead to colouration of the bulk and a decrease of efficacy of the cream. As the oxidized form of vitamin C does not have a desired effect on skin, several formulation tips have been studied [17,18], and encapsulation technology may be an alternative [4,19,20].
Encapsulation is a technique which has been used for many years [21,22,23]. It can be defined as the inclusion of an active ingredient (a solid, liquid, or gas) into a matrix core (usually a polymer) to give a small capsule with many useful properties [24,25]. For many years, industry has applied microencapsulation to [24]:
- reduce the reactivity between the active/compound and the surrounding environment;
- control the release of the core material;
- vectorise the active to the application site;
- mask the core taste, colour, or odour.
There are several microencapsulation techniques, with different specificities, that consider the morphology, the physicochemical properties, the type of controlled release, and the scale of production of the desired particles [22,26].
More specifically, numerous approaches to this technique have been used for vitamin C encapsulation [27], such as spray drying, coacervation [28], solvent evaporation, and several other processes to achieve microencapsulation. For example, Esposito et al. [4] have encapsulated vitamin C using spray drying. The results showed that a part of the vitamin C is lost during the process (less than 50% efficient) due to the high temperature involved in the spray-drying process, which causes vitamin C degradation.
Solvent evaporation can be a good alternative because vitamin C is not heated and degradation is limited. However, literature shows that solvent evaporation allows a limited encapsulation yield (around 25%, maximum), and it is mainly used for lipophilic drugs [29].
On the other hand, interfacial polymerisation is a chemical process of encapsulation that is usually used due to its high encapsulation efficiency [30,31,32]. Interfacial polymerisation is based on the reaction of a hydrophilic monomer with a lipophilic monomer at the interface of an emulsion. Typically, in polyamide interfacial polymerisation, a condensation reaction occurs between a diamine and a diacid at the interface of immiscible liquids. The water phase contains the diamine and usually an inorganic base to activate any diol and neutralise the byproduct acid. The organic phase consists of the diacid chloride and an organic solvent such as dichloromethane, toluene, or hexane [33].
The advantages of interfacial polymerisation as an encapsulation process are:
- control of the particles’ size;
- the choice of the polymer’s structure;
- control of the morphology;
- possibility of high encapsulation yield (90%).
Studies have reported results about the effect of different variables on polyamide membranes and microcapsule interfacial properties. Indeed, solvent amount, monomer concentration, and rate of addition of the second monomers have a direct impact on the membrane size [30,32,34,35,36].
The design of experiments (DoE) is used to organize the best tests accompanying scientific research or industrial studies. They are applicable to many disciplines and in industries such as:
- chemical, petrochemical, and pharmaceutical;
- mechanical and automotive industries;
- metallurgical industries.
Design of experiments is used to obtain maximum information with minimum experience, where a relationship between a variable of interest (y) and variables (xi) is needed, such as y = f(xi). DoE is part of a general approach to quality improvement and there are many DoEs suitable for all cases encountered by an experimenter [37,38,39,40].
More specifically, they are used to achieve the following goals:
- determination of the key factors in the design of a new product or a new method;
- optimization settings of a method or an apparatus measured;
- predictive modelling of the behaviour of a process.
The aim of this study was to obtain polyamide microcapsules containing vitamin C for cosmetic application with a high encapsulation yield (more than 80%). Interfacial polymerisation, due to its characteristics (cold process, high encapsulation efficiency, etc.) was investigated. A DoE (design of experimentation) was used to investigate and optimise the key parameters affecting particles properties (size, morphology, encapsulation efficiency and yield, and release kinetics).
2. Materials and Methods
2.1. Materials
Vitamin C was purchased from IES (International Express SER, Troy, MI, USA). Terephtaloyl dichloride (TD) and 1,6-hexamethylenediamine (HA) were kindly provided by Merck (Merck Chemical, Darmstadt, Germany). Arlacel 83 (Sorbitan Sesquioleate) was purchased from CRODA (Edison, NJ, USA). Cyclohexane was supplied by VWR (Edmonton, Canada). Deionised water (Milli-Q, Etobocoke, Canada) was purified by a Millipore system. All other chemicals were used as received. All solutions were made fresh before use.
2.2. Preparation of Microparticles
The process of preparing microparticles is described on the Figure 1. Briefly, three solutions were prepared separately:
- Sol I: Organic phase containing 15 g/L of stabilizer (Arlacel 83);
- Sol II: Aqueous phase containing 1,6-hexamethylenediamine (HA) and sodium hydroxide;
- Sol III: Organic phase containing 15 g/L of stabiliser and terephtaloyl dichloride (TD).
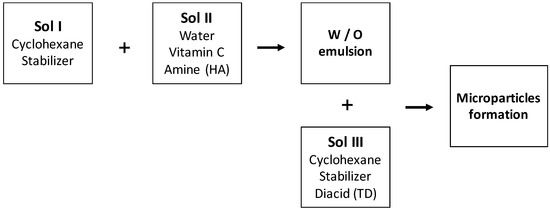
Figure 1.
Process of microparticles’ formation.
Sol I and Sol II were mixed to form a water/oil (W/O) emulsion using a rotor stator stirrer (Ultra Turax IKA T18 basic). The stirring rate was 15,500 rpm for 10 min. Next, emulsion was transferred into a reactor vessel equipped with mechanical stirrer (280 rpm). Sol III was added, at different time, for the polycondensation reaction. After 3 h, the reaction was stopped by dilution with cyclohexane.
Particles were separated from cyclohexane using a centrifuge at 4000 rpm for 20 min and were washed three times with water.
It is important to note that amine group/hydroxide group ratio in Sol II should be 1:1 to neutralise the HCl liberated during the reaction. Furthermore, polyamide microparticles were prepared with a constant molar ratio diacid group/amine group at 3:1 [41] in order to limit the residual amine monomers in the particles. Excess was removed by washing the capsules. A series of experimentations was conducted using DoE describe below (Section 2.3).
2.3. Design of Experiment (DoE)
Previous works [26,32,42] show that different parameters have important impacts on particle morphology (size, structure, porosity) and on encapsulation efficiency. To improve the process and have a better understanding of this phenomenon, a DoE (design of experiments) was carried out, with the goal to obtain particles with appropriate properties [37,40].
Design of experiments helps to test as many factors having main effects with a minimal number of tests (often). Among the different experimental designs, factorial designs are common because they are the simplest to implement and enable the very quick identification of interactions between factors. The basic principle is to assign to each factor (normalised) its lowest value (−1) and its highest value (+1). Thus, for k factors, we are left with a set of 2k possible values.
The first step is to take an interest in the responses and their interactions. There are currently different screening methods adapted to this problem, as the experiences of matrices by Plackett and Burman, full factorial design, the experience supersaturated matrices, screening in groups, bifurcation sequential, and so on.
Four parameters were studied: concentrations of cyclohexane (X1), monomers (X2), and vitamin C (X4), and speed of addition of solution III into the emulsion (X3) (Table 1).

Table 1.
Experimental factors and levels.
Five responses were studied: particles size, encapsulation efficiency, encapsulation rates, vitamin C degradation, and vitamin C liberation. With such matrices/variables/parameters, a full factorial matrix was chosen to estimate the effects of the parameters and their interactions [38]. Yates algorithm was used for the matrix construction [43]. To have some statistics, 3 points were repeated in the middle of the experimental domain. The mathematical model calculated is a linear model:
where is the average of the responses for all experiments, are coefficients of the factors X1, X2, ..., Xn, and is the interaction between n factors.
By solving the equation system, the model coefficients were obtained and, therefore, the equation of the model itself. To evaluate the explanatory power of this model, several statistical techniques were used.
● Variance analysis
The purpose of this analysis is to decompose the sum of squared deviations from the mean of the responses (TSS) measured in two amounts: the sum of the deviations from the average of the calculated responses (W) and the residual sum of squares (RSS) [44].
● Lack of fit
This section examines the variances of two terms of the residue: the fit and experimental error. The adjustment is the difference between the selected model and the real model that we do not know: lack of fit. The experimental error is measured by the standard deviation of several repetitions made under the same conditions: pure error.
● Summary of fit
R2 is the coefficient of determination. It is defined as the ratio of the sum of squared deviations from the mean of the calculated responses divided by the sum of squared deviations from the mean of the measured responses.
where is the measured response, is the calculated response, and is the mean of the responses.
If the model is simply average, the numerator is null as well as the coefficient of determination R2. If the model completely explains the measured responses, the numerator equals the denominator and R2 coefficient is 1. The closer R2 is to 1, the better the model explains the measured responses.
R2-adjusted is a statistical value whose objective is to compare various mathematical models; it considers the number of coefficient in the model
where n is the number of experiments.
Q2 is a measure of how well the model will predict the responses, and is expressed in the same unit as R2. For each response, Q2 is computed and represents the percent variation of Y that is predictive. Q2 value of 0.6 or larger indicates that the model has good predictive ability and will have small prediction error.
The plans examined previously had only two levels of study factor, and mathematical models used were of the first degree with respect to each factor. These plans were used to allow factor screening and sometimes led to simple but adequate modelling. Yet, the modelling must go through mathematical models of the second degree to be improved. We used the plans for response surfaces. Here we will discuss a composite design. The response surface model (RSM) was used to optimise critical parameters of this formulation (amount of solvent, concentration of monomers, quantity of vitamin C). One of the main objectives of this model is the determination of the optimum settings of the control variables. Having a good-fitting model that provides an adequate representation of the mean response leads to a maximum or minimum response over a certain region of interest. The mathematical model applied to the plans used for response surface model is a second-degree model with two-way interactions; below is the global equation to solve the problem:
where is the average of the responses for all experiments; is the coefficient of the factors X1, X2, ..., Xn; is the interaction between factors m and n; and is the curvature of the response.
Twenty-seven experiments were performed according to the surface response models method (Equation (5)) with a complete factorial matrix (16 experiments) (Table 3), 8 points on the axis and 3 points in domain’s centre.

Table 3.
Coefficients’ model.
All regressions were analysed by Modde software. The regression quality was evaluated by the same statistical indicator.
After verifying the validity of the model by classical statistical tests [45], the vitamin C encapsulation could be predicted in each point of the defined domain. Analysis of variance (ANOVA) was performed to determine the significance of the fitted equation. The multiple correlation coefficient statistic (R2) revealed the part of the variation of Y1 explained by the model.
2.4. Particles’ Characterisation
Formulated microparticles are characterised by the mean particle size and morphology, encapsulation efficiency, and the release of vitamin C. These characterisations are used as an answer for the screening design.
2.4.1. Particle Size and Morphology (Y1)
Particle sizes were measured by laser scattering (Malvern Mastersizer 3000, Malvern, Malvern, UK) and were characterised by their volume mean diameter (D43). Particle morphology was studied by scanning electron microscopy (SEM) (Hitachi S800 Microscope, Hitachi, Schaumburg, IL, USA).
2.4.2. Encapsulation Efficiency (Y2) and Yield (Y3)
Prior to HPLC analysis, particles were dispersed in water and broken using a rotor stator stirrer at 24,000 rpm for 10 min. Figure 2 shows polyamide microparticles before and after treatment.
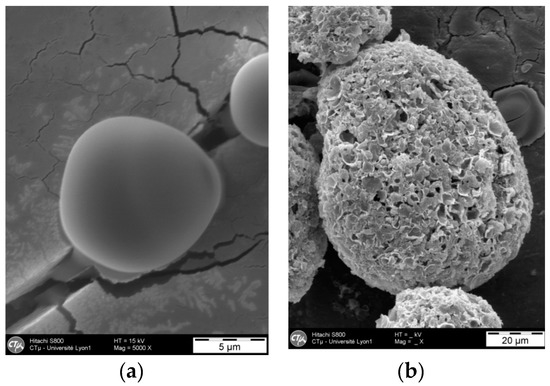
Figure 2.
Microparticles before (a) and after (b) breaking treatment.
Vitamin C analysis was conducted by HPLC using an Agilent 1260 Infinity LC (Agilent Technologies, Saint Laurant, QC, Canada) with a UV detector and Phenomenex Synergi 4 µm hydro RP 80 Å column (150 mm × 4.6 mm ×4 µm). The following parameters were used:
- analysis time: 3.5 min
- injection volume: 20 μL
- flow rate: 1 mL/min
- mobile phase: 100% water at pH 4.5
- wavelength: 280 nm
Encapsulation efficiency is defined as the ratio between the quantities of vitamin C experimentally measured () in the capsules and the quantity of vitamin C initially introduced ():
Encapsulation yield is defined as the ratio between vitamin C quantities experimentally measured in the capsules and the capsules’ weight (weight of polymers () and vitamin C ()):
2.4.3. Release of Vitamin C (Y4)
Vitamin C release was measured by HPLC with the following procedure:
Capsules were dispersed in water and stored away from light. Several samples were taken after 1, 3, 7, 15, and 30 days. Each sample was analysed by HPLC following the previous method.
The results are given in percentage of liberate active ingredient as a function of the time.
2.4.4. Colourimetric Score (Y5)
Capsules were dispersed in water and stored in light. The colour of each sample was observed at different times (1, 3, 7, 15, and 30 days). The solution turned brown due to vitamin C degradation through the Maillard reaction. A score between 1 (white solution with no degradation) and 10 (dark brown solution) was assigned to all solutions.
3. Results
The results of the 27 experiments with the 5 previously defined responses are summarised in Table 2. First, a screening design with a factorial model permits verification of the effects for each factor. Then, a central composite design with a response model is used to optimise the formulation [39]. The first 24 experiments correspond to the experimental areas, and the following 3 points (25, 26, and 27) are the centres of this area. Figure 3 illustrates the typical particles obtained.

Table 2.
Experimental results.
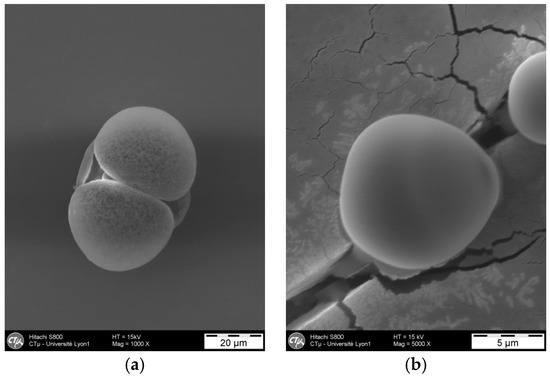
Figure 3.
Representative SEM photography of polyamide microparticles obtained (experiment 6). (a) 1000× and (b) 5000×.
3.1. Full Factorial Design
Evaluation of four experimental parameters (Table 1) was carried out using a full factorial design (FFD). Multiple regression gives a mathematical relationship between responses and independent variables. The FFD provides data to fit the mathematical model described by:
where Y corresponds to the experimental response, Xi are the independent factors, bi are the coefficients of the model obtained by multiple regression. Second-order interactions were neglected. For each response, a confidence interval was calculated according to Equation (8). If this interval included zero, the effect was neglected. The critical value of t was selected for two-side risk (α = 5%) and ν degrees of freedom (e.g., two replicates of the centre points, ν = 2).
Coefficient values are reported in Table 3 (the weight associated to each factor level), calculated as described above, and subjected to statistical analyses using t-test. These results represent the weight of each factor. For responses Y2–Y4, all pure settings have a significant impact on the model (Figure 4). For Y1 response, no coefficients are really significant. The coefficients of various model parameters are within the confidence interval, meaning that model coefficients are null. For Y1 response, it would be interesting to see the curvature of the model in order to check if some parameters have not been forgotten in the model for the response of particle size. This curvature check will be performed on all the responses.

Figure 4.
Coefficients’ weights for all responses.
If there is interaction between the two factors, straight slopes are different and interaction will be much stronger the more different the slopes are. Only two interactions, of all the interactions, appear to be important (Figure 5).
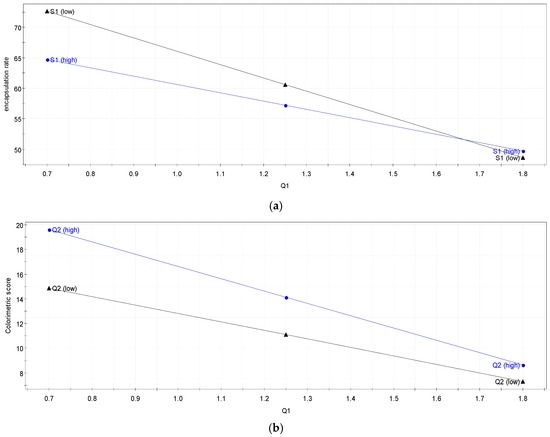
Figure 5.
Interaction graph between (a) and (b) .
The first is the interaction between for the degree of encapsulation. Q1 and S1 seems to be interdependent as they both change the kinetics of the polycondensation which leads to a modification of the structure of the particle shell (modification of the polymer dispersity (. This modification has a direct effect on the degree of encapsulation (leak of the vitamin).
The second is the interaction between for the colourimetric score. As both influence the pH (pKa vitamin C = 4.1 and 11.8) of the solution, they impact the NH2 concentration in the system and so also the ratio . This ratio has a direct impact on the polymer structure and its kinetics formation, which could explain the colourimetric score variation.
3.2. Curvature
Experiments conducted at the centre point were used to determine curvature of each response. If there is no curvature, then the mean response of the three centre points’ experiments is equal to the estimated model response (intercept b0). In our case, for the full factorial design, no degree of freedom existed to estimate the statistics for the model’s coefficients. Consequently, the experimental variance obtained from the centre-point experiments was similar over the whole investigated domain. Comparison of these two values can be tested with a 95% confidence interval according to Equation (9):
When zero is included in the confidence interval, the response was considered as linear. As presented in Table 4, the confidence interval computed for all responses did not include zero and a curvature was observed. This curvature was particularly relevant for particles sizes, encapsulation efficiency and yield, and release of vitamin C (Table 4). To evaluate such a curvature, a second-degree design, such as a central composite design, was selected.

Table 4.
Confidence interval.
3.3. Central Composite Design
The composite design allows the modelling of the quadratic effects of variables (a second-order design). Experiments, called alpha points, are added to the full factorial design (Table 2) to obtain five levels of each parameters (−α, −1, 0, 1, α). Multiple regression gives relationships between responses and independent variables. The central composite design provides sufficient data to fit a second-degree model as shown below:
where Y correspond to the experimental response, Xi are the independent factors, and bi are the coefficients of the model obtained by multiple regression.
All regression models can be statistically evaluated with the coefficient of determination (R2); the adjusted coefficient of determination (R2adj) and the predictive power of the model (Q2).
The responses encapsulation efficiency and colourimetric score are sufficiently explained by the regression model (Table 5 and Figure 6). The particle size model is below expectations. Previous work has shown that particle sizes are mainly correlated with stirring speed and kinetic reaction [34,41,46,47,48]. The low correlation coefficient (R2 = 0.75) obtained could be due to a lack of precision on the stirring speed (rotor stator stirrer without digital display). This hypothesis can be confirmed by residue analysis. Indeed, residue analysis shows, in the case of the first response, two points with high residue (Table 6); suppression of these two points improved the model for the particle size response (also for the other response). However, for this model, some independent parameters need to be added in a future study.

Table 5.
Statistical evolution of each response model.

Figure 6.
Particle size residuals.

Table 6.
Variance analysis of each response model.
Figure 7, Figure 8 and Figure 9 describe different sections of the area studied for different responses. This helps determine the optimum for factors.
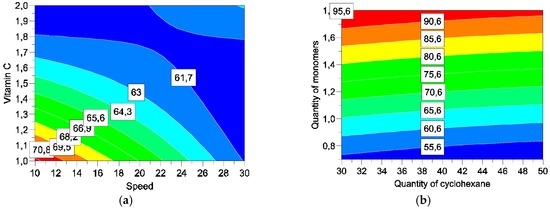
Figure 7.
Response surfaces for encapsulation efficiency by varying speed and vitamin C (a) and quantities of cyclohexane and monomers (b).
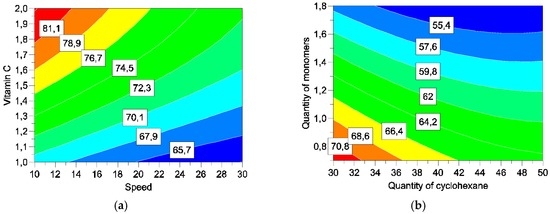
Figure 8.
Response surfaces for encapsulation yield. by varying speed and vitamin C (a) and quantities of cyclohexane and monomers (b).
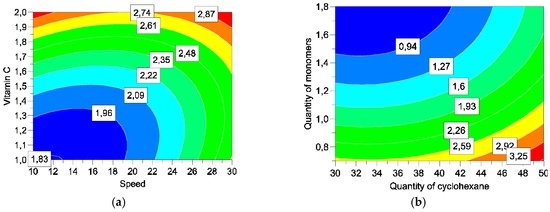
Figure 9.
Response surfaces for release of vitamin C. by varying speed and vitamin C (a) and quantities of cyclohexane and monomers (b).
The study of response surface is very interesting in three responses: encapsulation efficiency, yield, and release of vitamin C. Table 7 summarises the best level to optimize each reply individually.

Table 7.
Level for each factor. (+ for level 1 and – for level −1).
3.4. Optimisation
Once all the experiments were performed, the calculation of the optimal point was given by Modde software with the following constraints:
- Y2 (encapsulation efficiency): objectives 100%, minimum 60%
- Y3 (encapsulation yield): objectives 100%, minimum 65%
- Y4 (release): objectives 0% maximum 15%
The optimal point satisfying the constraints is:
- X1 (Cyclohexane): 30 g
- X2 (monomers): 1.5 g
- X3 (Added Speed): 10 min
- X4 (Vitamin C): 2 g
Giving the calculated results:
- Encapsulation efficiency: 97.99%
- Encapsulation yield: 73.6%
- Size: 65
- Release of vitamin C: 3.15
- Stability: 10.64
An additional experiment was conducted according to these parameters. Encapsulation efficiency and yield were carried out according to the method previously described. The values obtained experimentally (Table 8) are near to those predicted by the model. Further study of the stability (Figure 10) and release of the active ingredient (Figure 11) were performed. Results show colour change as a function of time due to vitamin C degradation following the Maillard reaction. Vitamin C stability is directly connected to the release kinetics. Indeed, when the vitamin C is released from capsule, it is directly exposed to the outside environment, which includes light, oxygen, and heat. Following this study, we can observe that 33% of the vitamin C introduced was released in one month.

Table 8.
Optimal formulation characterisation.
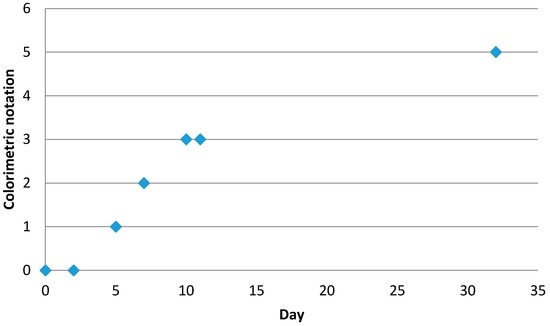
Figure 10.
Evolution of stability as a function of time.
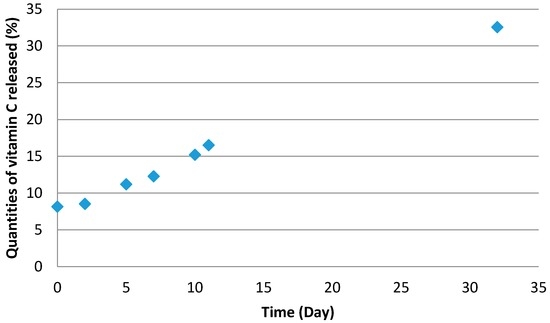
Figure 11.
Release of vitamin C as a function of time.
4. Conclusions
In the case of a study where several parameters can influence the result, the use of DoE allowed identification of parameters which influence each response (encapsulation efficiency and yield, stability, and kinetics). In this work, it has been shown that DoE allows optimisation of a formulation, despite antagonist’s parameters. Finally, vitamin C was encapsulated in polyamide microparticles via interfacial polycondensation, with satisfactory loadings and good encapsulation efficiencies.
Author Contributions
Lionel Ripoll and Yohann Clément conceived and designed the experiments; Lionel Ripoll performed the experiments; Yohann Clément analyzed the DoE data; Both authors wrote the paper.
Conflicts of Interest
The authors declare no conflict of interest.
References
- Chang, S.K.; Ismail, A.; Daud, Z.A.M. Ascorbic Acid: Properties, Determination and Uses. In Encyclopedia of Food and Health; Academic Press: Cambridge, MA, USA, 2016; pp. 275–284. [Google Scholar]
- Daud, Z.A.M.; Ismail, A.; Sarmadi, B. Ascorbic Acid: Physiology and Health Effects. In Encyclopedia of Food and Health; Academic Press: Cambridge, MA, USA, 2016; pp. 266–274. [Google Scholar]
- Shiau, S.Y.; Hsu, T.S. Quantification of vitamin C requirement for juvenile hybrid tilapia, Oreochromis niloticus× Oreochromis aureus, with L-ascorbyl-2-monophosphate-Na and L-ascorbyl-2-monophosphate-Mg. Aquaculture 1999, 175, 317–326. [Google Scholar] [CrossRef]
- Esposito, E.; Cervellati, F.; Menegatti, E.; Nastruzzi, C.; Cortesi, R. Spray dried Eudragit microparticles as encapsulation devices for vitamin C. Int. J. Pharm. 2002, 242, 329–334. [Google Scholar] [CrossRef]
- Nishikimi, M. Oxidation of ascorbic acid with superoxide anion generated by the xanthine-xanthine oxidase system. Biochem. Biophys. Res. Commun. 1975, 63, 463–468. [Google Scholar] [CrossRef]
- Kishimoto, Y.; Saito, N.; Kurita, K.; Shimokado, K.; Maruyama, N.; Ishigami, A. Ascorbic acid enhances the expression of type 1 and type 4 collagen and SVCT2 in cultured human skin fibroblasts. Biochem. Biophys. Res. Commun. 2013, 430, 579–584. [Google Scholar] [CrossRef] [PubMed]
- Smith, W.P. The Effects of Topical L(+) Lactic Acid and Ascorbic Acid on Skin Whitening. Int. J. Cosmet. Sci. 1999, 21, 33–40. [Google Scholar] [CrossRef] [PubMed]
- Boyera, N.; Galey, I.; Bernard, B.A. Effect of vitamin C and its derivatives on collagen synthesis and cross-linking by normal human fibroblasts. Int. J. Cosmet. Sci. 1998, 20, 151–158. [Google Scholar] [CrossRef] [PubMed]
- Masaki, H. Role of antioxidants in the skin: Anti-aging effects. J. Dermatol. Sci. 2010, 58, 85–90. [Google Scholar] [CrossRef] [PubMed]
- Oresajo, C.; Pillai, S.; Manco, M.; Yatskayer, M.; McDaniel, D. Antioxidants and the skin: Understanding formulation and efficacy. Dermatol. Ther. 2012, 25, 252–259. [Google Scholar] [CrossRef] [PubMed]
- Austria, R.; Semenzato, A.; Bettero, A. Stability of vitamin C derivatives in solution and topical formulations. J. Pharm. Biomed. Anal. 1997, 15, 795–801. [Google Scholar] [CrossRef]
- Kurata, T.; Sakurai, Y. Degradation of L-Ascorbic Acid and Mechanism of Nonenzymic Browing Reaction. Part III. Oxidative degradation of L-Ascrbic Acid (degradation of Dehydro-L-ascorbic Acid). Agric. Biol. Chem. 1967, 2, 177–184. [Google Scholar] [CrossRef]
- Garrett, E.R. Prediction of Stability in Pharmaceutical Preparations II: Vitamin Stability in Liquid Multivitamin Preparations. J. Am. Pharm. Assoc. (Sci. Ed.) 1956, 45, 171–178. [Google Scholar] [CrossRef]
- Demiray, E.; Tulek, Y.; Yilmaz, Y. Degradation kinetics of lycopene, β-carotene and ascorbic acid in tomatoes during hot air drying. LWT Food Sci. Technol. 2013, 50, 172–176. [Google Scholar] [CrossRef]
- Tatum, J.H.; Shaw, P.E.; Berry, R.E. Degradation products from ascorbic acid. J. Agric. Food Chem. 1969, 17, 38–40. [Google Scholar] [CrossRef]
- Smuda, M.; Glomb, M.A. Maillard Degradation Pathways of Vitamin C. Angew. Chem. Int. Ed. 2013, 52, 4887–4891. [Google Scholar] [CrossRef] [PubMed]
- Lee, J.-S.; Kim, J.-W.; Han, S.-H.; Chang, I.-S.; Kang, H.-H.; Lee, O.-S.; Oh, S.-G.; Suh, K.-D. The stabilization of L-ascorbic acid in aqueous solution and water-in-oil-in-water double emulsion by controlling pH and electrolyte concentration. Int. J. Cosmet. Sci. 2004, 26, 217–217. [Google Scholar] [CrossRef]
- Ahmad, I.; Ali Sheraz, M.; Ahmed, S.; Shad, Z.; Vaid, F.H.M. Photostabilization of ascorbic acid with citric acid, tartaric acid and boric acid in cream formulations. Int. J. Cosmet. Sci. 2012, 34, 240–245. [Google Scholar] [CrossRef] [PubMed]
- Kirby, C.J.; Whittle, C.J.; Rigby, N.; Coxon, D.T.; Law, B.A. Stabilization of ascorbic acid by microencapsulation in liposomes. Int. J. Food Sci. Technol. 2007, 26, 437–449. [Google Scholar] [CrossRef]
- Desai, K.G.H.; Park, H.J. Encapsulation of vitamin C in tripolyphosphate cross-linked chitosan microspheres by spray drying. J. Microencapsul. 2005, 22, 179–192. [Google Scholar] [CrossRef] [PubMed]
- Green, B.K.; Schleicher, L. Manifold Record Material. U.S. Patent 2730456 A, 10 January 1956. [Google Scholar]
- Benita, S. Microencapsulation: Methods and Industrial Applications; CRC Press: Boca Raton, FL, USA, 2005. [Google Scholar]
- Patravale, V.B.; Mandawgade, S.D. Novel cosmetic delivery systems: An application update. Int. J. Cosmet. Sci. 2008, 30, 19–33. [Google Scholar] [CrossRef] [PubMed]
- Casanova, F.; Santos, L. Encapsulation of cosmetic active ingredients for topical application—A review. J. Microencapsul. 2016, 33, 1–17. [Google Scholar] [CrossRef] [PubMed]
- Ripoll, L.; Bordes, C.; Etheve, S.; Elaissari, A.; Fessi, H. Cosmeto-textile from formulation to characterization: An overview. e-Polymers 2010, 10, 409–442. [Google Scholar]
- Estevinho, B.N.; Rocha, F.; Santos, L.; Alves, A. Microencapsulation with chitosan by spray drying for industry applications—A review. Trends Food Sci. Technol. 2013, 31, 138–155. [Google Scholar] [CrossRef]
- Wilson, N.; Shah, N.P. Microencapsulation of Vitamins. ASEAN Food J. 2007, 14, 1–14. [Google Scholar]
- Junyaprasert, V.B.; Mitrevej, A.; Sinchaipanid, N.; Boonme, P.; Wurster, D.E. Effect of process variables on the microencapsulation of vitamin A palmitate by gelatin-acacia coacervation. Drug Dev. Ind. Pharm. 2001, 27, 561–566. [Google Scholar] [CrossRef] [PubMed]
- Li, M.; Rouaud, O.; Poncelet, D. Microencapsulation by solvent evaporation: State of the art for process engineering approaches. Int. J. Pharm. 2008, 363, 26–39. [Google Scholar] [CrossRef] [PubMed]
- Ji, J.; Childs, R.F.; Mehta, M. Mathematical model for encapsulation by interfacial polymerization. J. Membr. Sci. 2001, 192, 55–70. [Google Scholar] [CrossRef]
- Cho, J.-S.; Kwon, A.; Cho, C.-G. Microencapsulation of octadecane as a phase-change material by interfacial polymerization in an emulsion system. Colloid Polym. Sci. 2002, 280, 260–266. [Google Scholar] [CrossRef]
- Buback, M.; van Herk, A.M. Radical Polymerization; Buback, M., van Herk, A.M., Eds.; Wiley-VCH Verlag GmbH & Co. KGaA: Weinheim, Germany, 2007; Volume 248. [Google Scholar]
- Morgan, P.W. Interfacial Polymerization. In Encyclopedia of Polymer Science and Technology; John Wiley & Sons, Inc.: Hoboken, NJ, USA, 2011. [Google Scholar]
- Janssen, L.J.J.M.; te Nijenhuis, K. Encapsulation by interfacial polycondensation. II. The membrane wall structure and the rate of the wall growth. J. Membr. Sci. 1992, 65, 69–75. [Google Scholar] [CrossRef]
- Pitaksuteepong, T.; Davies, N.M.; Tucker, I.G.; Rades, T. Factors influencing the entrapment of hydrophilic compounds in nanocapsules prepared by interfacial polymerisation of water-in-oil microemulsions. Eur. J. Pharm. Biopharm. 2002, 53, 335–342. [Google Scholar] [CrossRef]
- Chai, G.-Y.; Krantz, W.B. Formation and characterization of polyamide membranes via interfacial polymerization. J. Membr. Sci. 1994, 93, 175–192. [Google Scholar] [CrossRef]
- Hanrahan, G.; Lu, K. Application of Factorial and Response Surface Methodology in Modern Experimental Design and Optimization. Crit. Rev. Anal. Chem. 2006, 36, 141–151. [Google Scholar] [CrossRef]
- Lewis, A.; Mathieu, D.; Phan-Tan-Luu, R. Pharmaceutical Experimental Design; CRC Press: Boca Raton, FL, USA, 1999. [Google Scholar]
- Rudaz, S.; Cherkaoui, S.; Gauvrit, J.Y.; Lantri, P.; Veuthey, J.L. Experimental designs to investigate capillary electrophoresis-electrospray ionization-mass spectrometry enantioseparation with the partial-filling technique. Electrophoresis 2001, 22, 3316–3326. [Google Scholar] [CrossRef]
- Bezerra, M.A.; Santelli, R.E.; Oliveira, E.P.; Villar, L.S.; Escaleira, L.A. Response surface methodology (RSM) as a tool for optimization in analytical chemistry. Talanta 2008, 76, 965–977. [Google Scholar] [CrossRef] [PubMed]
- Persico, P.; Carfagna, C.; Danicher, L.; Frere, Y. Polyamide microcapsules containing jojoba oil prepared by inter-facial polymerization. J. Microencapsul. 2005, 22, 471–486. [Google Scholar] [CrossRef] [PubMed]
- Miladi, K.; Sfar, S.; Fessi, H.; Elaissari, A. Drug carriers in osteoporosis: Preparation, drug encapsulation and applications. Int. J. Pharm. 2013, 445, 181–195. [Google Scholar] [CrossRef] [PubMed]
- Goupy, J. Introduction Aux Plans D’expériences. Available online: http://www.dunod.com/sciences-techniques/sciences-techniques-industrielles/gestion-industrielle/ouvrages-professionnels/introduction-aux-plan (accessed on 24 October 2016).
- Ruxton, G.D.; Beauchamp, G. Some suggestions about appropriate use of the Kruskal-Wallis test. Anim. Behav. 2008, 76, 1083–1087. [Google Scholar] [CrossRef]
- Box, G.E.P.; Hunter, J.S.; Hunter, W.G. Statistics for Experimenters: Design, Innovation, and Discovery; Wiley-Interscience: Hoboken, NJ, USA, 2005. [Google Scholar]
- Cui, J.; Wang, Y.; Postma, A.; Hao, J.; Hosta-Rigau, L.; Caruso, F. Monodisperse polymer capsules: Tailoring size, shell thickness, and hydrophobic cargo loading via emulsion templating. Adv. Funct. Mater. 2010, 20, 1625–1631. [Google Scholar] [CrossRef]
- Sun, Q.; Deng, Y. In situ synthesis of temperature-sensitive hollow microspheres via interfacial polymerization. J. Am. Chem. Soc. 2005, 127, 8274–8275. [Google Scholar] [CrossRef] [PubMed]
- Kobašlija, M.; McQuade, D.T. Polyurea microcapsules from oil-in-oil emulsions via interfacial polymerization. Macromolecules 2006, 39, 6371–6375. [Google Scholar] [CrossRef]
© 2016 by the authors; licensee MDPI, Basel, Switzerland. This article is an open access article distributed under the terms and conditions of the Creative Commons Attribution (CC-BY) license (http://creativecommons.org/licenses/by/4.0/).