1. Introduction
Oleosomes, also known as oil bodies, are natural colloidal particles with diameters ranging from 0.2 to 2.5 μm. Found in many plant seeds, they serve as an energy source during seed germination [
1,
2]. These subcellular organelles consist of a lipid core (94–98 wt% triglycerides) encapsulated by a phospholipid layer (0.5–2 wt%) and embedded with proteins, primarily oleosins (15–26 kDa, 0.5–3.5 wt%), which contribute to their physical and chemical stability [
3,
4]. The proteins and phospholipids layer of oleosomes play a crucial role in membrane stabilization and contribute to their self-emulsifying properties due to their amphiphilic nature. The hydrophobic core of oleosomes can be used to solubilize and transport non-polar bioactive agents, such as oil-soluble vitamins, nutraceuticals, and other bioactive compounds. Additionally, the hydrophilic moieties of the encapsulating protein molecules have been shown to interact with hydrophilic compounds, such as polysaccharides, enhancing the surface properties and improving stabilization [
5,
6]. Consequently, oleosomes are excellent candidates as pre-emulsified carriers in industries such as the cosmetic, pharmaceutical, and food industries [
5,
7,
8,
9,
10].
However, a major challenge lies in efficiently loading bioactive additives into pre-existing oil bodies, while maintaining or enhancing their stability [
5,
6]. The latter and the loading capacity of these natural carriers depend on several factors, including the oleosome particle size, their size distribution, and physicochemical properties [
5,
11]. Therefore, controlling the particle size, through a precise measurement of both size and distribution, is essential for optimizing oleosome-based carriers. Considerable research efforts have been dedicated to establishing reliable, cost-effective, and user-friendly techniques for particle size measurements across a wide range of colloidal systems [
12,
13]. While numerous studies focus on particle size and particle size distribution characterization [
12], oleosome size distribution is predominantly measured using static laser scattering (SLS), such as with a Mastersizer. To a much lesser extent, dynamic light scattering (DLS) is used, due to its actual upper size limit of around 5 μm (or lower, depending on the instrument model) [
3,
11,
13]. However, for submicron particle size analysis, DLS remains one of the fastest, easiest, and most convenient techniques [
14,
15].
Much effort has been dedicated to developing the ability to study concentrated colloidal systems by DLS. However, a key challenge is that DLS theory is valid only for single-scattering cases, while in concentrated colloidal samples, multiple scattering becomes dominant. Multiple scattering refers to the process by which a photon of light is scattered from a diffusing particle in the scattering volume and then is re-scattered by one or more particles before reaching the detector. The re-scattering process alters the timescale of light fluctuations at the detector and generally results in underestimation of the true particle size [
16].
To address this challenge and minimize multiple scattering, several approaches have been explored. One leading approach is to reduce the optical path length through the sample [
17,
18,
19]. Patapoff et al. utilized a 1 mm capillary tube to shorten the path length, and Medebach et al. developed an ultrathin flat cell (with a thickness of 10 μm) that allowed them to measure highly concentrated colloidal systems. Other techniques have focused on the use of fiber optics in the backscattering direction to further mitigate multiple scattering effects [
17,
18,
20,
21].
In addition to particle size distribution, the morphology of oleosomes is often examined using confocal and electron microscopy [
3]. Optical microscopy has a size detection limit of approximately 1 μm and requires a large number of observations for accurate image analysis. As a result, it is generally not preferred for studying oleosome particle size distribution. Nonetheless, a study by Sheikh et al. should be acknowledged, where sesame oleosomes and gel composites were characterized using various techniques, including optical microscopy. While diameter size determination was conducted through image analysis, particle size distribution was not discussed [
22].
The present study seeks to challenge the conventional reliance on static laser diffraction and confocal/electron microscopy which are high-cost methods, with the latter requiring specialized expertise [
23]. Instead, a cost-effective and accessible approach is proposed by combining two complementary techniques: optical microscopy with image analysis and dynamic light scattering to investigate the particle size distribution (PSD) of oleosomes.
To the best of our knowledge, no existing data establishes the use of optical microscopy and image analysis for oleosome PSD determination or its correlation with laser scattering methods. To extend DLS detection limits and mitigate multiple scattering and local thermal effects, a smaller cuvette with a 3 mm path length was employed, which enabled more accurate measurements of micron-sized particles. Particle size standards with both narrow and broad distributions were used to validate instrument performance, assess the sensitivity of DLS and optical microscopy, and compare their results to the commonly used static light scattering technique. Following validation, DLS and optical microscopy were applied to characterize oleosomes from Safflower (Carthamus tinctorius) with the results presented to highlight both the challenges and advantages of each technique.
This paper aims to provide valuable insights to the scientific community, particularly for the cosmetic industry, where oleosomes are used as carriers, to aid in selecting the most suitable analytical instruments for various applications.
3. Results and Discussion
3.1. Validation of Particle Sizing Techniques
Particle sizing was conducted using Dynamic Light Scattering (DLS) and Optical Microscopy (OM). To validate these methods and establish a correlation, commercially available standards were analyzed.
3.1.1. Monodisperse Standard Analysis and Optimization of Measurement Parameters
A monodisperse polystyrene latex standard with a 2 µm diameter was initially tested using both OM and DLS.
Figure 1 exhibits a representative optical microscope image alongside a histogram of the particle size distribution, obtained through MATLAB analysis (as detailed in the Materials and Methods section). To ensure accurate determination, 10 microscope images were analyzed, capturing approximately 1780 particle counts. The particle size determined by OM was 1.99 ± 0.058 µm, which closely matched the reported standard value of 2.0 ± 0.030 µm.
In contrast, the DLS measurements showed a significant deviation from the expected particle size (
Table 1). DLS relies on free Brownian motion within the sample dispersion, requiring the optimization of particle concentrations, which is particularly challenging when dealing with micron-sized particles. In an attempt to minimize multiple scattering and reduce the intensity fluctuations within the measurement volume [
14], various dilution ratios were tested, as shown in
Table 1 (and in
Table S1, supplementary information).
At a low dilution ratio of 1/10, corresponding to a particle concentration of 2 × 10
−3 g/cm
3, the observed diameter was significantly underestimated, which can be attributed to the multi-scattering effects [
27]. Conversely, at higher dilution ratios of 1/500, with a concentration of 4 × 10
−5 g/cm
3, the particle size was overestimated (
Table 1). It is reasonable to assume that the overestimation is a result of increased scattering intensity fluctuations within the instrument measurement volume, which occurs when the sample is too diluted, with too few particles present [
14,
27].
The most accurate results were observed in the range of 1.7–1.8 µm, with some variability in the standard deviation (SD). These results, which still showed a 14% deviation from the reported diameter, were obtained when the stock standard was diluted by a 1/100 ratio, yielding a concentration of 2 × 10⁻⁴ g/cm3.
An additional source of error that might impact the measurement accuracy is due to thermal effects and convective flow within the scattering volume. These may arise from regional increases in temperature, which lead to a decrease in local fluid density in the scattering volume [
28]. Both thermal effects and the multi-scattering phenomenon can alter the correlation function in dynamic light scattering and limit the accessible concentration range. To mitigate these issues, a 50 μL cuvette with a 3 mm path length was tested (replacing the typical 10 mm path length initially used).
The results obtained using the smaller cuvette for the monodispersed sample (diluted 1/100) determined by DLS were in excellent agreement with the expected values, i.e., 1.99 ± 0.069 μm (autocorrelation function can be seen in
Figure S1).
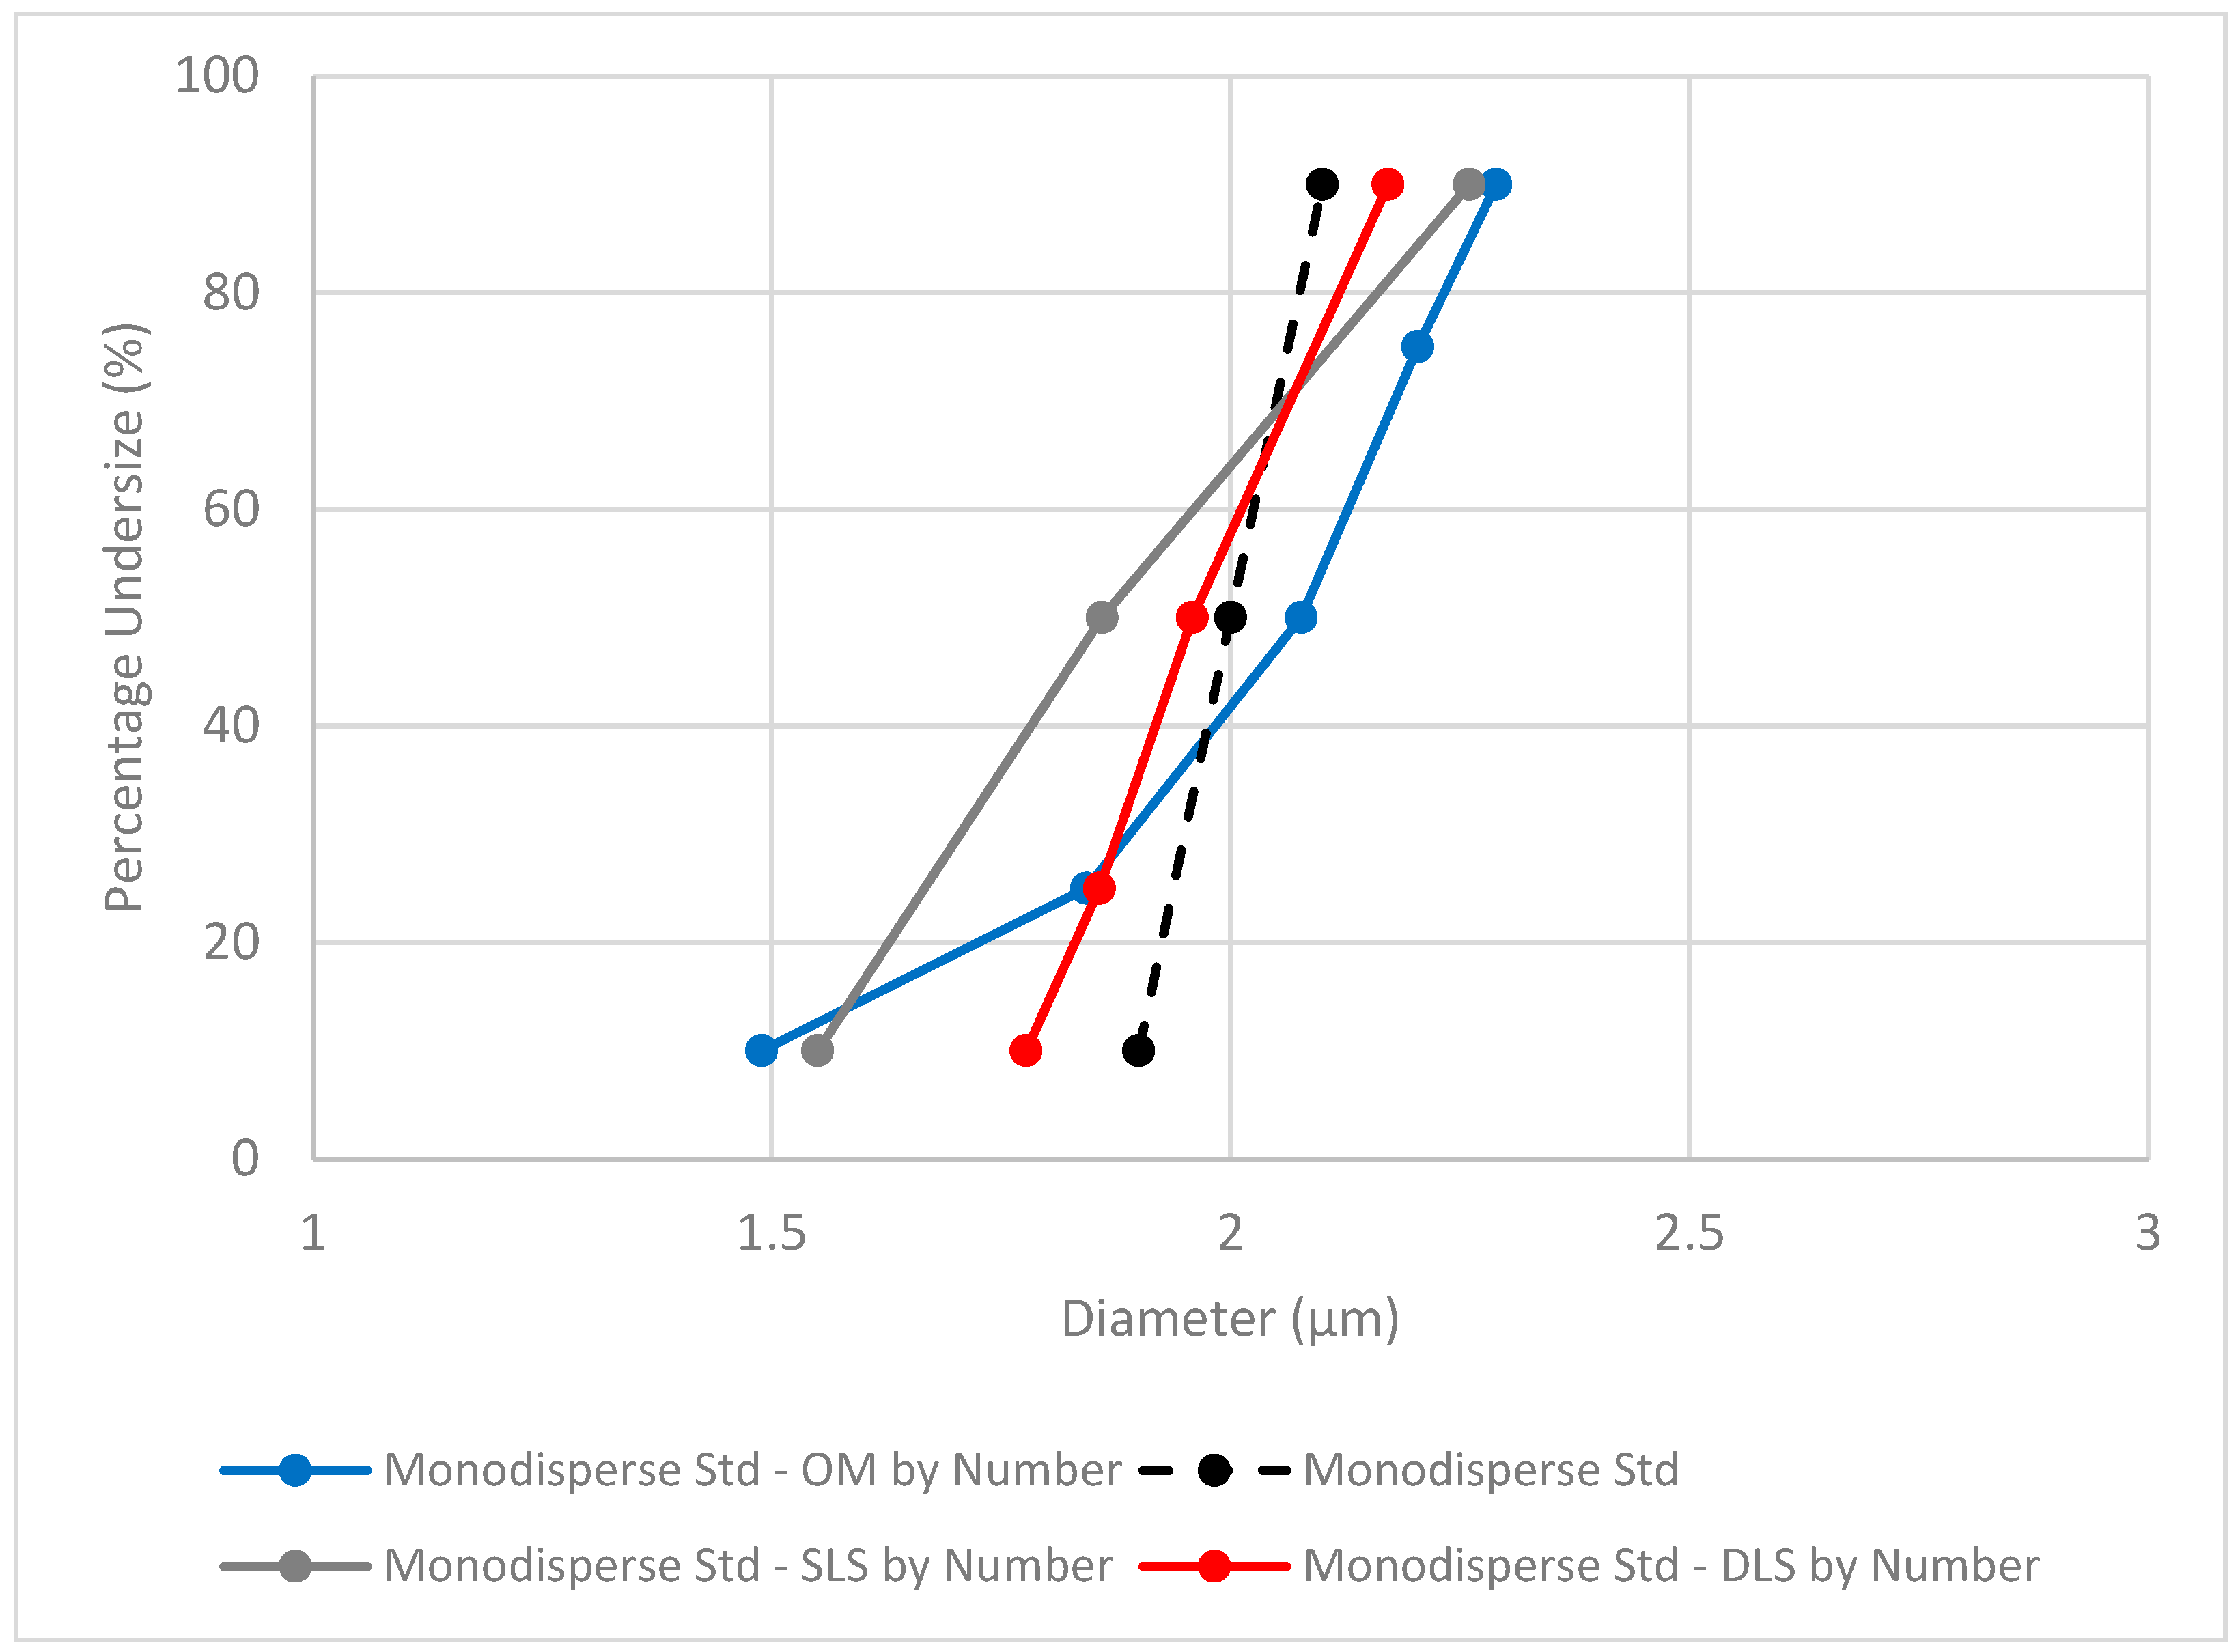
A comparison of methods, including outsourced static light scattering (SLS) results, can be seen in
Figure 2. Both DLS and SLS outcomes can be presented by number or by volume. These two mathematical manipulations accentuate different-sized populations: the number distribution emphasizes the large number of smaller particles, while the volume distribution intensifies the contribution of larger, high-volume particles. SLS results of oleosomes particle size are typically presented by volume, including volume surface mean diameter (D[3,2]) and volume-weighted mean diameter (D[4,3]), all accentuating the contribution of larger particles.
Figure 2 presents the average diameter by number of the monodisperse standard to be aligned and compared with the results obtained from OM analysis. It should be noted that the dashed line does not represent a size distribution in terms of particle percentage; however, it reflects the particle size distribution of the monodisperse standard as reported by the supplier and is included for visual comparison purposes.
The overlap and differences in the standard size distribution can be reflected in the area under the curve for each method. In addition, the average particle diameters of the three methods were collated in
Table 2, and span values were calculated by dividing the difference between the 90th percentile diameter and the 10th percentile diameter by the 50th percentile diameter [
27].
The std size distribution differs between the methods. DLS utilizing the small volume cuvette exhibited the narrowest distribution, with a span value of 0.2, compared to OM and SLS that had nearly twice the width (span values of 0.39 and 0.38, respectively). The average particle size measured by both DLS and OM was found to be accurate and precise. The particle diameter average size detected by SLS (weighted by number) deviated from the standard reported value; however, the more commonly used method, i.e., weighted by volume, was highly accurate (1.98 ± 0.064 μm), in agreement with the other techniques.
It should be noted that while the average diameter size was affected by the calculation method (by number or by volume), the distribution width (span value) remained consistent regardless of the method used.
3.1.2. Evaluation of Micron-Sized Polydisperse Standard
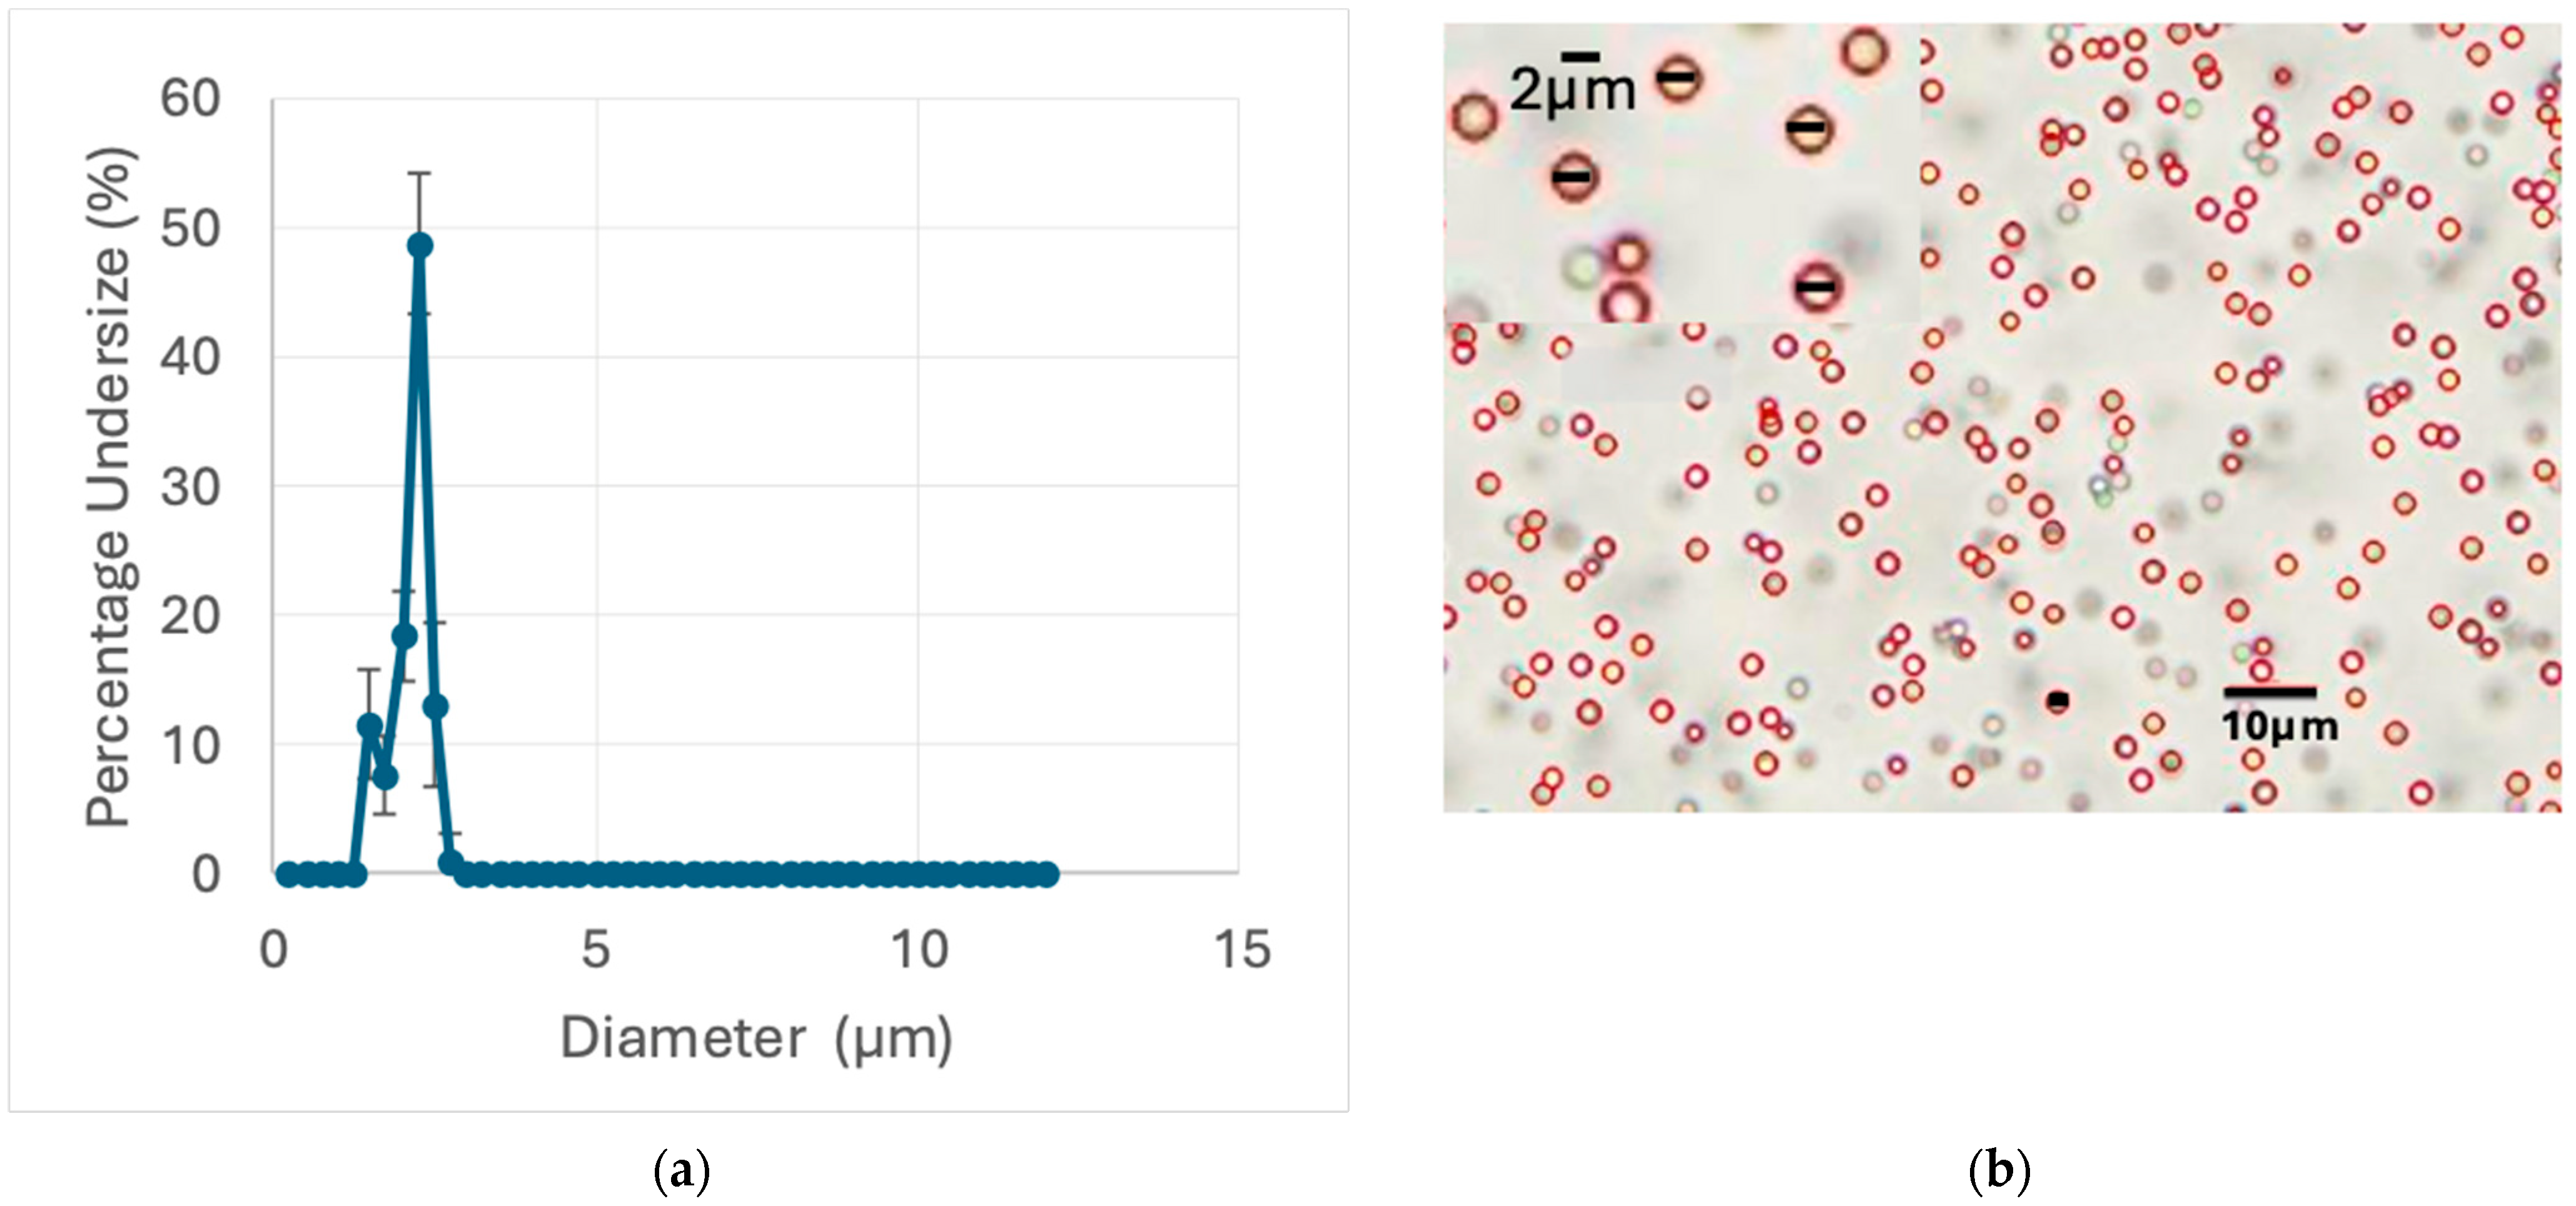
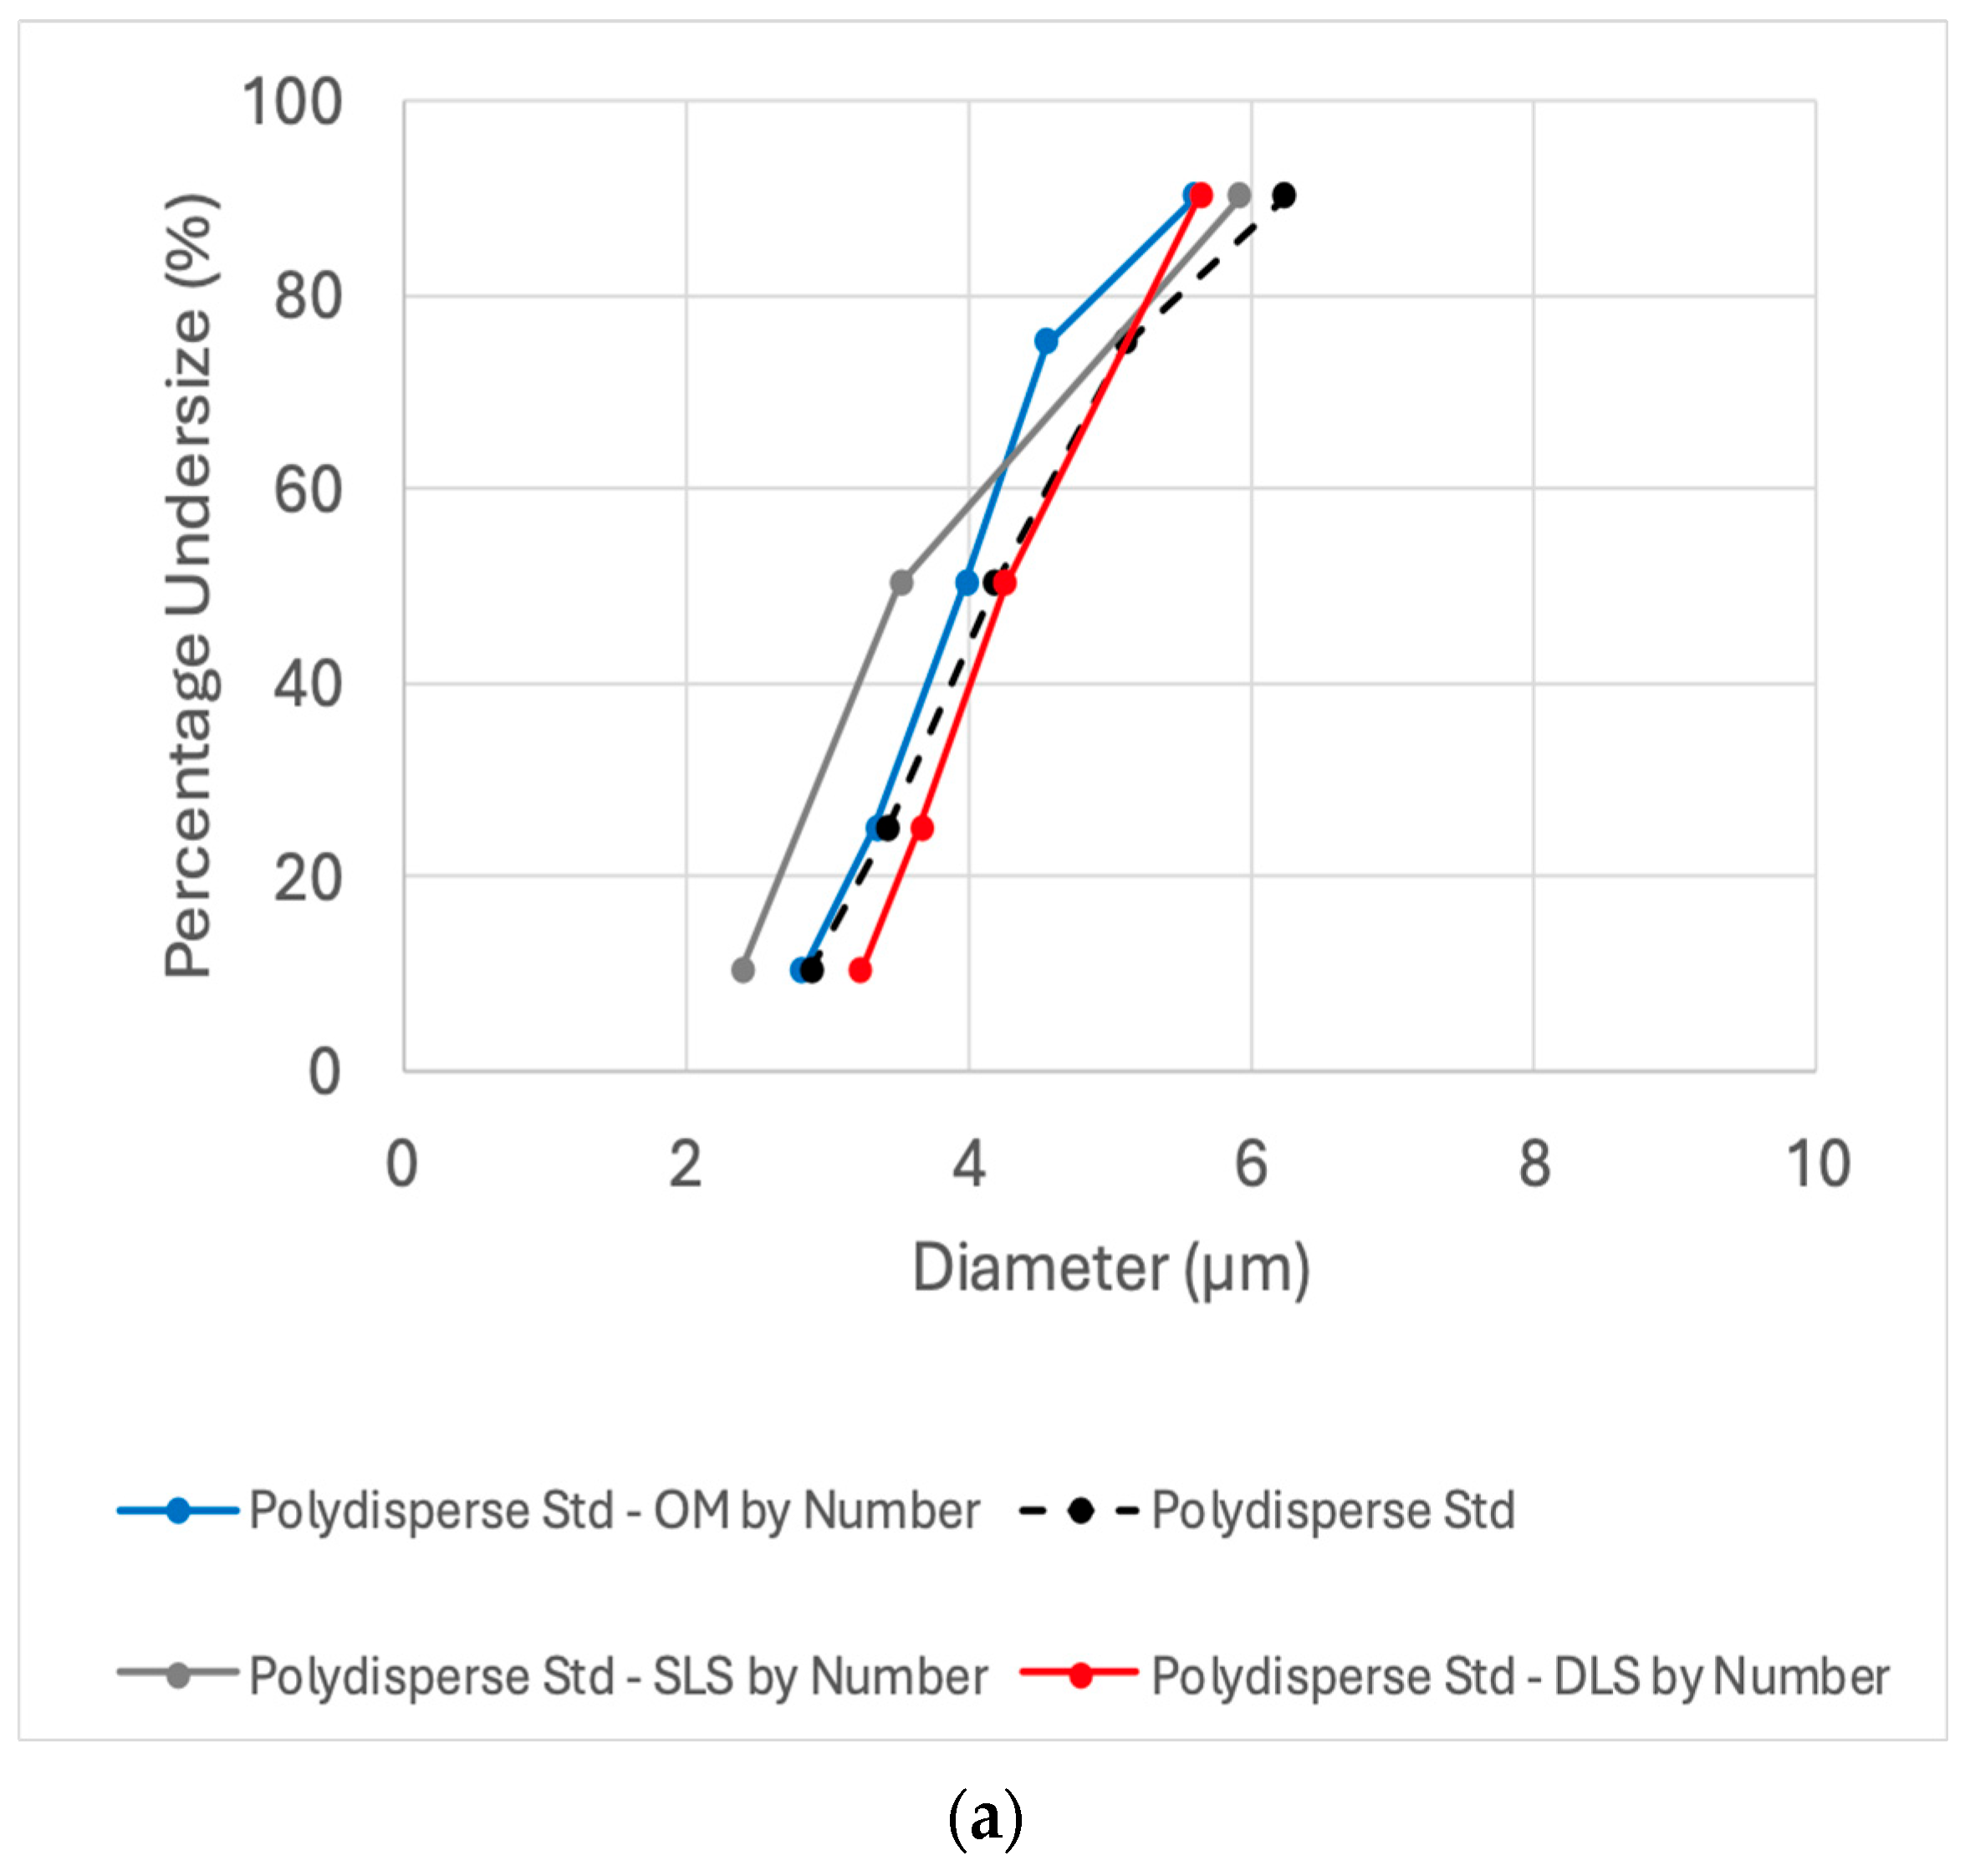
To optimize oleosomes particle sizing capabilities, an additional standard was used. The Accuracy of the three methods was further tested by their ability to detect the size distribution of 1–10 µm polydisperse glass bead standard. This polydisperse standard was chosen due to its resemblance to the reported various particle size distributions of oleosomes [
1].
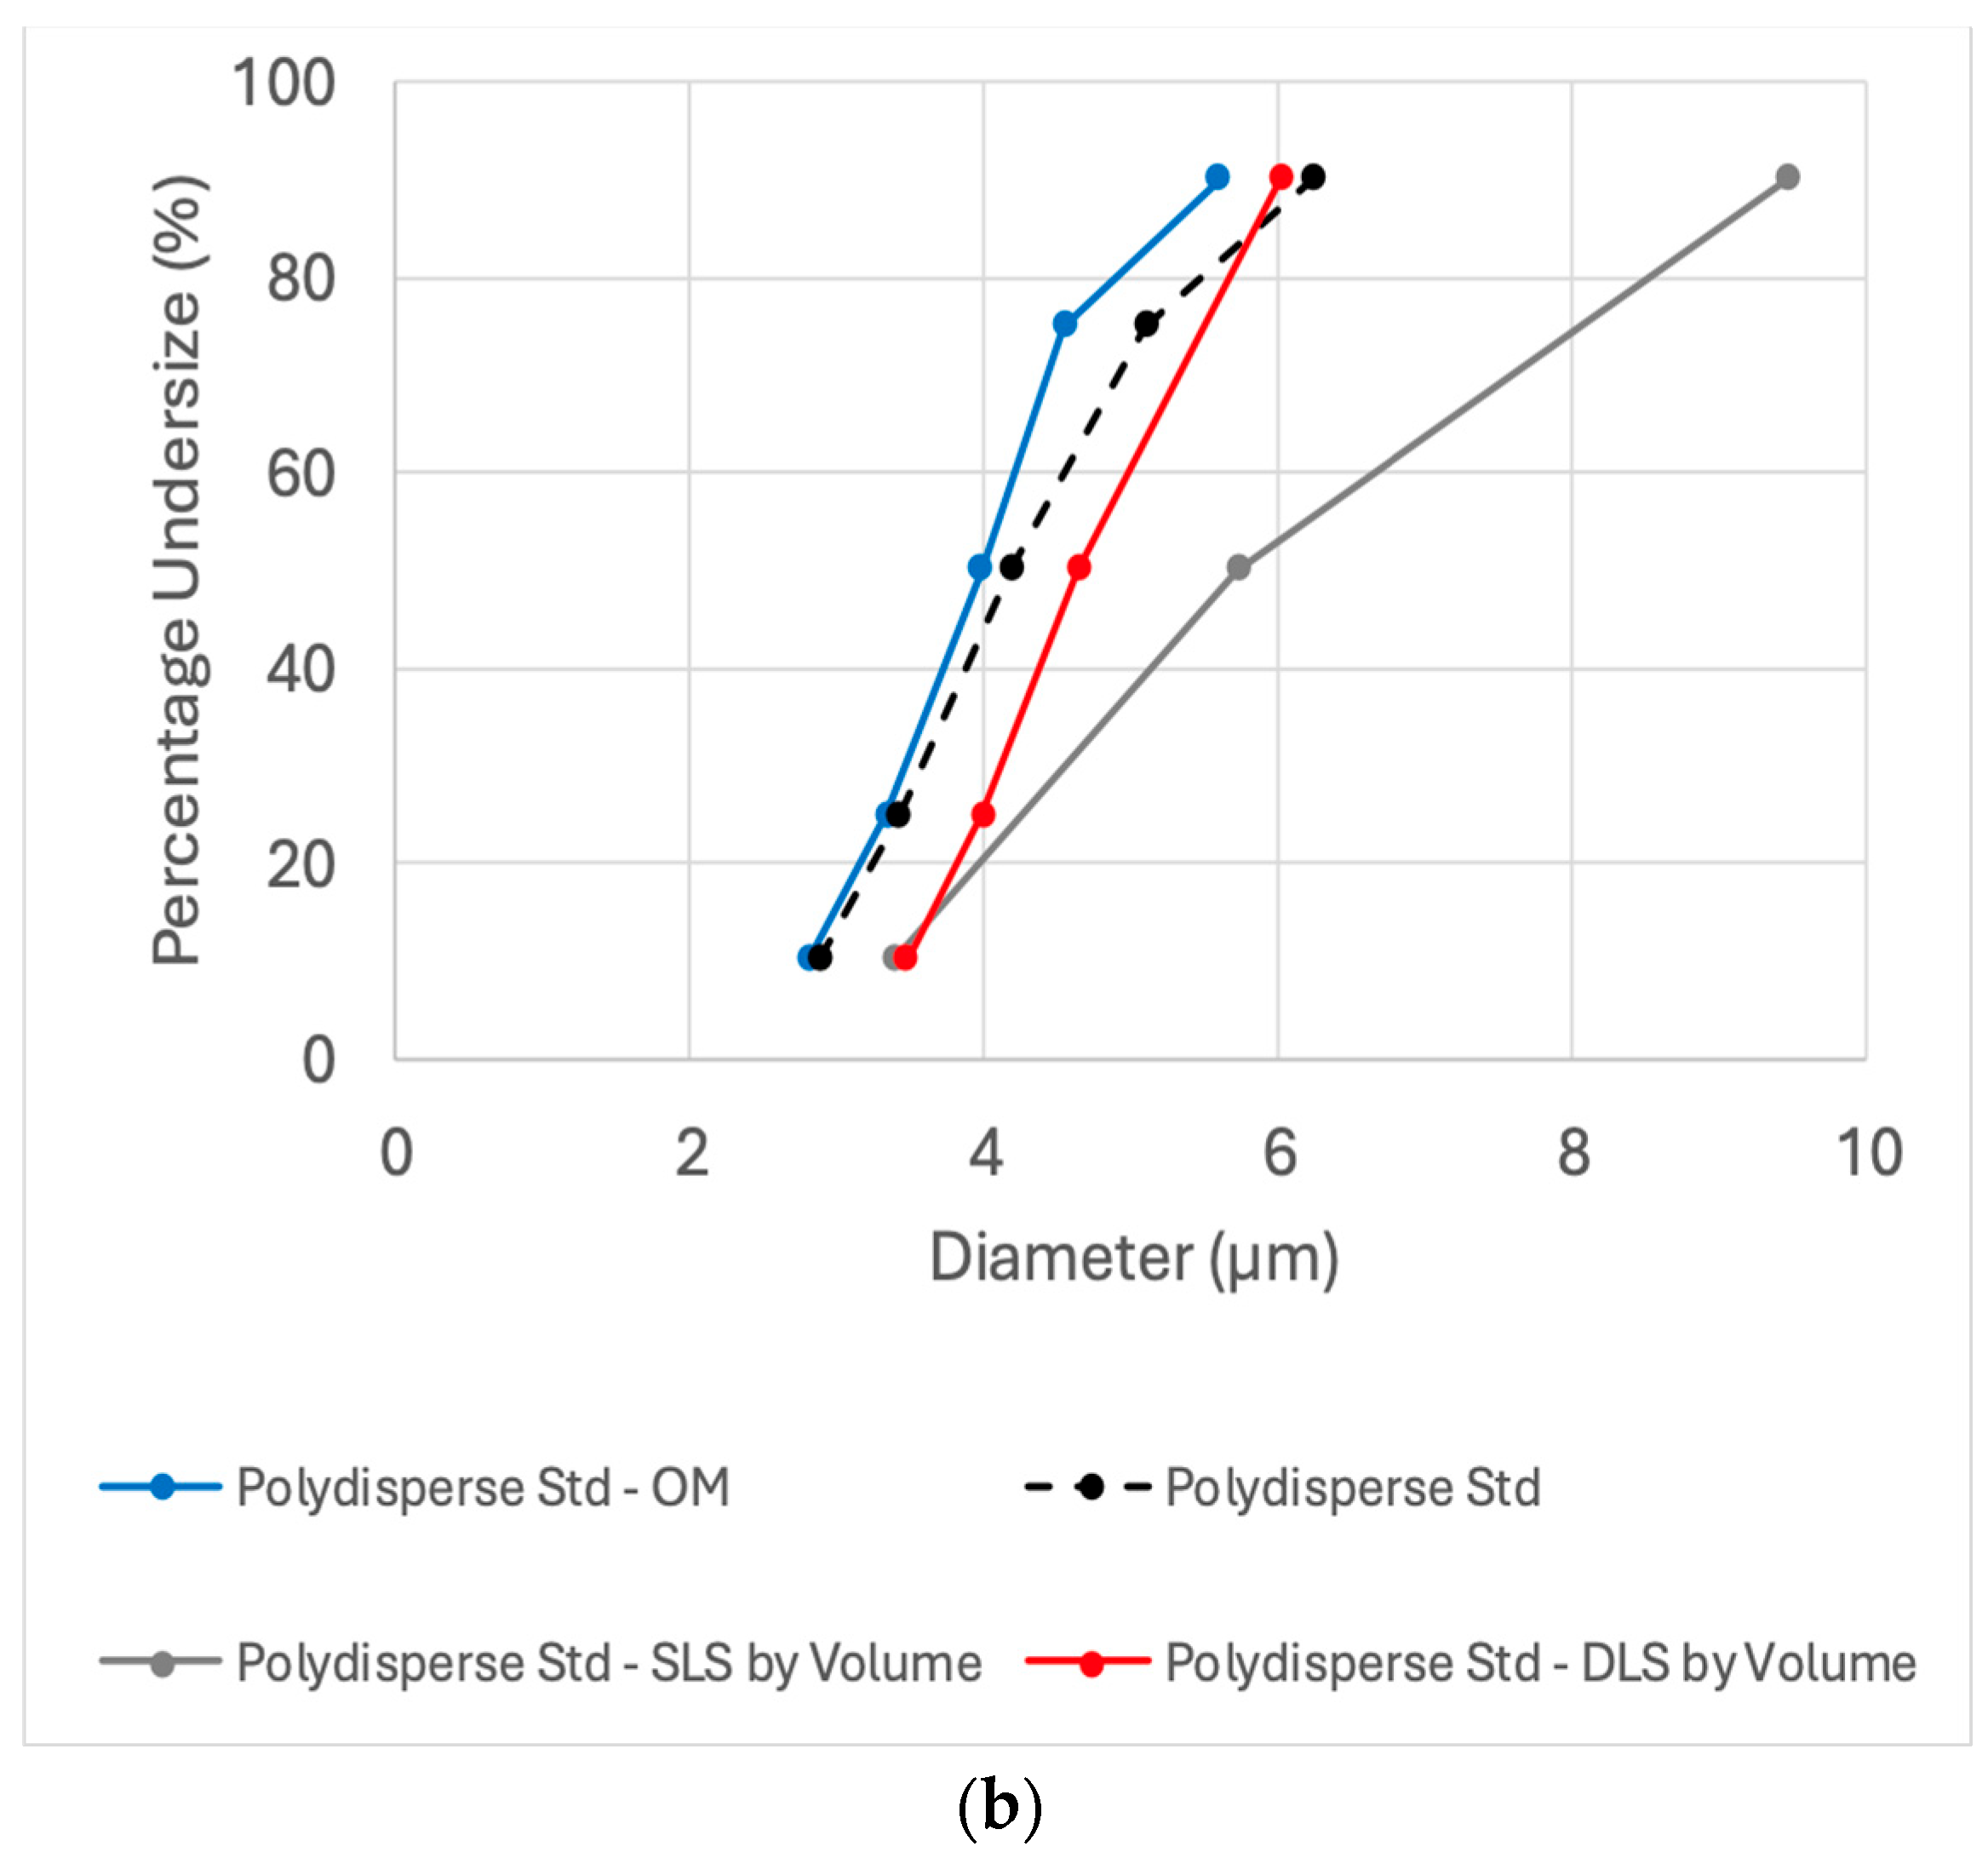
Figure 3 displays the diameter size distribution of the polydisperse standard as reported by the supplier, along with results from DLS, SLS, and OM, followed by image analysis software (635 counts). Light scattering results are presented by number (on the left) and by volume (on the right). Autocorrelation function and a representative optical microscope image of the polydisperse standard can be seen in
Figure S2. The reported cumulative percent of the standard is based on an average of 75 measurements, including sedimentation (Andreasen pipette) and the electrical sensing zone (Coulter counter) methods. The resulting size distribution is reported to be with the size range of 2.88 ± 0.11 to 6.23 ± 0.26 µm at the 10th to 90th percentiles (span 0.8). The number-weighted size distribution measured by DLS (3.23 ± 0.29–5.63 ± 0.31, span 0.6) and OM (2.81 ± 0.30–5.59 ± 0.83 µm, span 0.8) showed good agreement with the certified standard values at the 10th to 90th percentiles. SLS detected a broader distribution (number-weighted, 2.39 ± 0.02–5.91 ± 0.10 µm, span 1.0) but remained consistent with the standard’s under size specifications (
Figure 3).
Micron-sized polydisperse samples, such as the current standard and natural oleosomes, present challenges for DLS due to its size detection limits. However, monitoring particle percentage under size (by number) revealed a deviation of less than 13%, highlighting the advantage of using a small cuvette. In contrast, a standard cuvette resulted in significantly greater deviation (29–43% deviation).
Moreover, the volume-weighted average diameter determined by SLS exhibited a drastic upward shift (by 20–50%) in particle size distribution compared to the standard specification and DLS method, resulting in a particle percentage under size range of 3.39 ± 0.07–9.42 ± 0.25 µm. This overestimation by SLS highlights the impact of larger particles in volume-weighted distributions.
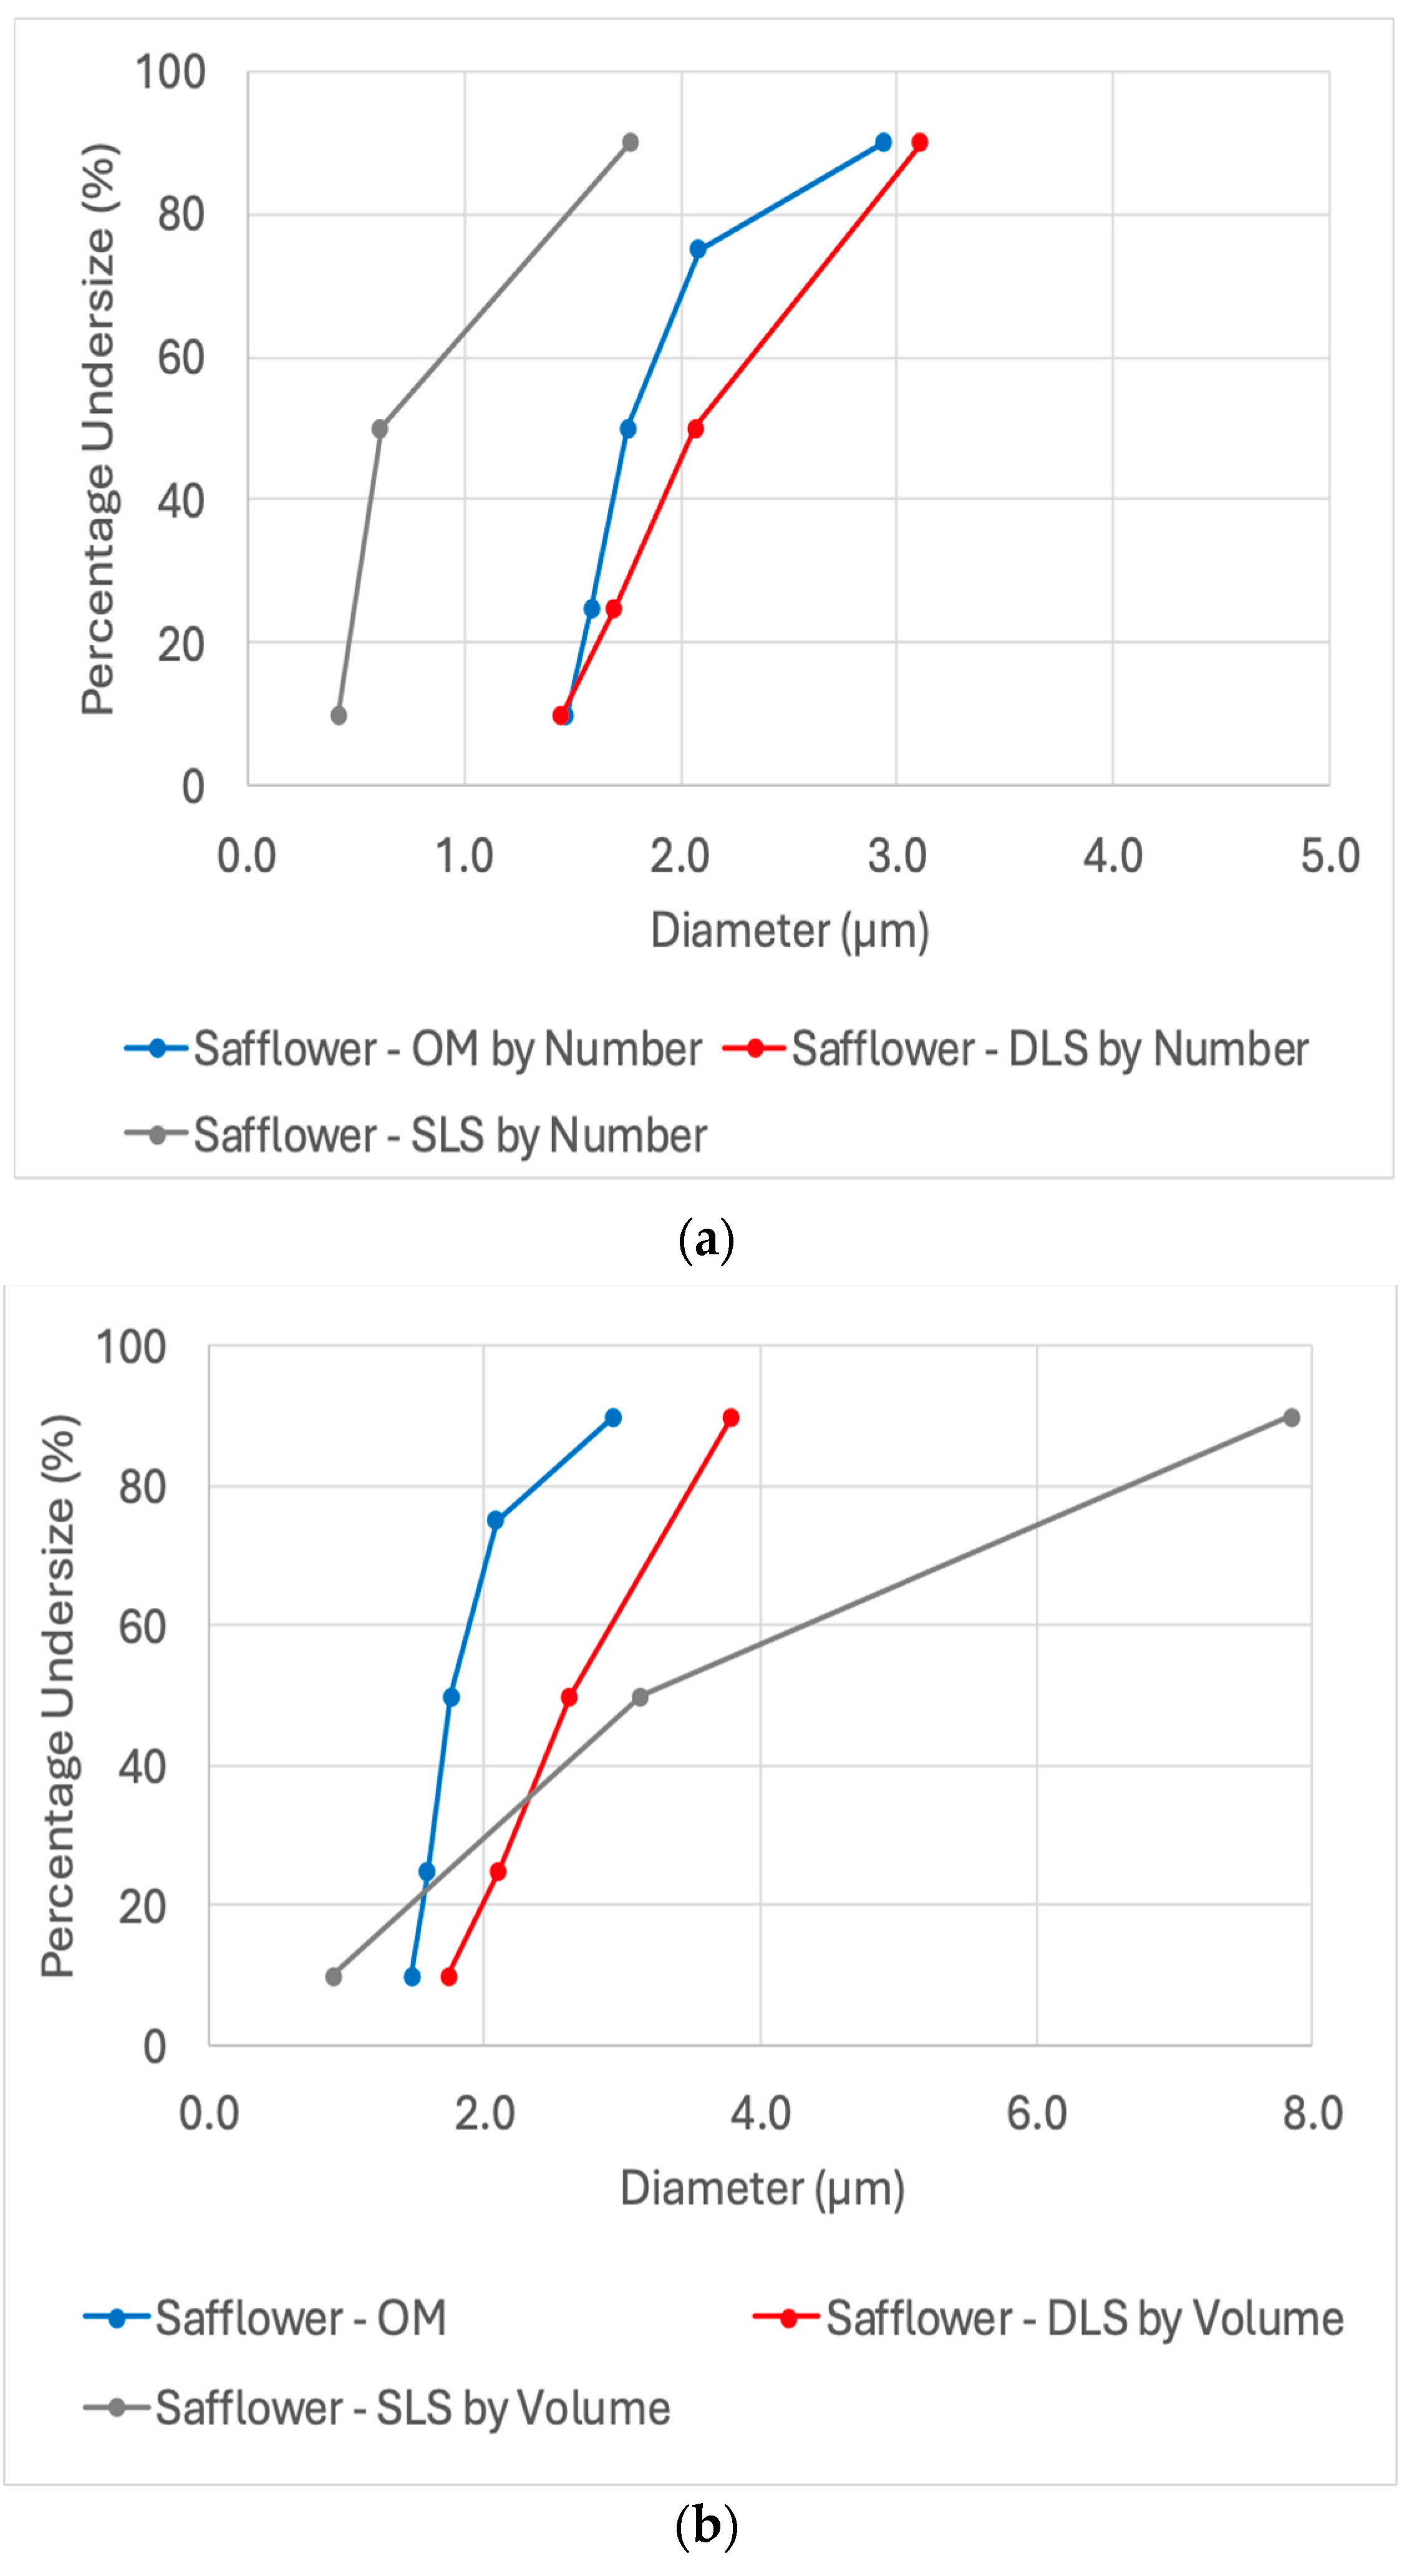
3.2. Particle Size Analysis of Safflower Oleosomes
After verifying the effectiveness of using a small cuvette to extend the use of DLS for micron-sized particles and optimizing OM image analysis for size distribution analysis, a Safflower oleosomes dispersion was tested by these methods (
Figure 4). Autocorrelation function along with a representative optical microscope image of the Safflower oleosomes are presented in
Figure S3.
A similar trend was observed, with DLS and OM (759 particle counts) showing good agreement, both having relatively narrow distributions (span ~0.8). The number-weighted size distribution was 1.45 ± 0.18–3.11 ± 0.25 µm for DLS and 1.47 ± 0.10–2.93 ± 0.48 µm for OM (at the 10th to 90th percentiles). In contrast, SLS measurements exhibited a broader distribution, with a downward shift when analyzed by number (0.42 ± 0.01–1.77 ± 0.02 µm) and a significant upward shift when calculated by volume (0.91 ± 0.01–7.85 ± 0.20 µm, span of 2.2).
3.3. Comparison of Dynamic and Static Light Scattering Techniques for Particle Sizing
DLS and SLS are widely employed, indirect, non-invasive techniques for characterizing colloidal particles. While both methods utilized light scattering to determine particle size and distribution, their outcomes differ to a certain extent due to the fundamental nature of how the two techniques measure particle size and how the data is further calculated.
DLS analyzes fluctuations in scattered light intensity over time at a specific scattering angle to determine the hydrodynamic radius, intensity-weighted size distribution, and polydispersity index using inversion algorithms [
29]. Although number- and volume-weighted size distributions can be derived, their accuracy is contingent on prior knowledge of the particle scattering factor and morphology [
29,
30].
Conversely, SLS technique measures the relation between the scattering angles and scattered light intensity at a single point by various scattering angles (static properties), and it is not directly affected by the mobility of the particles as DLS. This relation can be simplified to calculate the radius of gyration, number- and volume-weighted size distribution. It measures a broader range of particle size and is more sensitive to large particles (when calculated by volume) since their scattering intensity is higher than smaller particles [
29].
Previous studies have demonstrated that SLS and DLS measurements may yield divergent results in size and polydispersity when analyzing lipid vesicle mixtures. It has been suggested to use a combined approach, incorporating both techniques, to provide a more comprehensive characterization of colloidal dispersions [
29,
30]. It was further argued that these discrepancies may arise from polydispersity and deviations from spherical morphology, reflecting differences in the underlying measurement principles [
29,
30].
Both scattering methods have inherent limitations that may introduce inaccuracies in particle size determination and distribution width. While SLS is considered a robust and widely utilized method, it can overestimate particle size and distribution width, particularly in heterogeneous or slightly aggregated samples, due to its enhanced sensitivity to larger particles (mainly by volume-weighted analysis). DLS, known for its rapid and reliable size determination in dispersions, can also be influenced by sample complexity and morphology. However, its size detection limit might render its susceptibility to aggregates exceeding 5 µm, potentially explaining the narrower size distributions observed for both mono- and polydisperse standards, as well as for Safflower oleosomes samples in this study.
Utilizing a small-volume cuvette in DLS measurements, in this study, significantly improved accuracy and precision, yielding size distributions consistent with both monodisperse and polydisperse micron-sized standards. Notably, this cost-effective and accessible technique (including cuvette modification) that mitigated multiple scattering and potential local thermal effects also enhanced distribution width accuracy compared to SLS. Additionally, optical microscopy with MATLAB-based image analysis, incorporating ~630 particle counts across 10 images, provided absolute size distributions that aligned well with both standard types.
Ultimately, the selection of an appropriate analytical technique should be dependent on the specific experimental objective. For studies requiring an emphasis on the most abundant vesicles, number-weighted size distributions (DLS or SLS) should be prioritized, as they emphasize smaller particle populations. To detect micron-scale aggregates, volume-weighted SLS is more suitable due to its increased sensitivity to larger particles; however, the resulting average particle diameter may be overestimated and should be interpreted as a relative size rather than an absolute measurement. For direct visualization and absolute size determination, optical microscopy combined with image analysis can be applied as a reliable method for accurately assessing size distribution.
4. Conclusions
In the field of oleosomes, SLS, typically using volume-weighted or volume/surface values such as D[3,4] or D[2,3], respectively, is the most applied technique. It is reasonable to assume that the limited upper detection range of DLS was the main constraint to its application in this area.
In the current study, the performance of SLS was challenged using both monodisperse and polydisperse standards. The results were compared with those obtained from DLS (using a small-volume cuvette) and OM followed by image analysis. DLS and OM were relatively consistent and accurate. However, SLS exhibited stronger dependence on the weighting method (number vs. volume), which led to overestimation of particle size and a broader distribution compared to the low-cost and highly accessible DLS.
These findings underscore the importance of continually evaluating common methods and selecting appropriate analytical techniques for accurate particle size characterization. The integration of DLS (utilizing a small-volume cuvette) with OM (and image analysis) was shown to be a practical, reliable, and cost-effective approach to oleosomes particle size characterization.


