Article

Study of Formulation, Physical Properties, and Instability Process and In Vitro Evaluation of Transparent Nanoemulsions Containing Sesame Seed Oil (SO) and Raspberry Seed Oil (RO)

by
Pedro Alves Rocha-Filho
1,* and
Monica Maruno
1,2
1
School of Pharmaceutical Sciences Ribeirão Preto, University of São Paulo, Avenida do Café, s/n, Bairro Monte Alegre, Ribeirão Preto 14040-903, SP, Brazil
2
Centro Universitario Barão de Mauá Ribeirão Preto, R. Ramos de Azevedo, 423, Jardim Paulista, Ribeirão Preto 14090-062, SP, Brazil
*
Author to whom correspondence should be addressed.
Cosmetics 2025, 12(2), 32; https://doi.org/10.3390/cosmetics12020032
Submission received: 17 December 2024 / Revised: 12 February 2025 / Accepted: 14 February 2025 / Published: 20 February 2025
(This article belongs to the Section Cosmetic Formulations)

Abstract

:
Nanoemulsions are significant for cosmetic products intended for skin care and for health products due to the reduced size (range 20 to 500 nm) of the globules, which avoids processes of instability. They present transparency, fluidity, wettability, and spreadability; increase skin penetration; and have good sensation. The main instability mechanism of nanoemulsions is called Ostwald ripening, responsible for increasing the average diameter of emulsion globules. Sesame Seed Oil (SO) and Raspberry Seed Oil (RO) are indicated as moisturizing agents recently used in the cosmetic industry and for reducing transepidermal water loss, preventing damage to the skin barrier. They contain specific compounds with common properties such as antioxidant, moisturizing, emollient, and photoprotective actions, making them attractive alternative and complementary treatments to soften the process of skin aging. Below, we present the results of this research on the development of nanoemulsions containing Sesame Seed Oil added with Raspberry Seed Oil by the low-energy method. SO nanoemulsions at HLB = 8.0 were obtained with PEG 15 castor oil (A) and PEG 30 castor oil (F.80) and had globule sizes of 50 nm and 200 nm, respectively, along with pH values considered suitable for skin care products and lower viscosity values allowing for the easy application of nanoemulsions to the skin. Nanoemulsions A and F.80 showed antioxidant activities of 68.71% and 67.75%, respectively. SO nanoemulsions with PEG 15 and PEG 30 castor oil were obtained at 85 °C and 75 °C, respectively, and have the lowest Ostwald ripening index (1.33 × 10²² m3 s−1). The in vitro evaluation conducted using the HET-CAM method for nanoemulsions and PEG 15 and PEG 30 castor oils showed that they were slightly irritating and could be used in cosmetic products.

Graphical Abstract

1. Introduction

Current consumer interest and market trends have stimulated research into new cosmetic forms that explore the benefits associated with incorporating innovative and sustainable raw materials into cosmetic products [1]. Most consumers concerned about the skin aging process undergo chemical peelings or laser rejuvenation or simply adopt the use of new formulations called dermal cosmetics or cosmeceuticals, such as creams and lotions containing vitamins, sun filters, antioxidants, and even healing agents to heal wounds and burns.
Since ancient times, natural vegetable oils have been used worldwide in the development of new forms and new cosmetic products for skin care. High-quality vegetable oils are still affordable options and present specific compounds with common properties such as antimicrobial, antioxidant, and anti-inflammatory activities, as well as moisturizing, emollient, and photoprotective actions, making them attractive alternatives and complementary treatments to slow the process of skin aging. Due to their unique characteristics, vegetable oils have different proportions of essential fatty acids, which are crucial for the recovery of the skin’s hydrolipidic mantle [2].
Recent research has investigated the effects of specific plant oils on skin hydration and barrier function, providing insights for personal care formulators. Among the so-called moisturizing agents commonly used in the cosmetic industry which reduce transepidermal water loss, avoiding damage to the skin barrier, there are vegetable oils, especially Sesame Seed Oil and Raspberry Seed Oil, among others.

1.1. Sesame Seed Oil (SO)

The use of SO in the cosmeceutical and pharmaceutical industries is based on its content in several phytochemical agents that improve the quality and health of the skin.
SO is one of the most popular natural products that have been prescribed for its benefits in the cosmeceutical industries. In fact, according to popular alternative medicine, Sesame Seed Oil is used for many cosmetic purposes, especially for skin care products. In fact, its antibacterial and anti-inflammatory characteristics make it effective enough to reduce pimples and prevent skin rashes. Accordingly, it can also be used as components in the formulation of sunscreens and anti-aging creams [1,3].
The antioxidant properties of SO are due to the presence of lignans, sesamol, sesamin, and sesamolin [4].
According to Ghafoorunissa [5], lignans have potential to be applied as natural antioxidants in edible oils and in the food industry. According to Lee et al. [6], the antioxidant activity of lignan after heating is higher than that of α-tocopherol and maintains antioxidant activity when subjected to high temperatures. Due to its non-sticky feel, it is recommended for skin care products, especially sunscreens.
SO contains a high percentage of fatty acids (85%) and two minor constituents, namely sesamin and sesamolin. It possesses high percentages of dietary protein (rich in methionine), carbohydrate, and vitamin E, as well as trace amounts of minerals which gives a nutraceutical (both nutritional and pharmaceutical) status to the crop. Sesamin has received significant consideration as a natural product that has anticancer potential. Sesamin can be used in healing and in the prevention of numerous types of tumors because of its potential as an operative healing mediator in enhancing tumors [7].

1.2. Raspberry Seed Oil (RO)

RO is widely used in many anti-aging skin care products to help promote youthful skin, and it can also be used as a base for makeup applications. Raspberry Seed Oil is gaining increasing attention in the cosmetics industry. It is used as an ingredient in body and face moisturizers because of its high concentrations of vitamins A and E [8]. Vitamin A is a popular antioxidant and ingredient in anti-aging skin care products because it adds moisture, reduces the appearance of wrinkles, and smooths skin texture [9]. Vitamin E is another highly praised antioxidant in the anti- aging industry. It helps to protect cells from oxidative damage and assists with maintaining collagen structure. These vitamins are essential for the maintenance and repair of skin cells.
RO can be used to create a lipid barrier that minimizes transepidermal water loss (TEWL) and retain moisture, helping to keep skin cells looking young and full. It adds hydration and provides sun protection and nourishing vitamins. The primary factors that contribute to premature aging of the skin include UV from the sun, illness, smoking, and drinking [10].
Unlike other emollients, it does not clog pores, and it is also noncomedogenic and encourages natural water retention in the cells. This helps skin look full, giving a more youthful appearance, and reduces the appearance of fine lines and wrinkles [11].

1.3. Nanoemulsions

Nanoemulsions present to the cosmetic industry new options of formulations which are easier to apply, have better functional benefits, and are potentially safer [12]. They allow for skin penetration and an effective release profile of ingredients, which contributes to superior technological and cosmetic effects [13].
Nanoemulsions are a class of emulsions that are kinetically stable liquid-in-liquid dispersions with droplet sizes on the order of 100 nm [14]. While many strategies are available, nanoemulsions have attracted tremendous attention from scientists globally for research on wound therapy due to their long-term thermodynamic stability and bioavailability [15].
The applications of nanoemulsions are numerous, including topical anti-aging care, makeup, nail care, deodorants, oral care, sunscreens, and hair care. They are also employed in a diverse range of biomedical applications (ocular, intravenous, and other modes of delivery) due to the small droplet sizes that render exceptional properties such as prolonged stability and controlled rheology. Nanoemulsions not only aid in tissue repair but are also considered as an excellent delivery system for various synthetic and natural actives.
They can be prepared by emulsification methods using low energy based on the change in the curvature of the surfactant molecule (phase inversion temperature—PIT). Low-energy methods begin with a W/O macroemulsion, which is then transformed to an O/W nanoemulsion. Following changes during this dilution process, the system passes through an inversion point where the transformation from W/O to O/W emulsion takes place [16].
The main mechanism of the instability of nanoemulsions is called Ostwald ripening, which consists of the expansion of a smaller globule of the emulsion into a larger one as a result of the difference in the chemical potential originated from the variation in the radius of the curvature of the droplets. From the point of view of the process itself, there is a reduction in the free energy of the system due to the destruction of the interfacial area. The end result is an increase in the average diameter of the emulsion globules; over time, the smaller globules have their contents consumed by the larger ones [17,18].
This research proposes the development of nanoemulsions containing Sesame Seed Oil added with Raspberry Seed Oil by the low-energy method and consists of the following steps:
  • An in vitro evaluation of the antioxidant activities of SO and RO;
  • Formulation studies based on a ternary phase diagram;
  • A study of the Ostwald ripening instability process;
  • An in vitro evaluation by the HET CAM method.

2. Material and Methods

2.1. Material (INCI Name) Aqueous Phase: Purified Water Oily Phase (Lipo® Brasil)

Sesame Seed Oil: Sesamum indicum oil (SO). Raspberry Seed Oil: Rubus idaeus seed oil (RO).
The surfactants (S) used are as follows:
Sorbitan monooleate—Span®80 (SSM); (HLB value = 4.3) (Croda Brasil);
Polysorbate 80—Tween® 80 (SP80); (HLB value = 15.0);
PEG castor oil (Oxiteno Brasil):
PEG 15 castor oil—Alkest® CSO 150; (HLB value = 8.3);
PEG 30 castor oil—Alkest® CSO 300; (HLB value = 11.7);
PEG 40 castor oil—Alkest® CSO 400; (HLB value = 13.0);
PEG 54 castor oil—Alkest® CSO 540; (HLB value = 14.4);
PEG 40 hydrogenated castor oil—Alkest® CSO 400; (HLB value = 14.1).
Preservatives
Liquid Germall® Plus-INCI name—Diazolidinyl Urea (and) iodine propynyl butyl carbamate (and) propylene glycol.
BHT-INCI name—Butylated Hydroxy Toluene.

2.2. Methods

2.2.1. In Vitro Evaluation of Antioxidant Action

Measurement of H+ Donor Activity

  • Choosing the best solvent to solubilize the vegetable oils
Four different types of solvents were evaluated to solubilize vegetable oils: isopropyl alcohol (IPA), methyl alcohol (MA), ethyl alcohol (EA), and ethyl acetate (EtAc). The choice of the best solvent to be used was carried out through a macroscopic analysis of the solubilization of SO and RO in different oil concentrations (50 μL/1 mL of solvent; 100 μL/1 mL of solvent; 200 μL/1 mL of solvent; 400 μL/1 mL of solvent; and 1 mL/1 mL of solvent). The solubilization analysis was classified into the following: homogeneous solubilization (SH), non-solubilization (NS), and non-homogeneous solubilization (SNH). Next, mixtures of solvents with the two vegetable oils at different concentrations were tested. The antioxidant effect on the DPPH radical will be calculated according to Equation (1) [19,20,21].
Inhibition   % = [ 1 ( A sample A negative A control ) ] × 100
where:
  • Inhibition (%) = the H+ donor activity of the DPPH radical; Acontrol = the absorbance of the DPPH solution without the sample; Asample = the absorbance of the DPPH solution plus the sample; and A negative = the absorbance of the sample without the DPPH solution.
  • Antioxidant activity of nanoemulsions
The formulations were added to the reaction medium based on the IC50 calculation for vegetable oils and nanoemulsions. The IC50 value refers to the concentration of pure oils that showed 50% inhibition of the DPPH radical. To verify the interference of the components of the formulation, two procedures were performed (sixtuplicate):
(a)
The antioxidant activity of oils in the proportions contained in the formulations was controlled;
(b)
The antioxidant activity of the components of the formulations, in the corresponding proportions, without SO and RO and in the formulations containing BHT was determined.

Superoxide Radical Scavenging Activity Generated in Xanthine (X)/Luminol (L)/Xanthine Oxidase (XOD) System by Chemiluminescence

The chemiluminescent mixture was prepared before analysis by mixing 400 μL glycine buffer (0.1 M, pH 9.4, and 1 mM EDTA), 150 μL xanthine (6 mM in glycine buffer), and 10 μL luminol (0.6 mM). We added 100 μL of the xanthine oxidase solution to start the reaction. Chemiluminescence was measured in 5 min at 25 °C with the Autolumar LB 953 equipment [22]. The formation of the superoxide anion was carried out through enzymatic reactions using the following reaction:
Xanthine + O2 → Uric Acid + Superoxide Radical XOD
(1)
Test 1: preliminary test.
  • Negative—all materials except for the sample (X + XO + L + Glycine Buffer); vegetable oils (SO and RO)/glycine buffer (1:10); Solvent: EA: IPA (1:1)
(2)
Test 2: solvent interference: pure SO; pure RO; RO pure + negative.
(3)
Test 3: turbidity interference: No L; RO; S/SO.

3. Formulation Studies

3.1. The Determination of the HLB Value for Sesame Seed Oil

To determine the required HLB of SO, emulsions were prepared initially with a 67.0% (w/w) aqueous phase, a 30.0% (w/w) oil phase, and a 3.0% (w/w) emulsifier blend of Tween® 80 and Span® 80 at HLB values ranging from 5.0 to 15.0 (Table 1) to determine the required HLB for SO and RO [23]. The emulsions were prepared as follows [23]: the aqueous phase and the oil phase containing the blend of surfactants were heated separately to 70 ± 3 °C. The aqueous phase was added to the oil phase while stirring with a propeller mixer at 25,000 rpm/min for 5 min, and the container was placed in a water bath (13 ± 1 °C).

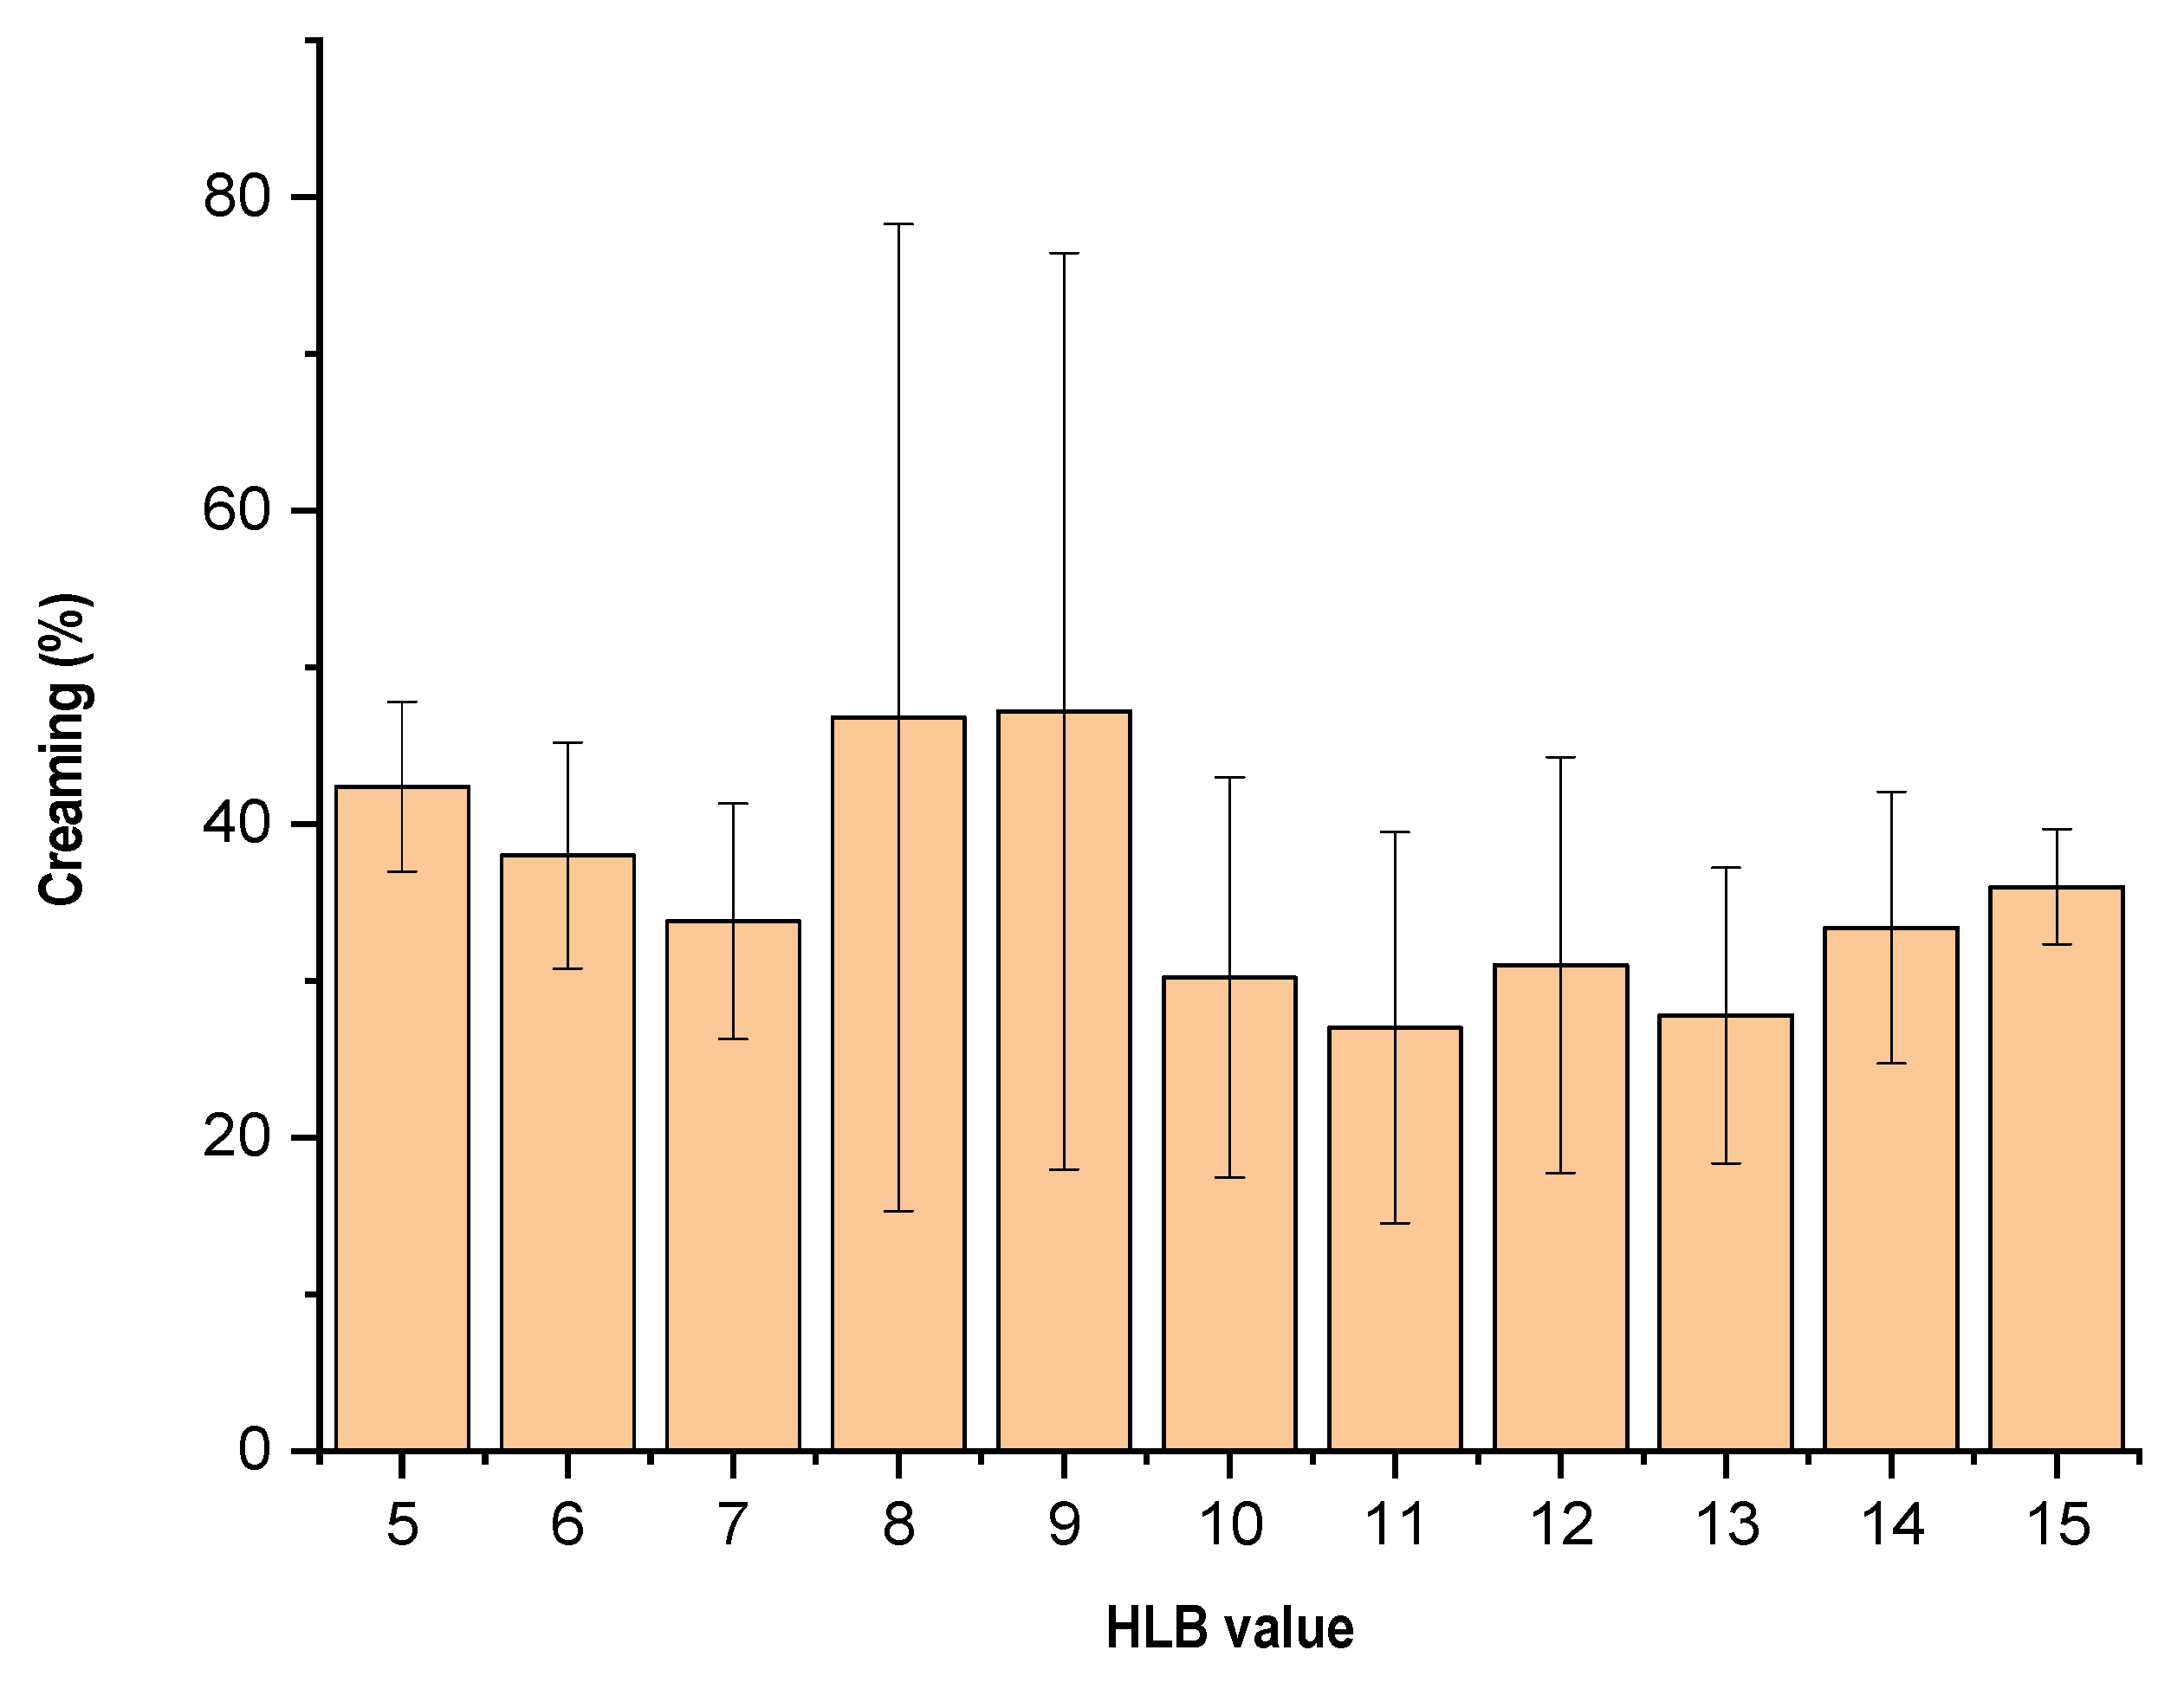
3.2. Evaluation for Creaming Emulsions

The creaming profiles of the emulsions were evaluated visually at ambient temperature (25 ± 2 °C). To measure the creaming profiles, 10 mL of each emulsion sample was poured into a 10 mL graduated cylinder immediately after preparation. The emulsions were observed for creaming at 24 h intervals for four days. It was measured the percent volume of the dispersed phase creamed at the upper portion of the graduated cylinder [23].

3.3. Formulation of Emulsions and Hydrophile Lipophile Balance (HLB) Study

The aqueous phase and oily phase (containing surfactant) were heated to a temperature of 75 ± 2 °C, and then the aqueous phase was poured over the oily phase under constant and continuous stirring at 600 rpm (RW 20 digital—IKA®) until cooled to 25 ± 2 °C [24]. The compositions studied are shown in Table 2.
The amounts of polysorbate 80 (A) and sorbitan monooleate (B) were calculated using Equation (2) below:
A + B = 100
HLBA × 0.01A + HLBB × 0.01B = HLBR
where A = the percentage of hydrophilic surfactant; B = the percentage of lipophilic surfactant; HLBA = the hydrophilic lipophilic balance of A; HLBB = the hydrophilic lipophilic balance of B; HLBR = the resulting or required hydrophilic lipophilic equilibrium for the oil phase.

3.4. Phase Inversion Temperature (PIT) Method

The aqueous phase and the oil phase containing the surfactants were heated to the same temperature, and the aqueous phase was poured over the oil phase while stirring at 600 ± 10 rpm (RW 20 digital—IKA®). Then, the emulsion under agitation was rapidly cooled in an ice bath until the temperature reached 25 ± 2 °C [25,26] at the phase inversion temperature.
The chosen surfactants were castor oil derivatives with different degrees of ethoxylation, namely PEG 15, PEG30, PEG 40, PEG 54, and a PEG 40 hydrogenated castor oil. A macroscopic analysis was performed after 24 h of preparation.

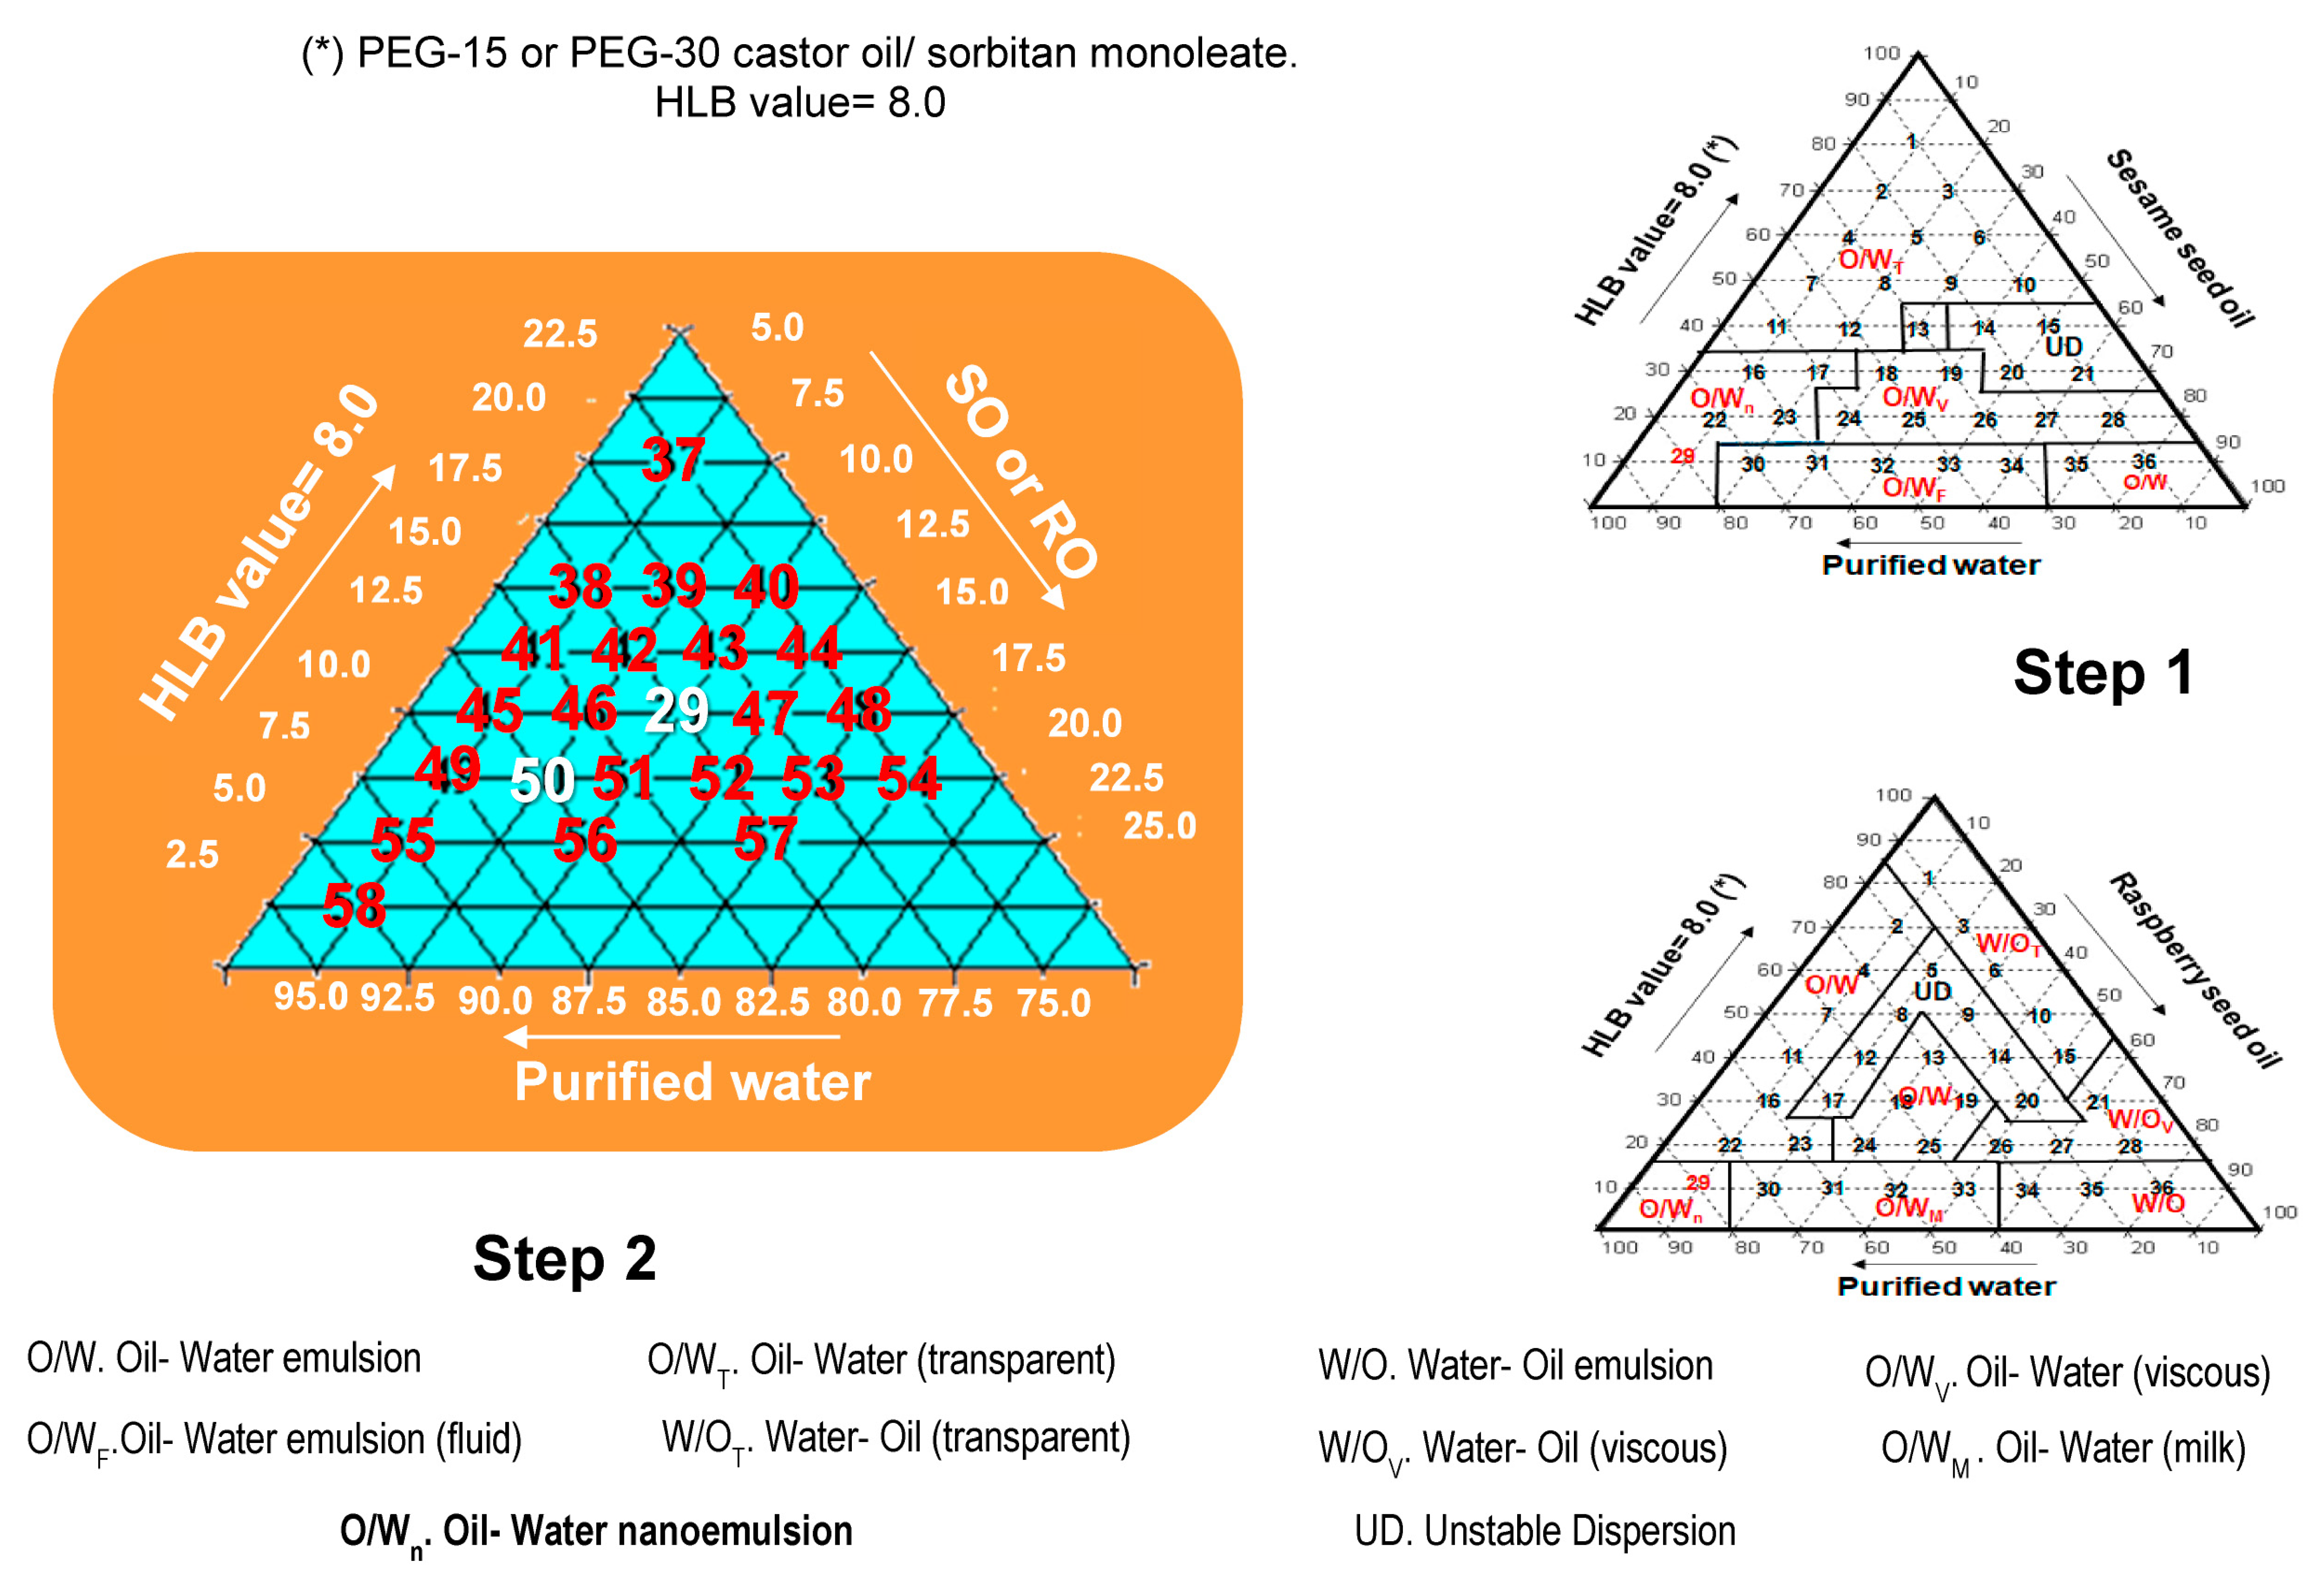
3.5. Phase Diagram for SO and RO at Required HLB Value

After determining the HLB value required for SO and RO, the phase diagram was studied using the surfactants PEG 15 EO castor oil and PEG 30 castor oil. The phase diagram was studied based on two steps: (1) the quantity of components at a variation of 10.0% (w/w); (2) the quantity of components at a variation of 5.0% (w/w).

3.6. Stability Tests

3.6.1. Centrifugation Test

We used the Fanem centrifuge (Centrilab, model CE801-São Paulo, Brazil) for the emulsion samples (triplicate), which were subjected to 3000 rpm for thirty minutes at 25 ± 2 °C [27,28,29].

3.6.2. Thermal Stress

Emulsions placed in test tubes were subjected to thermal stress [30]. The samples (triplicate) were submitted to heating in a thermal bath (Nova Técnica Ltd.—Model 281 NT-São Paulo, Brazil) at a temperature range of 40 ± 2 °C to 75 ± 2 °C, with a temperature increase interval of 5 to 5 °C. The samples were kept at each temperature for 30 min, and after each period, the presence of phase separation was evaluated.

3.6.3. Size and Zeta Potential of Nanoemulsions

The granulometry (size of the globules) was verified in the Zeta sizer nano series model nano zs90 (Malvern Instruments Ltd., Malvern, UK).

3.6.4. The Determination of the pH Value [31]

The evaluation of pH was carried out in dilutions of the sample (triplicate) at 25 ± 2 °C. We used the peagometer Analion-Mod. PM608, Analion, Ribeirão Preto, SP, Brazil.

3.6.5. Analysis of Viscosity

The measurement of viscosity (triplicate) was carried out using a Brookfield DV-I+ viscometer for small volumes, and the SDC-34 shear sensor (Spindle nr. 34) at 25 ± 2 °C and 8.0 g of sample were used for each reading. The analysis times were 60, 90, and 120 days after the preparation of the formulations.

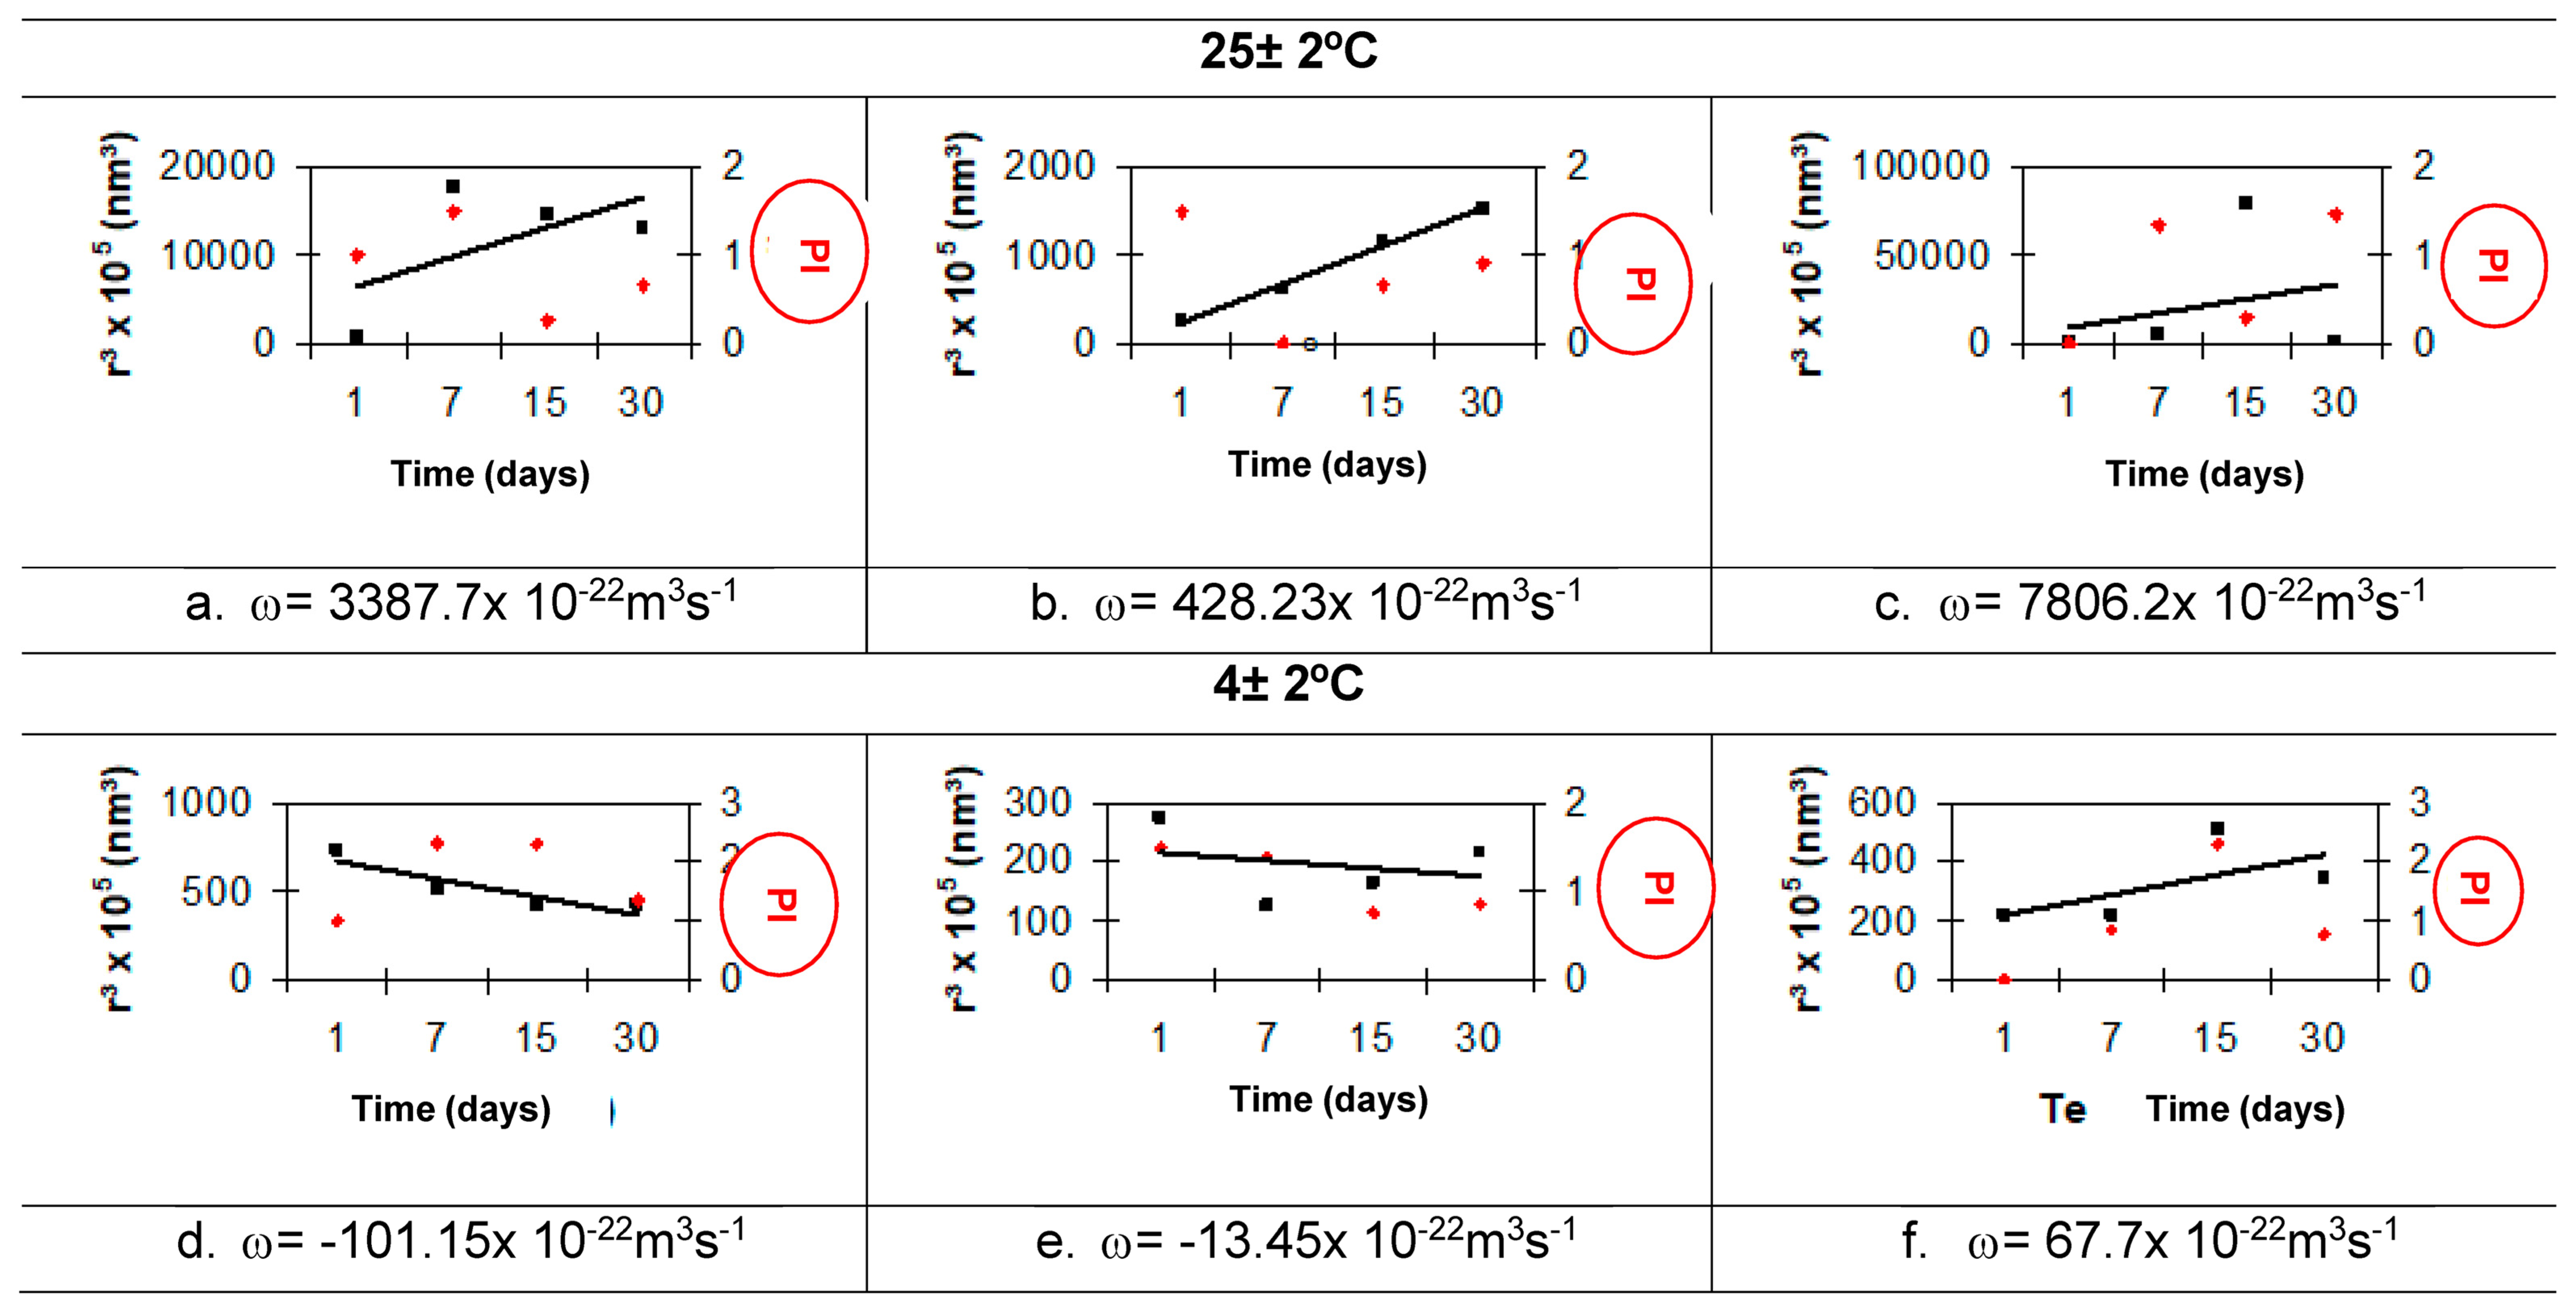
3.6.6. Ostwald Ripening Index

The Ostwald ripening index (ω) can be obtained by the Lifshitz–Slesov–Wagner (LSW) theory using Equation (3). This equation show a linear relationship between the radius cubed and time [32,33]:
ω = dr3/dt
where ω = the Ostwald ripening index; r3 = the radius cubed; t = time.

3.6.7. Polydispersity Index (Equation (4)) (SPAN) [34]

IP = dw/dn
where dw = the mean weight or mean volume of globules; dn = the mean number of globules.

4. In Vitro Evaluation

4.1. Irritation Test in Organotypic Model Using Hen’s Egg Test–Chorioallantoic Membrane (HET–CAM)

The method used corresponds to a modification of the method described by Luepke [35], accepted by the French legislation and indicated by Anvisa [31], for the study and evaluation of the safety of different types of cosmetic and pharmaceutical products [36,37,38].

4.2. Chorioallantoic Membrane Preparation

The eggs (10 days) were carefully placed in an upright position on an egg rack, with the widest and flattest part facing upwards. With the aid of flat scissors, a small hole was made in the center of the upper part of the shell, which was cut circularly with curved scissors, and later, a whitish-looking membrane was removed to expose the chorioallantoic membrane. This membrane is characterized by its transparency and the presence of blood vessels. Next, the membranes were analyzed in order to find damage, which could cause the rejection of the egg in the experiment. The 0.3 mL or 0.3 g samples were applied directly to the chorioallantoic membrane with the aid of a micropipette. The products remained in contact with the membrane for 20 s. After the contact period, the membrane was washed to remove the product and the chorioallantoic membrane was evaluated.
As positive controls, the eggs were treated with SDS (1.0%) and 0.1 N of NaOH as a model of highly irritating products and in which the three parameters to be considered are always observed (hyperemia, hemorrhage, and coagulation).

5. Results

5.1. Assessment of Antioxidant Capacity
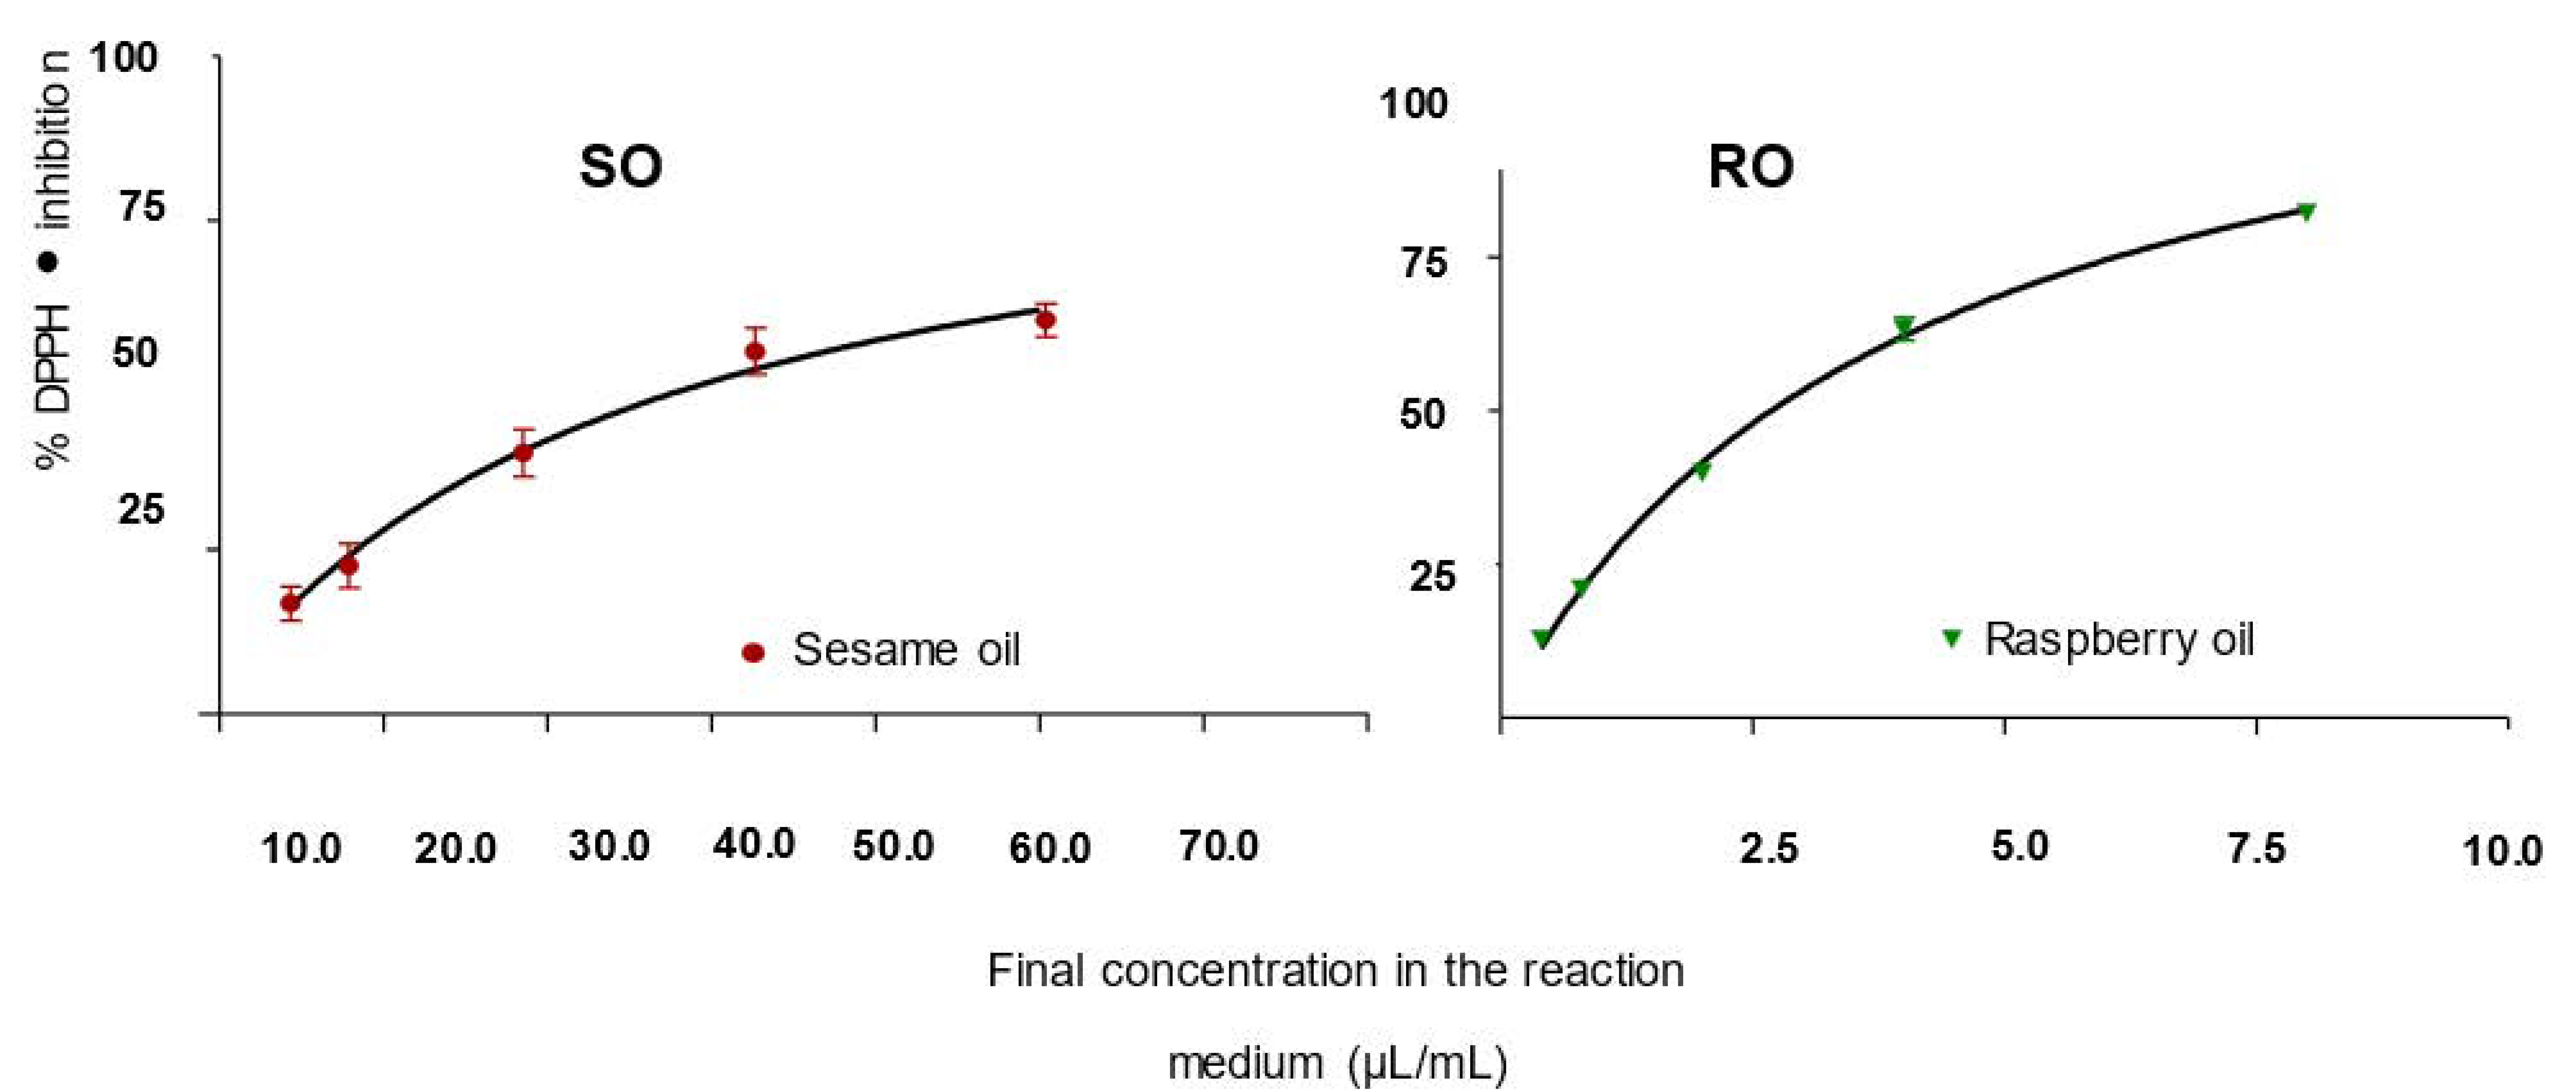
5.1.1. Inhibition of DPPH

According to Bandoniene et al. [39] and Antolovich et al. [40], the IC50 value expresses the amount of antioxidant raw material necessary to reduce the absorbance of DPPH• by 50%. The value can be determined or calculated using the linear regression slope (Figure 1). According to the curve, the IC50 values for SO and RO were 310.94 μL/mL and 34 μL/mL, respectively.
Table 3 shows the percentage of inhibition of DPPH in different concentrations of SO and RO necessary to inhibit 50% of DPPH activity (sixtuplicate).

5.1.2. Superoxide Radical Scavenging Activity Generated in Xanthine (X)/Luminol (L)/Xanthine Oxidase (XOD) System by Chemiluminescence

Chemiluminescence is determined based on area measurements as a function of the luminescent emission time in the presence of antioxidants. Luminol was used as a detector, which is oxidized to superoxide anion. The inhibition of the luminescent emission caused by the decrease in the superoxide anion resulted in the evaluation of the antioxidant power. In Table 4, the 42.56% and 31.5% values for SO and RO, respectively, are not real if we consider 29.28% of inhibition for the solvent (EA: IPA).
To verify the interference of this solvent, another test was performed only with pure oils, without the addition of solvents, whose values are shown in Table 5.
The inhibition percentages are shown in Table 5, so the antioxidant power of pure vegetable oils have values of 20.44% and 50.66% for Sesame Seed Oil and Raspberry Seed Oil, respectively. Therefore, RO has a higher antioxidant power than SO. In this test, there was a technical problem regarding the turbidity of the RO reaction medium. To verify the interference of this problem, a third test (test 3) was carried out, the results of which were shown in Table 6.
The interference of the turbidity of the medium was carried out by submitting the sample with the RO and the reaction medium without Luminol to verify if there was any emission without the luminescent substance. The result obtained was that without Luminol, there was no emission inhibition (99.86%); therefore, there was no interference confirmed by the test with the glycine buffer mixture. Therefore, the inhibition of RO was 42.08%, thus characterizing its antioxidant activity.

6. Formulation Studies

6.1. Determination of Required HLB Value for SO and RO

Table 7 and Figure 2 and Figure 3 show the creaming profile and globule size of SO emulsions in HLB values ranging from 5.0 to 15.0 using polysorbate 80 (SP80) and sorbitan monooleate (SSM) as the surfactant pairs.
According to Gullapalli et al. [23], the greater the creaming profile (%) and the smaller the globule size (nm), the greater the stability of the emulsion. For Zhang and Que [41], the size of the globules was much smaller in the optimal HLB of the mixture of surfactants. In the case of SO, the creaming profile, shown in Table 7 and Figure 2 and Figure 3, was higher at HLB values of 8.0 and 9.0, demonstrating that the HLB value that presented the smallest globule size was 8.0.
In the case of SO, the creaming profile was higher at HLB 8.0, and the HLB values that showed the smallest globule sizes were 7.0 and 8.0 (Table 7). The HLB value required for SO, even when changing the hydrophilic surfactant (SP80 for PEG 30 castor oil 30), did not change, remaining at 8.0.
For RO, samples with HLB 8.0, 9.0, 10.0, and 11.0 were submitted (triplicate) to the thermal stress test, and it was verified that only the emulsions with HLB 11.0 showed a slight modification after 70 °C. According to Liu et al. [42], the temperature influences the HLB values of the system: the higher the temperature, the smaller the optimal HLB for the emulsion, and the smaller the size of the globules.

6.2. Formulation Studies Based on the Ternary Diagram

The study of the ternary diagram with the surfactant components (PEG 15 or PEG 30 castor oil + sorbitan monooleate) with an HLB value of 8.0, an oil phase (SO or RO), and purified water was carried out in two steps.
Step 1. Varying the concentration of ternary phase components at 10.0%.
In Figure 4 (Step 1), the ternary diagram identifies at point 29 (10.0% SO or RO, 10.0% PEG 15 castor oil; 80.0% purified water) the formation of nanoemulsions common to both vegetable oils. After 24 h of preparation, O/W nanoemulsion 29 (SO and PEG 15 castor oil) showed a translucent appearance but showed phase separation after 15 days of preparation.
Table 8 describes the evaluated parameters of nanoemulsions prepared with PEG 30 castor oil (time of 24 h and 6 months) and PEG 30 castor oil (24 h) at HLB values of 8.0 and 8.3, respectively. The nanoemulsion obtained with PEG 15 castor oil showed a very reduced globule size (20 nm) with low stability after 24 h and phase separation after 1 month. The one prepared with PEG 30 castor oil showed no phase separation after 6 months, with minimal differences in physical characteristics (the globule size changed from 226.7 to 264 nm; the zeta potential changed from 35.5 to 49.1 mV; and the pH value changed from 6.74 to 6.03). The formulas prepared with PEG 40 castor oil and PEG 54 castor oil showed phase separation after 24 h of preparation and are therefore not presented in Table 8. According to Tadros et al. [17] and Fernandez et al. [43], for PEG 40 castor oil and PEG 54 castor oil, there was no steric stabilization as the degree of ethoxylation did not allow for good packaging of the nanometric globules.
The nanoemulsion composition obtained with PEG 15 castor oil was prepared using other PEG castor oil derivatives with different grades of ethoxylation (54EO, 40EO, and hydrogenated 40EO). The addition of PEG 54 castor oil (0.10 and 1.00%) to this nanoemulsion produced stable dispersions with or without the addition of RO (Table 9).
Step 2. Varying the concentration of ternary phase components at 5.0%.
Figure 4 (Step 2) shows the derivatives’ formulas around point 29, numbered from 37 to 58, with 2.5% variations in their components.

6.2.1. Influence of Addition of Additives on Formulation

RO was added at concentrations of 5.0% and 7.50%, and the co-surfactant PEG 54 castor oil was added at concentrations of 0.5% and 1.0% (Table 9) to study the influence of both additives.

6.2.2. Stability Studies

Thermal Stress

The results of the thermal stress test (Table 10) show the stability of the emulsions with SO with or without RO at the HLB value of 8.0 and at the temperature of 73 ± 2 °C.
It was observed that the formulation 50.3.3 ** F was the most stable in the thermal stress test. Then, a minimum difference in HLB values was tested to verify the influence of the HLB value (Table 11).

Particle Size

The nanoemulsion prepared at 25 ± 2 °C presented a milky appearance and coalesced after 24 h. By rapidly cooling the nanoemulsion at a temperature close to the PIT, according to Izquierdo, P. et al. [25,26], Shinoda, K. et al. [44,45], and Ee et al. [46] small and very stable globules were observed.
The results presented in the phase inversion in the temperature range considered for this study related to Table 12 demonstrate that the globule size varies from 15.0 nm ± 2.5 nm to 61.0 nm ± 11.0 nm over 90 days, and according to the cited authors, it presents high system stability. This kinetic stability was evaluated by the Ostwald Ripening index. According to the theory of Lifshitz, Slezov, and Wagner [47], Ostwald ripening in O/W emulsions consists of the phenomenon of growth of a globule by the expansion of larger globules due to the variation in the chemical potential of the oil phase between globules of different sizes originated from their different radii of curvature.
Table 13 shows the diameter (nm) values of SO nanoemulsions with the addition of RO and co-surfactants added for the stability test.
Nanoemulsion A was the one with the smallest globule size and the greatest homogeneity in size distribution, that is, 17.33 ± 3.06 nm, which changed to 42 ± 16.97 nm (<50 nm) after 30 days and had a translucent macroscopic appearance according to the definition of Liu et al. [42], Izquierdo et al. [26], and Anton et al. [48]. At 4 ± 2 °C, after 30 days, there was no change in the size of nanoemulsion, assuming values of 17.33 ± 3.06 nm (one day) and 15.00 ± 1.41 nm (thirty days). After 5 days at 45 ± 2 °C, nanoemulsion A presented an instability process and coalescence, which was due to this temperature value. Thus, as non-equilibrium systems, nanoemulsions present reductions in interfacial area and free energy through several instability processes, such as creaming/sedimentation, flocculation, Ostwald ripening, and coalescence [17,33].

pH and Viscosity Analysis
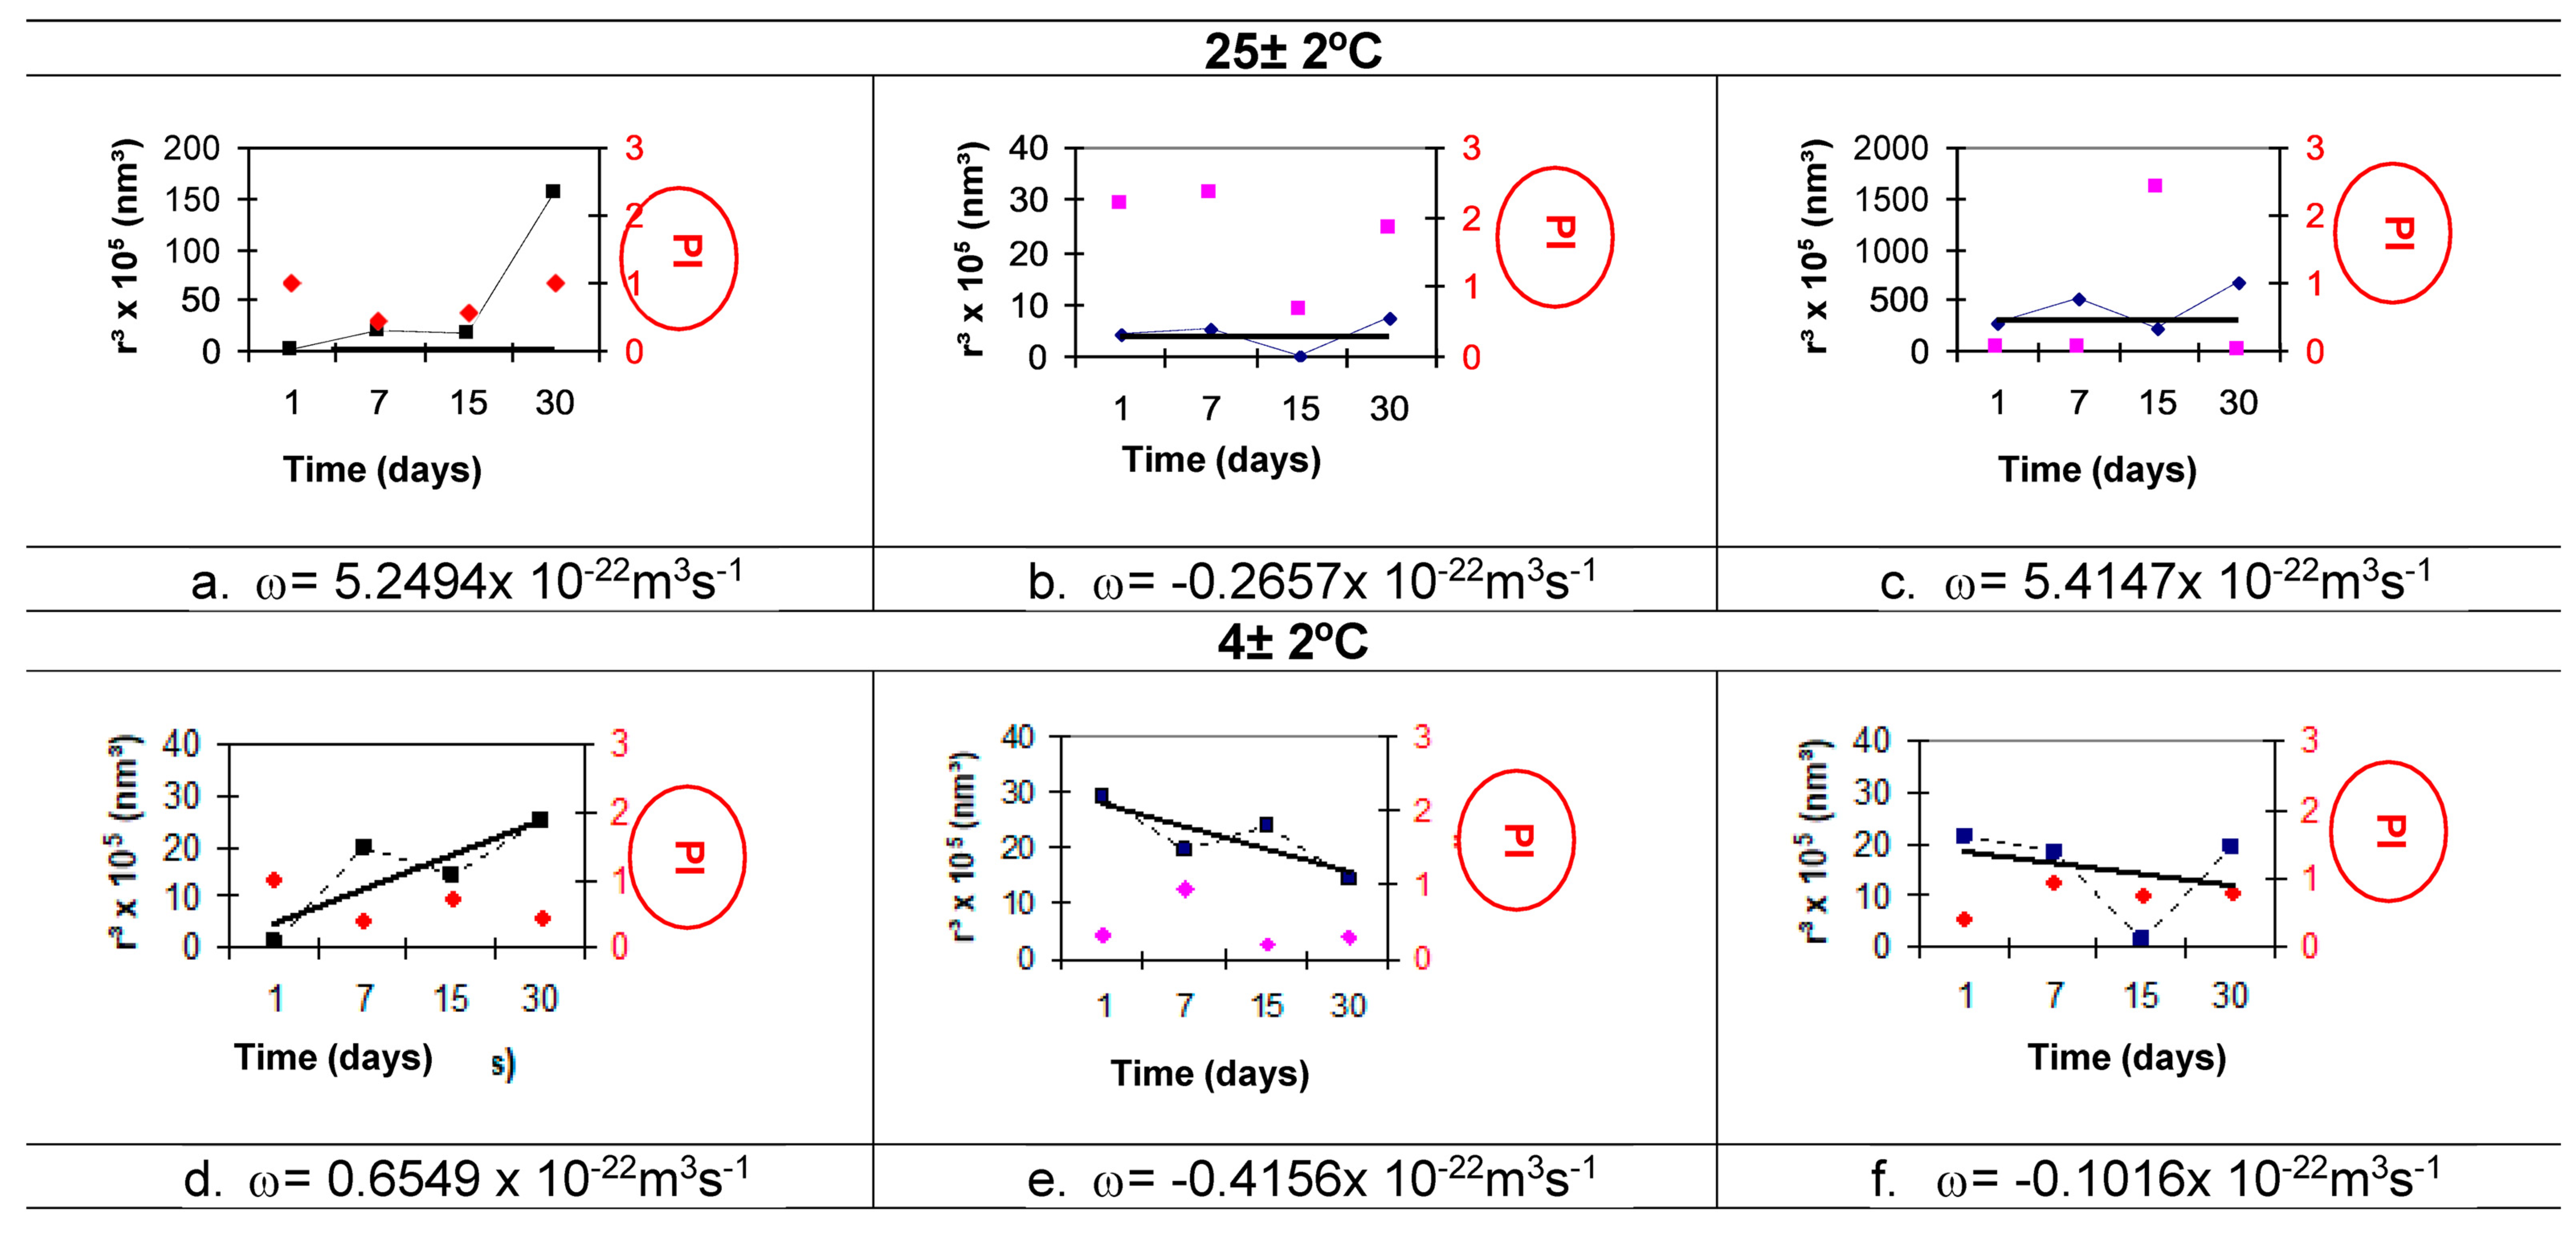
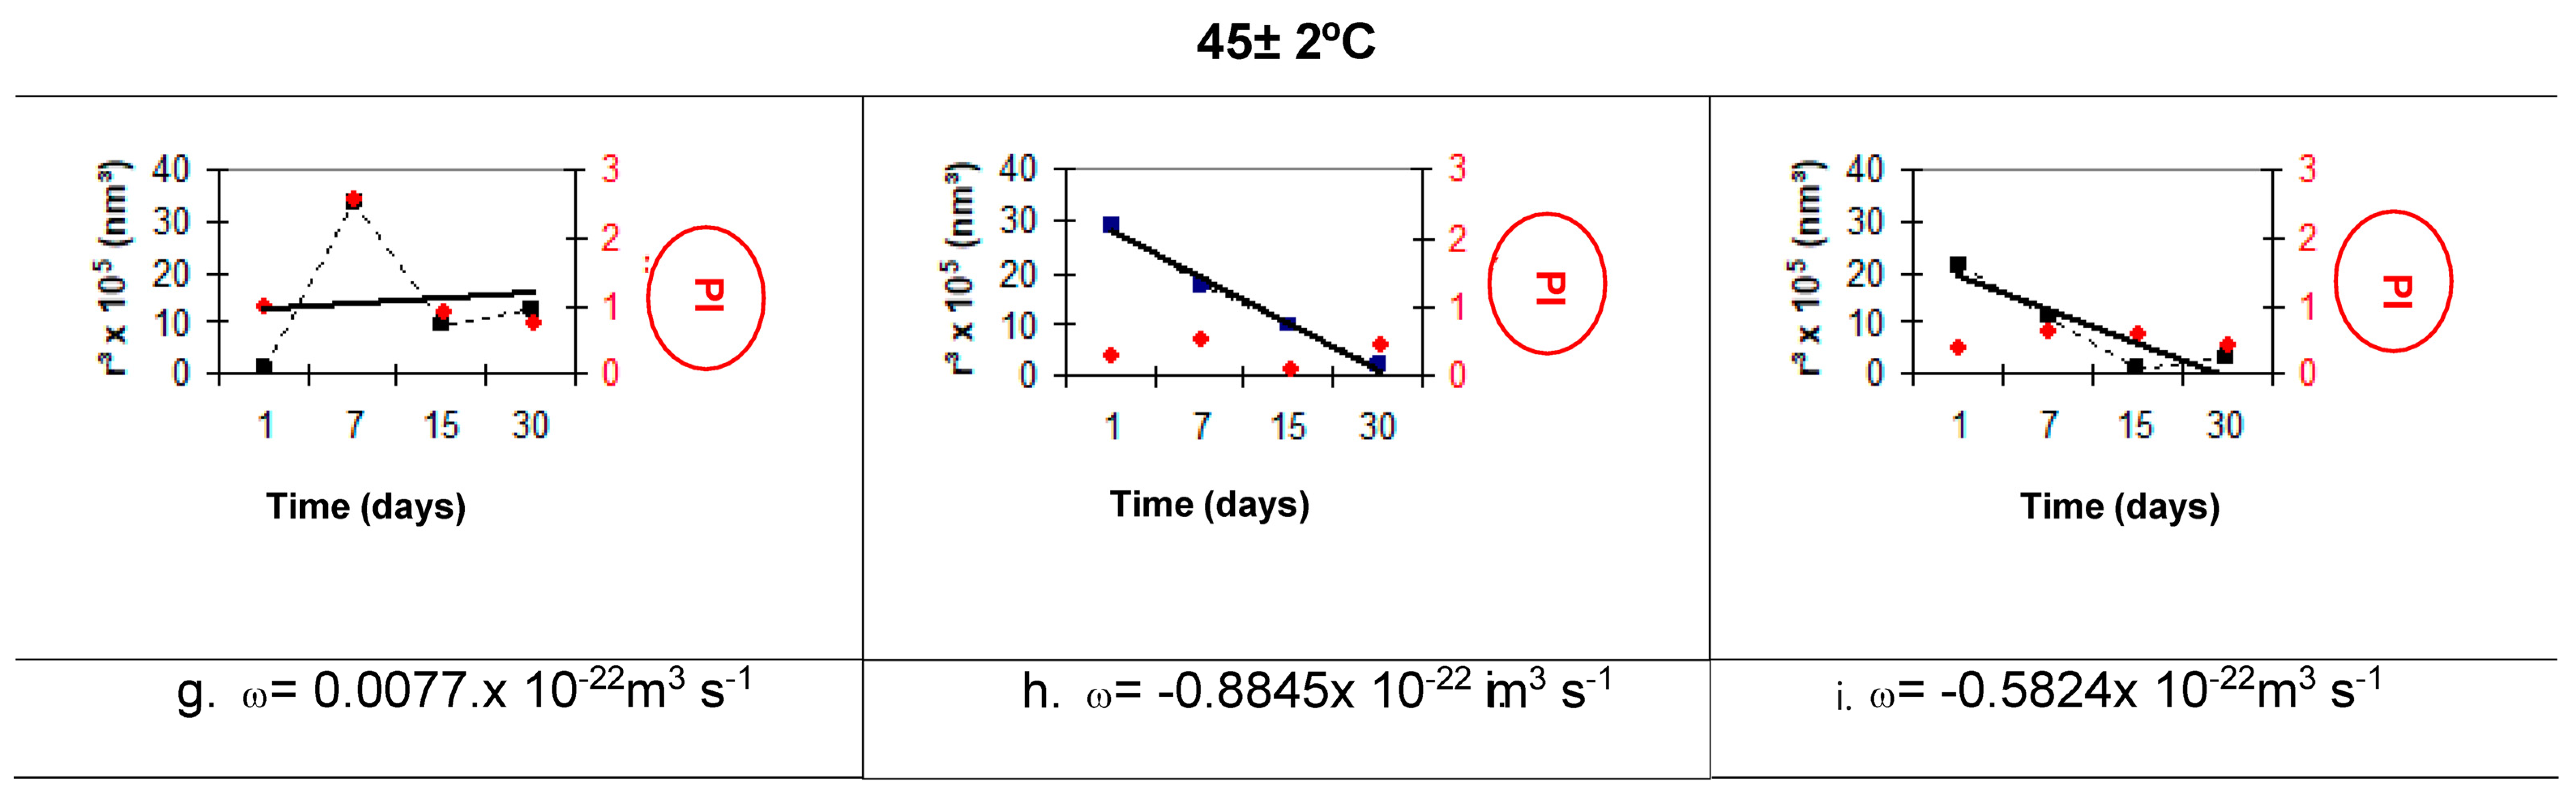
Table 14 presents the pH values of the nanoemulsions submitted to the stability test. It can be observed that there was a slight decrease in the pH values after one month of the samples being kept at 25 ± 2 °C, while at 4 ± 2 °C, the pH values remained unchanged. For the samples submitted to 45 ± 2 °C, the nanoemulsions progressively decreased the pH values to lower than 4.0. This suggests that a chemical degradation of the components, such as the release of carboxylic acids from the oil phase and/or from the set of surfactants, must have occurred since both are composed of fatty acids.
To verify the influence of temperature on the viscosity values (cP), formula A was prepared at different temperatures and stored for different periods of time (Table 15).
From the results obtained through statistical analysis (ANOVA–Newman Keuls test with p < 0.05), the formulations prepared at temperatures below 65 ± 2 °C showed a significant difference after 90 days, and phase separation occurred within 120 days of preparation. It can be observed that the best preparation temperature was 85 ± 2 °C, which presented the smallest statistical difference after 120 days.

Ostwald Ripening

Compared with conventional emulsions, nanoemulsions generally resist instability processes due to the nanometric size of the globules, and Ostwald ripening is always the main instability mechanism of nanoemulsions [17,32,33,49].
According to Welin-Berger et al. [50], this instability process can be minimized by adding a second component with lower solubility in the dispersed phase, and this could increase the stability of the nanoemulsion. The required amount of this component depends on the size distribution of the nanoemulsion globules and the volume of the dispersed phase. This justifies the addition of RO and co-surfactants added for the stability test.
For nanoemulsion A, the main instability mechanism was Ostwald ripening, which was confirmed by linear regression [17,51,52]. From the R2 values of the linear regression of the nanoemulsions in the 90-day period, it can be observed that with the exception of the sample prepared at 55 °C that presents values lower than 0.8, which infers non-linear characteristics (R2 < 0.8), the other R values were linear.
It can be observed that in relation to the ω values of the nanoemulsions prepared by the classical methodology, the PIT method was efficient because it presented much lower ω values, characterizing a metastable system [29].
Nanoemulsion A presents lower values of the Ostwald ripening index (1.33) with good correlation (0.9796) at 85 ± 2 °C, which is the best temperature value for the formation of the nanoemulsion (Table 16).
In the case of nanoemulsion F, the lowest value for the Ostwald maturation index (1.33) with good correlation (0.9796) corresponds to the temperature value of 75 ± 2 °C, which is considered the best temperature value for the formation of the nanoemulsion (Table 16).
The determination of the Ostwald ripening index is based on the Lifshitz–Slezov–Wagner (LSW) theory. The process of Ostwald ripening instability [53] or molecular diffusion occurs due to the Kelvin effect, which indicates the changes that occur in the curvature of the globule and in their chemical potential [54]. The Ostwald ripening index increases due to the solubility difference between globules with different sizes: the formation of large globules was due to the diffusion of the contents of smaller globules through the continuous phase joining the larger ones—there was no barrier to their passage through the interface, and this diffusion was the limiting step for the growth rate [32,33,42].
This analysis proposes that, over time, the Ostwald ripening process presents a stationary phase in which the cubic value of the mean radii of the globules increases linearly with time and the monodisperse distribution of the globules normalized by the mean values of the radii will be invariant as a function of time. In Table 17, nanoemulsion A (triplicate) at room temperature (a, b, and c) showed a linear trend, and the same occurred with the sample F.80 (a, b, and c). According to the LSW theory (Equation (3)), the linearity of the cube of the radius with time means that in macroemulsions (radius > 1 μm), the rate of increase in the mean radius was much smaller than in an emulsion with a radius smaller than 0.5 μm. Therefore, for both nanoemulsions, it was demonstrated that the Ostwald ripening phenomenon was the main instability mechanism, presenting very close values, namely ωF.80a = 5.2494 × 10⁻²² m3s−1 and ωF.80c = 5.4147 × 10⁻²² m3s−1. Sample A showed very high values, namely ωAa = 3387.7 × 10−22 m3s−1, ωAb = 428.23 × 10⁻²² m3 s−1, and ωAc = 7806.2 × 10−22 m3 s−1.
Nanoemulsions formed by the action of their components and temperature values may present variable behavior because they are influenced by temperature, and in this case, other instability processes such as flocculation, creaming, sedimentation, or coalescence could occur in addition to Ostwald ripening. The negative values of the Ostwald ripening index prove this fact.
Shinoda et al. [44,45], using ethoxylated surfactants, found that they were highly temperature dependent, becoming lipophilic with an increasing temperature due to the dehydration of the polyoxyethylene chains. In PIT, the globule size and interfacial tension reach a minimum value, and the globules are unstable and coalesce rapidly. For this reason, the results for A nanoemulsions obtained by classical emulsification showed a high Ostwald ripening index (Table 17).
The IP (Figure 5 and Figure 6) reveals the quality of the dispersion, with values below 0.1 indicating adequate dispersions and values up to 1.0 indicating samples with low quality, which, in concrete terms, means that the nanoemulsion presents sizes with high polydispersity [34,48].
Samples A and F.80 in triplicate showed irregularity under different conditions (room temperature, refrigerator, and oven). The PI can justify all the growth behaviors of the globules in the samples in stability evaluation.

Assessment of Antioxidant Capacity

The formulations subjected to the antioxidant test were A (SO 10.0% and RO 3.0%) and F.80 (SO 7.5% and RO 5.0%). Table 18 presents the values of the theoretical calculation of the percentage of DPPH inhibition of formulations A and F.80. Therefore, for the theoretical calculation presented in Table 18, the % DPPH inhibition values of formulations A and F.80 were 60.0% and 85.0%, respectively.

Antioxidant Activity of Nanoemulsions: Reaction with DPPH

Table 19 demonstrates the percentage of DPPH inhibition of formulations A and F.80 and its components (except purified water).
By analyzing the results shown in Table 19, samples A and F.80 showed antioxidant activity (68.71% and 67.75%, respectively), and they showed a statistical difference with the controls. Among the nanoemulsions, there was no statistical difference in antioxidant activity. The controls showed DPPH inhibition of 37.53% for A and 35.5% for F.80.
Regarding the results of the difference in DPPH inhibition (Table 19 and Table 20) in the control samples and surfactant solutions with BHT (37.53% control nanoemulsion A + 21.6% S. F.80 with BHT = 59.13%; 35.50% control nanoemulsion A + 22.2% surfactant F.80 with BHT = 57.7%), the results were compatible with total inhibition for the nanoemulsions (68.71% in 29.30 and 67.75% in F.80). A theoretical approximation of the amount of these oils in each formulation is plotted on the inhibition curve of each formulation shown in Table 19 (formulation A—60.0% inhibition; formulation F.80—85.0% inhibition). The % inhibition of pure oils was relatively higher than the actual % for nanoemulsions A (68.71%) and F.80 (67.75%).
The mechanisms of antioxidants are diverse, including hydrogen donating compounds, metal chelators, singlet oxygen inhibitors, oxygen inhibitors, and the action of antioxidant enzymes [55,56,57]. According to Lee, J. et al. [58], the DPPH method is specifically justified in the determination of hydrogen-donating antioxidant compounds, such as BHT. To verify the interference of BHT and other components of the formulations, the following was evaluated: the antioxidant activity of surfactant solutions (S. A and S. F.80); the surfactant solution added with BHT (S. A + BHT and S. F.80 + BHT); and the preservative solution in the concentrations used in the nanoemulsions (Table 20). All comparative results of the influence of nanoemulsion components were submitted to the Newman–Keuls multiple comparison ANOVA statistical test (p < 0.001) and showed statistically different values.
Surfactants and preservatives showed very low antioxidant activity, practically not influencing the activity of formulations A and F.80. The test with BHT showed considerable activity, thus contributing to high values of % DPPH inhibition in the A (68.71% and 21.6% control with BHT) and F.80 (67.75% and 22.2% control with BHT) formulations.
The DPPH method does not represent the concentration of all oxidation products but measures the concentration of hydrogen-donating antioxidants or generated free radicals, such as alkoxyl (RO), peroxyl (ROO), or alkyl (R) radicals. The results of the DPPH studies can provide important information for researchers to classify new antioxidant compounds from natural sources. The interpretation of these results must be carefully discussed because not only the free radical inhibitor compounds but also the radicals themselves can decrease the stability of DPPH [58].

7. Toxicity Evaluation by HET-CAM Methodology

The chorioallantoic membrane test emerged as a viable alternative to the Draize test to assess the ocular irritation of water-soluble cosmetic products [58,59]. According to Zanatta, CF [60], the HET-CAM test is efficient in determining the irritating potential of products containing surfactants and emulsions. The results obtained with the nanoemulsions A (93.75 ± 6.24 s) and F.80 (122.3 ± 10.14 s) and surfactant solutions S. A (99.0 ± 9.20) and S. F.80 (125.0 ± 7.39 s) (Table 21) demonstrate that the appearance of capillaries (hyperemia) occurred in a time close to 2 min, which is equivalent to a score between 3 and 1, thus classifying the samples as slightly irritating.
A more complete study with the application of each raw material and/or combination of raw materials must be carried out to identify the agent responsible for this mild irritation preventing its indication for use as a cosmetic product.

8. Conclusions

The applications of nanoemulsions are numerous, including topical anti-aging care, makeup, nail care, deodorants, oral care, sunscreen, and hair care. Nanoemulsions based on SO and RO were prepared using the low-energy method; they are low-cost formulations and demonstrate prolonged stability according to the tests to which they were subjected. We can conclude the following:
  • The IC50 values were 310.94 μL/mL and 34 μL/mL for SO and RO, respectively. The percentages of inhibition of chemiluminescent emission for SO and RO were 20.44% and 42.08%, and these results characterize that the antioxidant activity for RO is twice as high as that of SO. The percentages of DPPH inhibition for both pure SO and RO were relatively higher than those determined for nanoemulsions.
  • The HLB value required for SO using polysorbate 80 and sorbitan monooleate was 8.0, and it was the same for RO using PEG 30 castor oil and sorbitan monooleate.
  • SO nanoemulsions were obtained with PEG 15 castor oil and PEG 30 castor oil at an HLB value of 8.0; the nanoemulsions were obtained by the low-energy process (PIT), and the globule sizes of nanoemulsions A and F. 80 were 50 nm and 200 nm, respectively. The co-surfactants PEG 40 castor oil and PEG 54 castor oil contributed to the formation of Sesame Seed Oil nanoemulsions with Raspberry Seed Oil additives. The pH values of the nanoemulsions were found to be suitable for skin care products, and the lower viscosity values allow for easy application to the skin.
  • The nanoemulsions A and F. 80 showed antioxidant activity (68.71% and 67.75%, respectively). The theoretical approach for evaluating antioxidant activity using the DPPH method revealed 60% antioxidant activity for formulation A and 85% antioxidant activity for formulation F.80. An interference in the results was observed if BHT was employed in the formulations.
  • The results for the Ostwald ripening index allow it to be used as a comparative indicator of nanoemulsion stability. The SO nanoemulsion with PEG 15 and PEG 30 castor oil obtained at 85 °C and 75 °C, respectively, has the lowest Ostwald ripening index (1.33 × 10⁻²² m3 s−1).
  • The in vitro evaluation using the HET-CAM method of surfactants used to form nanoemulsions showed that they were slightly irritating. A more complete study with the application of each raw material and/or a combination of raw materials must be carried out to identify the agent responsible for this mild irritation, preventing its indication for use as a cosmetic product.
Nanoemulsions are also employed in a diverse range of biomedical applications (ocular, intravenous, and other modes of delivery) due to the small droplet sizes that render exceptional properties such as prolonged stability and controlled rheology. Nanoemulsions not only aid in tissue repair but are also considered as excellent delivery systems for various synthetic and natural actives.

Author Contributions

Conceptualization, methodology, and writing—review and editing, P.A.R.-F. and M.M. All authors have read and agreed to the published version of the manuscript.

Funding

This research received no external funding.

Institutional Review Board Statement

Not applicable.

Informed Consent Statement

Not applicable.

Data Availability Statement

Data are contained within the article.

Conflicts of Interest

The authors declare no conflicts of interest.

References

  1. Guzmán, E.; Lucia, A. Essential Oils and Their Individual Components in Cosmetic Products. Cosmetics 2021, 8, 114. [Google Scholar] [CrossRef]
  2. Vaughn, A.R.; Clark, A.K.; Sivamani, R.K.; Shi, V.Y. Natural Oils for Skin-Barrier Repair: Ancient Compounds Now Backed by Modern Science. Am. J. Clin. Dermatol. 2018, 19, 103–117. [Google Scholar] [CrossRef]
  3. Zaid, A.; Jaradat, N.; Malkieh, N.; Al-Rimawi, S.; Hussein, F.; Isa, L.; Ali, I.; Manasra, R.; Silwadi, G.; Sadder, O.; et al. Impact of Sesame Oil Source: A Quality Assessment for Cosmeceutical and Pharmaceutical Use. FABAD J. Pharm. Sci. 2019, 44, 189–196. [Google Scholar]
  4. Lin, T.K.; Zhong, L.; Santiago, J.L. Anti-Inflammatory and Skin Barrier Repair Effects of Topical Application of Some Plant Oils. Int. J. Mol. Sci. 2017, 19, 70. [Google Scholar] [CrossRef] [PubMed]
  5. Ghafoorunissa, H.S.; Rao, M.V.V. Sesame lignans enhance antioxidant activity of vitamin E in lipid peroxidation systems. Mol. Cell. Biochem. 2004, 262, 195–202. [Google Scholar] [CrossRef]
  6. Lee, J.; Lee, Y.; Choe, E. Effects of sesamol, sesamin, and sesamolin extracted from roasted sesame oil on the thermal oxidation of methyl linoleate. LTW Food Sci. Technol. 2008, 41, 1871–1875. [Google Scholar] [CrossRef]
  7. Yaseen, G.; Ahmad, M.; Zafar, M.; Akram, A.; Sultana, S.; Ahmed, S.N.; Kilic, O. Sesame (Sesamum indicum L.). Chapter 15. In Green Sustainable Process for Chemical and Environmental Engineering and Science Plant-Derived Green Solvents: Properties and Applications; Elsevier Inc.: Amsterdam, The Netherlands, 2021; pp. 253–269. [Google Scholar] [CrossRef]
  8. Oomah, B.D.; Ladet, S.; Godfrey, D.V.; Liang, J.; Girard, B. Characteristics of raspberry (Rubus idaeus L.) seed oil. Food Chem. 2000, 69, 187–193. [Google Scholar] [CrossRef]
  9. Bramley, M.; Elmadfa, I.; Kafatos, A.; Kelly, J.; Manios, Y.; Roxborough, E.; Schuch, W.; Sheehy, A.; Wagner, K.-H. Vitamin E. J. Sci. Food Agric. 2000, 80, 913–938. [Google Scholar] [CrossRef]
  10. Ispiryan, A.; Viškelis, J.; Viškelis, P. Red Raspberry (Rubus idaeus L.) Seed Oil: A Review. Plants 2021, 10, 944. [Google Scholar] [CrossRef]
  11. Wang, P.W.; Cheng, Y.-C.; Hung, Y.-C.; Lee, C.-H.; Fang, J.-Y.; Li, W.-T.; Wu, Y.-R.; Pan, T.-L. Red Raspberry Extract Protects the Skin against UVB-Induced Damage with Antioxidative and Anti-inflammatory Properties. Oxidative Med. Cell. Longev. 2019, 2019, 9529676. [Google Scholar] [CrossRef] [PubMed]
  12. Tadros, T.F. Future developments in cosmetic formulations. Int. J. Cosm. Sci. 1992, 14, 93–111. [Google Scholar] [CrossRef] [PubMed]
  13. Santos, A.C.; Morais, F.; Simões, A.; Pereira, I.; Sequeira, J.A.D.; Pereira-Silva, M.; Veiga, F.; Ribeiro, A. Nanotechnology for the development of new cosmetic formulations. Expert Opin. Drug Deliv. 2019, 16, 313–330. [Google Scholar] [CrossRef] [PubMed]
  14. Gupta, A. Nanoemulsions. In Nanoparticles for Biomedical Applications. Fundamental Concepts, Biological Interactions and Clinical Applications; Elsevier: Amsterdam, The Netherlands, 2020; pp. 371–384. [Google Scholar] [CrossRef]
  15. Chhabra, J.; Chopra, H.; Pahwa, R.; Raina, N.; Wadhwa, K.; Saini, S.; Negi, P.; Gupta, M.; Singh, I.; Dureja, H.; et al. Potential of nanoemulsions for accelerated wound healing: Innovative strategies. Int. J. Surg. 2023, 109, 2365–2377. [Google Scholar] [CrossRef] [PubMed] [PubMed Central]
  16. Gupta, A.; Eral, H.B.; Hatton, A.T.; Doyle, P.S. Nanoemulsions: Formation, properties and applications. Soft Matter 2016, 12, 2826–2841. [Google Scholar] [CrossRef] [PubMed]
  17. Tadros, T.; Izquierdo, P.; Esquena, J.; Solans, C. Formation and stability of nanoemulsions. Adv. Colloid Interface Sci. 2004, 108–109, 303–318. [Google Scholar] [CrossRef] [PubMed]
  18. Taylor, P. Ostwald ripening in emulsions: Estimation of solution thermodinamics of the disperse phase. Adv. Colloid Interface Sci. 1998, 75, 107–163. [Google Scholar] [CrossRef]
  19. Mello, L.D.; Hernandez, S.; Marrazza, G.; Mascini, M.; Kubota, L.T. Investigations of the antioxidant properties of plant extracts using a DNA-electrochemical biosensor. Biosens. Bioelectron. 2006, 21, 1374–1382. [Google Scholar] [CrossRef]
  20. Duan, X.J.; Zhang, W.W.; Li, X.M.; Wang, B.G. Evaluation of antioxidant property of extract and fractions obtained from a red alga, Polusiphonia urceolata. Food Chem. 2006, 95, 37–43. [Google Scholar] [CrossRef]
  21. Silva, C.G.; Herdeiro, R.S.; Mathias, C.J.; Panek, A.; Silveira, C.; Rodrigues, V.; Rennó, M.; Falcão, D.; Cerqueira, D.; Minto, A.; et al. Evaluation of antioxidant activity of Brazilian plants. Pharmacol. Res. 2005, 52, 229–233. [Google Scholar] [CrossRef]
  22. Marquele, F.D.; Di Mambro, V.M.; Georgetti, S.R.; Casagrande, R.; Valim, Y.M.; Fonseca, M.J.V. Assessment of the antioxidant activities of Brazilian extracts of propolis alone and in topical pharmaceutical formulations. J. Pharm. Bio. Anal. 2005, 39, 455–463. [Google Scholar] [CrossRef] [PubMed]
  23. Gullapalli, R.P.; Sheth, B.B. Influence of an optimized non-ionic emulsifier blend on properties of oil-in-water emulsions. Eur. J. Pharm. Biopharm. 1999, 48, 233–238. [Google Scholar] [CrossRef]
  24. Santos, O.D.H. Development and Evaluation of the Physicochemical Properties and In Vivo Cosmetic Activity of Calendula Officinalis Oil Emulsions with Liquid Crystal. Ph.D. Thesis, University of São Paulo, São Paulo, Brazil, 2006. [Google Scholar]
  25. Izquierdo, P.; Esquena, J.; Tadros, T.F.; Dederen, C.; Garcia, M.J.; Azemar, N.; Solans, C. Formation and stability of nanoemulsions prepared using the phase inversion temperature method. Langmuir 2002, 18, 26–30. [Google Scholar] [CrossRef]
  26. Izquierdo, P.; Feng, J.; Esquena, J.; Tadros, T.F.; Dederen, J.C.; Garcia, M.J.; Azemar, N.; Solans, C. The influence of surfactant mixing ratio on nano- emulsion formation by the pit method. J. Colloid Interface Sci. 2005, 285, 388–394. [Google Scholar] [CrossRef]
  27. Ribeiro, A.M.; Khoury, E.; Gottardi, D. Validation of stability tests for cosmetic products. In Proceedings of the 12th National Congress of Cosmetology, São Paulo, Brazil, 30 June–2 July 1998; Brazilian Association of Cosmetology, ANAIS Tecnopress: São Paulo, Brazil, 1998; pp. 349–375. [Google Scholar]
  28. Ferrari, M. Obtaining and Application of Multiple Emulsions Containing Andiroba and Copaiba Oils. Master’s Thesis, University of São Paulo, Ribeirão Preto, SP, Brazil, 1998. [Google Scholar]
  29. Mason, T.G.; Wilking, J.N.; Meleson, K.; Chang, C.B.; Graves, S.M. Nanoemulsions: Formation, structure, and physical properties. J. Phys. Condens. Matter 2006, 18, R635. [Google Scholar] [CrossRef]
  30. Braconi, F.L.; Oliveira, I.S.; Baroni, M.N.F.; Rocha-Filho, P.A. Cosmetic application of canola oil. In Proceedings of the XII Latin American and Iberian Congress of Cosmetic Chemists, São Paulo, Brazil, 27–31 August 1995; Brazilian Association of Cosmetology, Tecnopress: São Paulo, Brazil, 1995; pp. 6–19. [Google Scholar]
  31. Anvisa Brazil. National Health Surveillance Agency. In Guide to the Stability of Cosmetic Products; Thematic Series; Quality Series 1; Anvisa Brazil: Brasilia, DF, Brazil, 2004. [Google Scholar]
  32. Capek, I. Degradation of kinetically-stable o/w emulsions. Adv. Colloid Interface Sci. 2004, 107, 125–155. [Google Scholar] [CrossRef] [PubMed]
  33. Taylor, P. Ostwald ripening in emulsions. Adv. Colloid Interface Sci. 1995, 99, 175–185. [Google Scholar] [CrossRef]
  34. Jafari, S.M.; He, Y.; Bhandari, B. Production of sub0micron emulsions by ultrasound and microfluidization techniques. J. Food Eng. 2007, 82, 478–488. [Google Scholar] [CrossRef]
  35. Luepke, N. Hen’s egg choriallantoic membrane test for irritation potential. Food Chem. Toxicol. 1985, 23, 287–291. [Google Scholar] [CrossRef] [PubMed]
  36. Vinardell, M.P.; Garcia, L. The quantitative chorioallantoic membrane test using trypan blue stain to predict the eye irritancy of liquid scintillation cocktails. Toxicol. Vitr. 2000, 14, 551–556. [Google Scholar] [CrossRef]
  37. Murillo, G.; Pérez, U.; Tur, E.; Vinardell, M.P.; García, G. Pascual. Estúdio comparativo de três variantes del ensayo de la membrana corioalantoidea del huevo de la galina para La evaluación de la irritación ocular. Rev. Toxicol. 2003, 20, 187–192. [Google Scholar]
  38. Vinardell, M.P.; Mitjans, M. The chorioallantoic membrane test as a model to predict the potential human eye irritation induced by commonly used laboratory solvents. Toxicol. Vitr. 2006, 20, 1066–1070. [Google Scholar] [CrossRef] [PubMed]
  39. Bandoniene, D.; Murkovic, M.; Pfannhauser, W.; Venskutonis, P.; Gruzdienė, D. Detection and activity evaluation of radical scavenging compounds by using DPPH free radical and online HPLC- DPPH methods. Eur. Food Res. Technol. 2002, 214, 143–147. [Google Scholar] [CrossRef]
  40. Antolovich, M.; Prenzler, P.D.; Patsalides, E.; McDonald, S.; Robards, K. Methods for testing antioxidant activity. Analyst 2002, 127, 183–198. [Google Scholar] [CrossRef]
  41. Zhang, L.; Que, G. Influence of the HLB parameter of surfactants on the dispersion properties of brine in residue. Colloids Surf. A Physicochem. Eng. Asp. 2008, 320, 111–114. [Google Scholar] [CrossRef]
  42. Liu, W.; Sun, D.; Li, C.; Liu, Q.; Xu, J. Formation and stability of paraffin oil-in-water nano- emulsions prepared by the emulsion inversion point method. J. Colloid Interface Sci. 2006, 303, 557–563. [Google Scholar] [CrossRef] [PubMed]
  43. Fernandez, P.; André, V.; Rieger, J.; Kühnle, A. Nano-emulsion formation by emulsion phase inversion. Colloids Surf. 2004, 251, 53–58. [Google Scholar] [CrossRef]
  44. Shinoda, K.; Arai, H. The effect of phase volume on the phase inversion temperature of emulsions stabilized with nonionic surfactants. J. Colloid Interface Sci. 1968, 25, 429–431. [Google Scholar] [CrossRef]
  45. Shinoda, K.; Saito, H. The stability of O/W type emulsions as functions of temperature and the HLB of emulsifiers: The emulsification by PIT-method. J. Colloid Interface Sci. 1969, 30, 258–263. [Google Scholar] [CrossRef]
  46. Ee, S.L.; Duan, X.; Liew, J.; Nguyen, Q.D. Droplet size and stability of nano- emulsions produced by the temperature phase inversion method. Chem. Eng. J. 2008, 140, 626–631. [Google Scholar] [CrossRef]
  47. Lifshitz, I.M.; Slezov, V. The kinetics of precipitation from supersaturated solid solutions. J. Phys. Chem. Solids 1961, 19, 35–50. [Google Scholar] [CrossRef]
  48. Anton, N.; Gayet, P.; Benoit, J.-P.; Saulnier, P. Nano-emulsions and nanocapsules by the PIT method: An investigation on the role of the temperature cycling on the emulsion phase inversion. Int. J. Pharm. 2007, 344, 44–52. [Google Scholar] [CrossRef] [PubMed]
  49. Morales, D.; Gutiérrez, J.M.; García-Celma, M.J.; Solans, Y.C. A study of therelation between bicontinuous microemulsions and oil/water nanoemulsion formation. Langmuir 2003, 19, 7196–7200. [Google Scholar] [CrossRef]
  50. Welin-Berger, K.; Bergenståhl, B. Inhibition of Ostwald ripening in local anesthetic emulsions by using hydrophobic excipients in the disperse phase. Int. J. Pharm. 2000, 200, 249–260. [Google Scholar] [CrossRef] [PubMed]
  51. Gutiérrez, J.M.; González, C.; Maestro, A.; Solè, I.; Pey, C.; Nolla, J. Nano-emulsions: New applications and optimization of their preparation. Curr. Opin. Colloid Interfac Sci. 2008, 13, 245–251. [Google Scholar] [CrossRef]
  52. Porras, M.; Solans, C.; González, C.; Martínez, A.; Guinart, A.; Gutiérrez, J. Studies of formation of W/O nano-emulsions. Colloids Surf. A Physicochem. Eng. Asp. 2004, 249, 115–118. [Google Scholar] [CrossRef]
  53. Ostwald, W. Uber die vemeintliche Isomerie des roten und gelben quecksilberoxyds und die Oberflachen-spannung Fester Korper. Z. Für Phys. Chem. 1901, 34, 495–512. [Google Scholar] [CrossRef]
  54. Thomson, W.F.R.S. XLVI. Hydrokinetic solutions and observations. Lond. Edinb. Dublin Philos. Mag. J. Sci. 1871, 42, 362–377. [Google Scholar] [CrossRef]
  55. Boff, J.M.; Min, D.B. Chemistry and reaction of singlet oxygen in foods. Compr. Rev. Food Sci. Food Saf. 2002, 1, 58–72. [Google Scholar] [CrossRef]
  56. Lee, J.H.; Koo, N.S.; Min, D.B. Reactive oxygen species, aging, and antioxidative nutraceuticals. Compr. Rev. Food Sci. Food Saf. 2004, 3, 21–33. [Google Scholar] [CrossRef]
  57. Lee, J.M.; Chung, H.; Chang, P.-S.; Lee, J. Development of a method predicting the oxidative stability of edible oils using 2,2-diphenyl-1-picrylhydrazyl (DPPH). Food Chem. 2007, 103, 662–669. [Google Scholar] [CrossRef]
  58. Steiling, W.; Bracher, M.; Courtellemont, P.; de Silva, O. The HET-CAM, a useful in vitro assay for assessing the eye irritation properties of cosmetic formulations and ingredients. Toxicol. Vitr. 1999, 12, 375–384. [Google Scholar] [CrossRef] [PubMed]
  59. Doucet, O.; Lanvin, M.; Zastrow, L. Comparison of three in vitro methods for the assessment of the eye irritation potential of formulated products. Vitr. Mol. Toxicol. 1999, 12, 63–76. [Google Scholar]
  60. Zanatta, C.F. Aplicação do Óleo de Buriti no Desenvolvimento de Emulsões e Estudo da Citotoxicidade e Potencial Foto-Protetor Em Cultivo Celular. Ph.D. Thesis, Faculdade de Ciências Farmacêuticas de Ribeirão Preto, Ribeirão Preto, Brazil, 2008. [Google Scholar] [CrossRef]
Figure 1. Measurement curve of H+ donating activity to DPPH for SO and RO after solubilization in EA and IPA (1:1).
Cosmetics 12 00032 g001
Figure 2. Creaming profiles of Sesame Seed Oil emulsions at HLB values ranging from 5.0 to 15.0.
Cosmetics 12 00032 g002
Figure 3. Globule size of Sesame Seed Oil emulsions in HLB values ranging from 5.0 to 15.0.
Cosmetics 12 00032 g003
Figure 4. Diagram phase for Sesame Seed Oil (SO) and Raspberry Seed Oil (RO).
Cosmetics 12 00032 g004
Figure 5. Values of the Ostwald ripening index (ω) and the Polydispersity Index (PI) of sample A (triplicate) at 25 ± 2 °C and 4 ± 2 °C. Red symbol is PI and black symbol is radium.
Cosmetics 12 00032 g005
Figure 6. Values of the Ostwald ripening index (ω) and the Polydispersity Index (PI) of sample F.80 (triplicate) at 25 ± 2 °C, 4 ± 2 °C and 45 ± 2 °C. Red (purple) symbol is PI and black symbol is radium.
Cosmetics 12 00032 g006aCosmetics 12 00032 g006b
Table 1. Determination of required HLB values for SO and RO.
SO or RO30.0%
Sorbitan monooleateA% (*)
Polysorbate 80B% (*)
Purified water67.0%
(*) A + B = 3.0%.
Table 2. Proportion of components for determination of required HLB values for Sesame Seed Oil or Raspberry Seed Oil [24].
SO or RO10.0%
Sorbitan monooleateA% (*)
Polysorbate 80B% (*)
Purified water85.0%
(*) A + B = 5.0%.
Table 3. Percentage of inhibition of DPPH for SO and RO.
SampleNMean ± SD
123456
SO 750/RO 10078.0375.7974.6767.8563.5562.6270.42 ± 6.63
SO 500/RO 5071.3273.9374.6757.7652.7161.5065.31 ± 9.26
SO 300/RO 2551.2159.9659.5942.8039.4439.6348.77 ± 9.53
SO 150/RO 1038.9238.3637.8021.1222.4323.5530.36 ± 8.80
SO 100/RO 533.9729.8326.0320.3717.2018.1324.26 ± 6.80
Legend: N—number of samples; SO 750—formulation with SO at 750 μL/mL; SO 500—formulation with SO at 500 μL/mL; SO 300—formulation with SO at 300 μL/mL; SO 150—formulation with SO at 150 μL/mL; SO 100—formulation with SO at 100 μL/mL; RO 100—formulation with RO at 100 μL/mL; RO 50—formulation with RO at 50 μL/mL; RO 25—formulation with RO at 25 μL/mL; RO 10—formulation with RO at 10 μL/mL; RO 5—formulation with RO at 5 μL/mL.
Table 4. Photon count per minute and the % of inhibition of the luminescent emission of the solvent and SO and RO.
ControlSOROSolvent
Emission (×10−8 fpm)6.293.543.874.13
5.303.114.064.06
Mean ± SD
(×10−8 fpm)
5.79 ± 0.703.33 ± 0.303.97 ± 0.134.10 ± 0.05
(%) Inhibition-42.5631.5029.28
Legend: (×10−8 fpm)—photon count per minute.
Table 5. Photon count per minute and (%) the inhibition of luminescent emission of pure SO and RO in the evaluation of the scavenging activity of the superoxide radical generated in the X/L/XOD system.
ControlSORO
Emission (×10−8 fpm)2.742.041.47
3.002.401.36
2.462.081.25
Mean ± SD
(×10−8 fpm)
2.73 ± 0.272.17 ± 0.201.36 ± 0.11
Inhibition (%)-20.4450.26
Legend: (×10−8 fpm)—photon count per minute.
Table 6. Photon count per minute and the % inhibition of luminescent emission of RO with the addition of luminol, without the addition of luminol, and with added glycine buffer in the evaluation of the scavenging activity of the superoxide radical generated in the X/L/XOD system.
SampleControlRO +
Luminol
RO
No Luminol
RO +
Buffer Solution
Emission (×10−8 fpm)1.010.519.85 × 10−411.68 × 10⁻⁴
0.930.6016.72 × 10−430.44 × 10⁻⁴
0.92 12.96 × 10−425.82 × 10⁻⁴
Emission
(×10−8 fpm)
0.95 ± 0.050.55 ± 0.0613.18 ± 3.44 (×10−4)22.65 ± 9.77 (×10−4)
(%) Inhibition-42.0899.8699.76
Table 7. Creaming profile and globule size for determining HLB value of SO using SP80 and SSM.
HLB ValueCreaming Profile (%)Globule Size (nm)
5.042.40 ± 5.41662.67 ± 269.26
6.038.00 ± 7.21503.67 ± 72.20
7.033.80 ± 7.50653.3 ± 119.44
8.046.80 ± 31.48405.00 ± 231.32
9.047.20 ± 29.64496.33 ± 134.35
10.030.20 ± 12.76730.00 ± 21.00
11.027.00 ± 12.47729.67 ± 223.45
12.031.00 ± 13.27701.67 ± 170.89
13.027.80 ± 9.44466.33 ± 114.05
14.033.40 ± 8.65620.33 ± 28.53
15.036.00 ± 3.67427.33 ± 115.60
Table 8. Analysis of nanoemulsions prepared with PEG 15 castor oil and PEG 30 castor oil/sorbitan monooleate (HLB = 8.0).
HLB = 8.0TimepH ValueZeta Potential (mV)Size (nm)
POE15 EO: SSM24 h5.7531.820.0
POE 30 EO: SSM24 h6.7435.5226.7
POE 30 EO: SSM6 months6.0349.1264.0
Table 9. SO nanoemulsions at HLB = 8.0 with or without added RO and PEG 54 castor oil.
2950Additive
PEG 54
PEG 54 + RO
Formula nr
Components↓
29
A
50.1
B
50.2
C
50.3
D
50.3.2
E
50.3.3
F
50.3.4
G
50.3.5
H
SO10.007.507.507.507.507.507.507.50
RO----5.005.007.507.50
PEG 30
castor oil
5.003.753.753.755.005.005.005.00
Sorbitan monoleate5.003.753.753.755.005.005.005.00
PEG 54
castor oil
--1.000.500.501.001.005.00
Purified water80.0085.0084.0084.5077.0076.5074.0070.00
Table 10. Thermal stress of SO nanoemulsions with or without RO and PEG 54 castor oil at HLB = 8.0 (triplicate).
Temperature
(±2 °C) →
40455055606570758085
Formula ↓
29 ASSSSSSMTMMMMMT
50.1 * BSSSSSSSSSMM
50.3.2 ** ESSSSSSMTMLMIM
50.3.3 ** FSSSSSSSSSIM
50.3.4 ** GSSSSSSSMTIMIM
50.3.5 ** HSSSSSSSMIMIM
Legend: * without RO; ** with RO; S—stable; MT—modified translucent; MM—milky modified; M—modified; IM—intensely modified.
Table 11. SO nanoemulsions using PEG 30 castor oil/sorbitan monooleate with addition of RO and PEG 54 castor oil at HLB values of 8.0 and 8.3 for F.80 and F.83, respectively.
Components (% w/w) ↓F.80F.83
SO7.57.5
RO5.05.0
PEG 30 castor oil5.05.4
Sorbitan monooleate5.04.6
PEG 54 castor oil1.01.0
Purified water76.576.5
Table 12. Nanoemulsion A globule size (nm) prepared at different temperatures as function of different times of 7, 15, and 90 days.
Temperature (±2 °C) ↓Time (Days)
71590
3517.0 ± 2.018.0 ± 3.352.0 ± 4.8
4517.0 ± 1.421.0 ± 2.733.0 ± 5.5
5517.0 ± 1.416.0 ± 1.954.0 ± 4.4
6517.0 ± 1.417.0 ± 1.446.0 ± 9.0
7517.0 ± 1.417.0 ± 1.448.0 ± 7.6
8515.0 ± 2.517.0 ± 1.461.0 ± 11.0
9016.0 ± 1.917.0 ± 1.431.0 ± 3.8
Table 13. SO nanoemulsions’ diameter values (nm).
25 ± 2 °C
Days →171530
Samples ↓
A17.33 ± 3.0640.0 ± 19.0045.0 ± 24.7542.00 ± 16.97
F.8088.33 ± 11.0270.0 ± 11.0071.00 ± 19.873.50 ± 24.75
F.8382.00 ± 28.7949.0 ± 34.3968.5 ± 12.0263.50 ± 20.51
E (50.3.2)174.00 ± 96.2379.33 ± 43.5076.00 ± 8.4958.00 ± 5.66
4 ± 2 °C
A17.33 ± 3.0618.67 ± 1.5315.00 ± 1.4115.00 ± 1.41
F.8088.33 ± 11.02124.33 ± 89.0267.00 ± 12.7377.00 ± 22.63
F.8382.00 ± 28.7948.67 ± 31.0955.50 ± 10.6156.50 ± 9.19
E (50.3.2)174.00 ± 96.2349.33 ± 10.7961.00 ± 0.052.00 ± 2.83
45 ± 2 °C
A17.33 ± 3.0525.00 ± 11.53--
F.8088.33 ± 11.0167.33 ± 17.62130.00 ± 101.82154.50 ± 68.59
F.8382.00 ± 28.7958.67 ± 42.1569.50 ± 14.8584.00 ± 15.56
E (50.3.2)174.00 ± 96.2343.67 ± 15.3179.00 ± 25.45172.00 ± 39.60
Table 14. pH values of nanoemulsions.
25 ± 2 °C
Days →171530
Samples ↓
A6.65 ± 0.095.96 ± 0.805.74 ± 1.006.01 ± 0.27
F.806.15 ± 0.076.11 ± 0.165.83 ± 0.145.87 ± 0.26
F.836.16 ± 0.106.12 ± 0.076.04 ± 0.015.79 ± 0.10
E (50.3.2)6.21 ± 0.046.09 ± 0.166.03 ± 0.015.78 ± 0.21
4 ± 2 °C
A6.65 ± 0.096.73 ± 0.056.68 ± 0.006.63 ± 0.07
F.806.15 ± 0.076.17 ± 0.056.21 ± 0.016.12 ± 0.15
F.836.16 ± 0.116.15 ± 0.076.19 ± 0.016.15 ± 0.04
E (50.3.2)6.16 ± 0.116.15 ± 0.076.19 ± 0.016.15 ± 0.04
45 ± 2 °C
A6.65 ± 0.096.39 ± 0.12--
F.806.15 ± 0.075.67 ± 0.214.78 ± 0.283.89 ± 0.18
F.836.16 ± 0.115.70 ± 0.284.71 ± 0.233.84 ± 0.13
E (50.3.2)6.21 ± 0.045.75 ± 0,244.58 ± 0.503.86 ± 0.04
Table 15. Viscosity values of formula A (cP).
Time (Days) →
Temperature
(±2 °C) ↓
6090120
356.58 ± 1.636.88 ± 0.9218.53 ± 0.39 ###
455.98 ± 1.7413.29 ± 5.13 *17.24 ± 8.73 ###
555.84 ± 1.597.33 ± 2.1821.30 ± 1.62 ###
656.38 ± 2.027.24 ± 3.1118.98 ± 0.95 ###
755.44 ± 0.8013.06 ± 11.46 *18.72 ± 0.55 ###
855.65 ± 1.276.04 ± 1.9513.87 ± 3.81 ##
906.25 ± 1.024.85 ± 0.0520.63 ± 0.84 ###
Legend: * statistical difference with p < 0.05 comparing 60 days and 90 days; ## statistical difference with p < 0.01 comparing 60 days and 120 days; ### statistical difference with p < 0.001 comparing 60 days and 120 days.
Table 16. Ostwald ripening index and linear regression of r3 × time of the nanoemulsions A and F.80.
Sample A
Temperature
(±2 °C)
ω (×10−22 m3s−1)R2 (Linear
Regression)
454.33330.9826
555.83330.9932
650.66670.4286
756.5000.4613
851.33330.9796
9010.6670.8745
Sample F.80
Temperature
(±2 °C)
ω (×10−22 m3s−1)R2 (Linear
Regression)
751.33330.9796
85−5.16670.316
90−7.66670.1159
Table 17. Ostwald ripening index in samples A and F.80 under stability (at 25 ± 2 °C, 4 ± 2 °C, and 45 ± 2 °C) (triplicate).
FormulasTemperature (±2 °C)ω (×10−22 m3 s−1)
A25A
3387.7
b
428.23
C
7806.2
4D
−101.15
e
−13.45
F
67.7
F.8025A
5.2494
b
−0.2657
C
5.4147
4D
0.6549
e
−0.4156
F
−0.1016
45G
0.0077
h
−0.8845
I
−0.5824
Table 18. Theoretical calculation of % DPPH inhibition of formulations.
FormulasOilsOil Content
(%)
μL/mLInhibition (%)Total Inhibition
(%)
ASO10.0100.020.060.0
RO3.030.040.0
F.80SO7.575.0<20.085.0
RO5.05.065.0
Table 19. DPPH inhibition (%) for nanoemulsions A and F.80.
SampleInhibition (%)Mean ± SD.
Control A34.9237.7939.8937.53 ± 1.44
A65.8569.6670.6168.71 ± 1.45 ***£
Control F.8038.1735.3133.0235.50 ± 1.49
F.8067.3768.5167.3767.75 ± 0.38 ***£
Legend: *** the statistical difference between the sample and the control (p < 0.001); £ means there is no statistical difference between the samples.
Table 20. Percentage inhibition of DPPH for components of nanoemulsions.
SampleInhibition (%)Mean ± SD.
Control A34.9237.7939.8937.53 ± 1.44
S. A2.301.150.381.28 ± 0.56
S. A + BHT22.0320.6922.2221.6 ± 0.48
Control F.8038.1735.3133.0235.50 ± 1.49
S. F.8016.4813.039.7713.1 ± 1.94
S. F.80 + BHT20.5023.5622.4122.2 ± 0.89
Preservant6.516.325.176.00 ± 0.42
Legend: S. A—solution of S30 and S40 surfactants; S. A + BHT—solution of S15 and S40 surfactants plus BHT; S. F.80—solution of surfactants S30, SSM, and S54; T3.2 + BHT—solution of surfactants S30, SSM, and S54 plus BHT.
Table 21. Score of HET-CAM methodology for nanoemulsions.
Formula/MPTime (s)ScoreCategory
A93.75 ± 6.243.0 ± 0.0slightly irritating
S. A99.0 ± 9.203.0 ± 0.0slightly irritating
F.80122.3 ± 10.142.0 ± 1.16slightly irritating
S. F.80125.0 ± 7.391.5 ± 1.0slightly irritating
A and F.80 = nanoemulsions; S. A and S. F.80 = surfactants.
Disclaimer/Publisher’s Note: The statements, opinions and data contained in all publications are solely those of the individual author(s) and contributor(s) and not of MDPI and/or the editor(s). MDPI and/or the editor(s) disclaim responsibility for any injury to people or property resulting from any ideas, methods, instructions or products referred to in the content.

