Abstract
Fragrances are among the most common ingredients in cosmetics products. Importantly, exposure to fragrances on a daily basis might pose a health risk, leading to serious effects, such as contact dermatitis or contact eczema. Annex III of the European Union Directive on Cosmetic Products and Gulf Cooperation Council standardization organization (GSO) introduced restrictions for 26 allergens, with their concentrations exceeding 0.001% and 0.01% in leave-on products and rinse-off products, respectively. In the current study, we aimed to expand the scope of the analytical method (EN16274, 2012) to include a broader range of matrices. The optimized method was validated by examining a statistical approach, including selectivity, linearity, accuracy, precision, and measurement of uncertainty. Successfully, the validated data demonstrated acceptable limits according to validation protocols, with linearity showing satisfactory regression of r > 0.995. During method performance assessment, samples were extracted using ultrasound-assisted extraction to extract allergens that yielded relatively high recoveries. Studies on matrices spiked with allergens at different levels showed insignificant bias as an average of 0.07 µg/g. Method performance was assessed by analyzing 140 cosmetics samples, including perfumes, deodorants, aftershave, baby wet wipes, shampoos, lotions, and lip care products. The new optimized analytical method is believed to be a valuable analytical tool to be used in surveillance studies covering a wide range of cosmetic matrices.
1. Introduction
Fragrance substances are widely used in different cosmetics products that emit and diffuse a pleasant and fragrant odor. A single cosmetic product with fragrance may contain between 10 and 300 ingredients. Typically, these ingredients include a blend of alcohol, oils, and other aromatic components. Importantly, essential oils, which are present in the majority of personal care products, from deodorants to facial moisturizers, are common allergens [1]. In particular, the most common allergens encountered in personal care products are 1-methyl-4-(1-methylethenyl)-cyclohexene (limonene), 3,7-dimethyl-1,6-octadien-3-ol (linalool), and phenylmethanol (benzyl alcohol) [2]. Nevertheless, other allergen-causative chemicals exist among cosmetic products, such as preservatives, emulsifiers, UV absorbers, and natural plant ingredients. Owing to a broad range of potential allergenic fragrance cosmetic products, the analytical capability to detect and measure a given allergen chemical poses a multifactorial challenge. From a safety perspective, cosmetic products containing fragrance substances might pose a health risk, such as contact dermatitis or contact eczema. Additionally, allergy symptoms can also occur because of sensitization through the skin. Nevertheless, this reaction is unpredictable and might demonstrate some common mild symptoms of fragrance allergy, such as headaches, skin irritations, itching, and rashes, or it could lead to serious side effects [3]. According to the literature, specific scientific groups have focused their research on fragrance allergens commonly found in many cosmetic products, particularly in natural cosmetics [4].
Legislations regarding the terms fragrance, perfume, and aroma in cosmetics products are not fully unified and labeled on cosmetic containers owing to the resistance by industries claiming that those ingredients are among their manufacturing secrets. Consequently, regulatory bodies have obligated the manufacturer to keep the documentation for each cosmetics product, including each ingredient information for inspection purposes [5].
A list of the 26 fragrance substances classified as potentially allergenic substances (PASs) is introduced into Annex III of the EU Directive on Cosmetic Products and GCC standardization organization (GSO), with their concentrations should not be exceeded 0.001% in leave-on products and 0.01% in rinse-off products [6]. Moreover, the same legislation enforced more restrictions for 26 allergens if the allergens exceeded the maximum allowance limits, which must be written and labeled on the package by the International Union of Pure and Applied Chemistry (IUPAC). The purpose of the restriction is to inform an individual consumer to avoid that ingredient in case of allergic history. In addition to the 26 allergens classified as potentially allergenic substances (PASs), other potential allergens have also been added, namely benzaldehyde, eucalyptol, and safrole.
Exposure to benzaldehyde and safrole may cause skin allergy, which may lead to skin rash [7,8]. Furthermore, exposure to eucalyptol may lead to skin sensitization and eczema [9]. Concerning this, the legislation in Europe has set the maximum limit of benzaldehyde, safrole, and eucalyptol as 0.5%, 0.01%, and 0.1%, respectively [5].
Chemically, allergens are identified and quantified using mainly two different analytical platforms, namely liquid chromatography–mass spectrometry (LCMS) and gas chromatography–mass spectrometry (GCMS). Despite the fact that LCMS is a powerful technique for quantifying and detecting allergens in personal care products, the detection of the 26 allergens is limited due to three factors, namely the electrospray ionization (ESI) cumbersome rules, the complexity of cosmetic samples, and the mobile phase requirements. Consequently, detecting 26 allergens using LCMS would require a direct ESI interface to characterize electron ionization data for a range of small–medium-molecular-weight molecules with different polarities [10]. On the contrary, GCMS is the preferred technique due to its capability to separate and quantify volatile allergens in different cosmetics matrices in an effective and efficient manner. Technically, the fixed electron impact (EI), 70 electron volts, provides easily identified fragments of allergens and their isomers, along with names and structures, using the built-in libraries. Nevertheless, the analysis of allergens by GCMS possesses a challenge regarding the resolution aspect, particularly among the analyte, isomer, and matrix components, which require optimization of selecting the column polarity. Accordingly, the selection of column polarity is a critical step to achieve a reasonable resolution on the analytical columns without ignoring the possibility of overlapping allergens that require the validity of the separation capability and appropriateness [11]. Recent studies have addressed the usage of two-dimensional GC columns, providing a comprehensive technique that quantifies a wide variety of analytes due to the ability to use two different column polarities. However, the limitation of using such a methodology depends on the optimization of carrier gas velocity, adjustment of the split at the interface between both columns, and finally, processing the substantial amount of generated raw data [12].
Collectively, the selection of an appropriate analytical method and careful evaluation of the chemical compositions of the cosmetic product are crucial processes. Furthermore, extraction strategy is an additional factor for successful allergen analysis. Owing to the complexity of cosmetic matrices and the myriad of substances with different physical/chemical properties, a scientist can visualize the plausible challenge that would be encountered during analytical method development and validation. Particularly, allergens extraction techniques vary substantially due to the complexity and solubility of the matrix that facilitates the allergens to be separated at high recoveries. According to recent studies, the extraction of allergens in cosmetics products is classified into four groups depending on the complexity of the matrix [13]. Common documented techniques are liquid–liquid extraction (LLE) [14], ultrasound-assisted extraction (UAE) [15], pressurized liquid extraction PLE [16], and supercritical fluid extraction (SFE) [17]. For instance, the extraction of allergens in perfumes by using a direct dilution is a straightforward methodology, unless that methodology alters the chromatographic system. Traditional extraction of cosmetic samples represented by the LLE and SLE (solid–liquid extraction) is preferred to extract allergens from cosmetics samples [14,18]. However, the major disadvantages of using these traditional methods are that they consume a large volume of solvent and require a long extraction time. For example, one study that used a straightforward LLE methodology has reported a high matrix effect due to significant suppression from analytes [19]. Moreover, another study concluded that the methodology of the extraction might lead to unsatisfactory results, especially for analytes with low volatility and high molecular weights [20]. Consequently, due to the complexity of some cosmetics matrices, a sample may undergo treatment with an evaporation and reconstitution step before the instrument’s injection [21]. In this regard, a UAE is a technique that provides an enhancement in the surface area by allowing greater penetration of the solvent within the samples due to the creation of small bubbles in the solvent [15]. This methodology is recommended for the extraction of allergens in complex cosmetic products while providing high recoveries [22].
The current work aims to expand the scope of the standard method EN16274 [23] in order to develop a method that covers broad cosmetic matrices, including aftershave, deodorant sprays, shampoos, creams, lotions, solid deodorants, wet wipes, and solid lip care products [24]. Within the list of 26 allergen chemicals, one allergen (farnesol) was excluded in the current study, while three potential allergens were included (benzaldehyde, eucalyptol, and safrole), which summed up the total list to 28 allergens. Simultaneously, laboratory quality aspects were implemented that were further supplemented by a simple and rapid extraction technique through applying UAE. The developed method satisfied parameters, including selectivity, linearity, working range, trueness, precision, the limit of detection (LOD), the limit of quantification (LOQ), measurement of uncertainty, matrix effect, and inter-laboratory comparison. Successfully, the performance of the developed method was assessed by testing real commercial samples. Results showed a wide range of allergens, with perfumes being the most scattered matrix that ranged from 40 to 4722 µg/mL. The developed method demonstrated a high potential to be a preferred methodology in market surveillance programs for analyzing allergens in cosmetics.
2. Experimental Section
2.1. Reagents and Materials
The allergen chemicals (Table 1) were purchased from Restek Fragrance Allergen Standards (Kit Number 33105, Bellefonte, PA, USA). Methanol (HPLC grade), acetone, and ethanol absolute were all purchased from Merck (Darmstadt, Germany), and bromobenzene was purchased from Sigma Aldrich (St. Louis, MO, USA).

Table 1.
Summary of validation parameters for 28 allergens. Abbreviations: (a) RRT ratio between standard compared to internal standard RT min. (b) Quantitation ions depend on the EN method, (c) Mean r2 for solvent and matrix. (d) Mean bias percentage for low med and high for both solvent and matrix. (e) Mean RSD percentage for low med and high for both solvent and matrix. (f) Lod and loq based on maximum value against solvent and matrix.
2.2. GCMS Analysis
The allergens were identified and quantified using Agilent Model 5975 series gas chromatography–mass spectrometry (GCMS). Separation was carried out on a DB-5 MS (5%-phenyl)-methylpolysiloxane capillary column (30 m × 0.32 mm, 0.25 µm film thickness) obtained from Agilent J&W GC columns. Helium (purity 99.999%) was used as a carrier gas at a constant column flow of 1.0 mL min−1. The GC oven temperature was programmed as 50 °C for 0.5 min, 3 °C/min to 115 °C for 0 min, 4 °C/min to 170 °C for 0 min, then 35 °C/min to 200 °C, and was held for 5 min, with a total run of 41.77 min. The split mode was used for injection at a ratio of 20:1, and the injector temperature was kept at 250 °C. The injection volume was 1.0 µL, and the temperatures of the transfer line and the ion source were set at 150 and 230 °C, respectively. The identification was carried out by scan monitoring from 35 to 500 amu. In addition, the quantification of 28 allergens was carried out with a single ion monitoring (SIM) for each allergen chemical to minimize the interference effects from other peaks present in the matrix (Table 1).
2.3. Stock and Working Standard Solutions
The allergen kit concentration was 400 µg/mL, while the stock standard was prepared by taking 625 µL and transferring it to 5 mL of methanol to obtain 50 µg/mL; then, the solution was stored below 0 °C. Fresh working standards were prepared for every analysis, along with 10 µg/mL of bromobenzene as an internal standard (IS). For calibration curve plotting, the solutions were prepared by diluting a known volume (0.5 to 5 µg/mL) of stock solution in the corresponding volumetric flasks with methanol.
2.4. Sample Preparation
2.4.1. Sample Extraction
For the evaluation of extraction time, shampoos, creams, lotions, lipsticks, and solid deodorants were evaluated at three time intervals that were tested in a spiked sample at 5.0 µg/mL concentrations in methanol. The solution was immersed in a sonication bath (Elma, Singen, Germany) for 15, 30, and 45 min. The evaluation was examined as a quantitation ion, as mentioned in Table 1. On the contrary, injection samples (perfumes, aftershaves, and deodorant sprays) were diluted without sonication.
2.4.2. Perfumes, Aftershave, and Deodorant Sprays
Perfumes and aftershave were diluted to a 1:100 ratio as 250 µL of sample to 25 mL methanol containing 10 µg/mL of bromobenzene IS. For the deodorant spray sample, a 15 mL glass test tube was placed in an ice bath, and then a deodorant sample was sprayed on the glass to allow the sample to transfer into liquid form. Then, 250 µL of liquid deodorant was transferred to 25 mL methanol containing 10 µg/mL of bromobenzene IS. Then, the solution was transferred to a GC auto-sampler vial for GCMS analysis.
2.4.3. Shampoos, Creams, Lotions, and Solid Deodorants
The extractions for shampoo, creams, lotions, and solid deodorants were conducted following published methodologies [25,26]. Briefly, samples were weighted to the nearest 0.1 g ± 0.01 g in 10 mL of methanol containing 10 µg/mL of bromobenzene IS. After that, the samples were homogenized under a sonication bath (Elma, Singen, Germany) for 30 min at room temperature to facilitate the allergens to the solution, which was then filtered by a 0.22-micron nylon filter (VWR International, Atlanta, GA, USA) and injected into GCMS.
2.4.4. Wet Wipes
In a clean glass container, a sufficient amount of liquid from 5 to 10 wet wipes was collected and mixed for 2 min [27,28]. Then, in a 2 mL glass test tube, a 1.0 mL sample was added to 1.0 mL of methanol containing 10 µg/mL of the IS. Finally, an aliquot of the prepared sample was transferred into the GC auto-sampler vial for GCMS analysis.
2.4.5. Solid Lip Care Products
Samples were weighted to the nearest 0.1 g ± 0.01 g in a 15 mL polypropylene tube (Thermo Scientific, Shanghai, China). Then, 10 mL of methanol containing 10 µg/mL of the IS was added. Then, the sample was heated in a water bath (Elma, Singen, Germany) at 45 °C for 15 min to dissolve and extract the allergens. The extracted solution was then filtered by a 0.22-micron nylon filter (VWR International, Atlanta, GA, USA) and was lastly injected into the GCMS.
3. Validation Study
The proposed analytical methods were optimized and then validated on different cosmetics products regarding selectivity, linearity, accuracy, precision, the limit of detection (LOD), and the limit of quantification (LOQ). The selected ion monitoring (SIM) was used to quantify the concentrations of a specific allergen in cases of co-elution or large interferences due to large variabilities of fragrance compositions among different cosmetics products. Specifically, during the validation, the linearity of GCMS was examined by preparing three different calibration curves with six calibration levels (0.5 to 5 µg/mL) and 10 µg/mL of internal standard. The methodology for linearity of the 28 allergens was recognized by plotting the concentration of individual allergen compounds versus the quantitation ion area ratio between standard and internal standard, and then the linearity was assessed by the F-test equation. The accuracy of the method was examined by evaluating the bias between unspiked and spiked with known concentrations in both solution and samples, while the precision was examined by the percentage of relative standard deviations for lower, medium, and high concentration levels in the working range. Moreover, the lowest possible detectable LOD and quantifiable LOQ with a 95% confidence level were evaluated by examining the slope of the calibration curve and the standard deviation of the response [29].
3.1. Selectivity Assessments
The selectivity of a given method measures its ability to identify only the target compound within the cosmetic matrix. Correspondingly, the methodology of selectivity was assessed using two different approaches: analytically and statistically. The analytical approach was performed on a blank and standard solution, and the results confirmed that no response in the blank solution corresponded to a mixture of allergens standards. On the contrary, the statistical approach was used to examine the selectivity of allergens by interpreting the linearity study data. The methodology included an estimation of a practical t-test against the T critical by using linearity study data, and hence, the parameters of the regression line were used to estimate selectivity. Consequently, the assessment was carried out using two different approaches: the first approach verified the assumption that slope b (Equation (1)) of the overlap line was equal to 1, while the second validated the assumption that intercept point a (Equation (2)) was equal to 0.
Furthermore, the interpretation included evaluating the calculated data against Student’s critical value under the criteria of T critical. The assessment of specificity requires that T observe (Equation (3)) must be lower than T critical, and then the slope of the regression line must be equivalent to one. Additionally, T’ observe (Equation (4)) is lower than T critical, and then the intercept point of the regression line is equivalent to zero.
3.2. Linearity Assessment
The linearity was evaluated by the statistical test that was performed based on the tested calibration curves levels (0.5, 1.0, 2.0, 3.0, 4.0, and 5.0 µg/mL), allowing testing the assumption of non-validity of the linear dynamic range by using a Fisher–Snedecor test. The assumption included the estimation of the mean of p measurements of the concentration levels (Equation (5)), the mean of all the accepted values of n concentration levels (Equation (6)), the mean of all the measurements (Equation (7)), the estimated slope b (Equation (8)), estimated intercept a (Equation (9)), regression value associated with the concentration levels (Equation (10)), and the residual of regressions (Equation (11)).
Moreover, the statistical assessment contained the evaluation of residual error (Equation (12)) and adjustment error (Equation (13)). Then, the difference between the adjustment errors by the experimental error minus the residual error (Equation (14)) was calculated.
Consequently, the Fisher–Snedecor test calculated the experimental value F observed, which was then compared with the limit value: F1-α (n-2, np-n). Furthermore, from the Snedecor law, the value for α used in practice is generally 5%. The calculation of F observed was based on the standard deviation, which was derived from the experimental error (Equation (15)). In addition, the standard deviation of the adjustment error was calculated (Equation (16)). Ideally, the ratio obeys the Fisher–Snedecor law with the degrees of freedom n-2, np-n. The experimental value F observed was calculated using Equation (17). Therefore, according to the concept of linearity, if F observed ≥ F1-α, the assumption of the validity of the linear dynamic range is rejected (with a risk of α error of 5%), while, if Fobs < F1-α, the assumption of the validity of the linear dynamic range is accepted.
3.3. Detection and Quantification Limit
In the current study, the estimation of LOD and LOQ was calculated based on the linearity study using statistical assessment. The assessment depends on the calculation of the calibration function y = a + bx. The parameters included in the calculation account for the slope of regression line (Equation (18)), residual standard deviation (Equation (19)), and standard deviation at the intercept point (Equation (20)). Therefore, the limit of detection and limit of quantification were calculated by the standard deviation at the intercept point by using Equations (21) and (22).
3.4. Examination of Q Values
Generally, the Q values correspond to the identity of fragrance ingredients, which includes characterizing the peak identity by using a single numerical descriptor. The estimation of the Q value provides an advantageous technique to distinguish the specific allergen in the presence of complexity of the cosmetic matrix [24]. Subsequently, according to the identification of allergens by IFRA, for instance, the minimum acceptable value is not less than 90. Accordingly, a Q value between 90 and 100 indicates a positive recognition of the target peak. On the contrary, a lower value indicates that the quantitation ion either belongs to another compound or co-elutes with another analyte [30]. In the current study, the Q values were automatically calculated from the software provided by Agilent. Generally, the calculations of Q values are derived from data generated using Equation (23).
3.5. Matrix Effect Study
Matrix effect study involves the evaluation of the effect of other ingredients in the detection and quantification of allergens. During the development of a given method, it is important to minimize the matrix effect either by using different extraction techniques or by using a clean-up extraction, such as solid-phase extraction (SPE). Practically, the matrix effect should be evaluated at the early stages of method development to evaluate the extraction method. Consequently, cosmetics validation using the chromatographic analytical method recommends evaluating the matrix by either pre-extraction spiking standard or post-extraction technique. The current methodology includes the assessment of selectivity by analyzing 8 to 15 cosmetics samples containing the same analytes in different matrix/concentration combinations according to the validation criteria for chromatographic analytical results obtained from cosmetic products [31]. Usually, the statistical assessment approach is applied to evaluate the percentage of matrix effect by using the slope of linearity. Moreover, the assessment involves performing the same working range in both solutions and matrices, then calculating matrix effect percentage (Equation (24)).
3.6. Uncertainty Assessments
The uncertainties are associated with elements of overall method performance, such as noticeable precision and bias measured, which have a high impact on the evaluation of uncertainty. Importantly, the measurement of uncertainty is associated with laboratory reproducibility and uncertainty of bias (Equation (25)). The estimation of bias uncertainty was based on the evaluation of the recoveries among different concentrations in the working range. The calculations included the mean of measurement bias, uncertainty associated with certificated reference material (CRM), and the number of measurements (Equation (26)), while within laboratory reproducibility, uncertainty was calculated by using the coefficient of variation (CV) for the measurements by using a short-term approach (Equation (27)). The combined uncertainty (CU) is defined as the square root of the linear sum of squared standard uncertainty components (Equation (28)). The expanded uncertainty is defined as the last calculation when estimating uncertainty in measurement by using a coverage factor of 2 at 95% confidence (Equation (29)).
4. Results and Discussion
4.1. Optimization of Chromatographic Conditions
The optimized analytical method was adopted to separate and identify different allergens using a non-polar GC column stationary phase based on the standard method (EN16274, 2012) [23]. The GC oven program was initially set at 80 °C to 280 °C at 10 °C/min. The results demonstrated that d-limonene, eucalyptol, and benzyl alcohol were co-eluted and that the selectivity was unsatisfactory to meet the validation requirements. Subsequently, the oven programs were re-adjusted to separate the suspected allergens at an initial 50 °C for 0.5 min, 3 °C/min to 115 °C for 0 min, 4 °C/min to 170 °C for 0 min, and then 35 °C/min to 200 °C by holding for 5 min. Consequently, the results demonstrated that the resolution and selectivity among d-limonene, eucalyptol, and benzyl alcohol complied with analytical requirements (Figure 1).
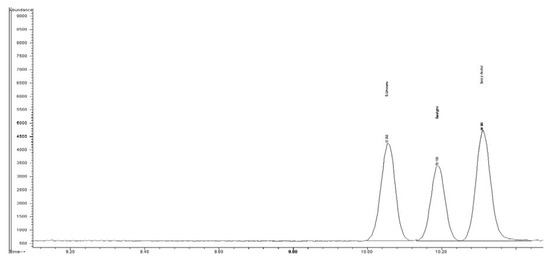
Figure 1.
Total ion current (TIC) for (1) D-limonene RT (10.053 min), (2) eucalyptol (10.189 min), and (3) benzyl alcohol (10.309 min).
4.2. Selection of the Extraction Solvent
Considering that the original method was proposed to extract and quantify the allergens in ready-for-injection cosmetics products using methyl pivalate, the need for an optimal solvent capable of extracting the target analytes in different matrices is inevitable. Owing to the complexity of cosmetic matrices, extraction capability should be accompanied by high efficiency and recovery. Accordingly, for perfume samples, the extraction methodology was evaluated by peak response for 28 allergens using a fixed concentration of 5.0 µg/mL, along with different solutions. The selection of solvents was based on the polarity and the capability of extraction in cosmetics samples. Consequently, the allergens were diluted in different organic solvents, namely acetone, ethanol, and methanol (Figure 2). The extraction was evaluated by preparing 5.0 µg/mL of the 28 allergens and then examining the response of quantitation ions, as described in (Table 1). The results demonstrated that the methanol solvent provided a higher peak response for the 28 allergens depending on the total ion current (TIC) compared to other tested solvents (Figure 2). To this end, methanol was selected for the next steps of method optimizations (Figure 3).
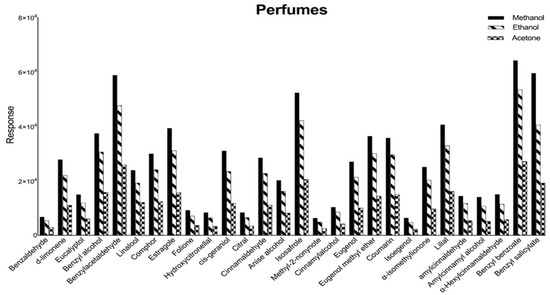
Figure 2.
Effect of different extraction solvents on the 28 allergens’ peak response. x-axis: the 28 allergens, y-axis: quantitation ion response calculated as area.
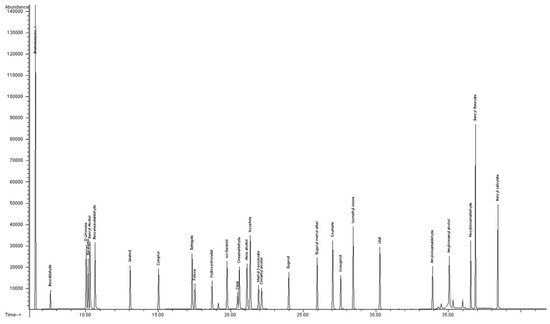
Figure 3.
Standard solution (5 mg/L) of 28 allergens in SIM mode analysis.
4.3. Effect of Extraction Time and Heat
The results demonstrated that the response of the quantitation ion for 28 allergens was influenced by the time interval. Specifically, 15 and 30 min of extraction demonstrated a major difference in response that was obvious for some allergens (e.g., benzyl salicylate) and moderate for others (e.g., cinnamaldehyde) (Figure 4). Nonetheless, the effect of peak response between 30 and 45 min was negligible. Of note, the extraction time of lipstick demonstrated that the sample would require additional parameters to facilitate and immerse a matrix into the solvent. Therefore, UAE combined with heat was employed to evaluate the peak response of the 28 allergens in the specific matrix. The methodology of assessment consisted of examining four different temperature intervals along with fixed time and solvent (Figure 5). The results demonstrated that 45 °C and 55 °C demonstrated the highest extraction efficiency for the target analytes compared to the other two temperatures (25 °C and 35 °C).
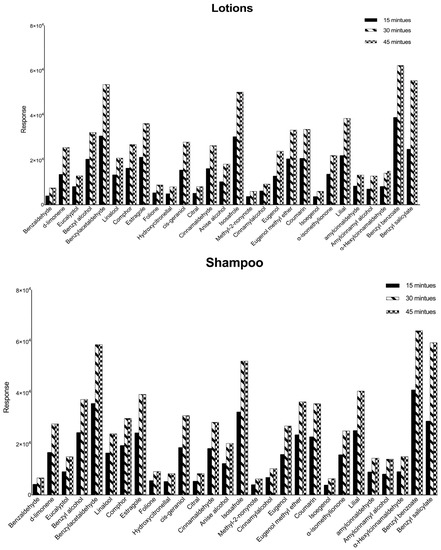
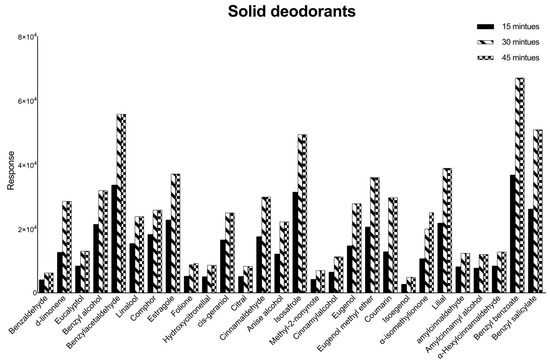
Figure 4.
Effect of different extraction times on the 28 allergens peak response in solid cosmetics samples. x-axis: the 28 allergens, y-axis: quantitation ion response calculated as area.
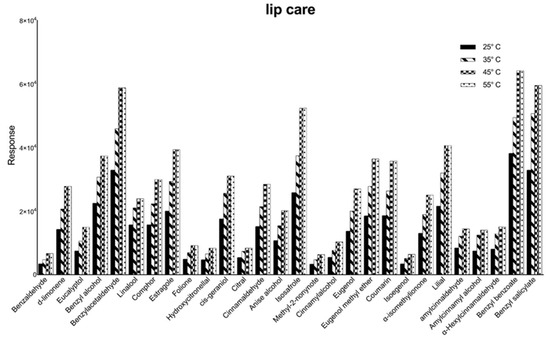
Figure 5.
Effect of different extraction heat temperatures on the 28 allergens peak response. x-axis: the 28 allergens, y-axis: quantitation ion response calculated as area.
4.4. Validation of the Method
Considering the purpose of the current study as expanding the scope of the original method [23], the performed validation process on different cosmetics products included the assessment of selectivity, linearity, accuracy, precision, the limit of detection (LOD), and the limit of quantification (LOQ), and the results are summarized in Table 1.
Results for the linearity assessment that was examined by using two different approaches revealed a regression coefficient (r2) that was higher than 0.995 (Figure 6) for all observed allergens (Table 1). Furthermore, the F-test was evaluated if F observed < F1-α assumption of the validity of linear dynamic range was satisfactory. The results demonstrated that all allergens were lower than the F critical by taking into account the number of calibration levels (n = 6) and the number of total replicates (p = 3) (which were at a point 4, 12) were 3.26 (Table 2). Moreover, these assumptions were tested using a Student’s t-test, which is generally associated with a risk of error of 1%. Evidently, the results demonstrated that all allergens were selective and were verified based on the statement that specificity requires both T’ and T observed to be lower than T critical (Table 2). The T critical value is 8.610, which depends on Student’s test, referring to 4 at 1% adjustment error [p-2; 1%], and p represents six replicates of a concentration level of 0.5 µg/mL. Evidently, the current method proved that the limit of detection and limit of quantification were lower than reported in other studies. For instance, previous studies observed that some allergens were not detected even at higher concentrations (10 µg/mL), namely benzyl salicylate, farnesol, and amyl cinnamal, partially due to their low molecular weights [32,33], while in the current method, the limits of quantification for benzyl salicylate and amyl cinnamal in creams and lotions were 0.4 µg/g, and 0.2 µg/g, respectively. The satisfactory results for the LOQ in the current study prove the advantage of UAE compared to LLE used in the aforementioned studies [34,35].
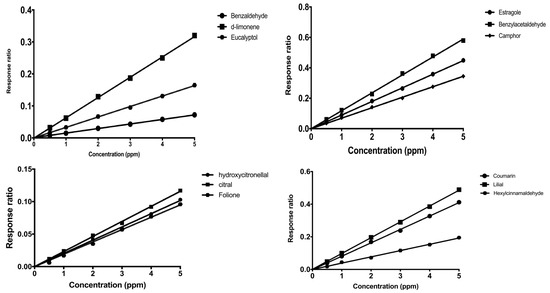
Figure 6.
Calibration curves of some allergens in the pure solvent, x-axis concentration µg/mL (ppm), and y-axis response ratio of allergens over internal standard.
Table 2.
Summary of linearity and selectivity assessments for 28 allergens. Abbreviations: (a) F observed represents a practical value. (b) F critical at 4,12 with 95% confidence. (c) T observed at the intercept point of the regression line is equivalent to one. (d) T’ observed at intercept equivalent to zero. (e) T critical at 4 with 1% error.
It is noteworthy that assessing the Q value for 28 allergens is critical in order to provide improved judgment on selectivity within a given matrix. As described in Section 3.4, a Q value between 90 and 100 indicates a positive recognition of the target peak. The Q value was examined throughout the validation study in both solutions and matrix and covered the range from 0.1 up to 5.0 µg/mL for 28 allergens. The results demonstrated that all observed Q values were more than 90% (Table 3), confirming the identity of allergens within the tested cosmetic matrices.
Table 3.
Comparison of Q value percentage between solvent and different matrices, generated from chem station Agilent 5975 GCMS.
4.5. Evaluation of Matrix Effect and Expanded Uncertainty
It has been observed that the matrix effect and measurement of uncertainty both are critical steps to evaluate the method attributes. In addition, they reflect the validity of results generated by the analytical method according to international standards. The current study provided reasonable matrix effects owing to the enhancement of extraction development and effective assessment of different parameters during validation. The effects of different matrices on the quantification of allergens were not more than 20% (Table 4). Importantly, few published reports demonstrated a higher matrix effect due to significant suppression from analytes. For instance, one study evaluated the matrix effect of cinnamic alcohol in cosmetics and reported it to be as high as 162.5% [19]. Utilizing the UAE extraction methodology, the matrix effect in the current study was substantially reduced to 7% for cinnamic alcohol. Likewise, the matrix effect of anise alcohol was observed to have a cosmetic matrix effect of 35.1% compared to the low effect of 1%, as demonstrated in the current method. The prolonged extraction time, coupled with the UAE strategy, has likely improved the sensitivity by lowering the LOD, thus leading to precise results.
Table 4.
Summary of expanded uncertainties of 28 allergens and the percentage of matrix effect of different cosmetic matrices. Abbreviation: EU expanded uncertainty at k = 2 95% confidence interval.
Furthermore, the expanded measurement of uncertainty for the allergens provided a reasonable error to evaluate the true value of the measurement affected by the repeatability and reducibility of the method. Additionally, the developed method was evaluated by intra-laboratory comparison with an accredited laboratory, and this comparison demonstrated satisfactory results for allergens in a lotion sample.
4.6. Cosmetic Real Sample Analysis
After successful validation, 140 different samples were purchased from Saudi markets in order to examine the performance of the method. The samples were extracted according to the sample type, as described in Section 2.4.1, Section 2.4.2, Section 2.4.3 and Section 2.4.4. The results demonstrated that perfumes contained a higher concentration of allergens compared to other matrices (Table 5 and Table 6). Among the 28 allergens, 5 were the most frequently identified allergens, namely d-limonene ranging from 1045 to 4630 µg/mL, linalool found mainly in perfumes from 383 to 14,464 µg/mL, hydroxycitronellal ranging from <LOQ to 4442 µg/mL, alpha-isomethyl ionone ranging from <LOQ to 6114 µg/mL, and finally, coumarin ranging from <LOQ to 2324 µg/mL. Moreover, major allergens found in the lotion samples were d-limonene, benzyl alcohol, hydroxycitronellal, alpha hexylcinnamaldehyde, and benzyl benzoate ranging from <LOQ to 148.6 µg/g, 4.1 to 1098.5 µg/g, <LOQ to 9552.9 µg/g, <LOQ to 1455 µg/g, and <LOQ to 6906.7 µg/g, respectively. The allergens in shampoo were lower than other matrices, as the allergen with the highest concentration was lilial ranging from <LOQ to 1356.58 µg/g. Among deodorant samples, allergens with the highest concentration were lilial ranging from <LOQ to 13,067.2 µg/g, citral ranging from <LOQ to 3769.84 µg/g, and hydroxycitronellal ranging from <LOQ to 1352.36 µg/g. On the contrary, baby wet wipes contained the lowest concentration of allergens among the other matrices (Table 5). Our results were in agreement with the findings of previous studies, as the concentrations of allergens in wet wipes are considered to be lower compared to other matrices [36]. The major allergens found in lipsticks were d-limonene, citral, and benzyl salicylate ranging from <LOQ to 5621.8 µg/g, <LOQ to 512.42 µg/g, and <LOQ to 224.2 µg/g, respectively.
Table 5.
Summary of 28 allergens concentrations found in perfumes, baby wet wipes, and aftershave. Abbreviation: <LOQ below quantification limit: number of samples.
Table 6.
Summary of 28 allergens concentrations found in deodorants, shampoo, lotions, and lip care. Abbreviation: <LOQ below quantification limit: number of samples.
Additionally, the results demonstrated that benzaldehyde, camphor, benzyl acetaldehyde, estragole, and folione were below the detection limits of the method (Table 1) in all tested cosmetics products. Methyl-2-nonynote was the only detected allergen in deodorants and lip care products, with mean concentrations of 0.72 µg/g and 3.37 µg/g, respectively. Accordingly, in both deodorants and lip care products, the overall concentrations were below the maximum restriction limit in leave-on products, which was 10 µg/g. Furthermore, amyl cinnamaldehyde was the only allergen that was detected and quantified in perfume samples compared to other matrices. The median in perfumes was 170.9 µg/mL, and the range was from <LOQ to 1630 µg/mL. Concerning perfume samples, results in Table 5 demonstrated that linalool was mainly found in perfumes with higher concentrations than other consumer product samples. Comparing the median of concentration in different matrices, the median in perfumes was 3691.4 µg/mL; however, in baby wet wipes, aftershave, lotion, shampoo, and lip care, the median of concentration was 1.1 g/g, 1269 g/g, 90.3 g/g, 63.13 g/g, and <LOQ, respectively (Table 5 and Table 6).
5. Conclusions
A wide variety of fragrance formulations currently available in the market pose a considerable analytical challenge. Since fragranced cosmetics products are frequently used by a large percentage of the population, they may contain ingredients, such as allergens. An optimized analytical method was developed and validated for different cosmetic products. During method development, the issues of co-elution for some allergens and extraction procedures were resolved using scientifically proven practices. Moreover, the accuracy of the method was examined by evaluating the bias between unspiked and spiked samples. Testing commercial samples revealed the existence of some allergens with variable concentrations. Data showed that d-limonene and lilial were predominantly found in multiple matrices. In contrast, eucalyptol and benzyl acetaldehyde were not detected among the samples. The developed method proved to be efficient in detecting and measuring allergens in a broad range of cosmetic matrices, making it a recommended method for market surveillance programs.
Author Contributions
Conceptualization, A.S.A.-M. and F.S.A.; methodology, R.S.A. and O.A.; validation, A.T.B. and A.S.A.-M.; formal analysis, R.S.A.; investigation, A.S.A.-M.; data curation, O.A.; writing—original draft preparation, A.S.A.-M.; writing—review and editing, F.S.A.; supervision, F.S.A. All authors have read and agreed to the published version of the manuscript.
Funding
This research received no funding. The views expressed in this paper are those of authors and do not necessarily reflect those of the SFDA or its stakeholders. Guaranteeing the accuracy and validity of data is a sole responsibility of the research team.
Institutional Review Board Statement
Not applicable.
Informed Consent Statement
Not applicable.
Data Availability Statement
Not applicable.
Conflicts of Interest
The authors declare no conflict of interest.
References
- Mahajan, V.K. Perfumes and associated allergens: A brief review. Cosmoderma 2022, 2, 21. [Google Scholar] [CrossRef]
- Chou, M.; Mikhaylov, D.; Strugar, T.L. Common allergens present in personal care products: Identification, diagnosis, and management. Semin. Cutan. Med. Surg. 2018, 37, 254–262. [Google Scholar] [CrossRef] [PubMed]
- De Groot, A.C. Fragrances: Contact Allergy and Other Adverse Effects. Dermatitis 2020, 31, 13–35. [Google Scholar] [CrossRef] [PubMed]
- Steinemann, A. Fragranced consumer products: Effects on asthmatics. Air Qual. Atmos. Health 2018, 11, 3–9. [Google Scholar] [CrossRef]
- Regulation (EC) No 1223/2009 of the European Parliament and of the Council—EUR-Lex. Available online: https://eur-lex.europa.eu/legal-content/en/LSU/?uri=CELEX:32009R1223 (accessed on 17 December 2022).
- GSO 1943:2021; Cosmetic Products–Safety Requirements of Cosmetics and Personal Care Products. GCC Standardization Organization: Riyadh, Saudi Arabia, 2021. Available online: https://www.gso.org.sa/store/standards/GSO:781231/GSO%201943:2021?lang=en (accessed on 1 July 2021).
- Api, A.M.; Belsito, D.; Biserta, S.; Botelho, D.; Bruze, M.; Burton, G.A., Jr.; Buschmann, J.; Cancellieri, M.A.; Dagli, M.L.; Date, M.; et al. RIFM fragrance ingredient safety assessment, benzaldehyde, CAS Registry Number 100-52-7. Food Chem. Toxicol. 2019, 134, 110878. [Google Scholar] [CrossRef]
- Gad, S.C.; Pham, T. Safrole. In Encyclopedia of Toxicology, 3rd ed.; Wexler, P., Ed.; Academic Press: Cambridge, MA, USA, 2014; pp. 205–207. [Google Scholar] [CrossRef]
- Api, A.M.; Belsito, D.; Botelho, D.; Bruze, M.; Burton, G.A., Jr.; Buschmann, J.; Cancellieri, M.A.; Dagli, M.L.; Date, M.; Dekant, W.; et al. RIFM fragrance ingredient safety assessment, eucalyptol, CAS Registry Number 470-82-6. Food Chem. Toxicol. 2022, 159, 112720. [Google Scholar] [CrossRef]
- Famiglini, G.; Termopoli, V.; Palma, P.; Capriotti, F.; Cappiello, A. Rapid LC-MS method for the detection of common fragrances in personal care products without sample preparation. Electrophoresis 2014, 35, 1339–1345. [Google Scholar] [CrossRef]
- The International Fragrance Association Analytical Working Group. Analytical Method to Quantify 57 Suspected Allergens (and Isomers) in Ready to Inject Fragrance Materials by Gas Chromatography and Mass Spectrometry. Available online: https://ifrafragrance.org/docs/default-source/guidelines/23754_gd_2017_04_11_ifra_analytical_method_to_quantify_57_suspected_allergens_(and_isomers)_in_ready_to_inject_fragrance_materials_by_gc-ms-(3).pdf?sfvrsn=ad55ac1_6 (accessed on 15 November 2016).
- Belhassen, E.; Bressanello, D.; Merle, P.; Raynaud, E.; Bicchi, C.; Chaintreau, A.; Cordero, C. Routine quantification of 54 allergens in fragrances using comprehensive two-dimensional gas chromatography-quadrupole mass spectrometry with dual parallel secondary columns. Part I: Method development. Flavour Fragr. J. 2018, 33, 63–74. [Google Scholar] [CrossRef]
- Celeiro, M.; Garcia-Jares, C.; Llompart, M.; Lores, M. Recent Advances in Sample Preparation for Cosmetics and Personal Care Products Analysis. Molecules 2021, 26, 4900. [Google Scholar] [CrossRef]
- Sánchez-Prado, L.; Llompart, M.; Lamas, J.P.; Garcia-Jares, C.; Lores, M. Multicomponent analytical methodology to control phthalates, synthetic musks, fragrance allergens and preservatives in perfumes. Talanta 2011, 85, 370–379. [Google Scholar] [CrossRef]
- Pérez-Outeiral, J.; Millán, E.; Garcia-Arrona, R. Ultrasound-assisted emulsification microextraction coupled with high-performance liquid chromatography for the simultaneous determination of fragrance allergens in cosmetics and water. J. Sep. Sci. 2015, 38, 1561–1569. [Google Scholar] [CrossRef]
- Lamas, J.P.; Sanchez-Prado, L.; Garcia-Jares, C.; Lores, M.; Llompart, M. Development of a solid phase dispersion-pressurized liquid extraction method for the analysis of suspected fragrance allergens in leave-on cosmetics. J. Chromatogr. A 2010, 1217, 8087–8094. [Google Scholar] [CrossRef]
- Capuzzo, A.; Maffei, M.E.; Occhipinti, A. Supercritical Fluid Extraction of Plant Flavors and Fragrances. Molecules 2013, 18, 7194–7238. [Google Scholar] [CrossRef]
- Hou, X.; Wang, L.; Tang, X.; Xiong, C.; Guo, Y.; Liu, X. Application of a β-cyclodextrin/graphene oxide-modified fiber for solid-phase microextraction of six fragrance allergens in personal products. Analyst 2015, 140, 6727–6735. [Google Scholar] [CrossRef]
- Lu, C.H.; Fang, M.C.; Chen, Y.Z.; Huang, S.C.; Wang, D.Y. Quantitative analysis of fragrance allergens in various matrixes of cosmetics by liquideliquid extraction and GCeMS. J. Food Drug Anal. 2021, 29, 700–708. [Google Scholar] [CrossRef]
- Desmedt, B.; Canfyn, M.; Pype, M.; Baudewyns, S.; Hanot, V.; Courselle, P.; De Beer, J.O.; Rogiers, V.; De Paepe, K.; Deconinck, E. HS–GC–MS method for the analysis of fragrance allergens in complex cosmetic matrices. Talanta 2015, 131, 444–451. [Google Scholar] [CrossRef]
- Gimeno, P.; Maggio, A.F.; Bousquet, C.; Quoirez, A.; Civade, C.; Bonnet, P.A. Analytical method for the identification and assay of 12 phthalates in cosmetic products: Application of the ISO 12787 international standard “Cosmetics–Analytical methods–Validation criteria for analytical results using chromatographic techniques”. J. Chromatogr. A 2012, 1253, 144–153. [Google Scholar] [CrossRef]
- Lores, M.; Celeiro, M.; Rubio, L.; Llompart, M.; Garcia-Jares, C. Extreme cosmetics and borderline products: An analytical-based survey of European regulation compliance. Anal. Bioanal. Chem. 2018, 410, 7085–7102. [Google Scholar] [CrossRef]
- EN 16274:2012; Methods for Analysis of Allergens—Quantification of Suspected Fragrance Allergens. European Committee for Standardization: Brussels, Belgium, 2012. Available online: https://standards.iteh.ai/catalog/standards/cen/83fc0d7f-746a-46e9-8019-c8a703a3fcd2/en-16274-2012 (accessed on 31 December 2012).
- Begnaud, F.; Chaintreau, A. Good quantification practices of flavours and fragrances by mass spectrometry. Philos. Trans. R. Soc. A Math. Phys. Eng. Sci. 2016, 374, 20150365. [Google Scholar] [CrossRef]
- Rastogi, S.C.; Johansen, J.D.; Menné, T.; Frosch, P.; Bruze, M.; Andersen, K.E.; Lepoittevin, J.P.; Wakelin, S.; White, I.R. Contents of fragrance allergens in children’s cosmetics and cosmetic-toys. Contact Dermat. 1999, 41, 84–88. [Google Scholar] [CrossRef]
- Lamas, J.P.; Sanchez-Prado, L.; Garcia-Jares, C.; Llompart, M. Determination of fragrance allergens in indoor air by active sampling followed by ultrasound-assisted solvent extraction and gas chromatography–mass spectrometry. J. Chromatogr. A 2010, 1217, 1882–1890. [Google Scholar] [CrossRef] [PubMed]
- Heo, J.; Kim, U.; Oh, J.-E. Simultaneous quantitative analysis of four isothiazolinones and 3-iodo-2-propynyl butyl carbamate present in hygienic consumer products. Environ. Eng. Res. 2019, 24, 137–143. [Google Scholar] [CrossRef]
- Rocha, B.; Bocato, M.; Latorraca, E.; Ximenez, J.P.; Barbosa, F., Jr. A Survey of Parabens in Commercial Baby Wipes from Brazil and Estimation of Daily Exposure. Quim. Nova 2020, 43, 442–446. [Google Scholar] [CrossRef]
- Araujo, P. Key aspects of analytical method validation and linearity evaluation. J. Chromatogr. B 2009, 877, 2224–2234. [Google Scholar] [CrossRef]
- Debonneville, C.; Thomé, M.-A.; Chaintreau, A. Hyphenation of Quadrupole MS to GC and Comprehensive Two-Dimensional GC for the Analysis of Suspected Allergens: Review and Improvement. J. Chromatogr. Sci. 2004, 42, 450–455. [Google Scholar] [CrossRef]
- ISO 12787:2011; Cosmetics—Analytical methods—Validation Criteria for Analytical Results Using Chromatographic Techniques. ISO: Geneva, Switzerland, 2011. Available online: https://www.iso.org/standard/51709.html (accessed on 1 December 2011).
- Chaintreau, A.; Joulain, D.; Marin, C.; Schmidt, C.-O.; Vey, M. GC-MS Quantitation of Fragrance Compounds Suspected To Cause Skin Reactions. 1. J. Agric. Food Chem. 2003, 51, 6398–6403. [Google Scholar] [CrossRef]
- Del Nogal Sánchez, M.; Pérez-Pavón, J.L.; Moreno Cordero, B. Determination of suspected allergens in cosmetic products by headspace-programmed temperature vaporization–fast gas chromatography–quadrupole mass spectrometry. Anal. Bioanal. Chem. 2010, 397, 2579–2591. [Google Scholar] [CrossRef]
- Sanía, A.C.; Carreño, A.S. Analysis of Cosmetic Products. Analysis of Cosmetic Products; Elsevier: Amsterdam, The Netherlands, 2007. [Google Scholar] [CrossRef]
- Chisvert, A.; López-Nogueroles, M.; Miralles, P.; Salvador, A. Perfumes in Cosmetics: Regulatory Aspects and Analytical Methods. In Analysis of Cosmetic Products, 2nd ed.; Salvador, A., Chisvert, A., Eds.; Elsevier: Amsterdam, The Netherlands, 2018; Chapter 10; pp. 225–248. [Google Scholar] [CrossRef]
- Chen, J.; Yi, Z.; Yin, J.; Dong, S.; Wang, L.; Li, Y. Determination of Fragrance Allergens in Paper Personal Care Products by Headspace (HS) Solid-Phase Microextraction (SPME) Gas Chromatography-Mass Spectrometry (GC-MS) with Response Surface Methodology (RSM) Optimization. Anal. Lett. 2023, 56, 1868–1883. [Google Scholar] [CrossRef]


Disclaimer/Publisher’s Note: The statements, opinions and data contained in all publications are solely those of the individual author(s) and contributor(s) and not of MDPI and/or the editor(s). MDPI and/or the editor(s) disclaim responsibility for any injury to people or property resulting from any ideas, methods, instructions or products referred to in the content. |
© 2023 by the authors. Licensee MDPI, Basel, Switzerland. This article is an open access article distributed under the terms and conditions of the Creative Commons Attribution (CC BY) license (https://creativecommons.org/licenses/by/4.0/).