Article

Impact of Land-Use/Land-Cover Change on Drinking Water Ecosystem Services in Wami River Basin, Tanzania

1
Institute for Integrated Management of Material Fluxes and of Resources (UNU-FLORES), United Nations University, Ammonstrasse 74, 01067 Dresden, Germany
2
Institute for Cartography, Technische Universität Dresden, 01062 Dresden, Germany
3
School of Material, Energy, Water and Environmental Science (MEWES), Nelson Mandela African Institute of Science Technology (NM-AIST), P.O. Box 447 Arusha, Tanzania
4
Global Programs, Penn State University, State College, PA 16801, USA
*
Author to whom correspondence should be addressed.
Resources 2020, 9(4), 37; https://doi.org/10.3390/resources9040037
Submission received: 1 February 2020 / Revised: 3 March 2020 / Accepted: 31 March 2020 / Published: 2 April 2020

Abstract

:
Land-use/land-cover changes are considered the dominant form of anthropogenic pressure on the environment, causing changes in ecosystem service patterns and affecting water supply services. Using the spatial econometric technique, we analysed the impact of land-use/land-cover change on water ecosystem services for domestic use upstream and downstream of the Wami River Basin. The results in terms of land-use/land-cover classes during the study period (2011–2016) indicate that cultivated land showed maximum positive changes in both sub-catchments, while bushland and woodland showed maximum negative changes upstream and downstream. The results showed that bushland, woodland, cultivated land, and grassland were significantly correlated with water point characteristics in both sub-catchments. For functionality characteristics, a significant effect was observed in bushland and grassland upstream and downstream, respectively, while sufficient water was found in woodland upstream and grassland downstream. Moreover, bushland was observed to have a significant number of water points with poor quality of water upstream, and a substantial number of water points with good quality of water were found in grassland downstream. We found that all measured land-use/land-cover changes and water point characteristic correlations were statistically significant; therefore, we concluded that land-use/land-cover change affects the water ecosystem in the basin. These results could facilitate decision-making and development of related policies and might support finding sustainable strategies for water ecosystem services for domestic use.

1. Introduction

In recent years, substantial changes in land-use/land-cover (LU/LC) have taken place due to human activities [1,2]. LU/LC change linked to human factors, such as agricultural loss, overexploitation of forests, and urbanisation, has caused natural resource shortages, including widespread and permanent losses of biodiversity across the sphere [3,4]. Population growth continues to modify the landscape and natural lands through socio-ecological and socio-economic phenomena at extremely high rates, causing effects of LU/LC on ecosystem services [5,6,7]. However, despite the increasing awareness that human well-being strongly depends on natural ecosystems [8], many environments continue to face unprecedented stress that might result in their conversion and degradation, thus affecting the provisioning of ecosystem services for both present and future generations [9]. Since the late 90s, ecosystem services have become a central issue for researchers and decision-makers, especially after the Millennium Ecosystem Assessment report [10] addressed the gap between natural protection and human welfare [11]. Although consequences of LU/LC changes have been studied at a global level, these studies have not captured critical LULC changes occurring at the basin scale [12,13] including Wami River Basin.
The Wami River Basin is a significant area, due to its different benefits to a diverse range of shareholders [14], while LU/LC changes could be severe for the Wami river system, given its primary role in providing water, food and livelihoods [15]. This change could cause several variations in services and roles, consequently causing degradation in provisioning ecosystem services from the natural resources of the Wami River Basin [16]. As the population increases and consumption patterns vary, additional land will be needed for agricultural production and living space [17]. The challenge facing society as a whole is deciding in what way to meet individuals’ growing demands for food, living space, fuel, and other supplies, while sustaining ecosystem services in LU/LC variations [18,19,20]. Approximately 15 types of universal ecosystem services are declining, including water purification, erosion regulation and natural hazard regulation, and this trend could increase in the future [10]. Ecosystem services benefit individuals, indirectly or directly, by providing goods, well-being, and growth of economic activities [10,21,22]. The provision of water for domestic use has been an ecosystem service that can be directly associated with increasing population, in that the water supply has been steadily decreasing [23].
Since the mid-20th century, human activities have altered ecosystems in substantial ways [10], and water stress has increased due to water pollution, withdrawal, and contamination [24,25,26]. LU/LC changes are regarded as the dominant form of anthropogenic stress on the environment [27], causing changes in ecosystem service patterns affecting the water supply [10,28,29]. Sustainable land management plans could ensure the constant provision of ecosystem services. Studies have showed that the effects of LU/LC on ecosystem services differ temporally and spatially [22,30,31,32,33]. Water supply services are susceptible since they are exposed to severe natural stresses related to interactions among biophysical factors, which considerably increase their heterogeneity from a temporal and spatial perspective [34,35]. Several relatively static influences (soil, topography, and geology) and dynamic influences (land use, land management, and climate) interact to control water access and how it will be distributed to competing users [23]. The presence of human activities’ pressure makes these services more vulnerable, leading to extreme variation in the frequency of accessibility [36]. Water yield is challenging to value and measure, but there is a need to account for the changing availability of water from the basin across various spatial scales and throughout long-time perspectives, to guarantee sustainable usage [23,37,38,39].
Water ecosystem services for drinking are intensely affected by the amount and quality of water delivered to the basin, and how it is divided between the processes of surface water runoff, evaporation, groundwater recharge, and transpiration [40]. Therefore, understanding the consequences of LU/LC on the water ecosystem services for drinking is vital for understanding the significance of decisions and policies, and might support the development of appropriate plans [38]. Further, land use management and plan assessment requires in-depth information about the different effects on ecosystem services [41,42]. Therefore, this study uses the spatial econometrics approach to analyse the impact of LU/LC change on water ecosystem services for domestic use in the Wami River Basin, in order to provide relevant policy recommendations related to water supply services.

2. Materials and Methods

2.1. Study Area

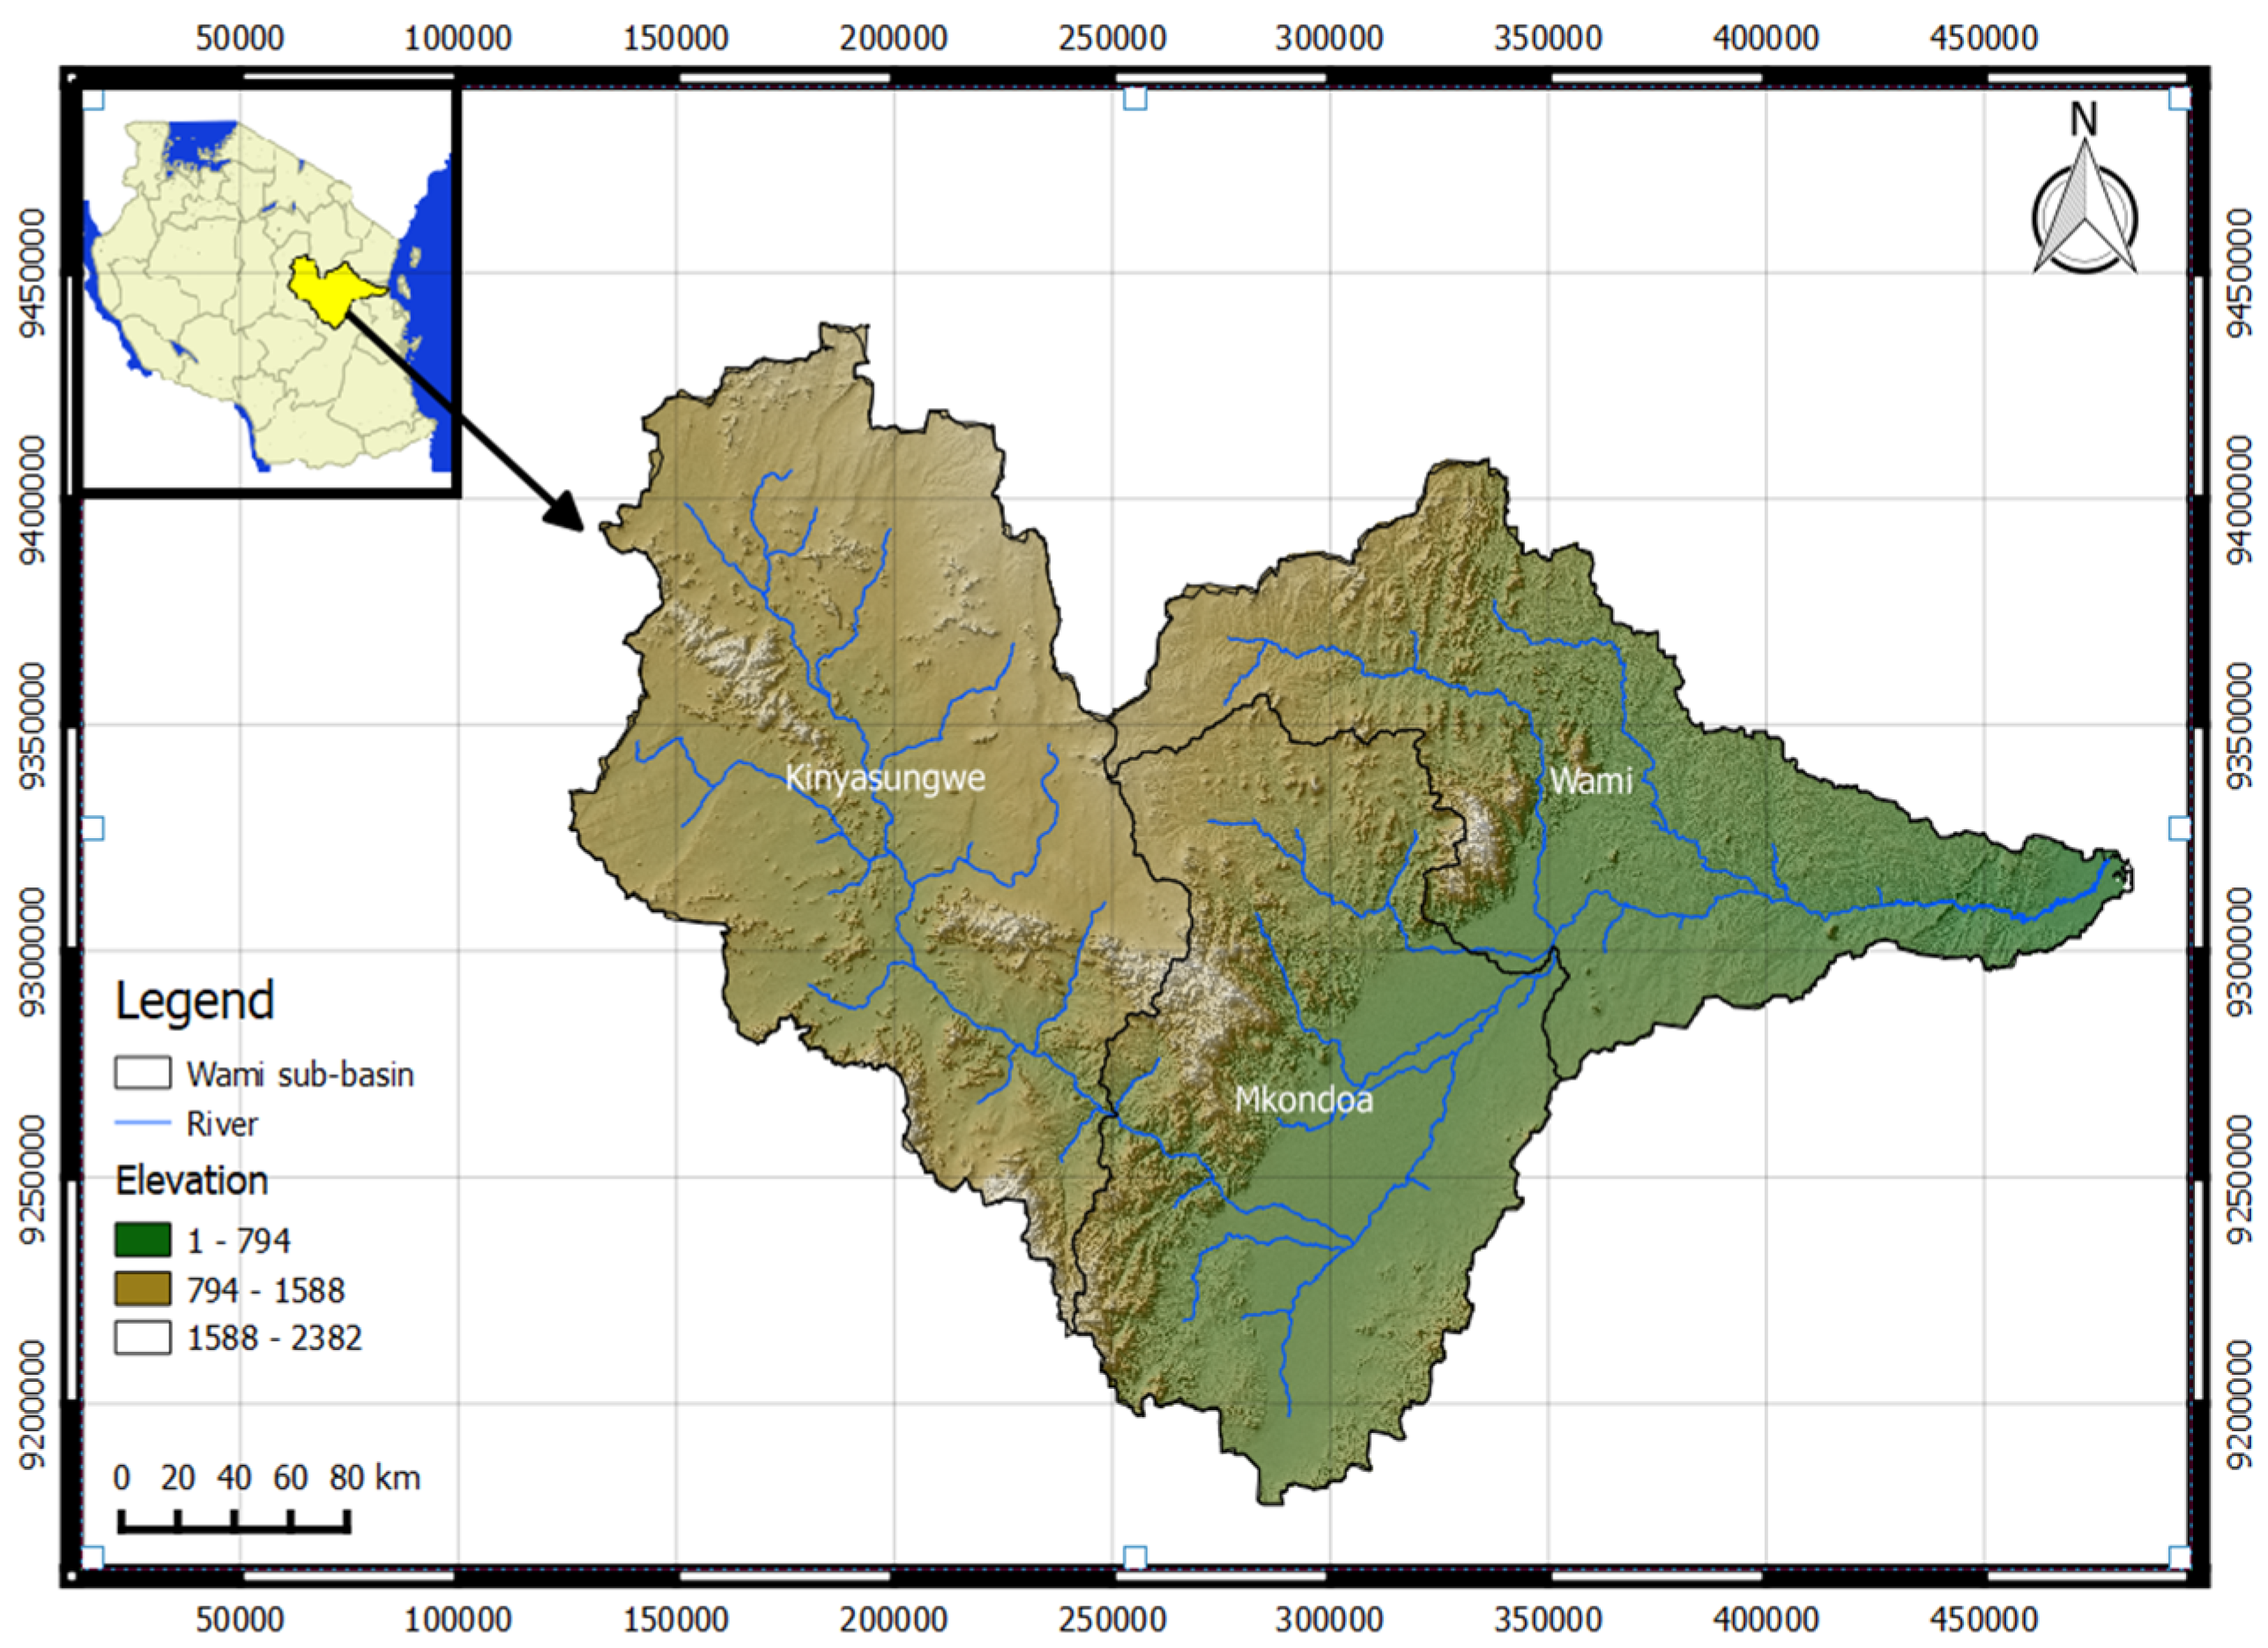
The study location of the Wami River Basin (Figure 1) ranges between 5°–7° S and 36°–39° E, covering the semi-arid areas of central Tanzania. It covers 41,167 km2 and is characterised by humid inland swamps linked to the Indian Ocean. The basin topographically ranges from 2–2370 m above sea level. Kinyasungwe, Mkondoa, and Wami are the three major sub-catchments forming the Wami River Catchment, receiving an average rainfall of 550–1000 mm per annum [43]. The lowlands are warm, whereas the highlands are cold. The Wami River Catchment is comprised of five basin draining zones—(i) upland plains, (ii) mountain torrents, (iii) inland plains, (iv) rejuvenated cascades, and (v) coastal plains—which characterise the topography of the study area. The river’s path varies: a relatively straight and confined pattern is observed in elevated and mountainous areas, but a meandering system dominates the coastal and inland plains, interfered with in few areas by minor cascades at certain gradient levels [44]. On the other hand, a cascade zone can be seen near Wami at Mandera, upstream from the bridge crossing on the Chalinze–Segera highway [45].

2.2. Spatial Regression Analysis

In this study, the spatial regression method was used to examine the impact of LU/LC change on the water supply service accessibility at Kinyasungwe sub-catchment (upstream) and Wami sub-catchment (downstream). LU/LC change results were adopted from Twisa and Buchroithner, 2019 (Table 1). The water points data were extracted from the Water Point Mapping System (WPMS), which is managed by the Ministry of Water, Tanzania, on August 2016, and only water points from surface water sources were considered and information regarding three water point typologies (functionality, water quantity, and water quality) selected, including population data (Table 2). The software packages Quantum Geographic Information System (QGIS 2.18) and GeoDa were employed at different stages of analysis.
Ordinary least squares (OLS) regression was used to examine the correlation between water points and LU/LC types surrounding the water points. However, the OLS regression model output can be biased if heterogeneity and autocorrelation effects are present [46]. Statistical tests, including the Breusch–Pagan (BP) test and Moran I test, were executed to detect the heterogeneity and autocorrelation effects of the spatial data. Based on the test results, the decision was made as to whether it was necessary to run the spatial lag and the spatial error regression models. The test results were statistically significant, indicating spatial autocorrelation in residues. Therefore, there was a need to run the spatial error and spatial lag regression models.
In this analysis, the water point data, including population information, were integrated with a LU/LC map, followed by spatial correlation analysis. The water point shapefile obtained was overlaid with the 2011 and 2016 LU/LC cover maps. The 400 m (according to Ministry of Water, Tanzania) buffers were generated using the buffer(s) options, followed by intersection analysis between LU/LC and water points at the 400 m buffer zone using the intersection option. This process integrated the water points and LU/LC in a single shapefile, and later imported it for spatial regression analysis between the populations served by the water points and LULC.

3. Results

3.1. Accuracy Assessment

Accuracy assessment classifications were undertaken for both sub-catchments, and the producer accuracy (PA), user accuracy (UA), overall accuracy (OA), and the Kappa coefficients (KC) for 2011 and 2016 are displayed in Table 3. The overall accuracy ranged from 91% to 98%, with Kappa indices ranging from 0.76 to 0.95. According to Mango [47], this overall accuracy is acceptable; therefore, this suggests that the LU/LC category accuracy is within the satisfactory threshold. These results provide a significant verification for the subsequent analysis of LU/LC changes.

3.2. Kinyasungwe Sub-Catchment

3.2.1. LU/LC Change Analysis

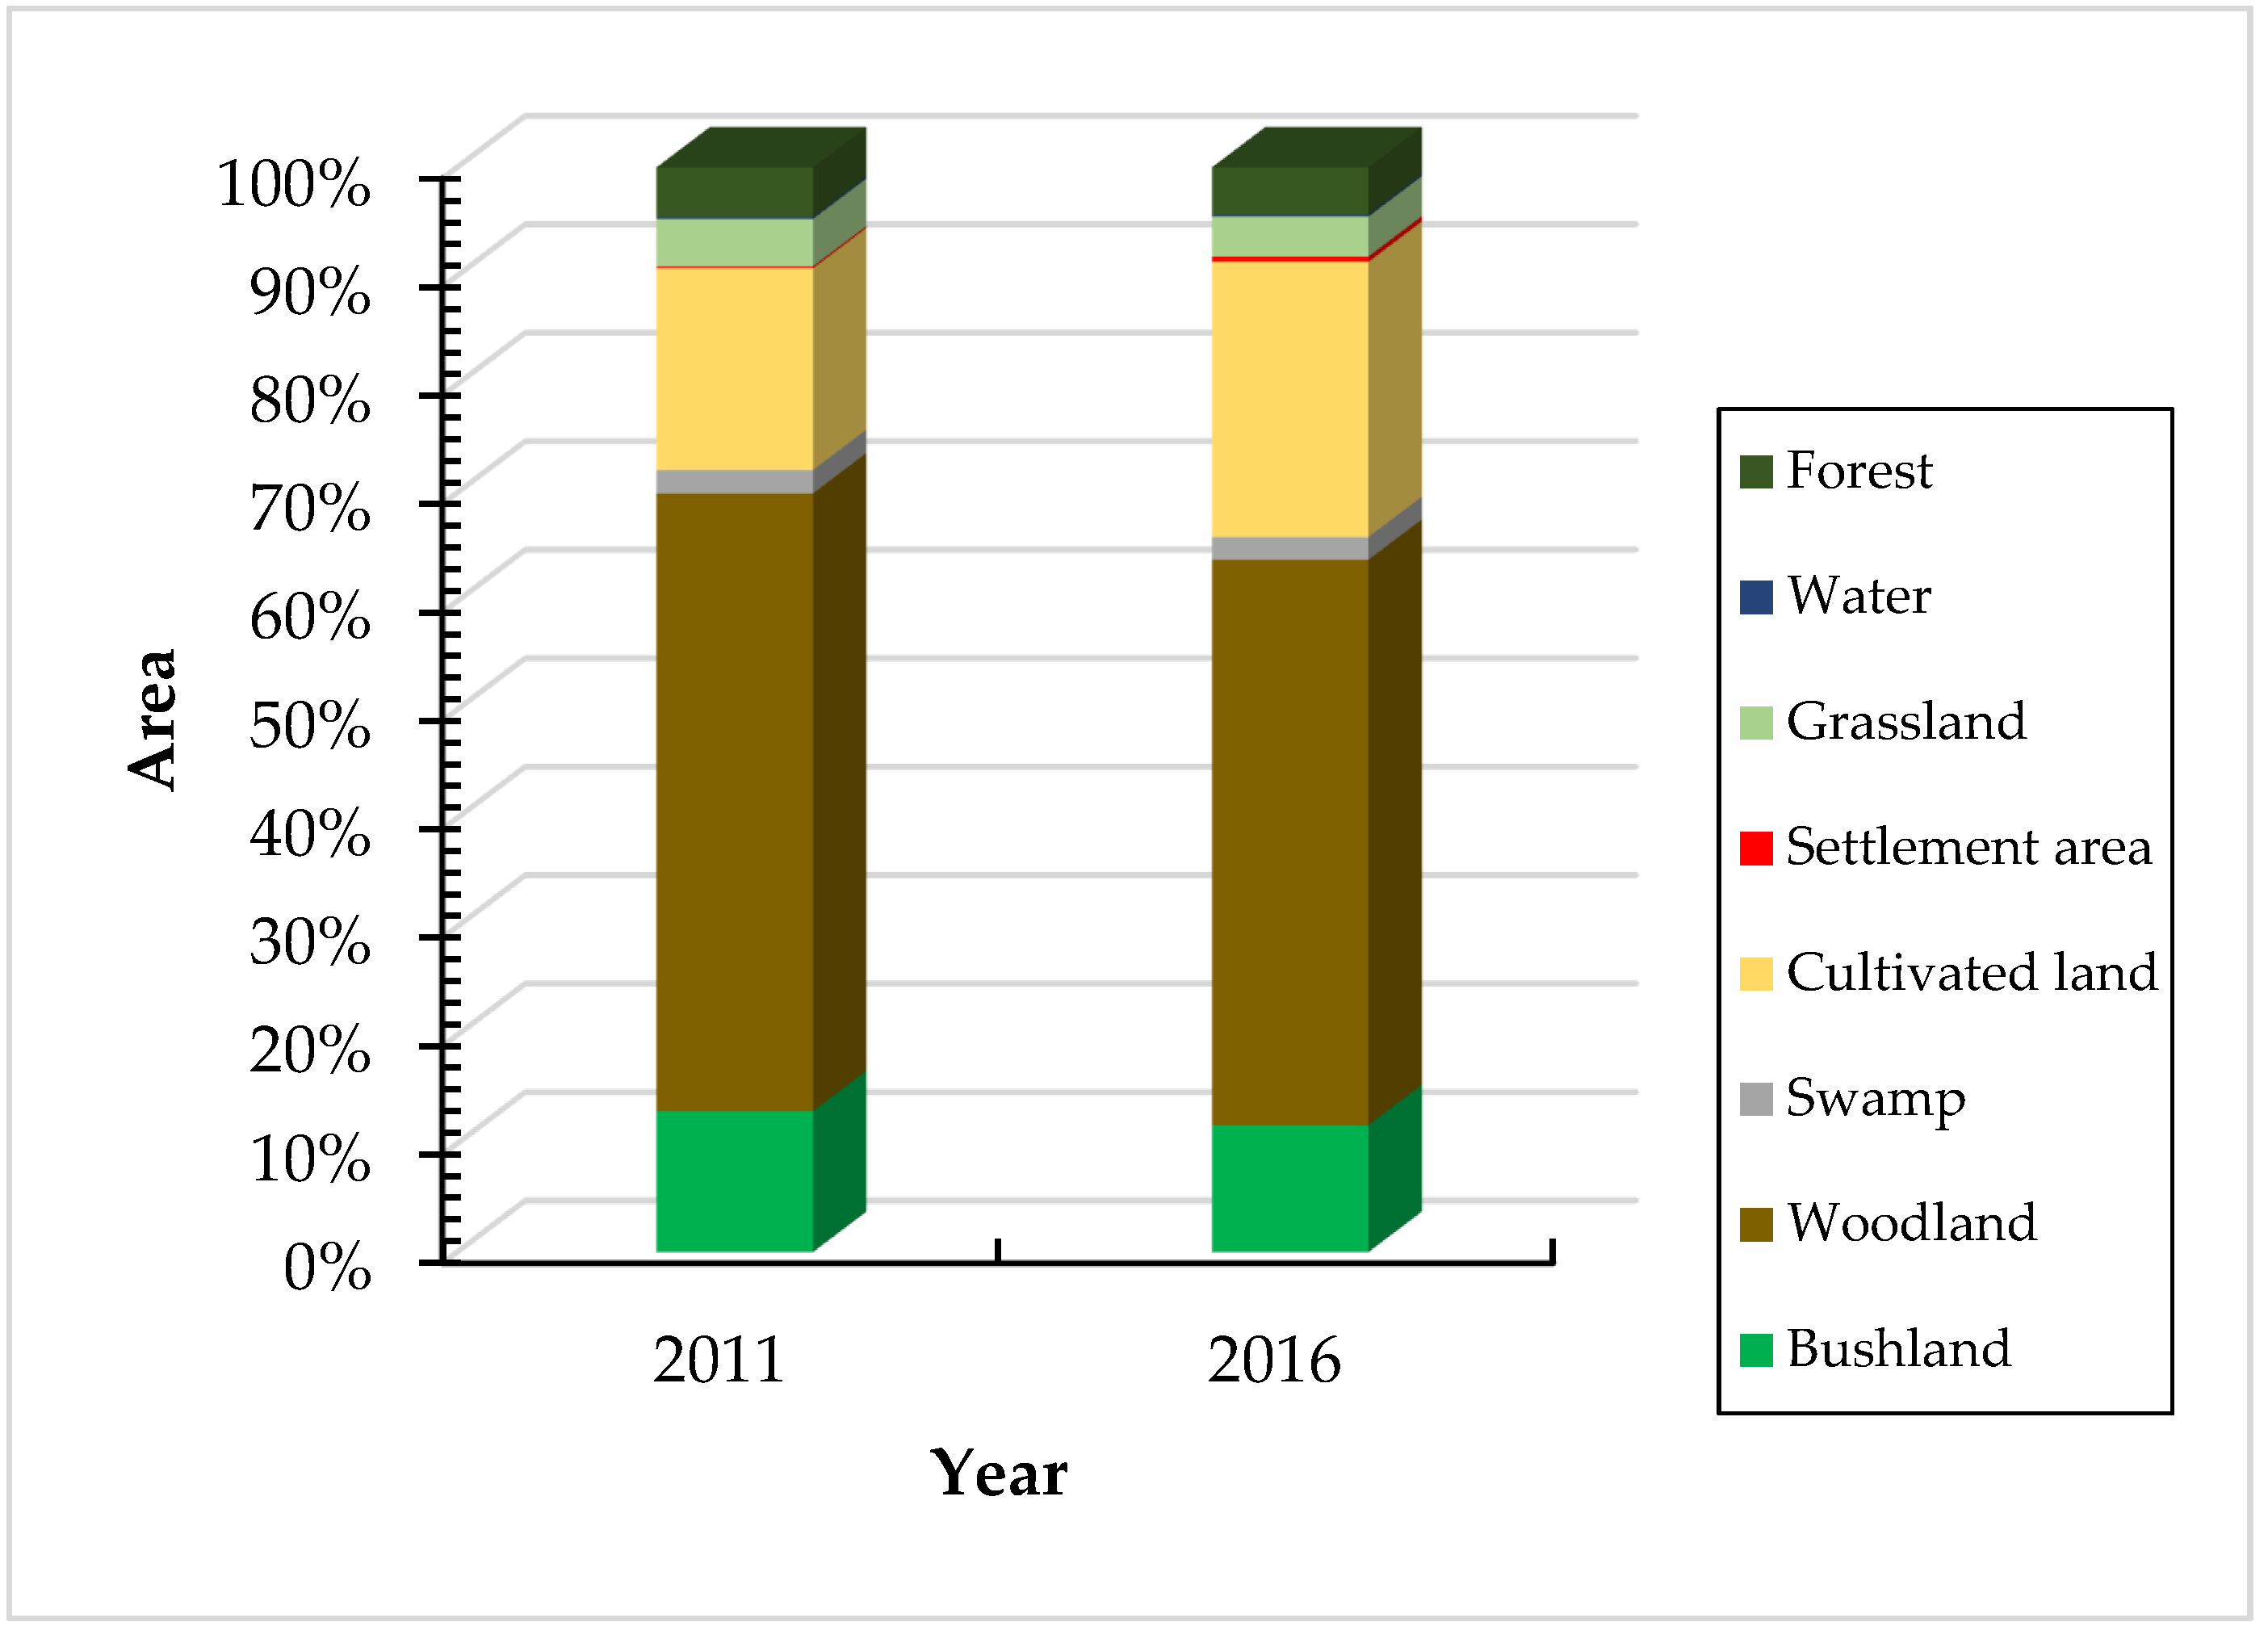
LU/LC classes for the Kinyasungwe sub-catchment from 2011–2016 were analysed from Landsat images, and the results are presented in Table 4 and Figure 2. Ten major LU/LC classes were identified: bushland, swamp, woodland, cultivated land, water, settlement area, forest, grassland, airfield, and open land. As revealed in Table 4, woodland, bushland, and cultivated land were discovered to be the dominant LU/LC categories in 2011 and 2016. Cultivated land showed the maximum positive changes, covering areas of 3210.88 km2 (19.16%) in 2011 and 3763.79 km2 (22.45%) in 2016, while forest showed minimal negative changes, covering an area of 64.58 km2 (0.39%) in 2011 and 56.89 km2 (0.34%) in 2016. Bushland and grassland were observed to decrease during the study period from 4646.94 km2 (27.72%) and 3168.52 km2 (18.9) in 2011 to 4320.24 km2 (25.77%) and 2965.09 km2 (17.69%) in 2016, respectively. Further, the woodland category covered an area of 4770.86 km2 (28.46%) and 4705.63 km2 (28.07) in 2011 and 2016, respectively, showing a decrease in coverage. Swamp was found to cover an area of 775.95 km2 (4.63%) in 2011 and decrease to 754.23 km2 (4.50%) in 2016. Settlement area and water were found to cover corresponding areas of 108.34 km2 (0.65%) and 13.88 km2 (0.0.08%) in 2011, which increased to 169.11 km2 (1.01%) and 24.96 km2 (0.15%) in 2016.
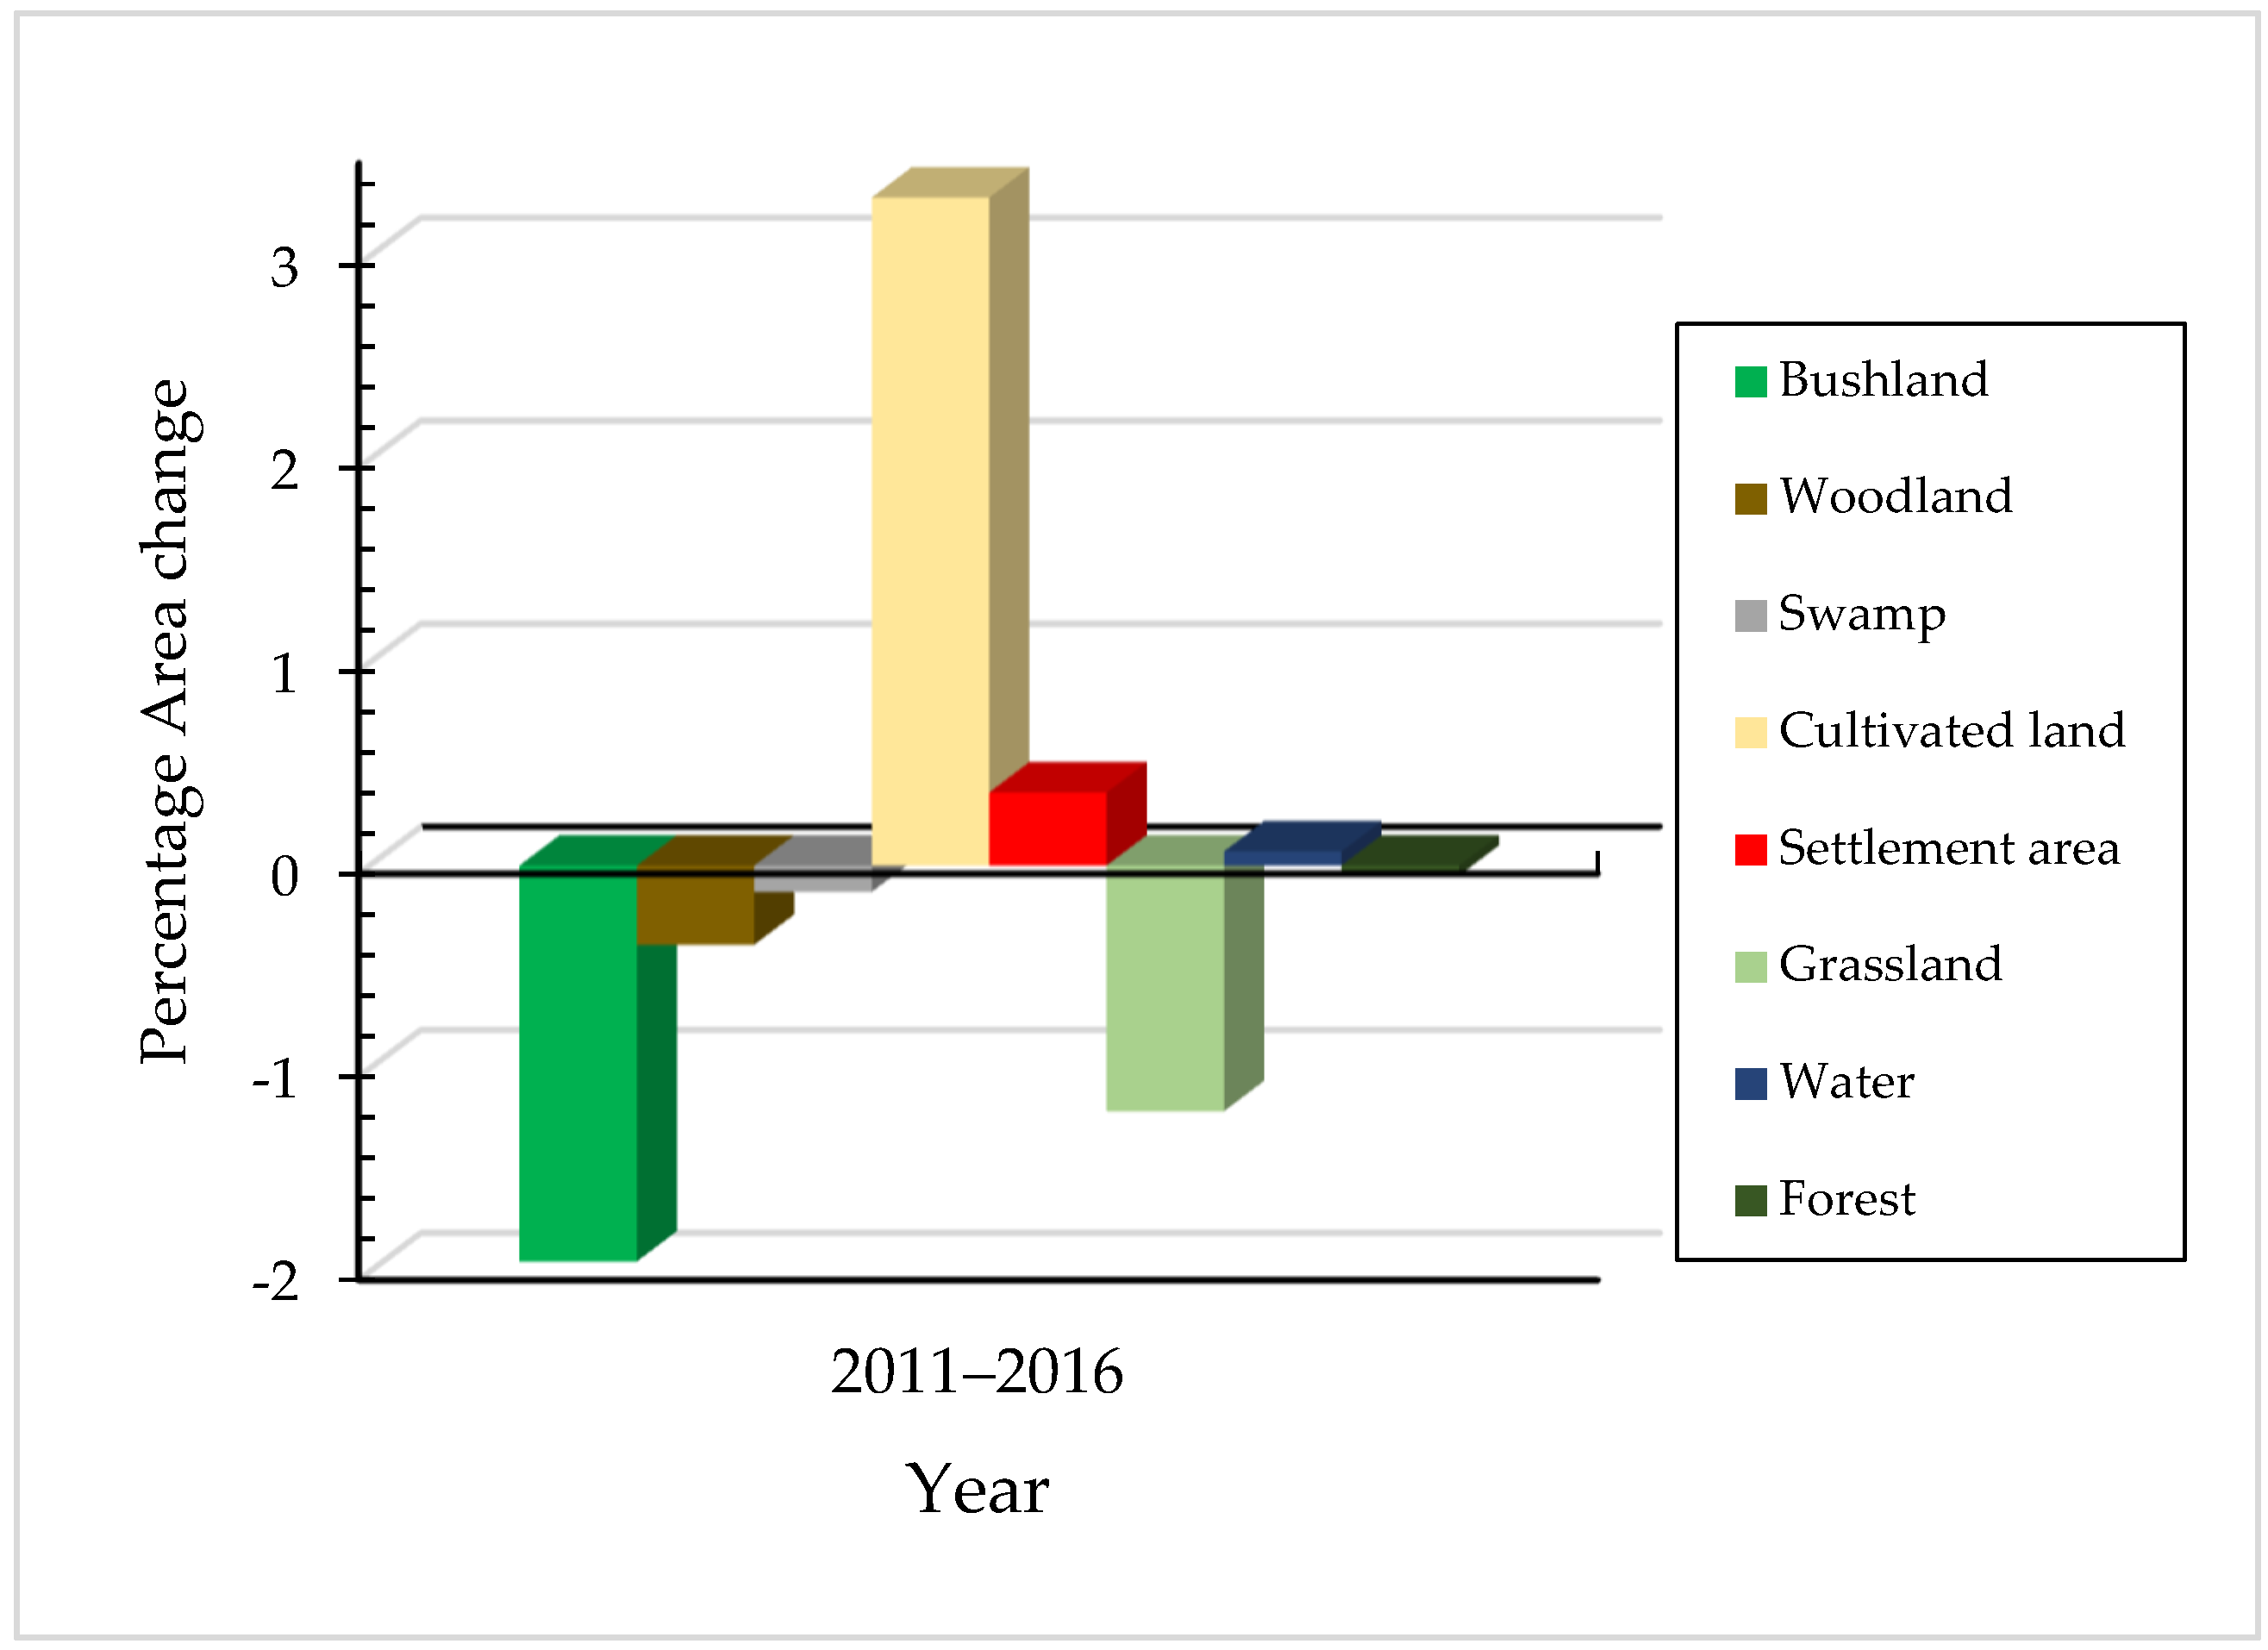
Significant increases in cultivated land were observed during the study period (2011–2016), as shown in Figure 3. Cultivated land showed the highest increases in area coverage in the 2011–2016 change period, of about 552.91 km2 (3.29%). Additionally, growth in settlement area was observed, at about 60.77 km2 (0.36%) in the 2011–2016 change period. A small increase in water (11.08 km2/0.07%) was observed in the study period. On the other hand, many other LU/LC categories revealed a decreasing trend. Bushland and grassland significantly decreased by 326.7 km2 (1.95%) and 203.43 km2 (1.21%), respectively. Swamp and forest showed a slight decrease during the study period of 21.72 km2 (0.13%) and 7.69 km2 (0.05%), respectively. Woodland decreased by 65.23 km2 (0.39%) during the study period.

3.2.2. Spatial Regression Analysis

Statistical tests, including the Breusch–Pagan (BP) test and Moran I test, were performed to identify the spatial autocorrelation effect and the heterogeneity of the spatial data at the Kinyasungwe sub-catchment. The test results were statistically significant, indicating spatial autocorrelation in residues, and hence a need to run the spatial lag and the spatial error regression models (Table 5).
For the estimates of the spatial lag model at the Kinyasungwe sub-catchment, the number of populations served by each water point was the dependent variable, and the six LU/LC types surrounding the water points were the independent variables. At the Kinyasungwe sub-catchment, the number of populations served by water points had a mean value of approximately 219 and a standard deviation of 491.841, while the adjusted R-Squared value was 0.8599, which indicated that these variables explained the model. Table 6 shows the result of multiple linear regression using ordinary least squares (OLS) at the Kinyasungwe sub-catchment. The p-value is less than 0.05 in the OLS test for bushland, cultivated land, and grassland, which proves that the model is significant. Woodland, swamp, and settlement have a p-value of more than 0.05, which means they are not significant predictors for the model.

3.2.3. Impacts of Individual LU/LC Changes on Water Point Characteristics

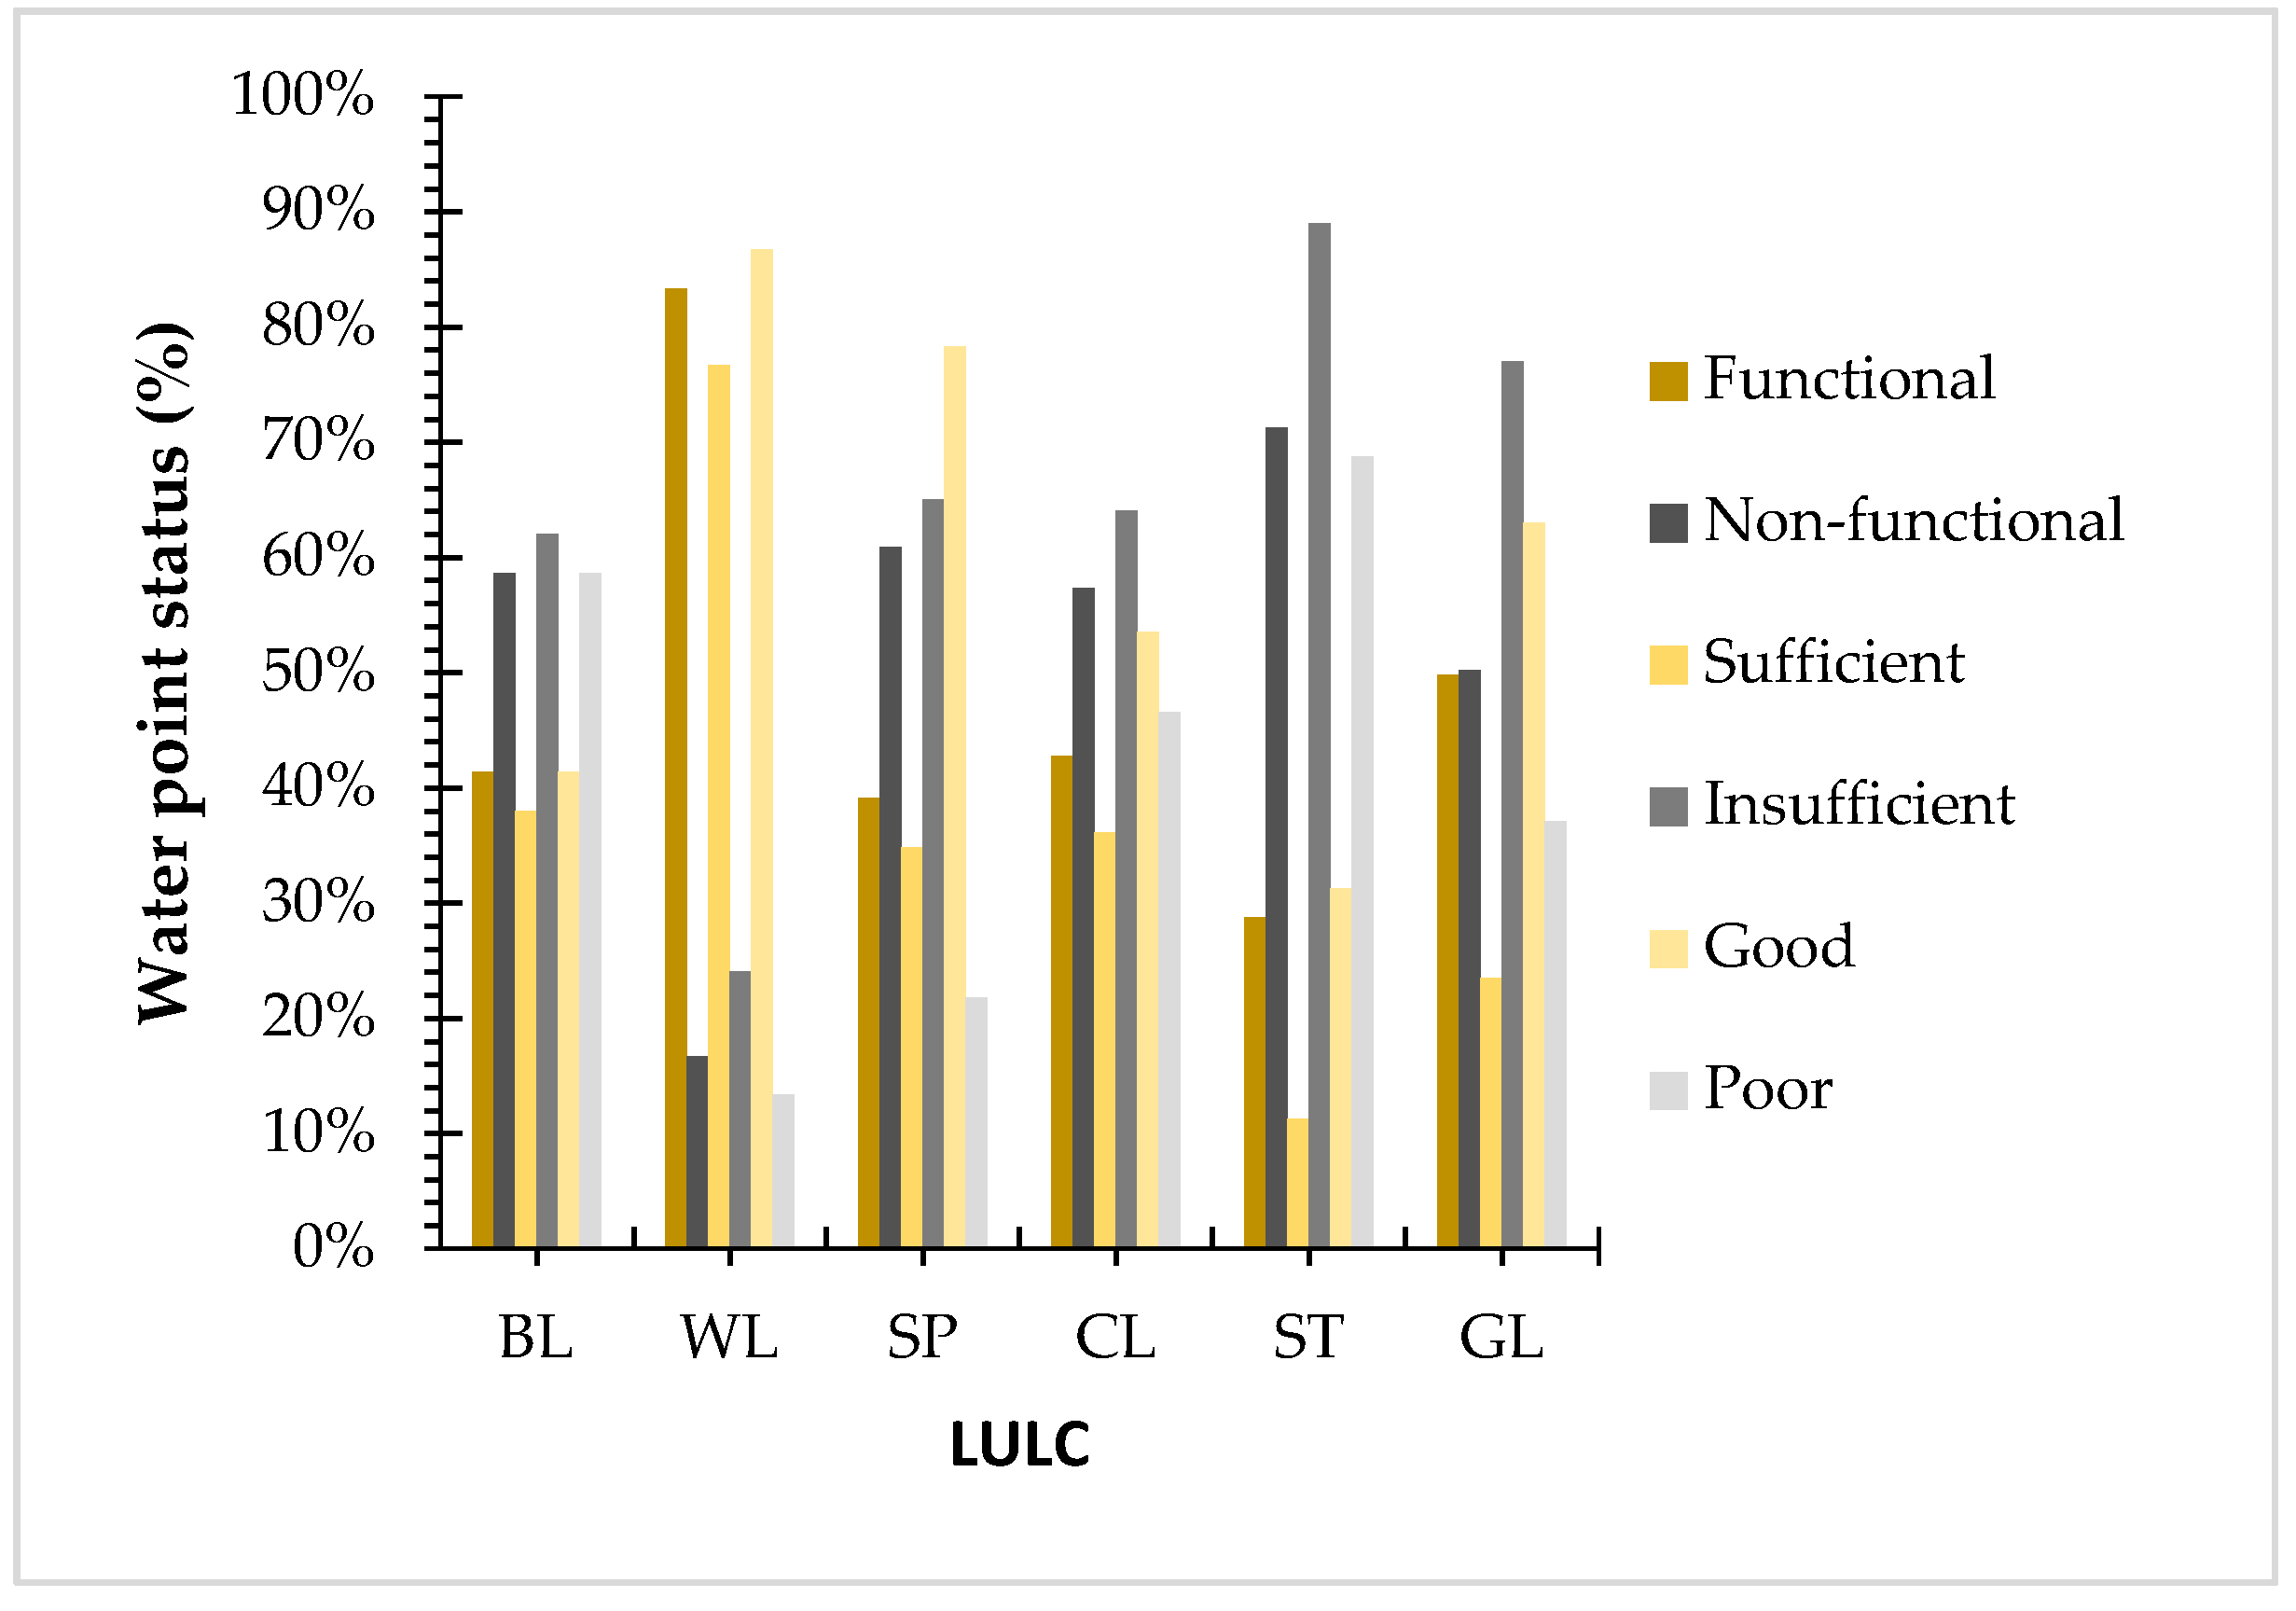
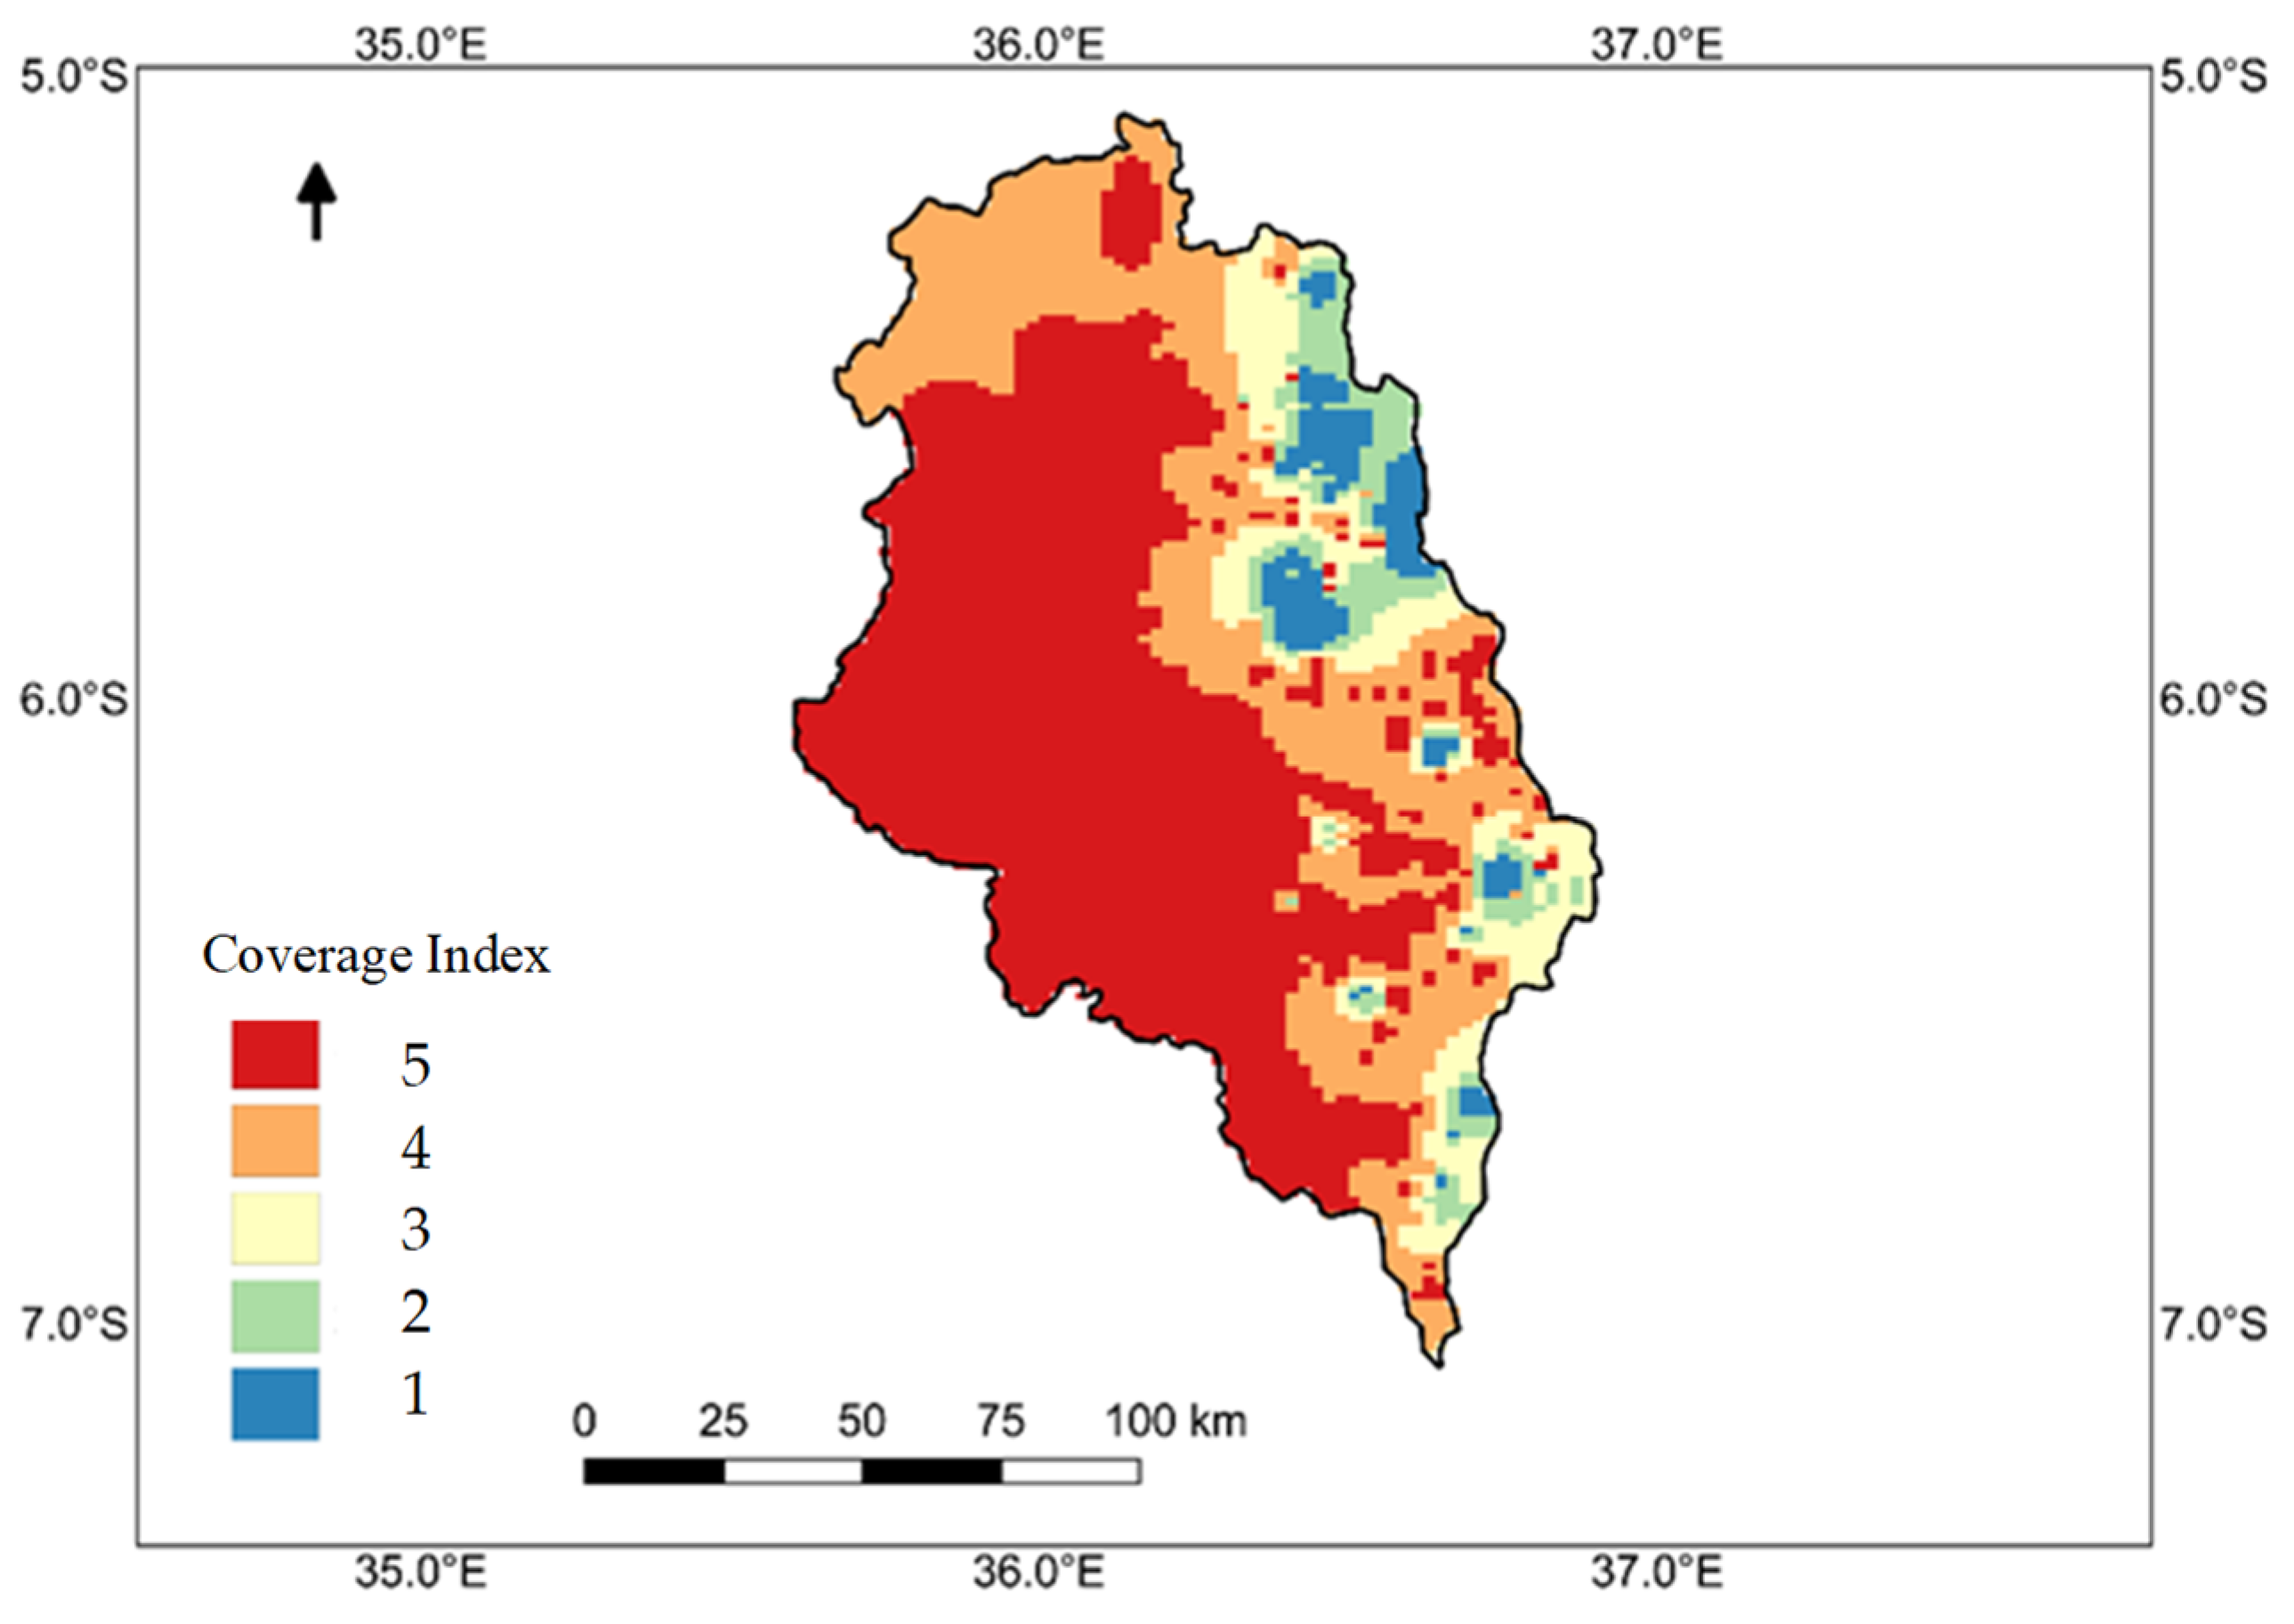
The result of the performance of water point characteristics on individual LU/LCs is presented in Table 7 and Figure 4, while the spatial index analysis is shown in Figure 5. The spatial index is defined as follows: 1–highest coverage, 2–high coverage, 3–average coverage, 4–below coverage and 5–lowest coverage. The results showed that bushland, woodland, cultivated land, and grassland were significantly correlated with water point characteristics. For functionality characteristics, a significant effect was observed in bushland, whereby 58.62% of the water points were found to be in the non-functional category, followed by cultivated land (57.22%) and grassland (50.12%). However, fewer non-functionality water points were observed for woodland (16.67%), and this implies that 83.33% of the water points found were functional. For water point quantity, sufficient water was found in the points for woodland, with 76.67% of all water points have enough water. However, the rest of the LU/LCs were found to have many water points with insufficient water, including grassland (76, or 54%), cultivated land (63.92%), and bushland (62.07%). Furthermore, the results showed that bushland had a significant amount of water points of poor quality (58.62%), followed by cultivated land (46.52%) and grassland (37.04), while woodland had fewer water points of poor quality (13.33%).

3.3. Wami Sub-Catchment

3.3.1. LU/LC Change

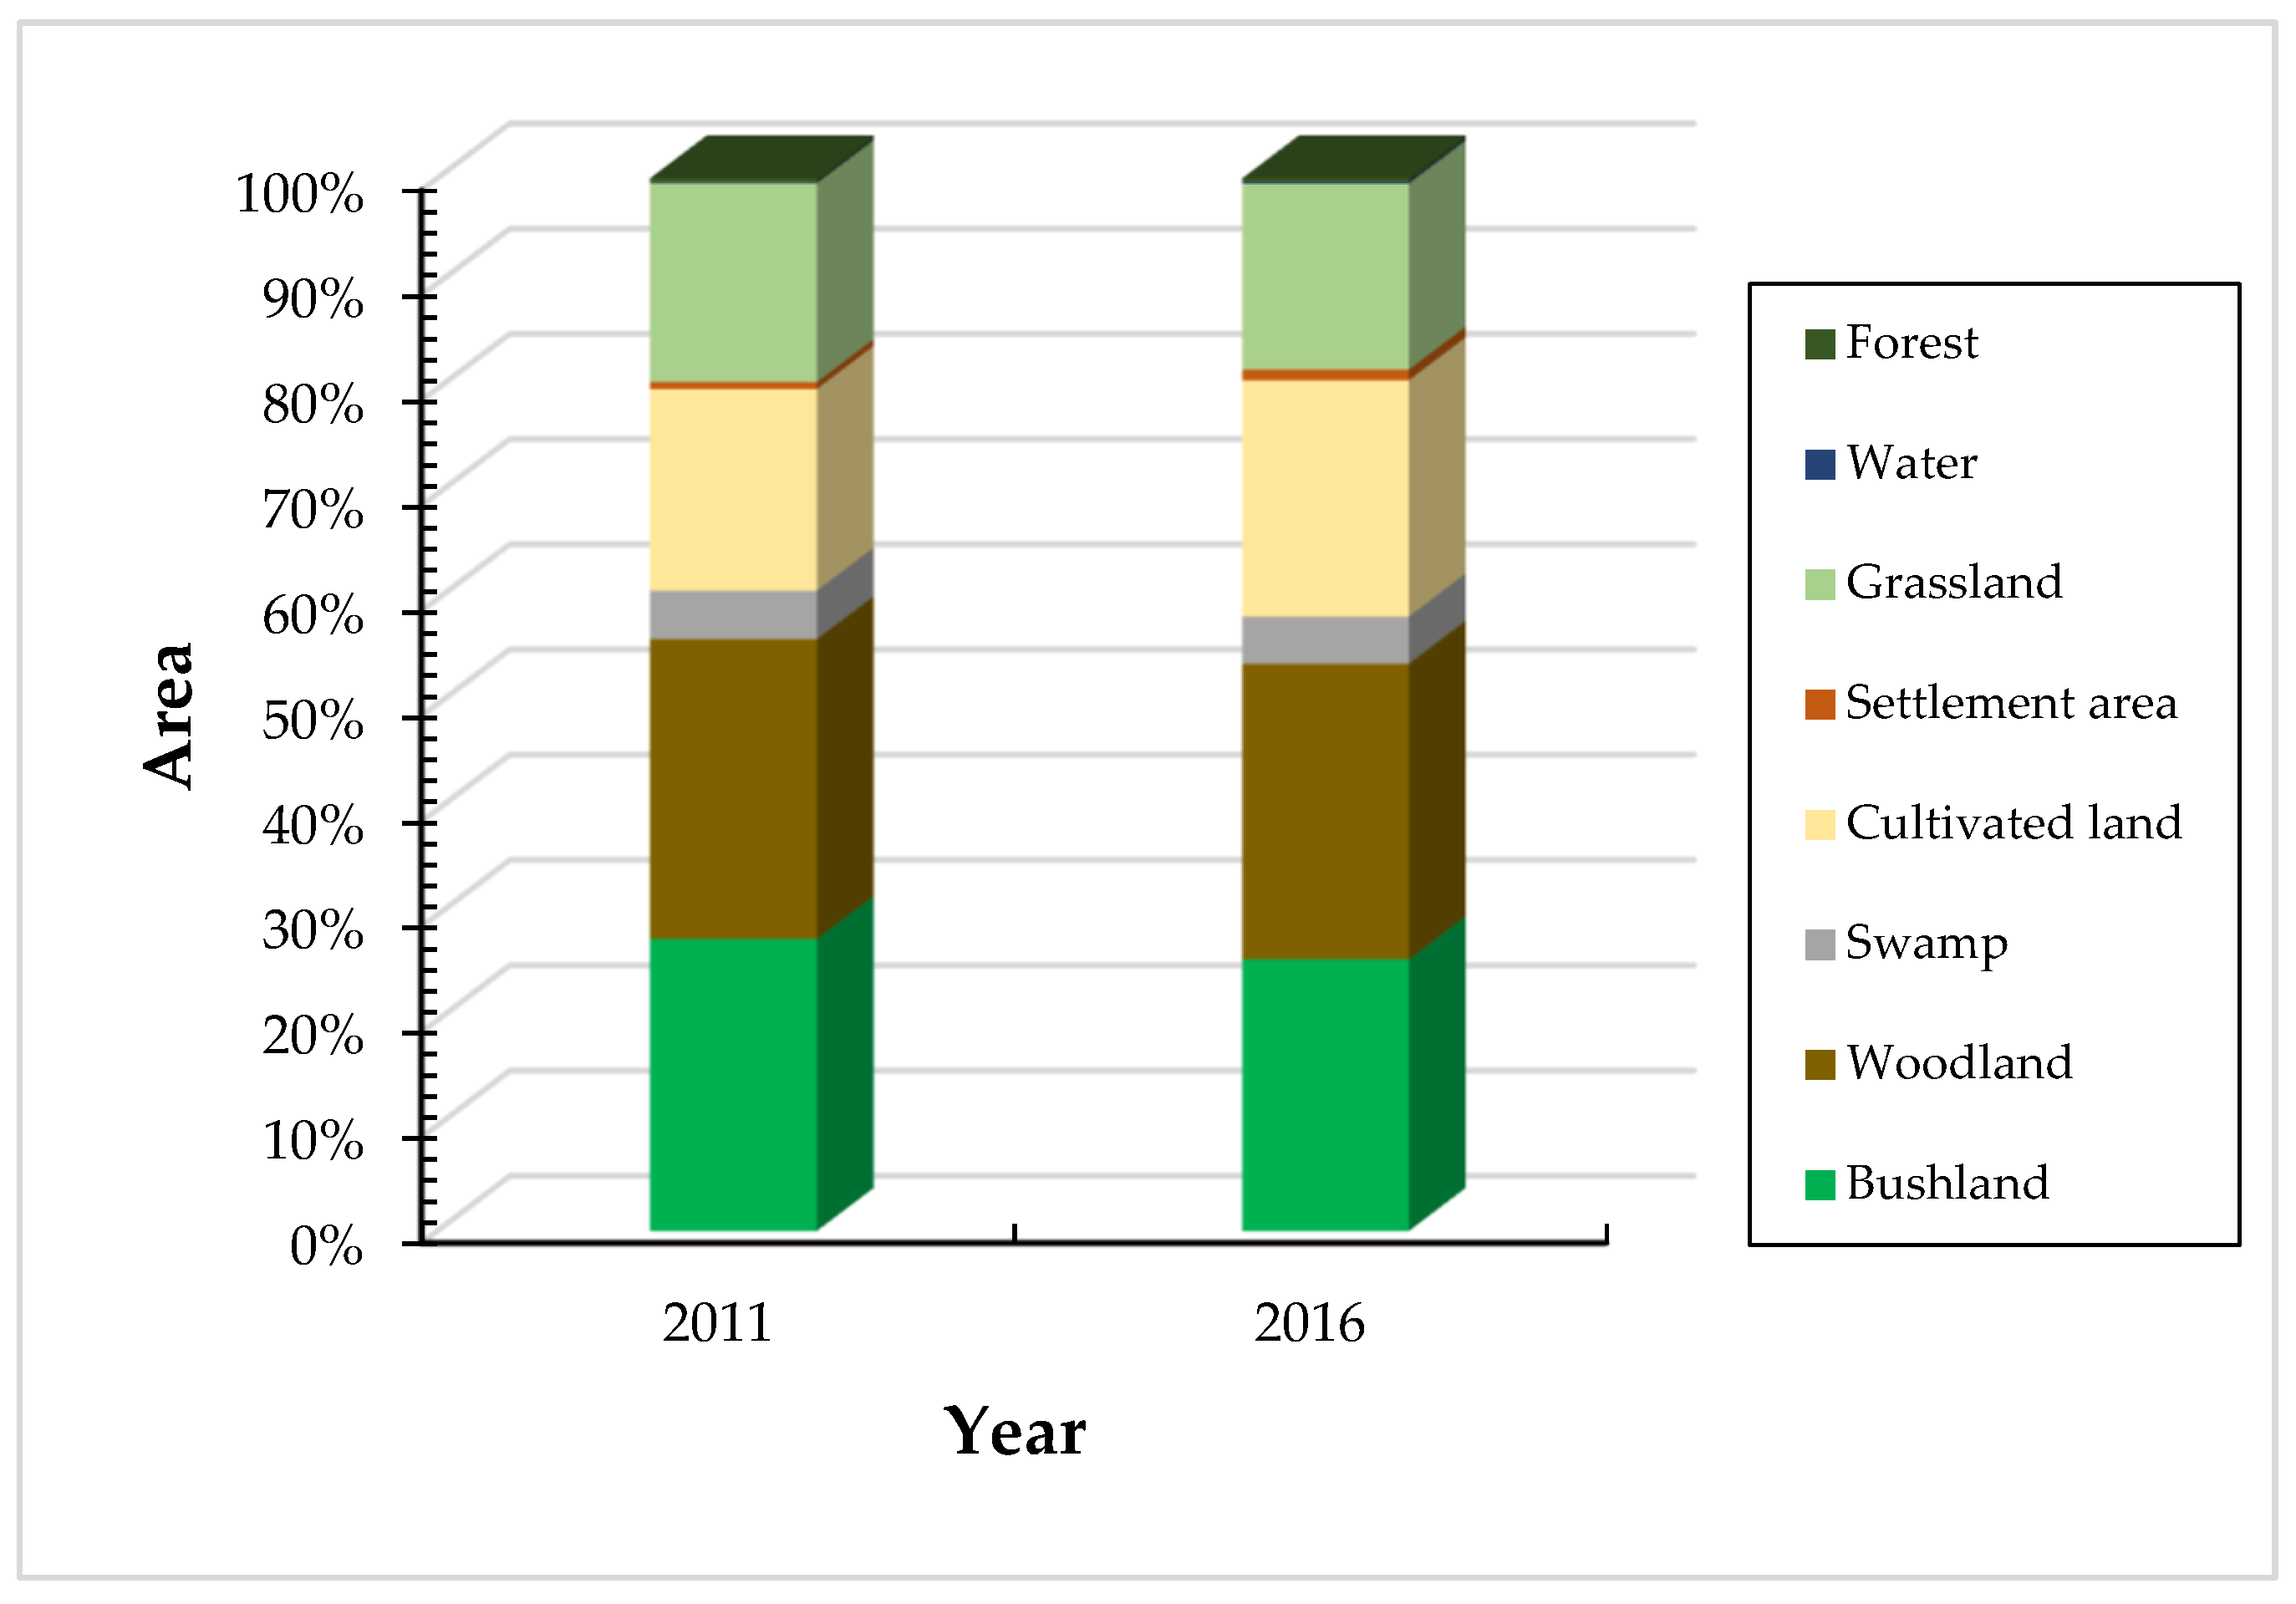
LU/LC classes for the Wami sub-catchment from 2011–2016 were analysed, and the results are presented in Table 8 and Figure 6. Nine LU/LC class were identified: bushland, swamp, woodland, cultivated land, water, settlement area, forest, grassland, and open land. As shown in Table 8, woodland, bushland, and cultivated land were found to be the dominant LU/LC categories in 2011 and 2016. Cultivated land showed maximum positive changes, covering areas of 2679.33 km2 (18.59%) in 2011 and 3655.96 km2 (25.36%) in 2016, while swamp showed minimal negative changes, covering an area of 310.24 km2 (2.15%) in 2011 and 301.23 km2 (2.09%) in 2016. Woodland and bushland were observed to decrease during the study period, from 8208.92 km2 (56.94%) and 1870.67 km2 (12.98%) in 2011 to 7511.02 km2 (52.10%) and 1685.75 km2 (11.69%) in 2016, respectively. Grassland and forest were found to cover corresponding areas of 632.79 km2 (4.39%) and 660.14 km2 (4.58%) in 2011, which decreased to 532.34 km2 (3.69%) and 627.88 km2 (4.36%) in 2016. Settlements covered an area of 22.73 km2 (0.16%) and 68.86 km2 (0.48%) in 2011 and 2016, respectively, showing an increase in coverage, while water was found to cover an area of 24.74 km2 (0.17%) in 2011, which increased to 26.05 km2 (0.18%) in 2016.
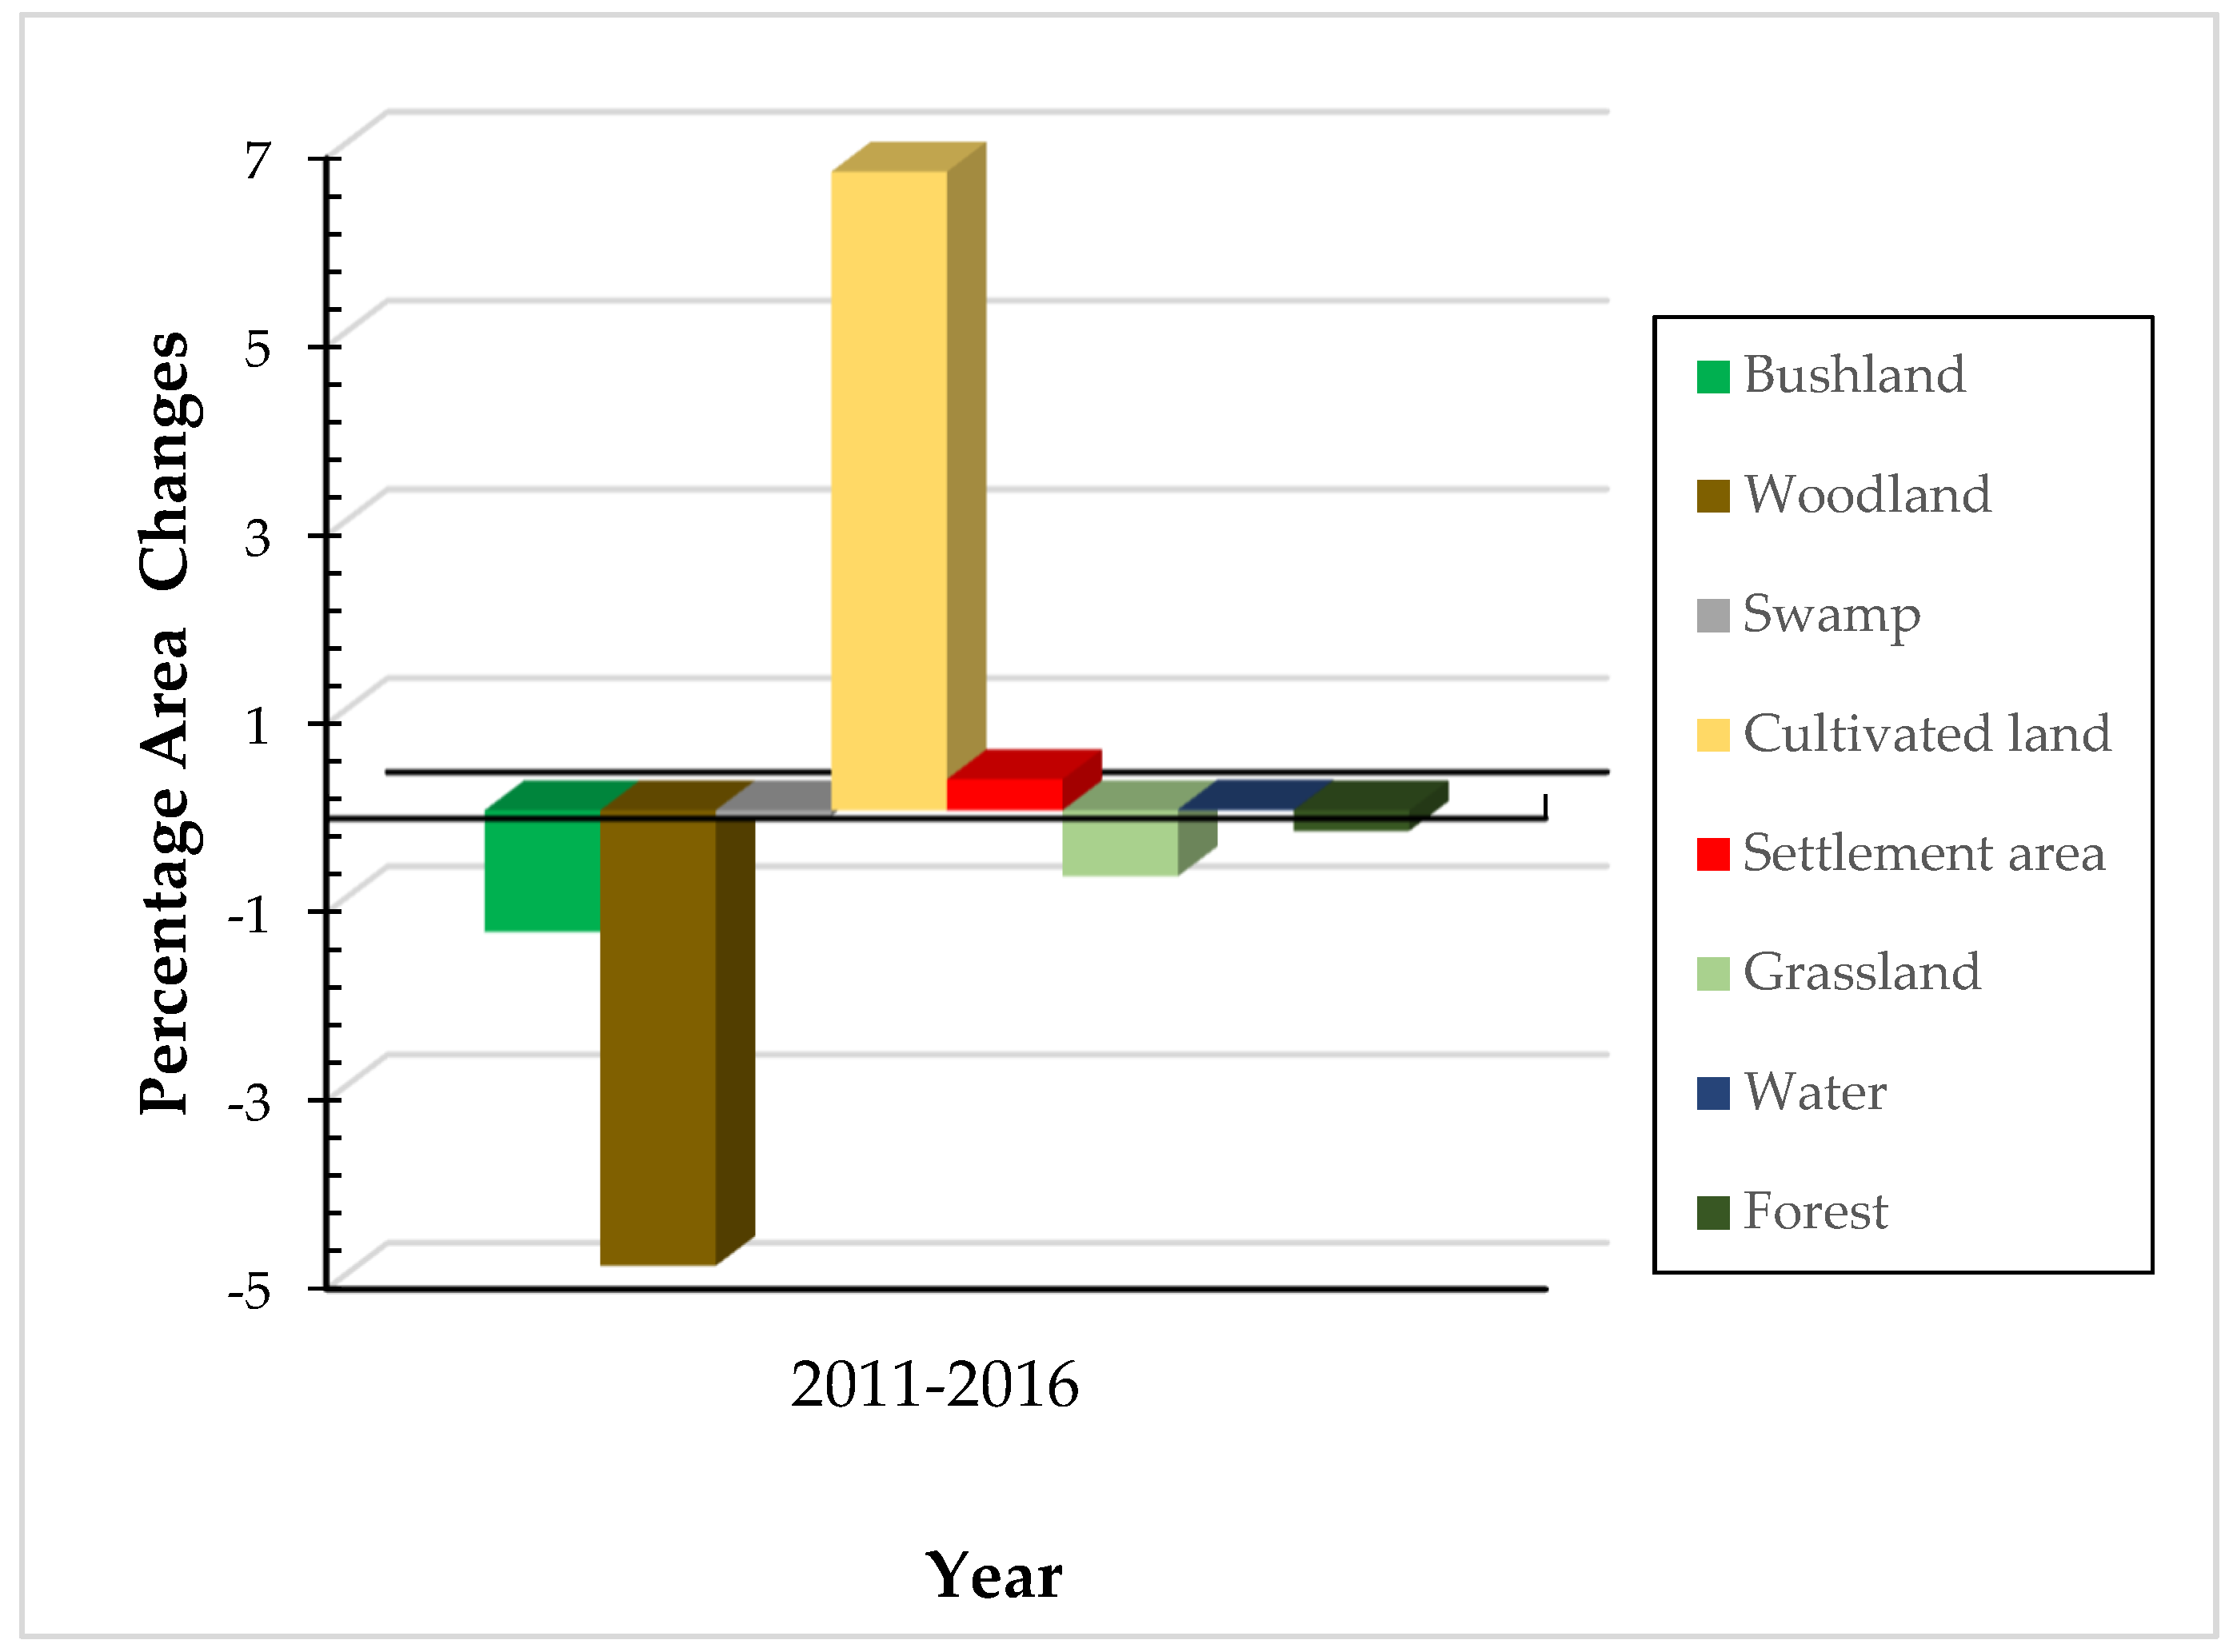
Substantial increases in cultivated land were observed during the study period (2011–2016), as shown in Figure 7. Cultivated land showed the highest increase in area coverage in the 2011–2016 change period, of about 977.09 km2 (6.77%). Growth in settlement area was also observed, at about 46.13 km2 (0.33%) in the 2011–2016 change period. A slight increase in water (1.31 km2/0.01%) was observed during the study period. On the other hand, the other LU/LC categories showed a decreasing trend. Woodland and bushland showed significant decreases, by 697.90 km2 (4.84%) and 184.92 km2 (1.21%) respectively. Grassland, forest, and swamp showed a decreasing trend during the study period, by 100 km2 (0.70%), 32.26 km2 (0.22%), and 9.01 km2 (0.06%), respectively.

3.3.2. Spatial Regression Analysis

Statistical tests, including the Breusch–Pagan (BP) test and Moran I test, were performed to identify the spatial autocorrelation effect and the heterogeneity of spatial data at the Wami sub-catchment. The test results were statistically significant, indicating spatial autocorrelation in residues, and therefore a need to run the spatial lag and the spatial error regression models (Table 9).
For the estimates of the spatial lag model at the Wami sub-catchment, the populations served by water points were the dependent variable and the six LU/LC types surrounding the water point were independent variables. At the Wami sub-catchmnet, the number of populations served by each water point had a mean value of approximately 4879 and standard deviation of 2764, while the adjusted R-squared value was 0.02336, which indicated that these variables explained the model. Table 10 shows the result of multiple linear regression using ordinary least squares (OLS) at the Wami sub-catchment. The p-value is less than 0.05 in the OLS test for bushland, woodland, cultivated land, and grassland, which proves that the model is significant. This table shows only those variables with p-values lower than 0.05, which can be considered significant predictors for the OLS model. Swamp and settlement have p-values of more than 0.05; this means they are not significant predictors for the model.

3.3.3. Impacts of Individual LU/LC Changes on Water Point Characteristics

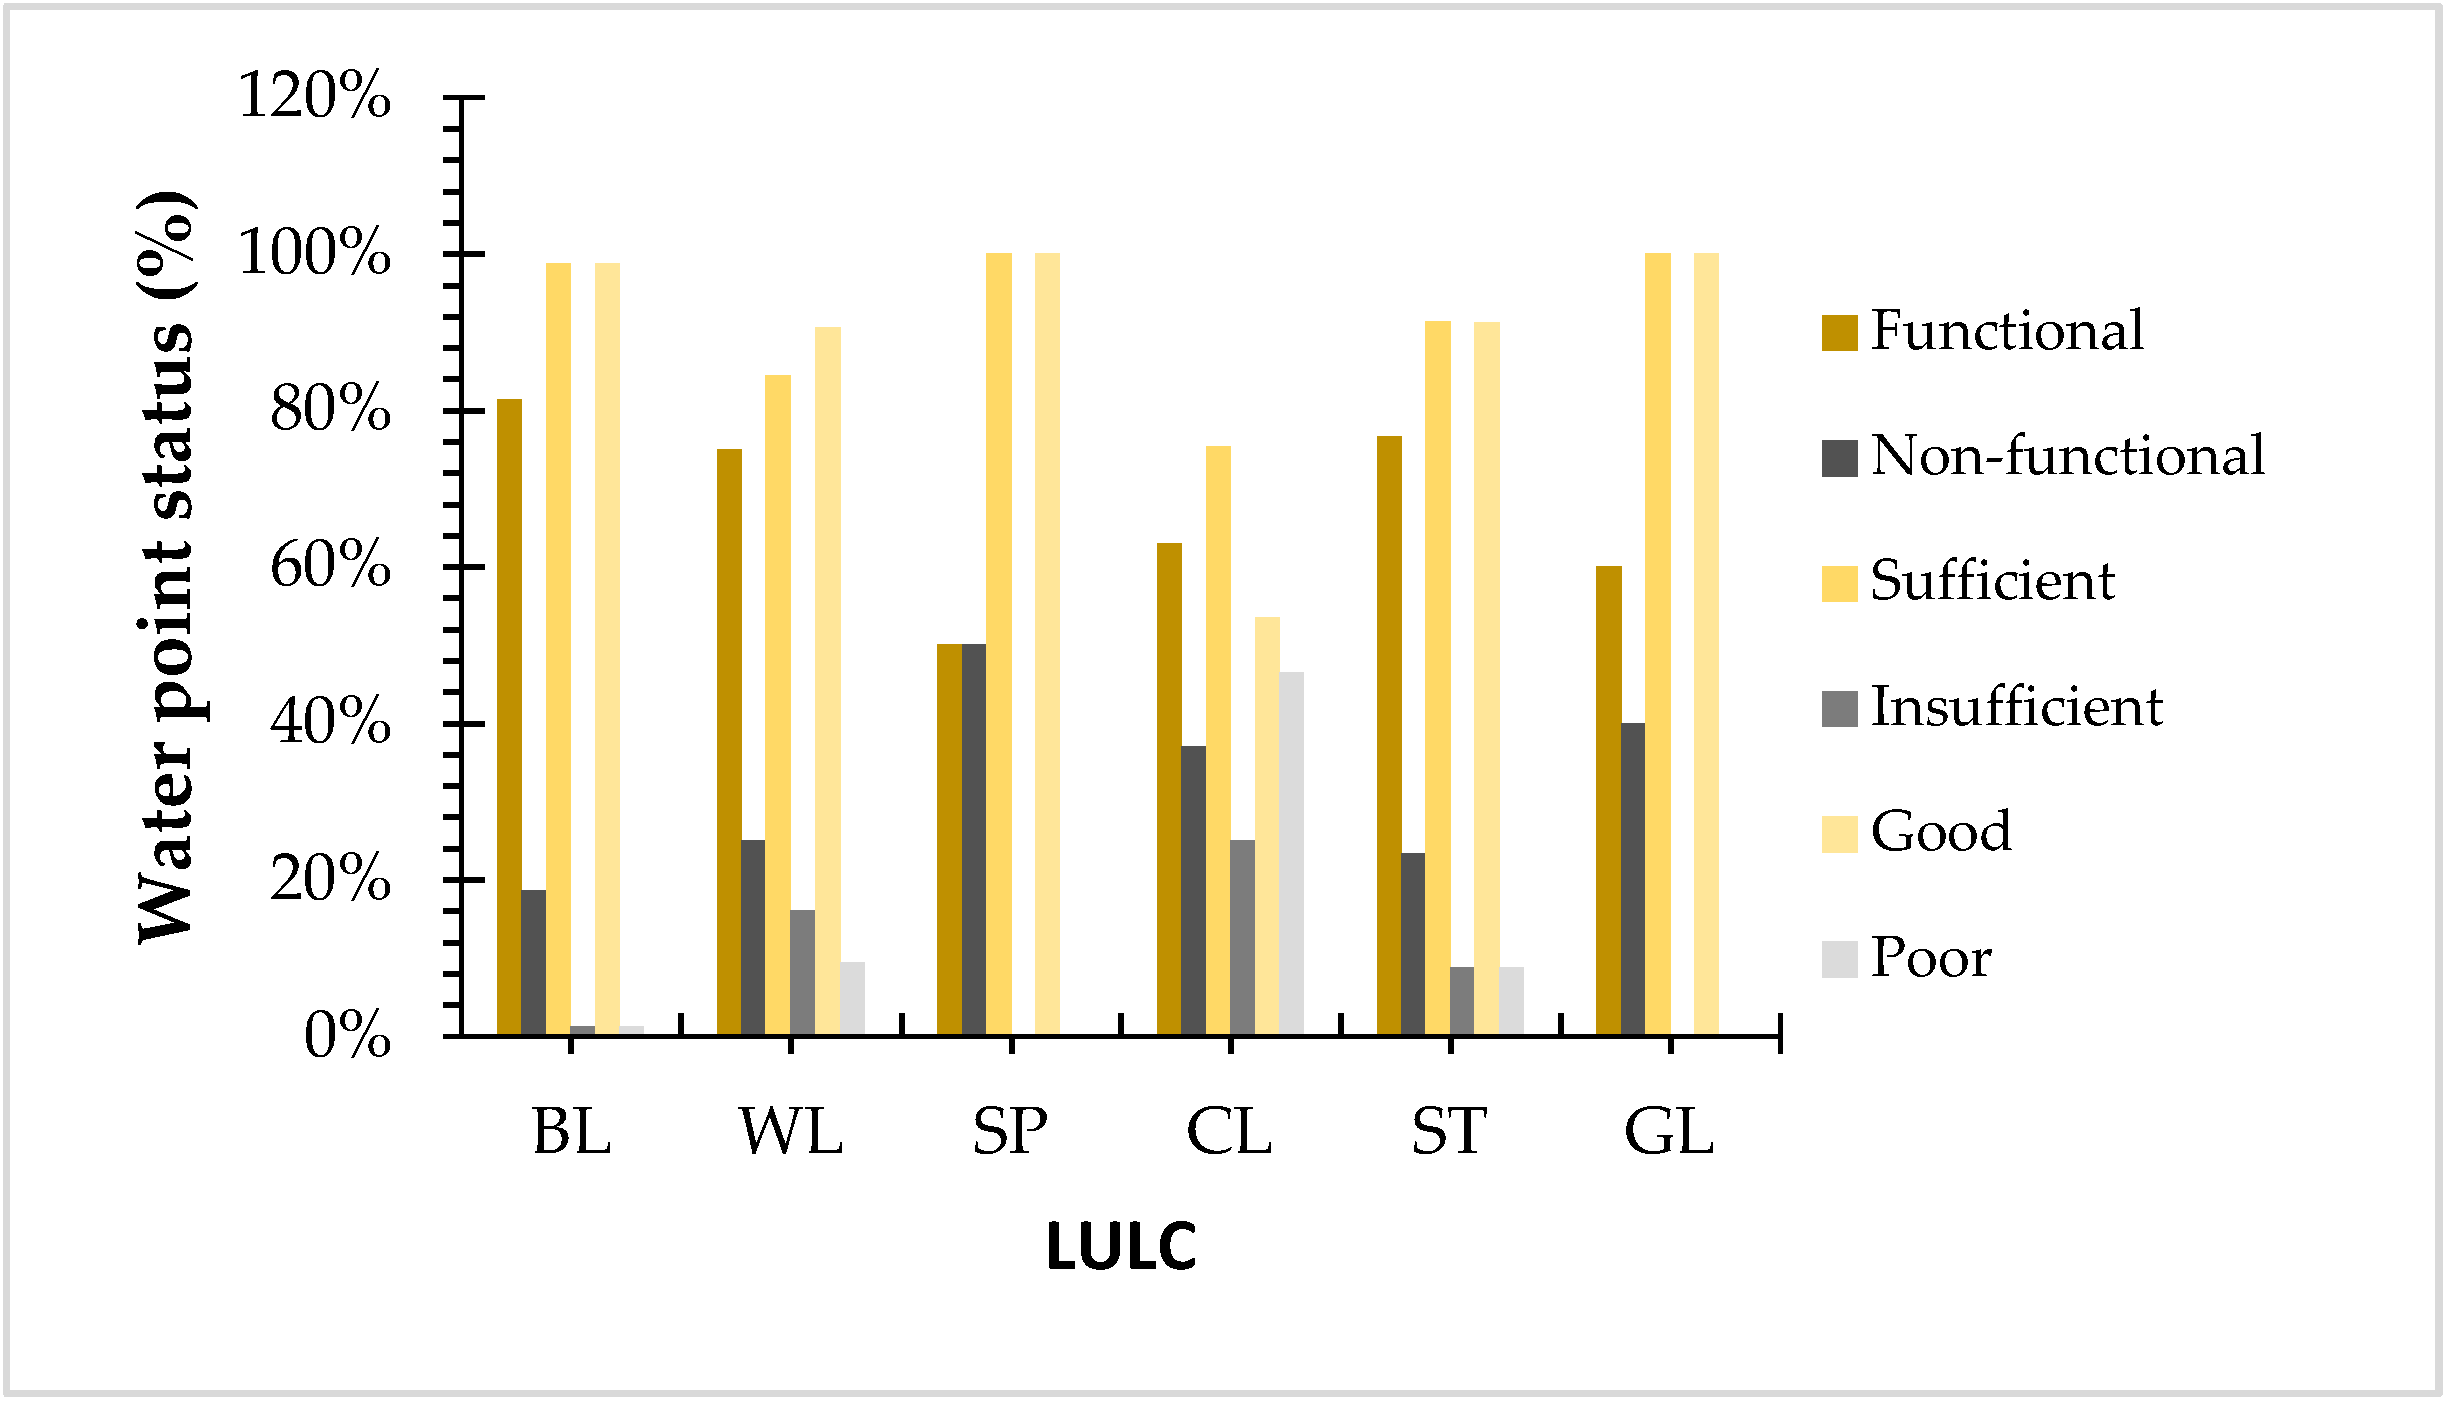
The results of the impact of water point characteristics on individual LU/LCs are presented in Table 11 and Figure 8, while the spatial index analysis is shown in Figure 9. The results showed that bushland, woodland, cultivated land, and grassland were statistically significantly correlated with water point characteristics. For functionality characteristics, a significant effect was observed for grassland, whereby 40.00% of the water points were found to be in the category of non-functionality, followed by cultivated land (37.00%) and woodland (25.00%). However, fewer non-functionality water points were observed for woodland (18.60%); this implies that 81.40% of water points were functional. For water point quantity, sufficient water was found in grassland, with 100% of all water points having enough water, followed by bushland (98.80%), woodland (84.40%), and cultivated land (75.40%). Moreover, the results showed that all LU/LCs were observed to have a significant number of water points with good quality (grassland (100%), bushland (98.80%), and woodland (90.60%)), except for cultivated land (46.52%).

4. Discussion

The evidence shows that community water supplies in rural areas in developing countries, such as in Africa, are mostly insufficient and unreliable given the rate of population growth [48,49,50]. Safe and clean drinking water is one of the most vital needs of life [51]. Presently, water shortages affect approximately 40% of people across the world, and by 2030, the overall demand for water is estimated to increase by 50% [52]. Challenges in the water sector are linked with population increase, climate change, and LU/LC change, resulting in shortages of various societal needs, including the supply of safe drinking water [53]. Global trends such as LU/LC change pose severe challenges to resource management [54], including of water. Such changes are disturbing in the light of growing insecurities and pressures around managing resources [55]. Increasing human activities across the world are causing significant modification of the land surface, which has a severe effect on the functioning of global systems [1]. The effects include land degradation [56], impacts on hydrological cycles [57,58,59], and a decline in ecosystem services [60], including water for domestic use. LU/LC change is a worldwide phenomenon, which will continue to cause increased demand for water resources and their associated ecosystem services, particularly for drinking water [60]. While several researchers have observed how water resources are becoming strained due to LU/LC change, none have researched how water ecosystem services are affected.
Using the spatial econometric technique, we analysed the impact of LU/LC changes on water ecosystem services for domestic use in the Wami River Basin. The LU/LC changes both upstream and downstream of the basin have already been presented. The findings during the study period (2011–2016) on different classes revealed that cultivated land showed maximum positive changes in both sub-catchments, while bushland and woodland showed maximum negative changes in the Kinyasungwe sub-catchment and Wami sub-catchment, respectively. The results showed that bushland, woodland, cultivated land, and grassland were significantly correlated with water point characteristics in both sub-catchments. For functionality characteristics, a significant effect was observed for bushland and grassland in the Kinyasungwe sub-catchment and Wami sub-catchment, respectively, while sufficient water was found at the water points for woodland (Kinyasungwe sub-catchment) and grassland (Wami sub-catchment). Furthermore, the results showed that bushland had a significant amount of water points of poor quality at the Kinyasungwe sub-catchment, while a significant number of water points of good quality were found in grassland of the Wami sub-catchment.
Population growth and economic development have led to changes in LU/LC worldwide, while ecosystems services are continuously threatened by human activities and stand to be further affected [2,61,62]. Resulting changes can have positive consequences such as increased vulnerability, resulting in a decreased supply of ecosystem services including water availability and quality, especially in arid and semiarid regions [61]. With the rapid expansion of LU/LC, ecosystem services for drinking water will continue to be affected [63,64]. It is critical to research the typologies of water points and role of LU/LC changes in influencing water supply services [65,66]. Numerous concerns exist today in areas where demands on land and water ecosystem services can be high due to natural degradation from agriculture and settlement expansion [67]. The loss of ecosystem services such as drinking water due to natural resource reduction are not native phenomena, but rather a collective universal issue [68]. A number of studies have been performed worldwide showing that natural resources are decreasing, leading to losses of ecosystem services; namely, the supporting, regulating, and provisioning of services [57,69]. In future, the loss of ecosystem services due to unforeseen LU/LC change is expected to continue, especially in poor countries, and this will affect land and water resources, which provide a lot of ecosystem services [70].
Water shortages and pollution are all signs of stress, especially in rural areas which have difficult interactions with the natural water cycle [71]. To reduce the damage to ecosystem services for drinking water around the basin, it is critical to identify land uses which are highly vulnerable to human activities [72]. The relative influence of the different LU/LC changes on water provisioning services and water supply is based on the LU/LC patterns affecting annual water available for drinking [63,73]. The impacts of cumulative pressures on ecosystems may not be observed for many years, until threshold point is reached, which activates rapid or permanent changes [74]. This will impact the supply of ecosystem services that are essential for human well-beings including provision of drinking water [75]. In order to more effectively manage ecosystem services, there is a need to understand how incremental impacts on biodiversity and ecosystems affect the goods and services they provide [76]. In this context, efficient and protection-oriented plans and policies should be adopted for sustainable land and water resource development in the basin.

5. Conclusions

Our aim in this study was to analyse the impacts of LU/LC change on water ecosystem services for domestic use in the Wami River Basin. We found that the LU/LC changes and water point characteristic correlations are all statistically significant. We have also shown that different LU/LCs can affect drinking water services, with a likely drop in service coverage. Our study confirms the influence of LU/LC change on water point functionality, water quantity and water quality, and, therefore, we conclude that LU/LC change affects water ecosystems for drinking water in the basin. These findings point to an inherent reduction of natural resources, resulting from increasing agriculture and urbanization, and explain natural resource decreases in the Wami River Basin. Hence, they support initiation of dialogue on policies at the national level that could emphasise either land-use and water resource choices, or motivations that could potentially be used by the community regarding natural resource protection. A very strong argument exists in these cases to develop a nexus of land and water resource systems for environmental protection, including decreasing or preventing impacts. However, such an act may be challenged if the relationships between land, water and other sectors have not been clearly determined due to a lack of data. This critical problem alarms stakeholders in land and water resources in terms of the implementation of a resource nexus system that takes other sectors into account. The demand for sustainability, accountability, and incentives for rural water supply services may evidently arise. For example, compensation schemes and data on the water supply can be developed if a well-defined link can be established between land use management and the water supply, both at economic and hydrological intensities. Furthermore, for the sustainability of rural water supply services, we suggest numerous policy effects to optimize resource management in the basin. First, the authority should make use of the Water Point Mapping System to establish inter-sectorial cooperation mechanisms, reinforce temporal and spatial data availability in the basin, and build specific standard bases for services. This will help to increase water ecosystem service benefits, while reducing the spatial and temporal effects of LU/LC change and other factors. Second, other factors such as operation and maintenance, technology, financing, and management of water points determine the standards of the services. Thus, construction of new water points must be based on a researched evaluation of suitability, as well as the management capacity of an area. At the same time, proper land management in the basin could prevent impacts on the environmental ecosystem and reduce challenges to water ecosystem services.
Author Contributions

The four authors contributed in a substantial way to the manuscript. All authors discussed the structure of the manuscript and read and approved the submitted manuscript.

Funding

This research was funded by the Ministry of Water and the United Republic of Tanzania, and the APC was funded by Dresden University of Technology (TU Dresden).

Acknowledgments

We acknowledge support from UNU-FLORES and TU Dresden. Open Access Funding by the Publication Fund of the TU Dresden. The first author would like to acknowledge the financial support from the Government of the United Republic of Tanzania.

Conflicts of Interest

The authors declare no conflict of interests.

References

  1. Lambin, E.F.; Turner, B.; Geist, H.J.; Agbola, S.B.; Angelsen, A.; Bruce, J.W.; Coomes, O.T.; Dirzo, R.; Fischer, G.; Folke, C.; et al. The causes of land-use and land-cover change: Moving beyond the myths. Glob. Environ. Chang. 2001, 11, 261–269. [Google Scholar] [CrossRef]
  2. Twisa, S.; Buchroithner, M.F. Seasonal and Annual Rainfall Variability and Their Impact on Rural Water Supply Services in the Wami River Basin, Tanzania. Water 2019, 11, 2055. [Google Scholar] [CrossRef] [Green Version]
  3. Bounoua, L.; Nigro, J.; Thome, K.J.; Zhang, P.; Fathi, N.; Lachir, A. A Method for Mapping Future Urbanization in the United States. Urban Sci. 2018, 2, 40. [Google Scholar] [CrossRef] [Green Version]
  4. Pickard, B.R.; Gray, J.M.; Meentemeyer, R.K. Comparing Quantity, Allocation and Configuration Accuracy of Multiple Land Change Models. Land 2017, 6, 52. [Google Scholar] [CrossRef] [Green Version]
  5. Lambin, E.F.; Meyfroidt, P. Land use transitions: Socio-ecological feedback versus socio-economic change. Land Use Policy 2010, 27, 108–118. [Google Scholar] [CrossRef]
  6. Lambin, E.; Geist, H.; Lepers, E. Dynamics of land-use and land-cover change in tropical regions. Annu. Rev. Environ. Resour. 2003, 28, 205–241. [Google Scholar] [CrossRef] [Green Version]
  7. Wangai, P.W.; Burkhard, B.; Müller, F. Quantifying and mapping land use changes and regulating ecosystem service potentials in a data-scarce peri-urban region in Kenya. Ecosyst. People 2019, 15, 11–32. [Google Scholar] [CrossRef] [Green Version]
  8. Egoh, B.; Reyers, B.; Rouget, M.; Richardson, D.M.; Le Maitre, D.C.; Van Jaarsveld, A.S. Mapping ecosystem services for planning and management. Agric. Ecosyst. Environ. 2008, 127, 135–140. [Google Scholar] [CrossRef]
  9. Buytaert, W.; Zulkafli, Z.; Grainger, S.; Acosta, L.; Alemie, T.C.; Bastiaensen, J.; De Bièvre, B.; Bhusal, J.; Clark, J.; Dewulf, A.; et al. Citizen science in hydrology and water resources: Opportunities for knowledge generation, ecosystem service management, and sustainable development. Front. Earth Sci. 2014, 2, 26. [Google Scholar] [CrossRef] [Green Version]
  10. World Resources Institute. Millennium Ecosystem Assessment. Ecosystems and Human Well-being: Biodiversity Synthesis; World Resources Institute: Washington, DC, USA, 2005. [Google Scholar]
  11. Fisher, B.; Turner, R.K.; Morling, P. Defining and classifying ecosystem services for decision making. Ecol. Econ. 2009, 68, 643–653. [Google Scholar] [CrossRef] [Green Version]
  12. Roy, A.; Inamdar, A.B. Multi-temporal Land-Use/Land-Cover (LULC) change analysis of a dry semi-aridriver basin in western India following a robust multi-sensor satellite image calibration strategy. Heliyon 2019, 5, e01478. [Google Scholar] [CrossRef] [PubMed] [Green Version]
  13. Yesuph, A.Y.; Dagnew, A.B. Land use/cover spatiotemporal dynamics, driving forces and implications at the Beshillo catchment of the Blue Nile Basin, North Eastern Highlands of Ethiopia. Environ. Syst. Res. 2019, 8, 21. [Google Scholar] [CrossRef] [Green Version]
  14. Madulu, N.F. Environment, poverty and health linkages in the Wami River basin: A search for sustainable water resource management. Phys. Chem. Earth Parts A/B/C 2005, 30, 950–960. [Google Scholar] [CrossRef]
  15. Wambura, F.J. Stream Flow Response to Skilled and Non-linear Bias Corrected GCM Precipitation Change in the Wami River Sub-basin, Tanzania. Br. J. Environ. Clim. Chang. 2014, 4, 389–408. [Google Scholar] [CrossRef]
  16. Nobert, J. Hydrological Response of Watershed Systems to Land Use/Cover Change. A Case of Wami River Basin. Open Hydrol. J. 2012, 6, 78–87. [Google Scholar] [CrossRef]
  17. Zhan, J. Impacts of Land-use Change on Ecosystem Services; Springer, Geography, Ed.; Springer: Berlin/Heidelberg, Germany, 2015. [Google Scholar]
  18. FAO. Ecosystem Services Sustain Agricultural Productivity and Resiliance; Food and Agriculture Organisation of the United Nations (FAO): Rome, Italy, 2008. [Google Scholar]
  19. Birkhofer, K.; Diehl, E.; Andersson, J.; Ekroos, J.; Früh-Müller, A.; Machnikowski, F.; Mader, V.L.; Nilsson, L.; Sasaki, K.; Rundlöf, M.; et al. Ecosystem services—Current challenges and opportunities for ecological research. Front. Ecol. Evol. 2015, 2, 87. [Google Scholar] [CrossRef] [Green Version]
  20. Mamat, A.; Halik, Ü.; Rouzi, A. Variations of Ecosystem Service Value in Response to Land-Use Change in the Kashgar Region, Northwest China. Sustainability 2018, 10, 200. [Google Scholar] [CrossRef] [Green Version]
  21. Hails, R.; Ormerod, S.J.; Ormerod, S.J. EDITORIAL: Ecological science for ecosystem services and the stewardship of Natural Capital. J. Appl. Ecol. 2013, 50, 807–810. [Google Scholar] [CrossRef] [Green Version]
  22. Costanza, R.; De Groot, R.; Sutton, P.; Van Der Ploeg, S.; Anderson, S.; Kubiszewski, I.; Farber, S.; Turner, R.K. Changes in the global value of ecosystem services. Glob. Environ. Chang. 2014, 26, 152–158. [Google Scholar] [CrossRef]
  23. Havstad, K.M.; Peters, D.P.C.; Skaggs, R.; Brown, J.; Bestelmeyer, B.T.; Fedrickson, E.; Herrick, J.E.; Wright, J. Ecological services to and from rangelands of the United States. Ecol. Econ. 2007, 64, 261–268. [Google Scholar] [CrossRef]
  24. Uriarte, M.; Yackulic, C.B.; Lim, Y.; Arce-Nazario, J.A. Influence of land use on water quality in a tropical landscape: A multi-scale analysis. Landsc. Ecol. 2011, 26, 1151–1164. [Google Scholar] [CrossRef] [PubMed] [Green Version]
  25. Bakker, K. Water Security: Research Challenges and Opportunities. Science 2012, 337, 914–915. [Google Scholar] [CrossRef] [PubMed]
  26. Haddeland, I.; Heinke, J.; Biemans, H.; Eisner, S.; Flörke, M.; Hanasaki, N.; Konzmann, M.; Ludwig, F.; Masaki, Y.; Schewe, J.; et al. Global water resources affected by human interventions and climate change. Proc. Natl. Acad. Sci. USA 2013, 111, 3251–3256. [Google Scholar] [CrossRef] [PubMed] [Green Version]
  27. Ellis, E.C.; Goldewijk, K.K.; Siebert, S.; Lightman, D.; Ramankutty, N. Antropogenic Transformation of the Biomes, 1700 to 2000. Glob. Ecol. Biogeogr. 2010, 19, 589–606. [Google Scholar]
  28. Daily, G.C. Nature’s Services. Societal Dependence on Natural Ecosystems; Island Press: Washington, DC, USA, 1997; 392p. [Google Scholar]
  29. Haines-Young, R.; Potschin, M. The links between biodiversity, ecosystem services and human well-being. In Ecosystem Ecology: A New Sythesis; Raffaelli, D., Frid, C., Eds.; BES Ecological Reviews Series; CUP: Cambridge, UK, 2010. [Google Scholar]
  30. Bryan, B.A. Incentives, land use, and ecosystem services: Synthesizing complex linkages. Environ. Sci. Policy 2013, 27, 124–134. [Google Scholar] [CrossRef] [Green Version]
  31. Vigl, L.E.; Tasser, E.; Schirpke, U.; Tappeiner, U. Using land use/land cover trajectories to uncover ecosystem service patterns across the Alps. Reg. Environ. Chang. 2017, 17, 2237–2250. [Google Scholar]
  32. Haines-Young, R.H.; Potschin, M.; Kienast, F. Indicators of ecosystem service potential at European scales: Mapping marginal changes and trade-offs. Ecol. Indic. 2012, 21, 39–53. [Google Scholar] [CrossRef]
  33. De Groot, R.; Brander, L.; Van Der Ploeg, S.; Costanza, R.; Bernard, F.; Braat, L.; Christie, M.; Crossman, N.; Ghermandi, A.; Hein, L.; et al. Global estimates of the value of ecosystems and their services in monetary units. Ecosyst. Serv. 2012, 1, 50–61. [Google Scholar] [CrossRef]
  34. Yu, H.; Shen, N.; Yu, D.; Liu, C. Effects of Temporal Heterogeneity of Water Supply and Spatial Heterogeneity of Soil Nutrients on the Growth and Intraspecific Competition of Bolboschoenus yagara Depend on Plant Density. Front. Plant Sci. 2019, 9, 1987. [Google Scholar] [CrossRef] [Green Version]
  35. Hoque, S.; Hope, R.; Arif, S.T.; Akhter, T.; Naz, M.; Salehin, M. A social-ecological analysis of drinking water risks in coastal Bangladesh. Sci. Total. Environ. 2019, 679, 23–34. [Google Scholar] [CrossRef]
  36. United Nations. Achieving Sustainable Development and Promoting Development Cooperation; United Nations Publication: New York, NY, USA, 2008.
  37. Scanlon, B.R.; Reedy, R.C.; Stonestrom, D.A.; Prudic, D.E.; Dennehy, K.F. Impact of land use and land cover change on groundwater recharge and quality in the southwestern US. Glob. Chang. Boil. 2005, 11, 1577–1593. [Google Scholar] [CrossRef]
  38. He, M.; Hogue, T.S. Integrating hydrologic modeling and land use projections for evaluation of hydrologic response and regional water supply impacts in semi-arid environments. Environ. Earth Sci. 2011, 65, 1671–1685. [Google Scholar] [CrossRef]
  39. Brown, J.; MacLeod, N. A site-based approach to delivering rangeland ecosystem services. Rangel. J. 2011, 33, 99–108. [Google Scholar] [CrossRef]
  40. Jackson, R.B.; Carpenter, S.R.; Dahm, C.N.; McKnight, D.M.; Naiman, R.J.; Postel, S.L.; Running, S.W. Water in a Changing world. Ecol. Appl. 2001, 11, 1027–1045. [Google Scholar] [CrossRef]
  41. Arunyawat, S.; Rajendra, P.S. Assessing Land Use Change and Its Impact on Ecosystem Services in Northern Thailand. Sustainability 2016, 8, 768. [Google Scholar] [CrossRef] [Green Version]
  42. Förster, J.; Barkmann, J.; Fricke, R.; Hotes, S.; Kleyer, M.; Kobbe, S.; Kübler, D.; Rumbaur, C.; Siegmund-Schultze, M.; Seppelt, R.; et al. Assessing ecosystem services for informing land-use decisions: A problem-oriented approach. Ecol. Soc. 2015, 20, 31. [Google Scholar] [CrossRef] [Green Version]
  43. Wami/Ruvu Basin Water Office (WRBWO). Business Plan; Wami/Ruvu Basin Water Office: Morogoro, Tanzania, 2008.
  44. Wami/Ruvu Basin Water Office (WRBWO). A Rapid Ecological Assessment of the Wami River Estuary, Tanzania. Global Water for Sustainability Program; Anderson, E.P., McNally, C., Eds.; Florida International University: Miami, FL, USA, 2007. [Google Scholar]
  45. Denier, L.; Burhenne-Guilmin, F. International Union for the Conservation of Nature (IUCN). Yearb. Int. Environ. Law 2010, 21, 590–609. [Google Scholar] [CrossRef]
  46. Lee, J.; Abdel-Aty, M.; Cai, Q. Intersection crash prediction modeling with macro-level data from various geographic units. Accid. Anal. Prev. 2017, 102, 213–226. [Google Scholar] [CrossRef]
  47. Mango, L.M. Modeling the Effect of Land Use and Climate Change Scenarios on the Water Flux of the Upper Mara River Flow, Kenya; Florida International University: Miami, FL, USA, 2017. [Google Scholar]
  48. Jideonwo, J.A. Ensuring sustainable water supply in Lagos, Nigeria. Master’s Thesis, University of Pennsylvania, Philadelphia, PA, USA, 2014. [Google Scholar]
  49. Coster, A.S.; Otufale, G.A. Household’s water-use demand and willingness to pay for improved water services in Ijebu-Ode local government area, Ogun state, Nigeria. J. Environ. Earth Sci. 2014, 4, 166–174. [Google Scholar]
  50. Ben, O.O.; Ogunyemi, F.O. Assessment of water supply situation in Owo, Ondo State, Nigeria: Implications for the Attainment of the Millennium Development Goals. Int. J. Sci. Res. Publ. 2015, 9, 1–6. [Google Scholar]
  51. United Nations. Resolution Adopted by the General Assembly the Human Right to Water and Sanitation; United Nations Publication: New York, NY, USA, 2010.
  52. Guppy, L.; Anderson, K. Water Crisis Report; United Nations University Institute for Water, Environment and Health: Hamilton, ON, Canada, 2017. [Google Scholar]
  53. Anteneh, Y.; Zeleke, G.; Gebremariam, E. Valuing the water supply: Ecosystem-based potable water supply management for the Legedadie-Dire catchments, Central Ethiopia. Ecol. Process. 2019, 8, 9. [Google Scholar] [CrossRef]
  54. Kurian, M.; Ardakanian, R. The nexus approach to governance of environmental resources considering global change. In Governing the Nexus: Water, Soil and Waste Resources Considering Global Change; Kurian, M., Ardakanian, R., Eds.; Springer: Dordrecht, The Netherlands, 2015. [Google Scholar]
  55. Pahl-Wostl, C. An Evolutionary Perspective on Water Governance: From Understanding to Transformation. Water Resour. Manag. 2017, 31, 2917–2932. [Google Scholar] [CrossRef]
  56. Shalaby, A.; Tateishi, R. Remote sensing and GIS for mapping and monitoring land cover and land-use changes in the Northwestern coastal zone of Egypt. Appl. Geogr. 2007, 27, 28–41. [Google Scholar] [CrossRef]
  57. A Foley, J.; DeFries, R.; Asner, G.P.; Barford, C.; Bonan, G.; Carpenter, S.R.; Chapin, F.S.; Coe, M.T.; Daily, G.C.; Gibbs, H.K.; et al. Global Consequences of Land Use. Science 2005, 309, 570–574. [Google Scholar] [CrossRef] [PubMed] [Green Version]
  58. Allan, T.; Meyer, W.B.; Turner, B. Changes in Land Use and Land Cover: A Global Perspective. Geogr. J. 1996, 162, 107. [Google Scholar] [CrossRef]
  59. Ojima, D.S.; Galvin, K.A.; Turner, B.L.; Houghton, R.A.; Skole, D.L.; Chomentowski, W.H.; Salas, W.A.; Nobre, A.D.; Kummer, D.M.; Moran, E.F.; et al. Global impact of land-cover change. Bioscience 1994, 44, 300–356. [Google Scholar] [CrossRef]
  60. Quétier, F.; Lavorel, S.; Thuiller, W.; Davies, I. Plant-trait-based modeling assessment of ecosystem-service sensitivity to land-use change. Ecol. Appl. 2007, 17, 2377–2386. [Google Scholar] [CrossRef]
  61. Wu, K.-Y.; Ye, X.-Y.; Qi, Z.-F.; Zhang, H. Impacts of land use/land cover change and socioeconomic development on regional ecosystem services: The case of fast-growing Hangzhou metropolitan area, China. Cities 2013, 31, 276–284. [Google Scholar] [CrossRef]
  62. Mohan, M.; Pathan, S.K.; Narendrareddy, K.; Kandya, A.; Pandey, S. Dynamics of Urbanization and Its Impact on Land-Use/Land-Cover: A Case Study of Megacity Delhi. J. Environ. Prot. 2011, 2, 1274–1283. [Google Scholar] [CrossRef] [Green Version]
  63. Li, S.; Yang, H.; Lacayo-Emery, M.; Liu, J.; Lei, G. Impacts of Land-Use and Land-Cover Changes on Water Yield: A Case Study in Jing-Jin-Ji, China. Sustainability 2018, 10, 960. [Google Scholar] [CrossRef] [Green Version]
  64. Das, M.; Das, A. Dynamics of Urbanization and its impact on Urban Ecosystem Services (UESs): A study of a medium size town of West Bengal, Eastern India. J. Urban Manag. 2019, 3, 420–434. [Google Scholar] [CrossRef]
  65. Wilson, C. Land use/land cover water quality nexus: Quantifying anthropogenic influences on surface water quality. Environ. Monit. Assess. 2015, 187, 424. [Google Scholar] [CrossRef] [PubMed]
  66. Huang, J.; Zhan, J.; Yan, H.; Wu, F.; Deng, X. Evaluation of the Impacts of Land Use on Water Quality: A Case Study in The Chaohu Lake Basin. Sci. World J. 2013, 2013, 329187. [Google Scholar] [CrossRef] [PubMed] [Green Version]
  67. Kanianska, R. Agriculture and Its Impact on Land-Use, Environment, and Ecosystem Services Landscape Ecology-The Influences of Land Use and Anthropogenic Impacts of Landscape Creation; Almusaed, A., Ed.; InTech Pub.: London, UK, 2016; pp. 3–26. [Google Scholar]
  68. McMichael, A.J.; Scholes, R.; Hefny, M.; Pereira, H.M.; Palm, C.; Foale, S. Linking Ecosystem Services and Human Well-being. In Ecosystems and Human Well-being: Multiscale Assessment; Millennium Ecosystem Assessment, Series; Capistrano, D., Samper, K.C., Lee, M.J., Raudsepp-Hearne, C., Eds.; Island Press: Washington, DC, USA, 2005. [Google Scholar]
  69. Blumstein, M.; Thompson, J.R. Land-use impacts on the quantity and configuration of ecosystem service provisioning in Massachusetts, USA. J. Appl. Ecol. 2015, 52, 1009–1019. [Google Scholar] [CrossRef]
  70. Sharma, R.; Rimal, B.; Baral, H.; Nehren, U.; Paudyal, K.; Sharma, S.; Rijal, S.; Ranpal, S.; Acharya, R.P.; Alenazy, A.A.; et al. Impact of Land Cover Change on Ecosystem Services in a Tropical Forested Landscape. Resources 2019, 8, 18. [Google Scholar] [CrossRef] [Green Version]
  71. Maksimović, Č.; Kurian, M.; Ardakanian, R. Rethinking Infrastructure Design for Multi-Use Water Services; Springer Science and Business Media LLC: Berlin/Heidelberg, Germany, 2015. [Google Scholar]
  72. Davids, R.; Rouget, M.; Boon, R.; Roberts, D. Spatial analyses of threats to ecosystem service hotspots in Greater Durban, South Africa. PeerJ 2018, 6, e5723. [Google Scholar] [CrossRef]
  73. Metzger, M.J.; Rounsevell, M.; Acosta-Michlik, L.; Leemans, R.; Schröter, D. The vulnerability of ecosystem services to land use change. Agric. Ecosyst. Environ. 2006, 114, 69–85. [Google Scholar] [CrossRef]
  74. Gordon, L.J.; Peterson, G.D.; Bennett, E.M. Agricultural modifications of hydrological flows create ecological surprises. Trends Ecol. Evol. 2008, 23, 211–219. [Google Scholar] [CrossRef]
  75. Terrado, M.; Honey-Rosés, J.; Acuña, V.; Sabater, S. Ecosystem Services in an Impacted Watershed. In The Handbook of Environmental Chemistry; Springer Science and Business Media LLC: Berlin/Heidelberg, Germany, 2012; Volume 21, pp. 347–368. [Google Scholar]
  76. Sintayehu, D.W. Impact of climate change on biodiversity and associated key ecosystem services in Africa: A systematic review. Ecosyst. Heal. Sustain. 2018, 4, 225–239. [Google Scholar] [CrossRef] [Green Version]
Figure 1. Location of the study area of the Wami River Basin within Tanzania.
Resources 09 00037 g001
Figure 2. LU/LC change graph for 2011 and 2016 at the Kinyasungwe sub-catchment.
Resources 09 00037 g002
Figure 3. LULC changes in 2011–2016 at the Kinyasungwe sub-catchment.
Resources 09 00037 g003
Figure 4. Graph showing LU/LC change impacts on water point characteristics.
Resources 09 00037 g004
Figure 5. Spatial coverage index analysis at the Wami and Kinyasungwe sub-catchments. 1–highest coverage, 2–high coverage, 3–average coverage, 4–below coverage and 5–lowest coverage.
Resources 09 00037 g005
Figure 6. LU/LC change graph for 2011 and 2016 at the Wami sub-catchment.
Resources 09 00037 g006
Figure 7. LU/LC changes in 2011–2016 at the Wami sub-catchment.
Resources 09 00037 g007
Figure 8. Graph showing LU/LC change impacts on water point characteristics.
Resources 09 00037 g008
Figure 9. Results of the spatial index at the Wami sub-catchment. 1–highest coverage, 2–high coverage, 3–average coverage, 4–below coverage and 5–lowest coverage.
Resources 09 00037 g009
Table 1. LU/LC classification scheme.
ClassDescriptions
BushlandMainly comprised of plants that are multi-stemmed from a single root base.
WoodlandAn assemblage of trees with canopy ranging from 20% to 80% but which may, on rare occasions, be closed entirely.
SwampThe low-lying, uncultivated ground where water collects; a bog or marsh.
Cultivated landCrop fields and fallow lands.
Settlement areaResidential, commercial, industry, transportation, roads, mixed urban.
GrasslandMainly composed of grass.
ForestThe continuous stand of trees, many of which may attain a height of 50 m including natural forest, mangrove and plantation forest.
WaterRiver, open water, lakes, ponds and reservoirs.
Open landThe land area of exposed soil and barren area influenced by a human.
AirfieldArea of the plot set aside for the take-off, landing and maintenance of aircraft.
Table 2. Description of typologies in the water point mapping system.
QueryingDescription
FunctionalReference to the functionality of a water point indicating that it yields water regularly and is used daily
Non-functionalReference to the functionality of a water point indicating that it does not yield water for any reason (hardware problem, dry source, or poor management)
SufficientA dimensionless quantity to which no physical dimension is applicable and where the amount of water satisfies human needs (based on user perspective)
InsufficientA dimensionless quantity to which no physical dimension is applicable and where the amount of water does not satisfy human needs
DryWaterpoint characterized by an absence of water
Good water qualityA qualitative statement on the condition of water relative to the desires of human needs based on user perspective, referred to as clear water which does not taste salty
Poor water qualityA qualitative statement on the condition of water relative to the desires of human needs based on user perspective, referred to as salty, coloured, and/or fluoride water
Table 3. LU/LC classification accuracy at the Kinyasungwe sub-catchment and Wami sub-catchment [2].
Kinyasungwe Sub-CatchmentWami Sub-Catchment
Year2011201620112016
LU/LCUAPAUAPAUAPAUAPA
Bushland99.5399.1093.4199.2810010080.65100
Woodland98.8710096.6298.1593.8986.9593.8085.84
Swamp90.3392.2990.3977.5495.4997.1689.9196.13
Cultivated land70.0276.3097.4076.3297.0795.3697.7894.72
Settlement area77.8790.3910050.4510010064.68100
Grassland97.6198.7195.9698.3174.4263.2499.6571.44
Water70.1541.7210032.9570.0134.92100.2211.82
Forest10010093.87100100100100100
Open land10010010010085.6879.9689.3476.93
Airfield99.1710096.8096.4393.0299.9897.5698.25
Overall97.2691.6994.9291.25
Kappa0.930.950.790.76
Table 4. Results of the LU/LC classification for 2011 and 2016 at the Kinyasungwe sub-catchment [2].
Year201120162011–2016
LU/LC (Area)Area (km2)%Area (km2)%Area(km2)%
Bushland4646.9427.724320.2425.77−326.7−1.95
Woodland4770.8628.464705.6328.07−65.23−0.39
Swamp775.954.63754.234.50−21.72−0.13
Cultivated land3210.8819.163763.7922.45+552.91+3.29
Settlement area108.340.65169.111.01+60.77+0.36
Grassland3168.5218.92965.0917.69−203.43−1.21
Water13.880.0824.960.15+11.08+0.07
Forest64.580.3956.890.34−7.69−0.05
Open land1.350.011.350.0100
Airfield0.390.010.390.0100
Total16,76210016,762100
Table 5. Diagnostics for heteroskedasticity and the spatial dependence weight matrix test for the Kinyasungwe sub-catchment.
TestKinyasungwe Sub-Catchment
MI/DFValueProbability
Breusch–Pagan test652.10920.0042
Moran’s I (error)0.12613.46090.0540
Table 6. The estimates of the spatial lag model for the Kinyasungwe sub-catchment.
VariableCoefficientStd. Errort-Statisticp-Value
Constant281.77760.8954.6270.0001
Bushland–0.00970.0047–2.0620.0396
Woodland–0.00190.0022–0.88390.3771
Swamp–0.00410.0023–1.77440.0764
Cultivated land0.00350.00281.26190.0207
Settlement area–0.00150.0069–0.22260.8240
Grassland–0.00800.0039–2.06550.0392
Table 7. Percentage of LU/LC change impacts based on water point characteristics.
CharacteristicsBLWLSPCLSTGL
Water Status
Functional41.38%83.33%39.13%42.73%28.75%49.79%
Non-functional58.62%16.67%60.87%57.22%71.25%50.21%
Water Quantity
Sufficient37.93%76.67%34.78%36.08%11.25%23.46%
Insufficient62.07%23.33%65.22%63.92%88.75%76.54%
Water Quality
Good41.38%86.67%78.26%53.48%31.25%62.96%
Poor58.62%13.33%21.74%46.52%68.75%37.04%
Note: BL—Bushland, WL—Woodland, SP—Swamp, CL—Cultivated land, ST—Settlement area, GL—Grassland.
Table 8. Results of the LU/LC classification for 2011 and 2016 at the Wami sub-catchment [2].
Year201120162011–2016
LU/LCArea (km2)%Area (km2)%Area (km2)%
Bushland1870.6712.981685.7511.69−184.92−1.29
Woodland8208.9256.947511.0252.10−697.90−4.84
Swamp310.242.15301.232.09−9.01−0.06
Cultivated land2679.3318.593655.9625.36+977.09+6.77
Settlement area22.730.1668.860.48+46.13+0.33
Grassland632.794.39532.343.69−100.45−0.70
Water24.740.1726.050.18+1.31+0.01
Forest660.144.58627.884.36−32.26−0.22
Open land6.320.046.320.0400
Total14,41510014,415100
Table 9. Diagnostics for heteroskedasticity and the spatial dependence weight matrix test for the Wami sub-catchment.
TestWami Sub-Catchment
MI/DFValueProbability
Breusch–Pagan test645.18390.0093
Moran’s I (error)0.704832.57920.0070
Table 10. The estimates of the spatial lag model for the Wami sub-catchment.
VariableCoefficientStd. Errort-Statisticp-Value
Constant5399.46228.93623.5850.0000
Bushland0.00520.00133.8840.0001
Woodland–0.02620.006–4.3030.0002
Swamp–0.00590.0069–0.22260.8240
Cultivated land–0.00280.00068–4.14740.0004
Settlement area0.000080.00070.01190.9903
Grassland–0.04110.0062–6.60030.0010
Table 11. Percentage of LU/LC change impacts based on water point characteristics.
CharacteristicsBLWLSPCLSTGL
Water Status
Functional81.40%75.00%50.00%63.00%76.70%60.00%
Non-functional18.60%25.00%50.00%37.00%23.30%40.00%
Water Quantity
Sufficient98.80%84.40%34.78%75.40%91.30%100.00%
Insufficient1.20%15.60%65.22%27.50%8.70%0.00%
Water Quality
Good98.80%90.60%100.00%53.48%91.20%100.00%
Poor1.20%9.40%0.00%46.52%8.80%0.00%
Note: BL—Bushland, WL—Woodland, SP—Swamp, CL—Cultivated land, ST—Settlement area, GL—Grassland.