Article

Creating Social Handprints: Method and Case Study in the Electronic Computer Manufacturing Industry

1
NewEarth B, Harvard Extension, 51 Brattle St, Cambridge, MA 02138, USA
2
MIT Sustainability and Health Initiative for NetPositive (SHINE), 77 Massachusetts Ave, Cambridge, MA 02139, USA
3
Dell, One Dell Way, Round Rock, TX 78682, USA
*
Author to whom correspondence should be addressed.
Resources 2019, 8(4), 176; https://doi.org/10.3390/resources8040176
Submission received: 27 June 2019 / Revised: 23 October 2019 / Accepted: 9 November 2019 / Published: 20 November 2019

Abstract

:
This article introduces a process that can be used by companies to obtain an increasingly precise picture of their supply chain social footprint (negative impacts) and identify potential social handprints (i.e., changes to business as usual that create positive impacts) using social organizational life cycle assessment (SO-LCA). The process was developed to apply to the electronics sector but can be used by companies in any industry. Our case study presents the social footprint of a typical US computer manufacturing company and identifies potential salient social risks and hotspots using generic information about the inputs that are related to a global trade model. The global trade model enables us to map the likely supply chain based on where inputs are usually sourced from by the US electronic computer manufacturing sector. In order to identify material impacts, normalization factors were created and used. Once the material impacts and salient risks are known, it becomes necessary to identify root causes in order to plan actions that will truly make a meaningful change, addressing the issues at stake. The article concludes by establishing a methodology that enables the use of the industry-level impacts and assessment in combination with the organization’s own data to calculate company-specific results.

1. Introduction

Until recently, the primary focus of sustainability assessments was to assess and reduce the harmful impacts or footprint of organizations and product’s life cycles. In the last decade, the concept of handprints was created and popularized [1]. It is an innovative and holistic approach to enable the measurement, evaluation, and communication of the environmental and social sustainability positive impacts of products and organizations.
The objective of this research was to present a practical method and process for companies to assess the impact of the changes they make to improve their social impacts (reducing their social footprint and growing their social handprint). Here, we demonstrate the method using generic data but also describe a process where the generic data can be changed with increasingly more specific information available from the company and its supply chain. We start by calculating a typical computer manufacturing company social footprint and identifying salient risks and social hotspots to highlight what could be potential handprint areas. Handprints are the changes that we bring, compared to business as usual, which create positive impacts (reducing our footprint, namely, our own and that of others) [2]. The proposed and applied framework was developed taking in account the broader work of the Net Positive Project, chaired by Business for Social Responsibility (BSR), Forum for the Future, and the Sustainability and Health Initiative for NetPositive (SHINE), by the Massachusetts Institute of Technology (MIT) [2].
Our research question is as follows: Can social life cycle assessment (LCA) be applied to quantitatively evaluate the impact of such changes?
Hence, the method at the core of our framework is social life cycle assessment. Social life cycle assessment (S-LCA) is a technique used to assess the social and socioeconomic (the word social will be used here to cover both social and socioeconomic impacts for brevity) impacts of products or organizations along their life cycle from the extraction of raw materials to final disposal (cradle to grave approach).
S-LCAs can be applied to products, organizations, countries, and consumer supply chains and life cycles, just as it can be applied to environmental LCA [3]. In this study, we apply it at the level of the organization. This is referred to as social organizational life cycle assessment (SO-LCA). Life cycle assessment deploys a combination of methods, models, and data. S-LCA methods can be found in reference documents like the social LCA Guidelines published by the United Nations Environment Programme and the Society for Eco-Toxicology and Chemistry (referred to as S-LCA guidelines), the Pré Roundtable Handbook for social impact assessment [4,5], and numerous journal articles (such as [6,7,8]). Models are used to provide a representation of a product system, where several types can be used. Data are the engine that enable the assessment to take place [9]. Commercial approaches to social LCA are increasingly available.
S-LCA employs the modeling capabilities and systematic assessment process of LCA combined with relevant social sciences methods [10]. The social aspects assessed in S-LCA are those that may affect stakeholders positively or negatively across the supply chain or life cycle of a product/organization. The impact categories covered are largely defined by the international community through its policy frameworks and other social responsibility references, and in respect to best available science (a top down approach) [11]. It follows the same four phases of life cycle assessment as defined by ISO 14040: Goal and Scope, Life Cycle Inventory, Life Cycle Impact Assessment, and Interpretation, as described in the social LCA Guidelines [4].
The choice of the electronic computer manufacturing industry for our case study was made as it is the one that corresponds better to Dell. It is also interesting because electronic products were among the first to be assessed using S-LCA in case studies [12]. Several articles have been published detailing the process and the identified social hotspot results of studies conducted on laptops [13,14,15,16], mobile phones [17], or electronics waste recycling [18]. It is not surprising, because the electronics industry has been a leader in social responsibility in many respects, including in establishing a common code of conduct for its entire industry, via the Electronic Industry Citizenship Coalition (EICC) which is now called the Responsible Business Alliance [19]. The industry is also concerned by conflict minerals regulations in many countries and regions (for instance the EU Conflict Minerals Regulation that will take effect on 1 January 2021). However, the electronics industry is still very much challenged by numerous social and human rights incidents in its supply chains, despite its early efforts [20,21,22]. Being the purveyors of indispensable consumer goods product, the electronics industry has a case to become an effective agent of change and thus increase its social handprints.
The process that we introduce can also be applied in the context of a human rights due diligence assessment. Human rights due diligence has been positioned as a key process to manage human rights impacts in company’s operation and business relationships by the UN guiding principles. They are increasingly conducted by companies and sometimes mandated by regulations (such as the French corporate duty of vigilance law [23]). Human rights due diligence is “an ongoing risk management process…in order to identify, prevent, mitigate and account for how [a company] addresses its adverse human rights impacts. It includes four key steps: Assessing actual and potential human rights impacts; integrating and acting on the findings; tracking responses; and communicating about how impacts are addressed” [24]. It includes a reasonable investigation of the human rights risks that may be present in a company’s supply chains. S-LCA is a tool that can contribute to this process.

2. Materials and Methods

The method developed for social net positive assessment starts with building an in-depth understanding of a company social footprint. These initial steps consist of an industry supply chain materiality and footprint assessment, a company supply chain hotspots and baseline assessment and baseline refinement as showed in Figure 1. They may also contribute to a human rights’ due diligence process [25].
In this case study, we will demonstrate the first step and describe the process to achieve the following ones.

2.1. Social LCA, SO-LCA and SHDB

Calculating a product social footprint or an organizational footprint follows the same process as conducting a social LCA. There is a specific guidance on organizational LCA (O-LCA) [26]. Which has been adapted for social LCA (S-LCA) [27]. Social organizational LCA (SO-LCA) complements S-LCA by broadening its scope from a product to an organization. It complements existing organizational approaches because it takes a life cycle perspective. From a practical standpoint, it allocates social indicators or impacts to the level of an organization (and its supply chains). The four phases of LCA, goal and scope, inventory, impact assessment and interpretation (as described in the ISO 14040 standard) still apply [27]. The main technical difference between S-LCA and SO-LCA is the need to determine a reference unit in SO-LCA instead of a functional unit (in S-LCA).
To calculate the footprint of an organization, data on purchases (expenditure data) are needed. Sometimes referred to as a social spend analysis, the expenditure data need to be organized and mapped to the supply chain model that will be used. Usually, not all expenditure data are relevant to calculate the social footprint and expenses of certain services (e.g., in the case of accounting or law firms) or fees (e.g., bank fees) can be discarded.
A quantitative approach to S-LCA is best implemented using a social impact database because of the extensive amount of data needing to be collected otherwise. The Social Hotspots Database (SHDB) is the first database for social LCA [28] which invented and demonstrated the benefits of life cycle attribute assessment [29], using a multiregional input/output (I/O) model, in combination with social risks information, which also developed and applied a fit for purpose impact assessment method. It is the only one to present a consistent country and sector model using a combination of both qualitative and quantitative indicators.
Once mapped to the product system model classification (e.g., Global Trade Analysis Project (GTAP) industries), data can be entered in the software (SimaPro in this case). Life cycle impact assessment can then take place, using either the default impact assessment method available in the SHDB or an adjusted method. Social hotspots and footprint results are calculated and made available by the software. This same analytical approach could be undertaken using other databases or software tools.
The model can then be refined, either by changing where inputs are sourced from (tier 1, 2, etc.), if this information is known, or by changing the risk level, such as when social audits or other such data exist and can support the change.

2.2. Goal and Scope

The goal and scope of the first part of this study was to measure the social footprint of a typical US computer manufacturing company and identify its salient social risks (issues such as child labor, freedom of association) and its social hotspots (country specific sectors). The reference (functional) unit used was 1 million dollars of output produced by a US computer manufacturing company.

2.3. Life Cycle Inventory

The inventory consists of two main items: The inputs or purchases information used to model the company system and the social risk information used.

2.3.1. Company System Model Data

Our starting point for the purchases’ information was the US Department of Commerce, Bureau of Economic Analysis (BEA), which releases detailed “benchmark input/output accounts” for the US economy every five years.
These accounts provide the most detailed data available on the purchases made by businesses in the US economy, in terms of the goods and services of other businesses. These purchases of so-called “intermediate inputs” are what create and structure supply chains.
The most recent benchmark I/O accounts subdivide the US economy into 389 sectors (“industries”), producing 389 different categories of goods or services (“commodities”) [30]. This most recent set of data reflects the purchases of commodities by industries during the year 2007. The data were used in a project by the United States Environmental Protection Agency (US EPA) [31] to develop an input/output LCA model of the US economy. We made use of this database in our project.
The electronic computer manufacturing industry corresponds to NAICS Code 334111. From the NAICS documentation: “This US industry comprises establishments primarily engaged in the manufacturing and/or assembly of electronic computers, such as mainframes, personal computers, workstations, laptops, and computer servers. Computers can be analog, digital, or hybrid. Digital computers, the most common type, are devices that do all of the following: (1) Store the processing program or programs and the data immediately necessary for the execution of the program; (2) can be freely programmed in accordance with the requirements of the user; (3) perform arithmetical computations specified by the user; and (4) execute, without human intervention, a processing program that requires the computer to modify its execution by logical decision during the processing run. The manufacture of computers includes the assembly or integration of processors, coprocessors, memory, storage, and input/output devices into a user-programmable final product.”
The data from BEA show this sector purchasing 171 different intermediate inputs (the output of other businesses). They further specify the value spent on each of these inputs in order to produce a given amount (say $1000) of product (e.g., computers), where the value reflects the revenues to the companies in this sector, and does not include other margins such as transport, wholesaling, and retailing. The total value of these purchased intermediate inputs to produce $1000 of output is $448.
We rank-ordered the 171 purchased inputs to US computer manufacturing and identified the 63 inputs that collectively represent 99% of the total expenditure. The lowest expenditure value among this set of 63 is just 18 cents per $1000 of output. The purchasing amounts for each of these 63 inputs were then used as the basis for the subsequent analysis.
The US I/O tables do not specify the countries from which these purchased inputs were sourced. For this information, we made use of the detailed trade data provided within the GTAP database [32]. This database divides the economies of each of its countries and regions into a total of 57 sectors. Companies producing computers are contained within the GTAP sector “electronic equipment”, which manufacture “office, accounting, and computing machinery, and radio, television, and communication equipment and apparatus.” The purchases of intermediate goods by this sector thus are specified as coming from specific sectors in specific countries. We mapped the purchased inputs by the detailed US BEA computer manufacturing sector to the appropriate sector within the GTAP database (This is showed in the supplementary material provided). The 63 detailed inputs corresponded to a set of 24 GTAP commodities. And for each of these 24 GTAP commodities, the GTAP database provided an estimate of the trade shares for purchases by the US “electronic equipment” sector. We eliminated trade shares of less than 0.04% for a single commodity. That is, if the commodity was sourced from multiple countries, we included all sourcing countries whose share of supply for that commodity was equal to or greater than 0.04%. Several of these inputs are purchased virtually entirely from other businesses in the US. Here, examples include providers of construction services, but many others are sourced from a large number of countries. The commodity with the greatest number of source countries was “electronic equipment,” for which there were 29 source countries at or above 0.04% of supply, including supply from within the US. All told, the 24 commodities correspond to a total of 101 country-specific sectors supplying computer manufacturing in the US.
We completed our model of the global supply chain for the US computer manufacturing sector as follows: A process was created, which made purchases of 63 different inputs, corresponding to 99% of the expenditure, within the detailed BEA database. Then, each of these inputs was modeled as coming from one or more countries, with trade shares specific to that GTAP commodity into the US electronic equipment sector based on GTAP data. These purchased inputs link to country-specific sectors in the social hotspot database, and this provides for social life cycle assessment of the supply chain for US computer manufacturers.

2.3.2. Social Risks Information

As already noted, we used the social hotspots database in the SimaPro software to conduct the first assessment steps of this study.
The social hotspots database is designed to be a modular system, which includes four main components:
  • A trade or supply chain model, such as a global input/output model (we used GTAP V7 here);
  • A worker hours model;
  • Data on social risks and opportunities;
  • An impact assessment method (social hotspots index).
Technically, the SHDB is an extended input/output life cycle inventory database, providing a solution to enable (1) the modeling of product systems and (2) the initial assessment of potential social impacts. The SHDB contains data for 57 different sectors, in each of 244 countries and territories. Thus, there is social risk data for 13,908-unit processes in the database, 6441 of which are accessible using the SHDB in SimaPro V3. Social impact databases use life cycle attribute assessment [29] to quantitatively relate risks or impacts to the full supply chain scope. Here, the assessment calculates the percentage of a supply chain activity variable, which possesses an attribute of interest. The preferred but imperfect attribute of interest in social LCA is worker hours, because it is a good indication of a business’ supply chain presence intensity. The worker hours by country and sectors were calculated by dividing the payment of wages by the country and sector (supplied by GTAP) by the average wage by country and sector (information compiled by SHDB).
The SHDB provides information on 18 social impact subcategories (as shown below in Figure 2) and over 155 different indicators. The risk data address five main impact categories: Labor rights and decent work, human rights, health and safety, governance, and community in line, with major social responsibility references. The impact categories represent a grouping of the impact subcategories. The SHDB project draws upon hundreds of data sources, ranging from the International Labor Organization, the World Health Organization, the US Department of Labor and State, the World Bank, and more.
Quantitative statistics and qualitative information by country and sector are used to develop characterization models. These models assign a risk (or opportunity) level to the data (low, medium, high, very high, no data, and no evidence) so that users can identify target areas in their supply chains to verify or improve social conditions. This consistent assessment framework allows risk comparison to be made between countries and sectors.

2.4. Impact Assessment

In order to aggregate impacts for the entire supply chain and to help highlight potential hotspots, The SHDB includes a life cycle impact assessment method shown in Table 1. Considering the risk characterizations contained across the entire database, a weighting that represents the relative probability of an adverse situation to occur was developed. Relative probabilities are expressed in relation to the medium risk level.
This weighting augments or lower the number of workers hours depending on the risk level. In doing so, it helps identify hotspots or country specific sectors where the risk is elevated and the contribution to total worker hours is important. In the method, subcategories are weighted equally. Thus, the unit used to calculate results is Mrheq, which is the medium risk hours equivalent.
The SHDB provides us with three types of results: The social footprint, social hotspots, and salient risks results.
The social footprint result consists of the purchase supply chains total Mrheq. While this could be useful for comparing a specific company risks against a typical company, it is not relevant for the present study. However, it is helpful to identify which of the purchases supply chains contributes most to the overall risks (or Mrheq) and which of the impact categories have the highest associated Mrheq.
The social hotspots are the individual production activities/countries which contribute most to the risk (overall, by impact category or subcategory).
The salient social risks are the social impact subcategories that account for a greater share of the overall risk.

2.5. Normalization

All supply chains have at least some risks in all categories, however, each process is different in its risks (e.g., rice in China vs. rice in Bangladesh vs. wheat in the US, etc.) and each supply chain has different levels of output from each process. In this context, it can be difficult to identify which risks are most important, however, one way is with normalization.
As defined in ISO Standard 14044, normalization is a process to calculate the magnitude of the results of impact category indicators, relative to some reference information. The characterized results of each impact category are divided by a selected reference value, which brings all the results on the same scale.
The reference system can be:
  • The total inputs and outputs for a geographical given area over a given reference year (e.g., the impact of the US economy last year);
  • The total inputs and outputs for a geographical given area over a given reference year on a per capita basis (e.g., the impact of an American last year).
Normalization can be helpful in interpreting social LCA results, providing and communicating information on the relative significance of the impact category and subcategory results. The normalized results are easier to understand because they compare the results obtained. In our case, we are using method one, where we compare the US computer manufacturing company with all other US industries’ supply chain impacts for the reference year.
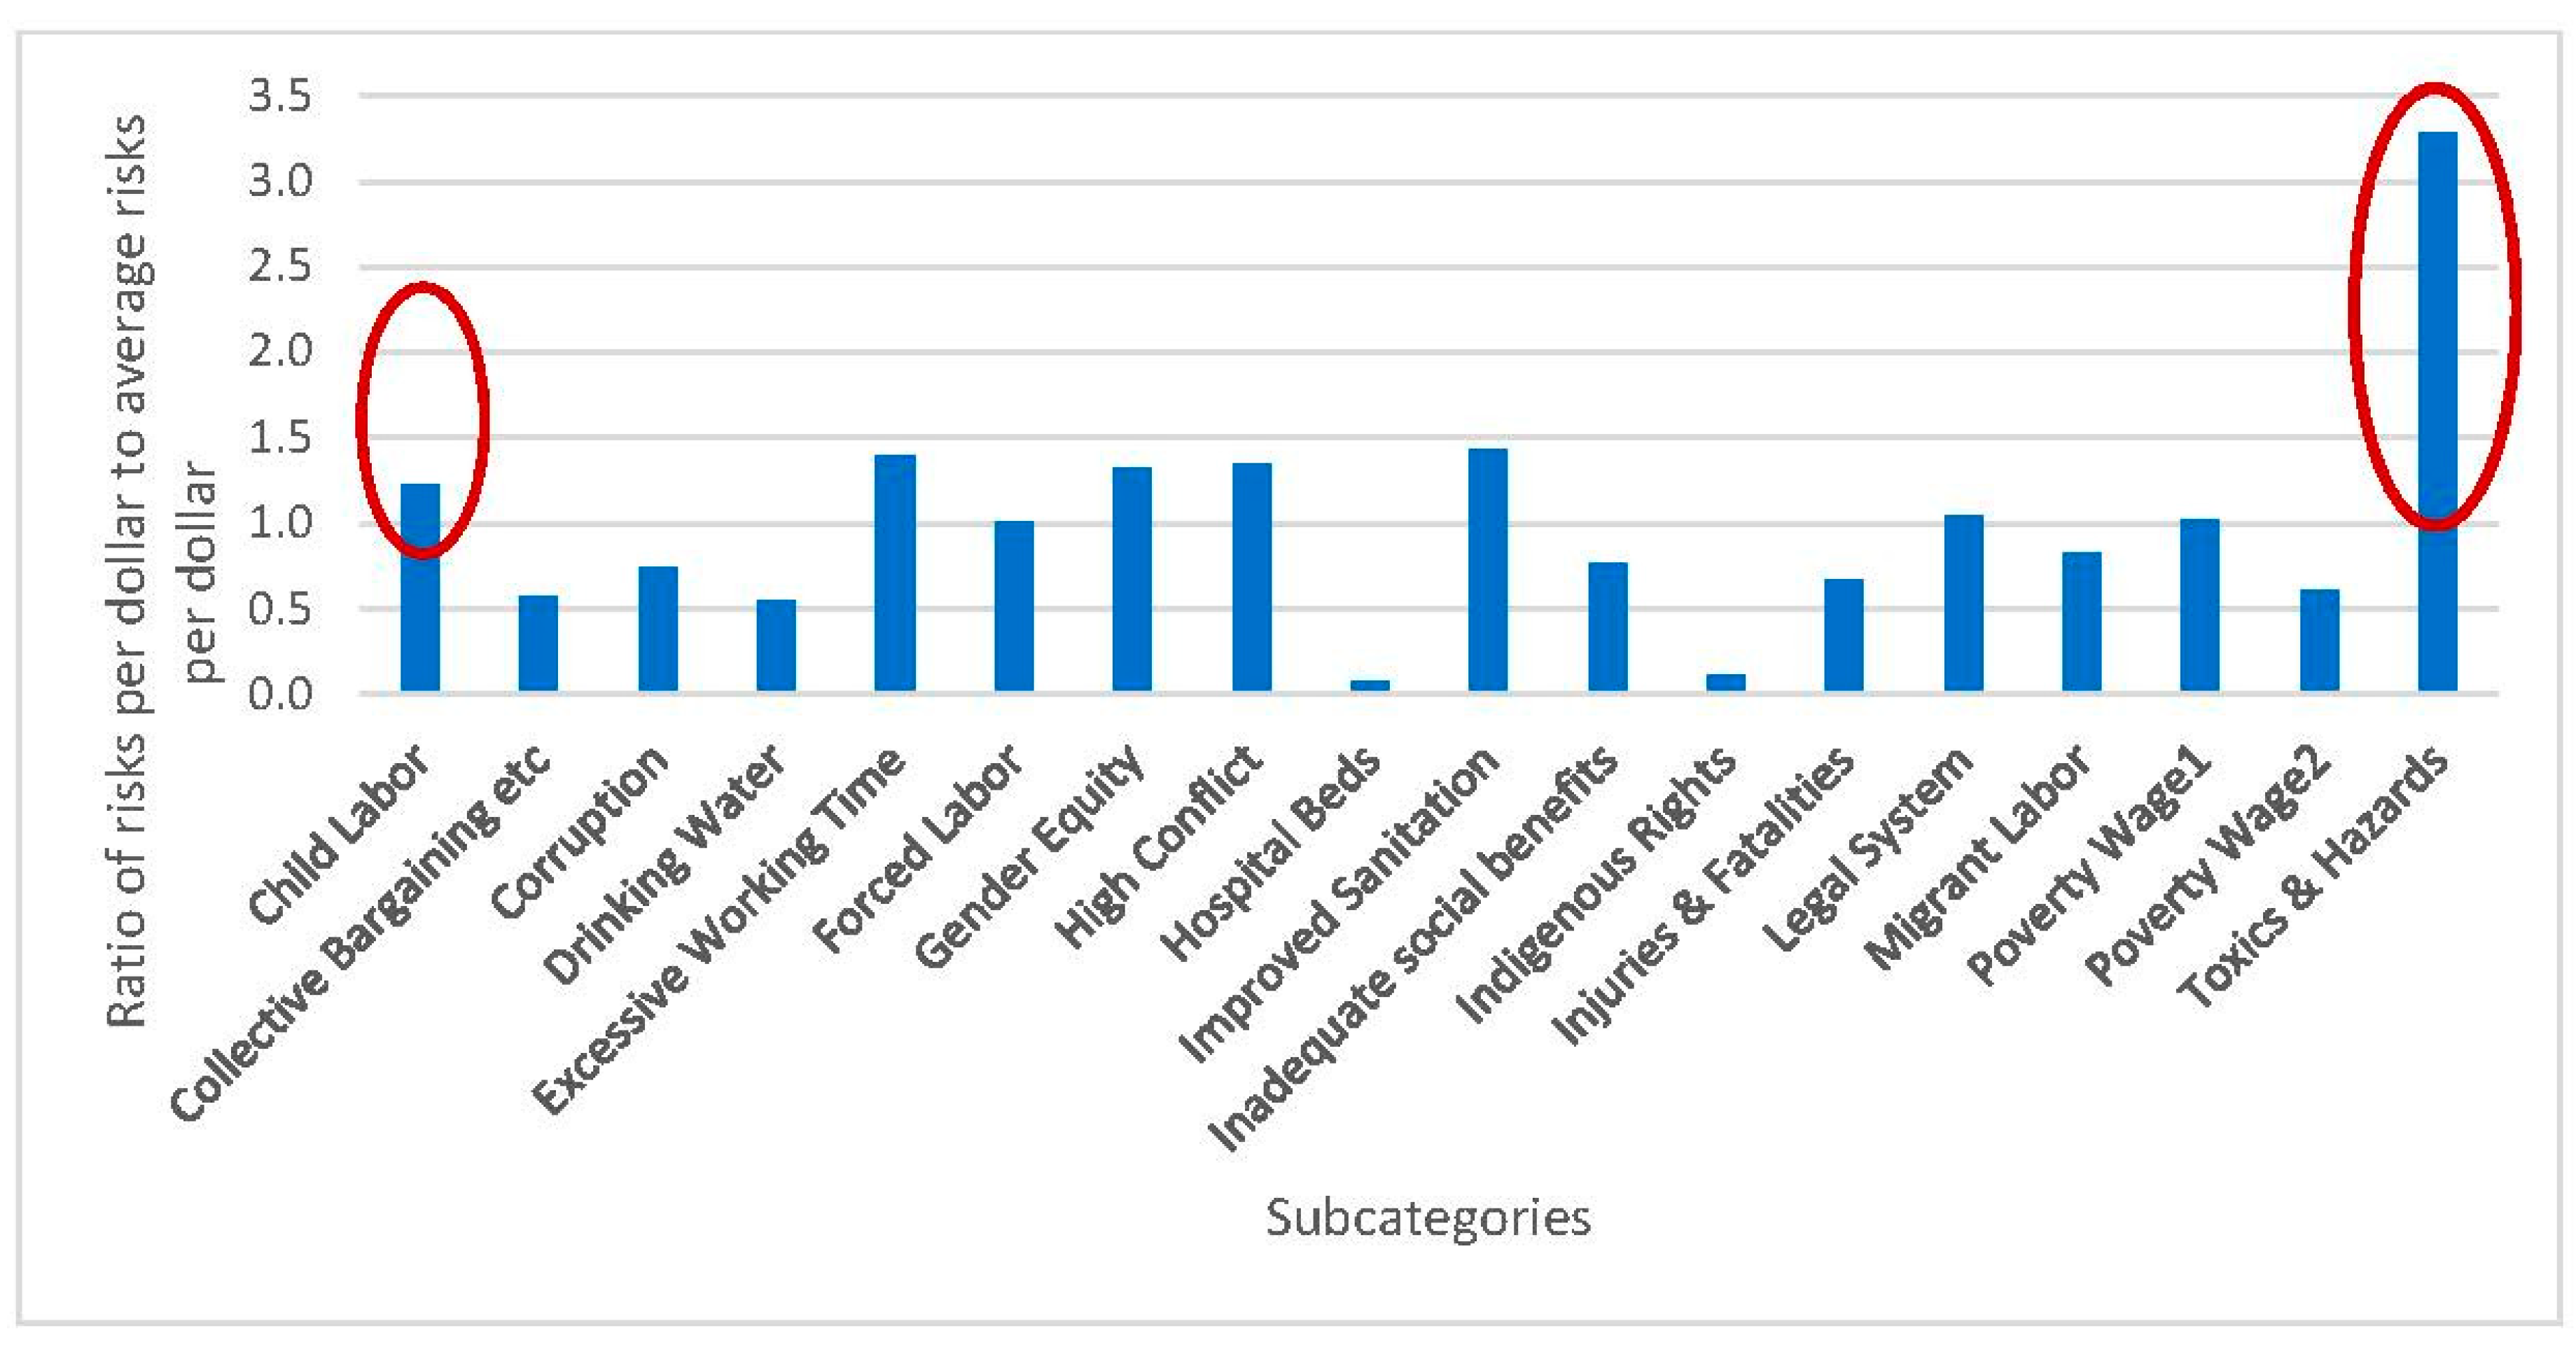
  • A normalized risk > 1 means a greater than average risk per dollar.
  • A normalized risk < 1 means a lower than average risk per dollar.
Higher normalized risk means higher leverage and the opportunity to make a difference

3. Results

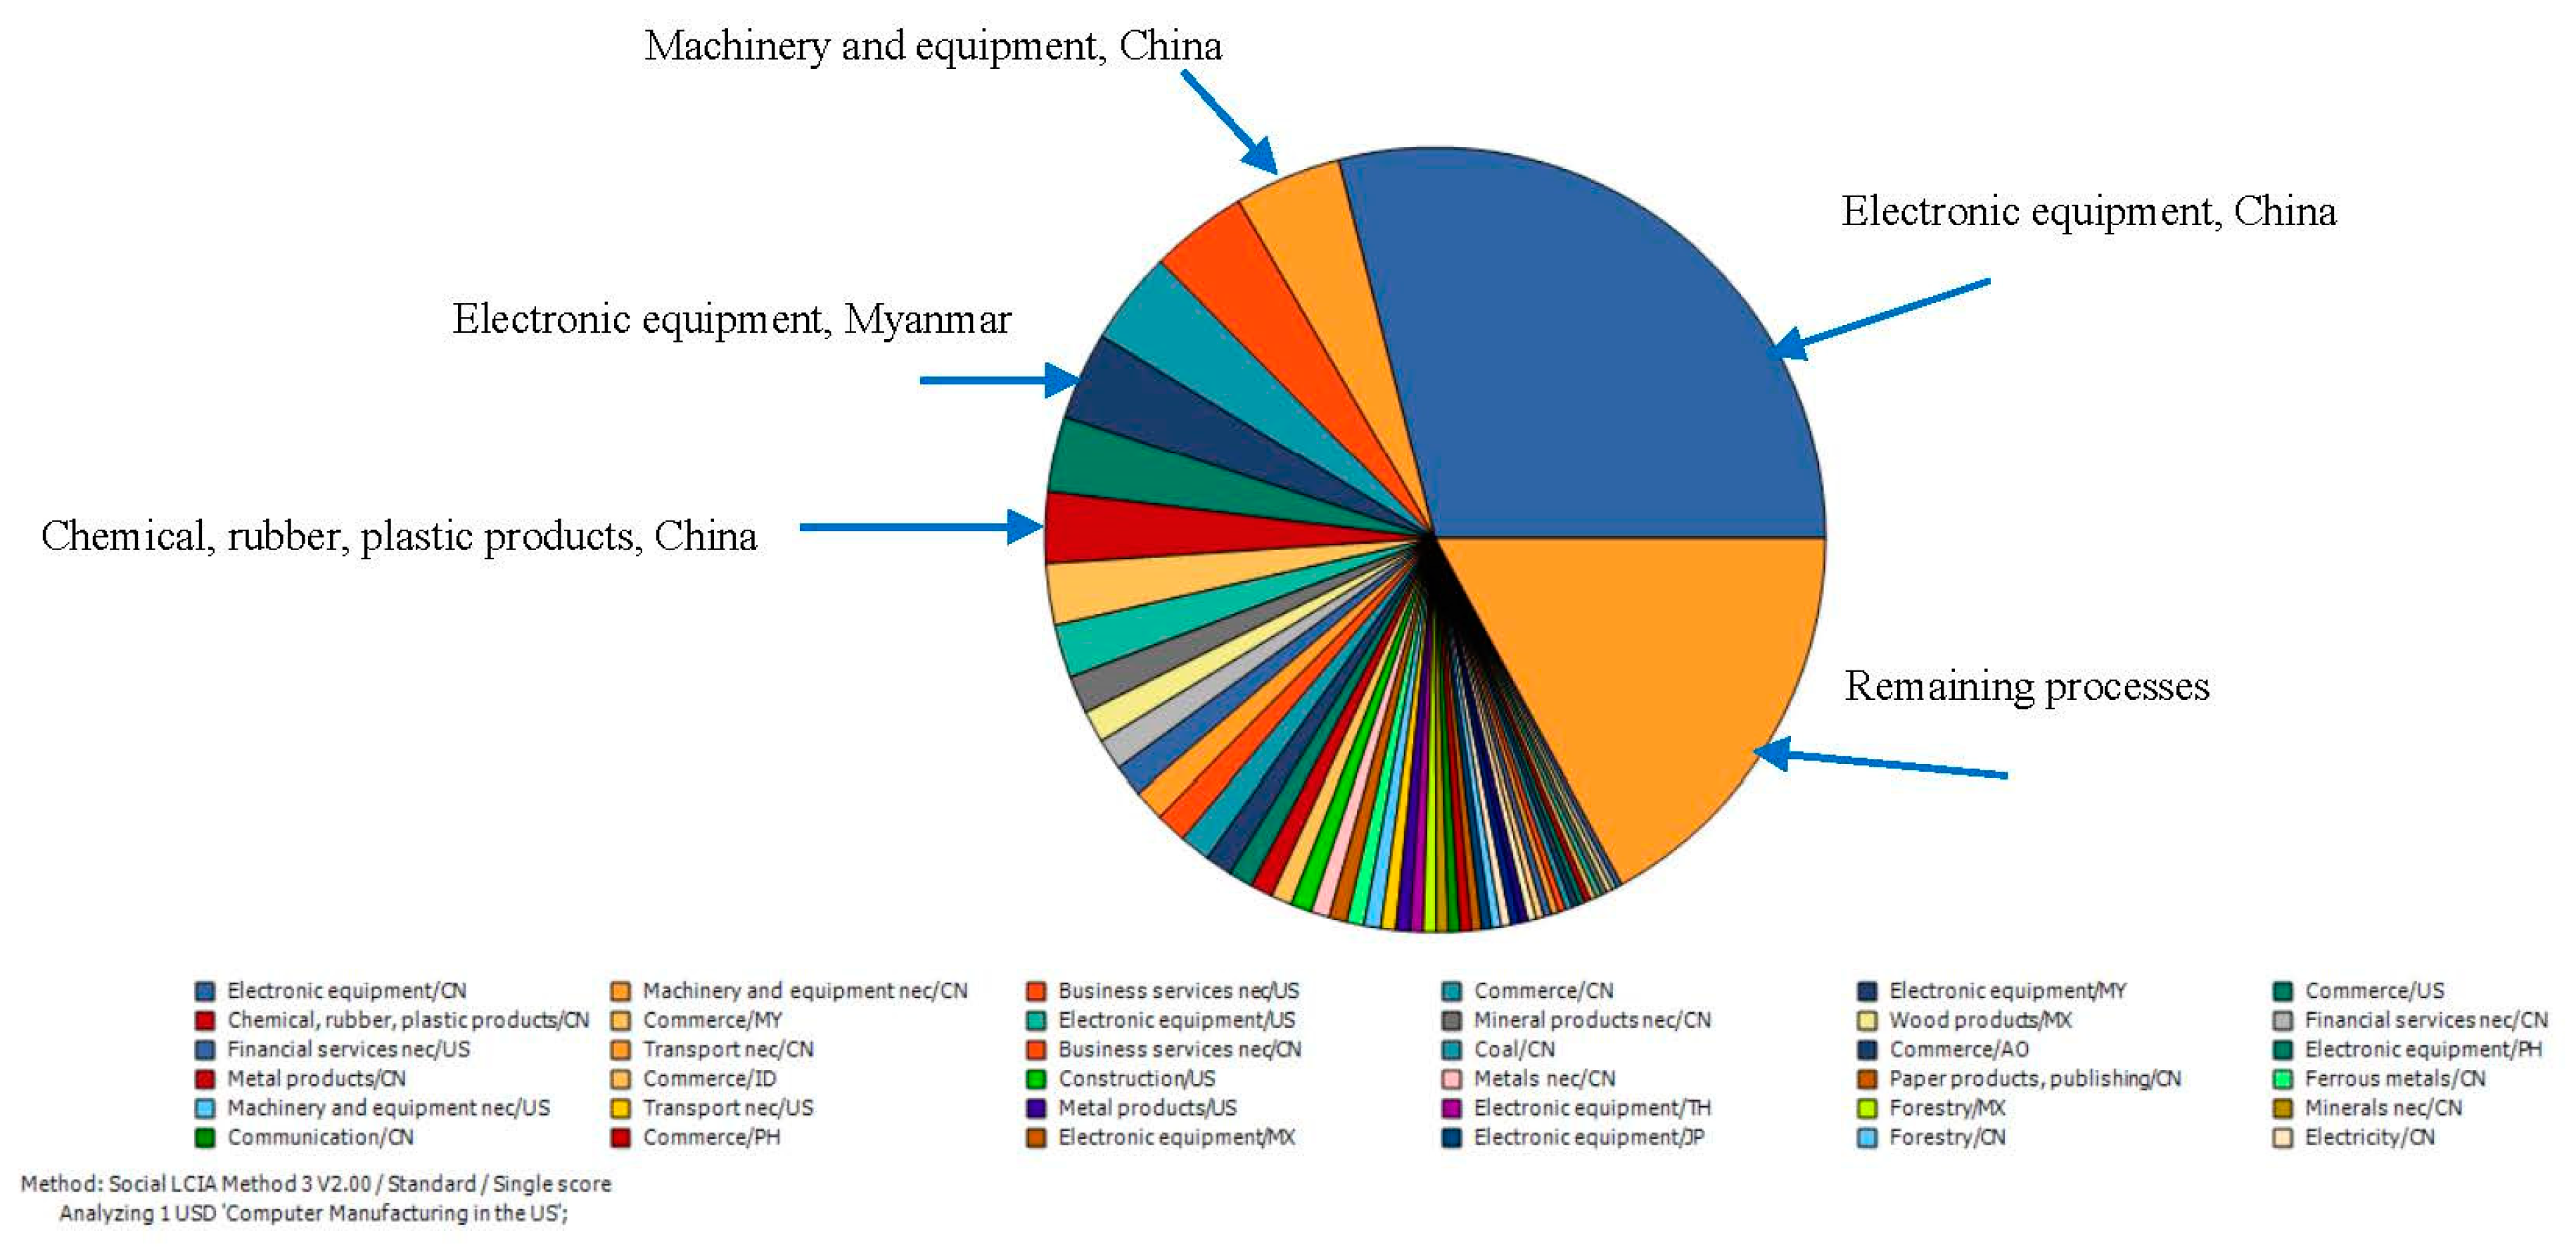
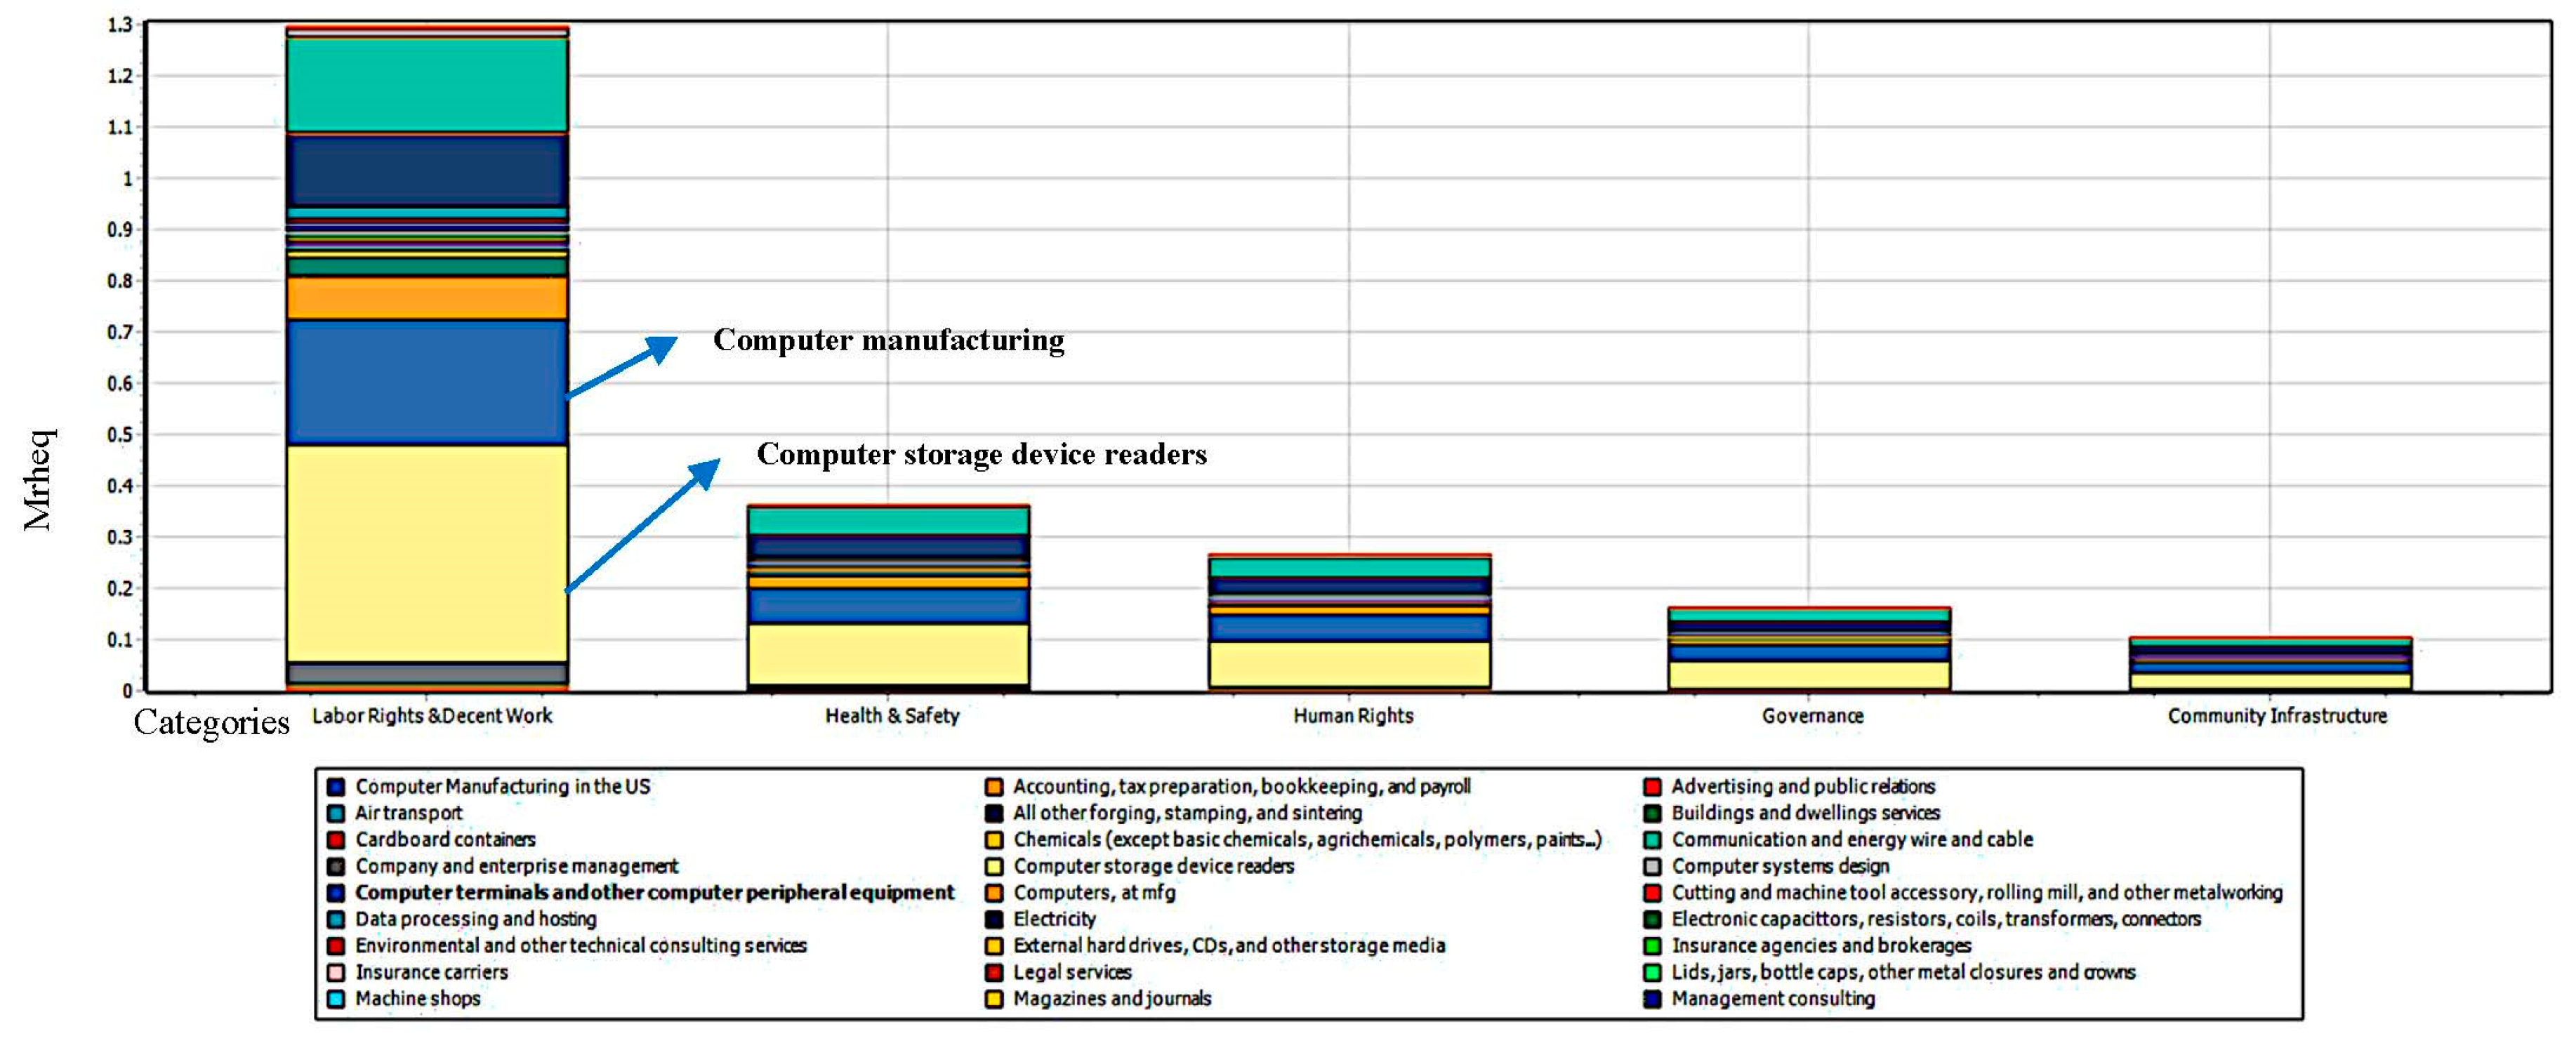
3.1. The Social Footprint

The social footprint result represents the total medium risk hours equivalent associated with all the inputs to the product system for each impact category. This is calculated, as stated in the methodology section, by combining the information on dollars spent, and labor intensity, and by multiplying it by the risk level factor for each indicator. These are supply chain results and as such involve the entire supply chain of the input or component. The indicators are aggregated using the impact assessment method to provide the results by impact category and subcategory. In the method used, the impact categories are weighted equally.
The computer storage device reader’s supply chain and the computer manufacturing’s supply chain are the two components supply chains contributing most to the total social footprint for each impact category. Figure 3 also shows that most of the risk is concentrated in the labor rights and decent work and health and safety impact categories.
On Figure 4, we see the percentage of contribution of each component’s supply chain by impact subcategory. In addition to the supply chains of computer storage device readers and computer manufacturing, we can see that the supply chains of communication and energy wire and cable, as well as the computer terminals and other peripheral equipment, are important contributors to the overall social footprint. The contribution varies slightly by impact subcategory, but mostly represents a similar share for each component supply chain. The components supply chain, with a smaller contribution, has greater variation in terms of risk contribution by impact subcategory. For instance, “company and enterprise management” in dark grey at the bottom of the figure has some significant contribution to the overall risk of inadequate social benefits, but very little contribution to forced labor risks.

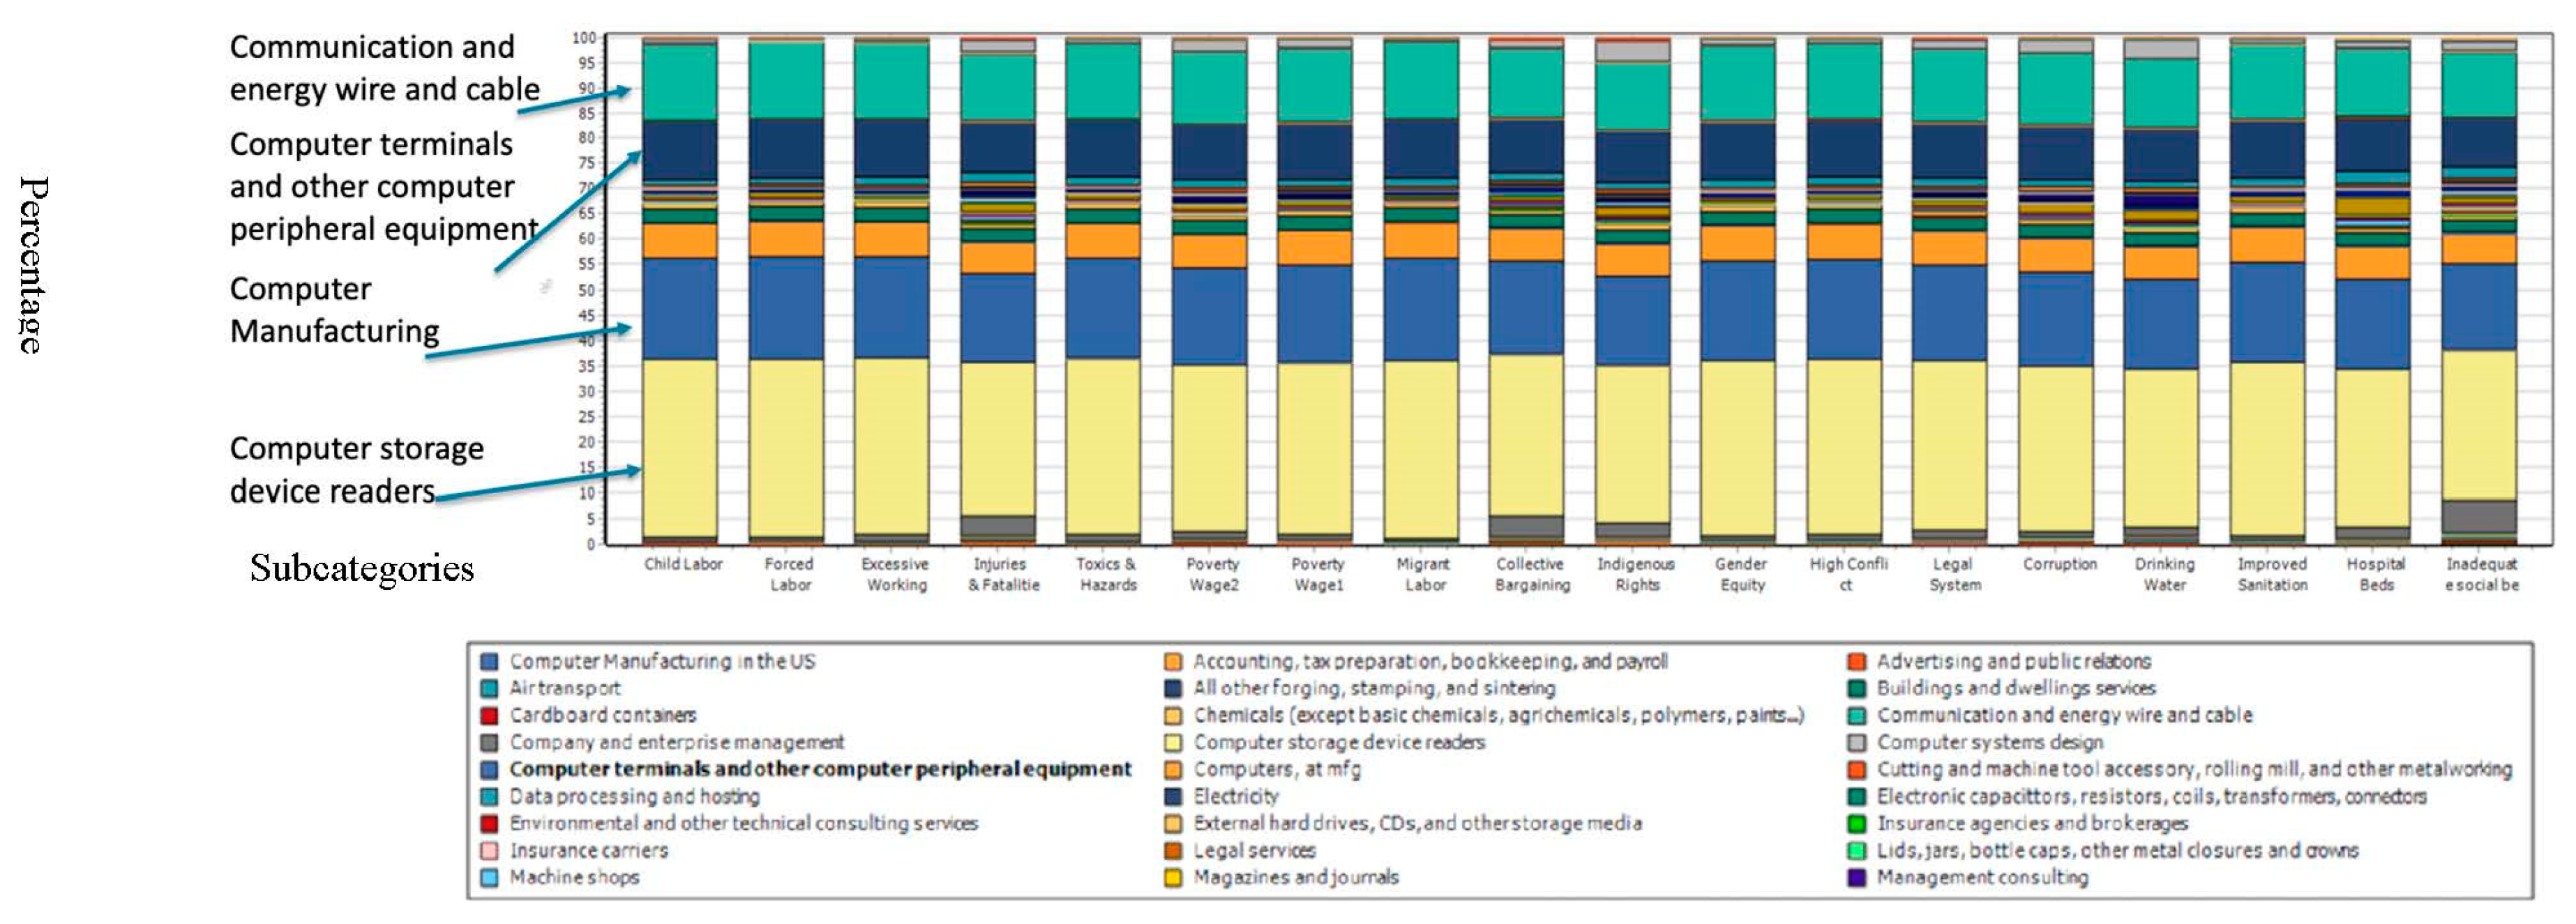
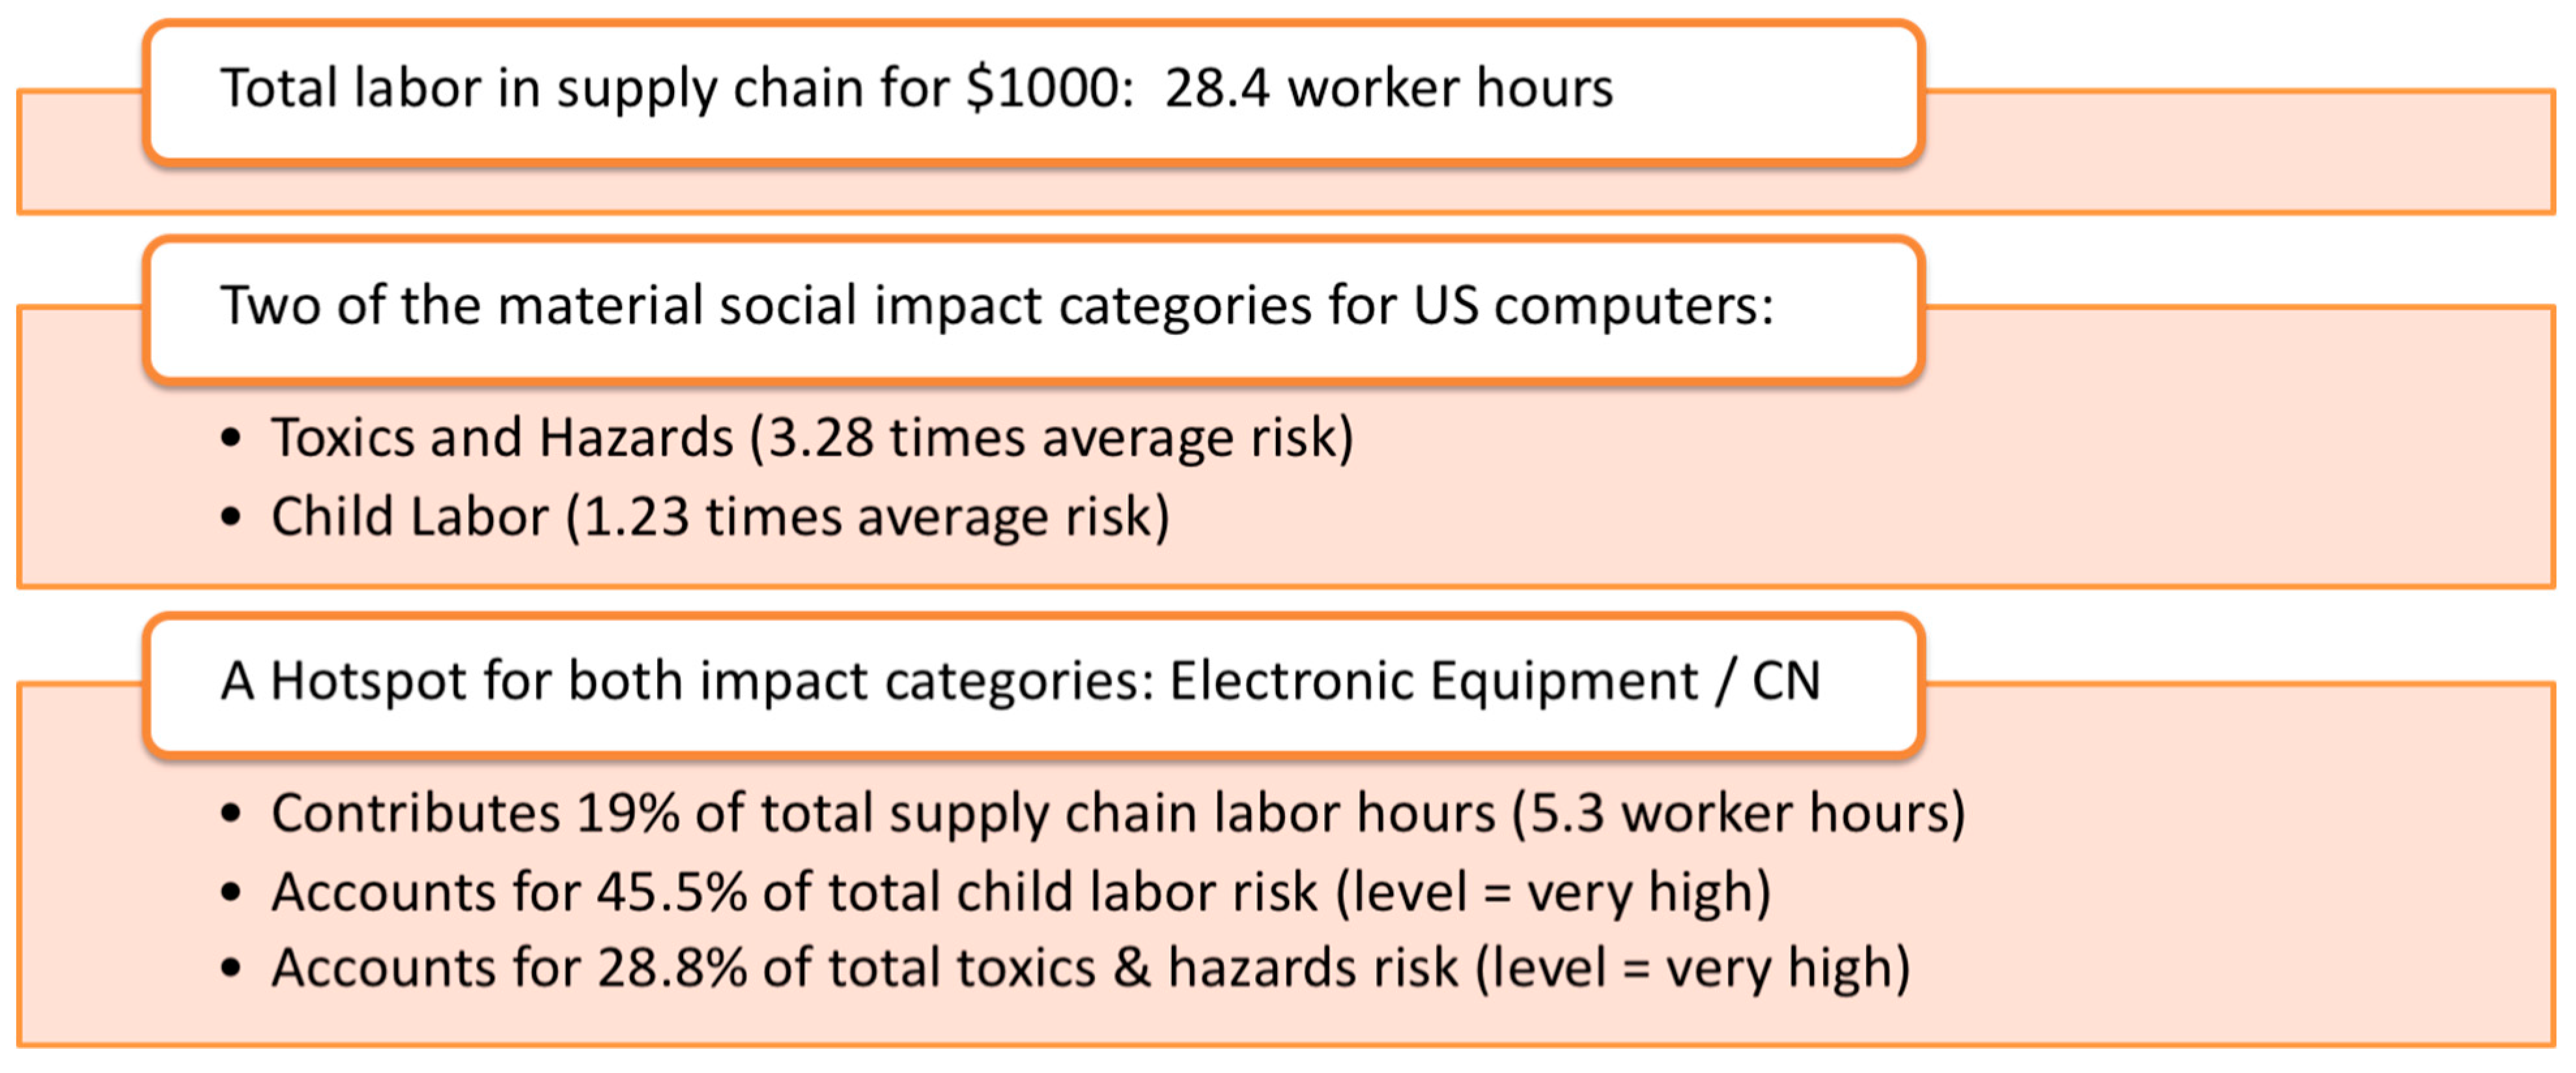
3.2. Social Hotspots

Social hotspots are the product system ‘country-specific sectors (CSS)’ (supply chain production activities) that contributes the most to the social risks overall, by impact category or subcategory. In this study, we have decided to focus on components, therefore we are not pointing to services hotspots.
Overall, Figure 5 shows that electronic equipment (China), machinery and equipment (China), electronic equipment (Myanmar), and chemical, rubber, and plastic products (China) are the component production activities contributing most to the risks for US computer manufacturing companies.

3.3. Normalization

Without a comparison it is difficult to understand what opportunity for change or responsibility a sector has regarding an impact category or subcategory. Which social issues are more salient than others for an industry?
In order to identify the most salient issues, we compared the results for the US computer manufacturing sector to the total US economy inputs and outputs. This enabled to zoom in a few subcategories for which the impact of the US computer manufacturing sector is greater compared to the average risk per dollar. These salient risks are: Toxics and hazards, improved sanitation, high conflict, gender equity, excessive working time, and child labor. We decided to focus on toxics and hazards and child labor to demonstrate the next steps of the handprinting process, because they were both issues for which the electronics industry which had a greater leverage and there where known programs to address both. On Figure 6, we can see the normalization for each impact subcategory and the two salient risks selected circled in red.

3.4. Social Hotspots of Salient Risks

In order to find out where to investigate the issues of child labor and toxics and hazards further, we identified the social hotspots. For both salient risks, the social hotspots were the same: Electronic equipment (China) and electronic equipment (Myanmar).
In summary, we completed the first step of the handprint creation process, namely, the footprint assessment and the hotspots and salient risks identification. We would need to use company specific expenditure data and collect site-specific information to refine the baseline, which would be the next iteration here.
We focused on child labor and toxics and hazards and their hotspots to illustrate the following steps of the process. For child labor, we decided to focus on the electronic equipment in China hotspot, as this was the most significant one.

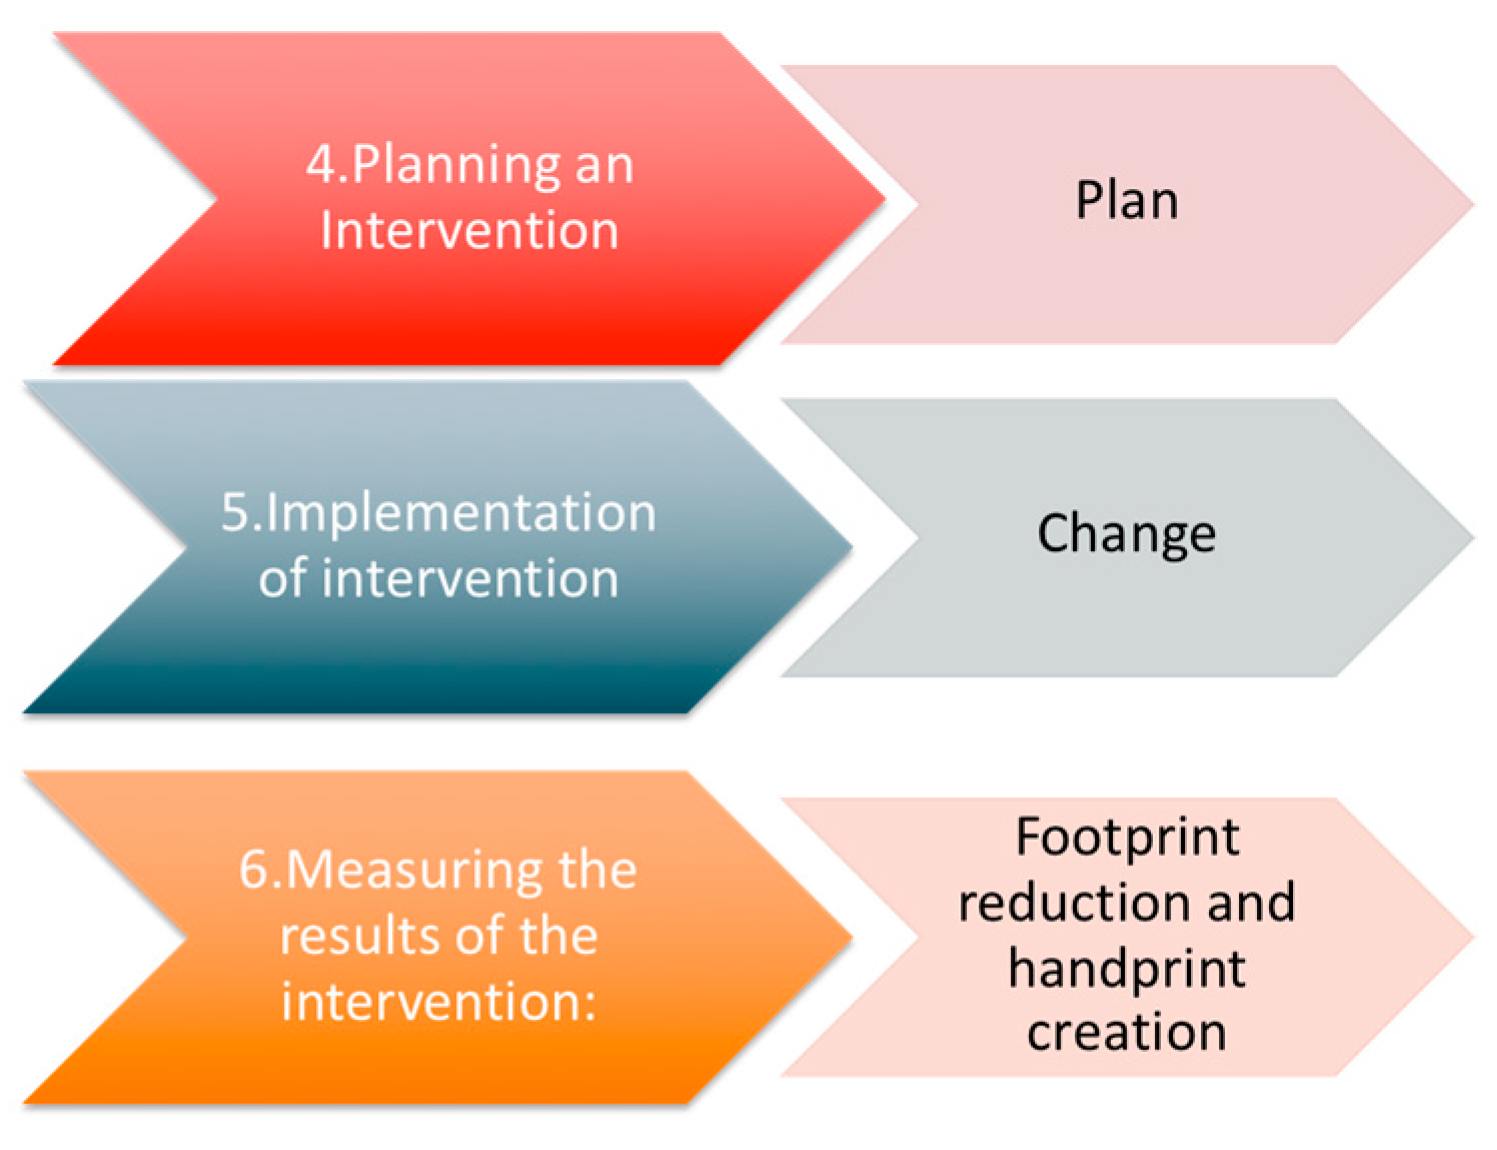
4. Discussion and Handprint Creation

4.1. Root Causes Identification

In this project, we used the literature to zoom in on some of the root causes and business touch points regarding the salient risks and social hotspots identified in order to demonstrate the method. An in-depth exploration of root cause evaluation methods would be warranted in further studies.
Regarding child labor in China, we identified the following root causes from the literature [33]: Poverty, migrants, the hukou system, and education and work programs.
A few business touch points (relationships or entryway by which a business may have leverage on social impacts) were highlighted. For instance, the wages paid to workers by suppliers in order to address poverty, working with suppliers to provide equal and fair working conditions to migrants (foreign or from rural China), working with suppliers to ensure that training programs are ethical and do not take unfair advantage of students, and the potential of lobbying the government for opening up the hukou system (where internal migrants to cities do not obtain access to same basic services as locals such as schools or healthcare).
Regarding toxics and hazards, chemical exposure is responsible for the impact [34]. For example, the use of lead, mercury, cadmium, and beryllium, as well as hazardous chemicals, such as brominated flame retardants. Regarding this issue, the touch point is the suppliers with whom alternatives must be found for the toxic substances used.

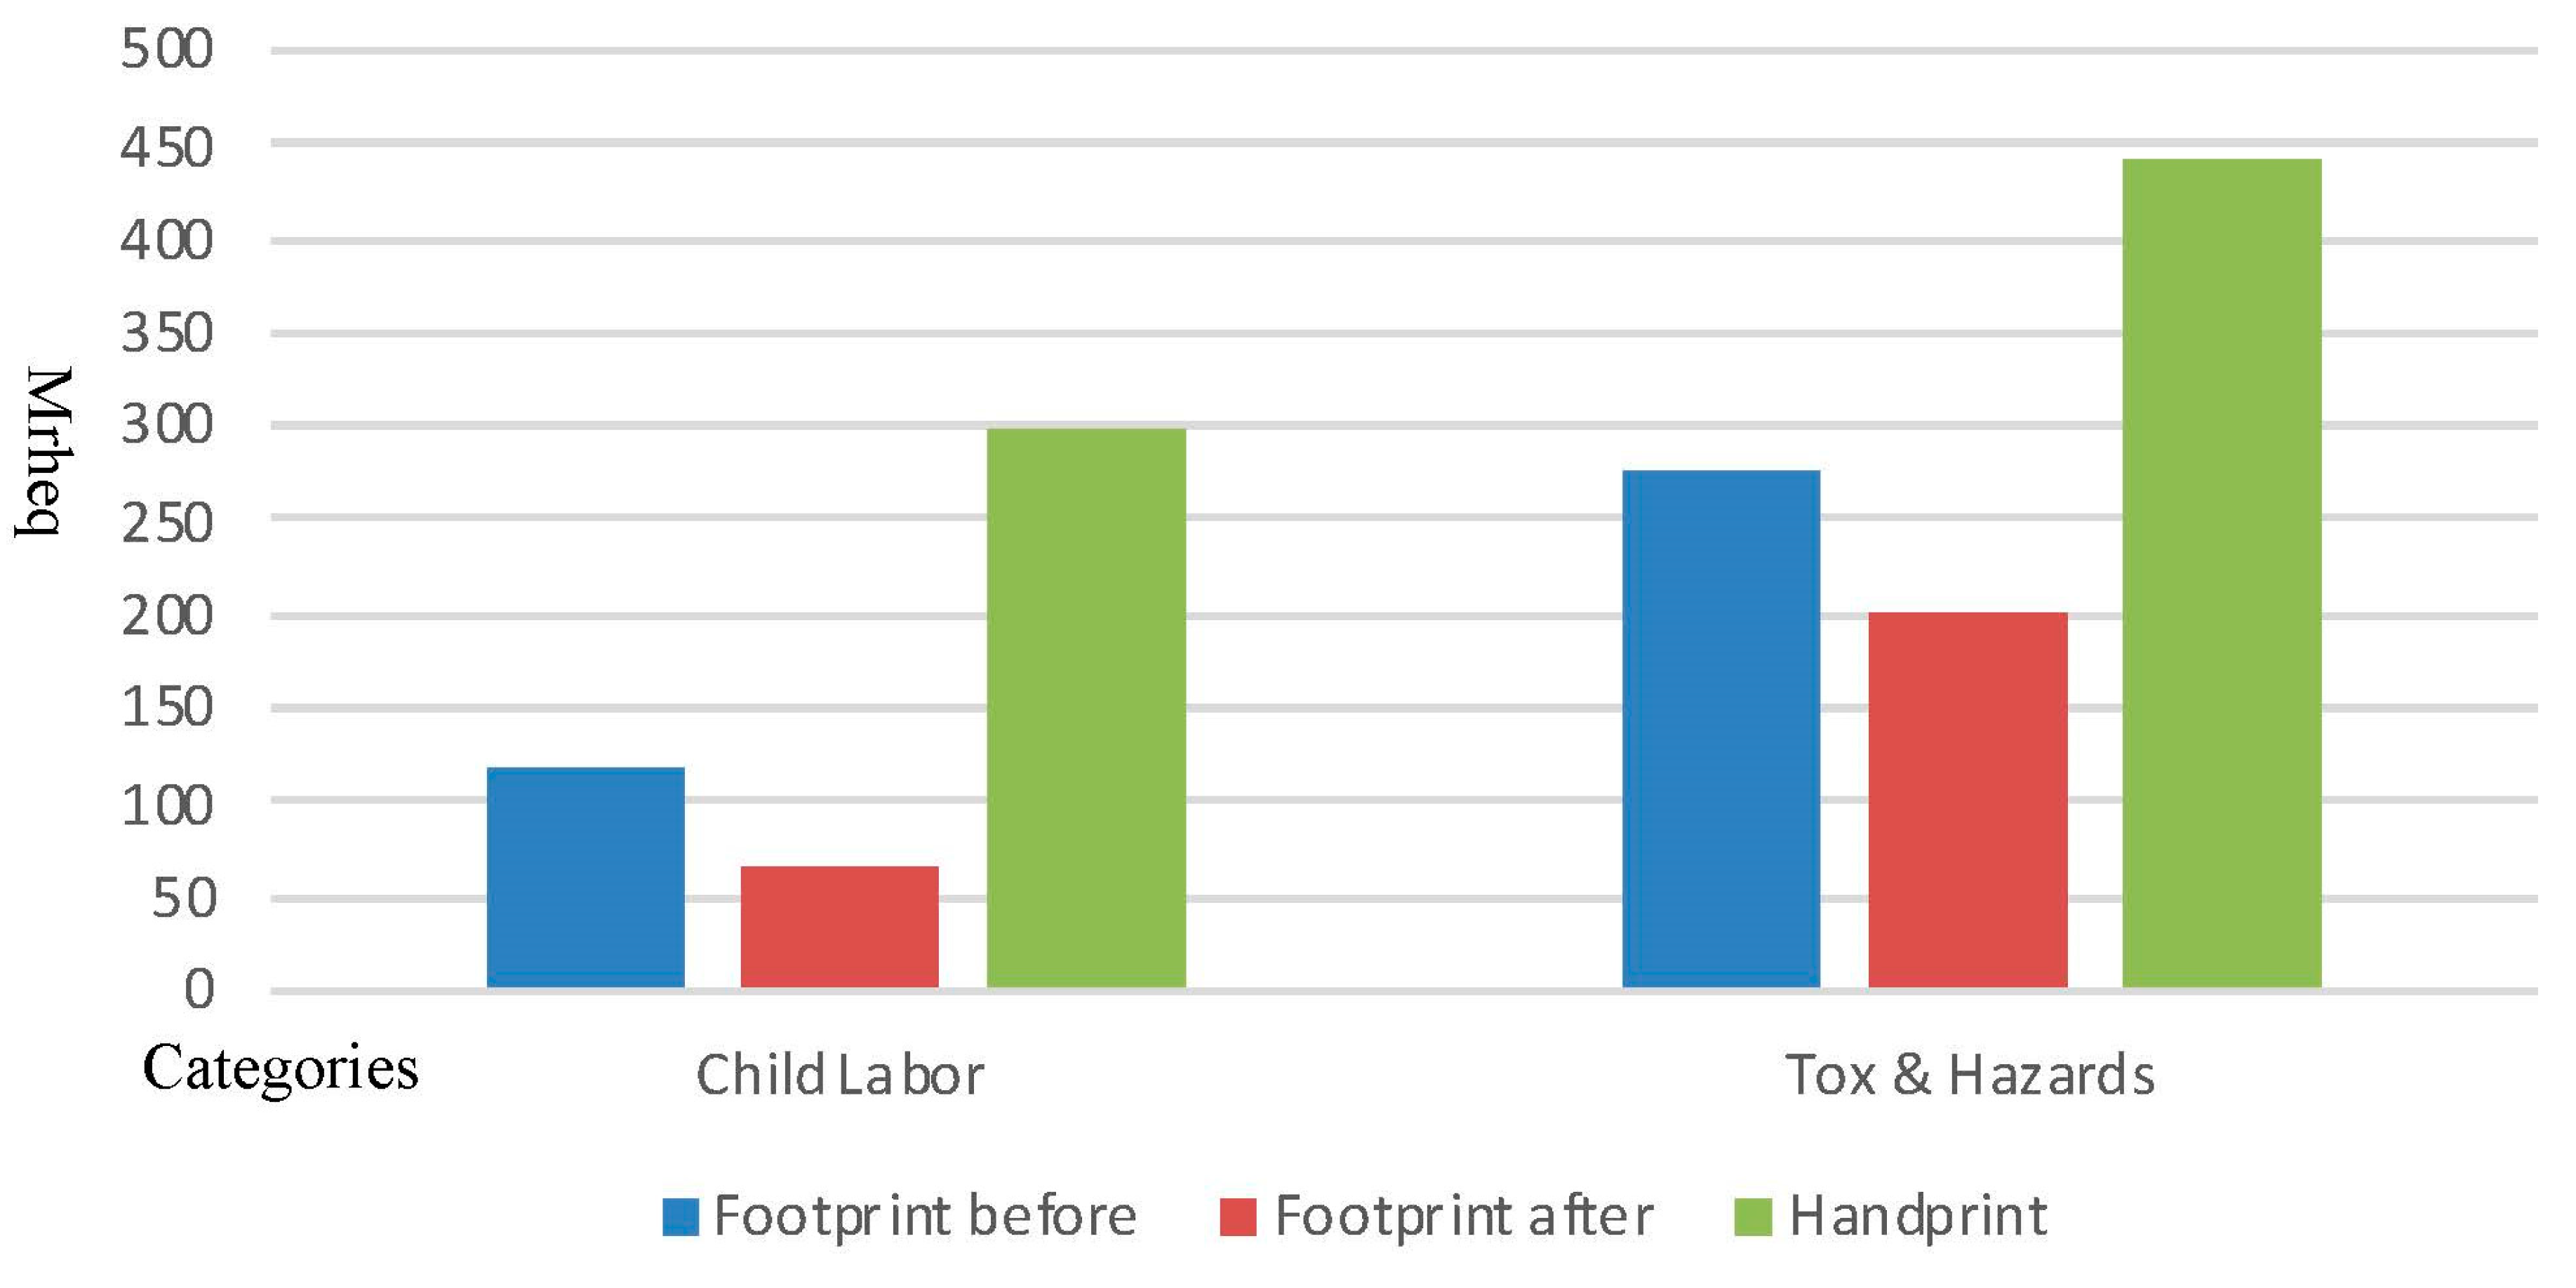
4.2. Social Handprint Calculation and Results

In order to create a social handprint, a change must be planned and implemented. In this section we will demonstrate how the calculation can be done. Figure 7 illustrate the steps, once we have refined the baseline and identified root causes that we have decided to address.
For our example, based on discussion with colleagues from the industry, we estimate that for a supplier, a US computer manufacturing company purchases may account for 5–25% of their sales. We use the mid-range of 15%.
Therefore, reducing risk, from very high to low, will:
  • Reduce US brand owner’s total supply chain social footprint significantly;
  • Reduce the total supply chain child labor risk (footprint) by 45%;
  • Reduce the total supply chain tox/haz risk (footprint) by 28%;
  • Create a social handprint, by causing positive change both in the footprint of the brand owner and in the footprint of other companies.
Handprint refers to the change in risk-hours vs. business as usual (BAU), within and beyond the brand owner’s footprint.
Since the brand owner purchases 15% of sales, then the total change in risk hours achieved applies to the following:
W = FPRH/f
where W is the full worker-hours for the risk reduction handprint, FPRH is the footprint risk hours, i.e., the amount of risk hours in the brand owner’s footprint that are affected by the change, and f is the fraction of the affected process’s output which is purchased by the brand owner. In our example, f = 0.15.
To demonstrate the handprint calculation method, we made the hypothesis that there are already program(s) in place that are resulting in changes which are dramatically reducing the risk of child labor and toxics and hazards at supplier’s site(s) in China. Figure 8 summarizes the handprint calculation process.
Figure 9 illustrates the calculation of the footprint reduction and the handprint creation in medium risk hours equivalent for the entire supply chain of US computer manufacturing. Progress is significant, and the footprint is greatly reduced. For instance, the child labor footprint is reduced by almost 50% and the toxics and hazards footprint is reduced by 25%. Because of the influence of the programs improving conditions in other supply chains, a sizable handprint is also created.

4.3. From a Typical Company to a Specific One

In this project we have used generic information to estimate the footprint of a typical US computer manufacturing company. How can a company use the industry-wide assessment as a starting point and what are the steps needed to make it company-specific?
A company’s supply chain is shaped by how much the company purchases from which suppliers in which sectors in which countries, and then by the same details for these first-tier suppliers, and so-on. An initial social footprint assessment for Dell would work with data on Dell’s direct purchases of goods and services from its suppliers, with additional supplier breakdown by country if possible.
Thus, the first step is to refine the purchases. Both the purchased amount and the location of where the purchases are coming from can be updated. Here, this process can be explained in three steps:
  • Modify the purchases amount and country trade share of the existing industry model;
  • Become more ambitious and even more specific, i.e., start from internal expenditure data;
  • Obtain the information of the next supply chain tier from suppliers.
The second step would be to make use of social audit data or additional sources to change the risk level associated with indicators and impact subcategories when relevant. When risks are efficiently managed, the risk level can be lowered. If not, risks are more elevated than the SHDB captures, and they can be heightened. This will require the compilation of social audit data by “subcategories” or issues, by location, and by suppliers/purchases or input type.
Therefore, the bulk of the efforts to move from an industry-wide assessment to a company specific one are about data management. This consists of finding the correct data, formatting it, or mapping it to the modeling system required to produce the assessment, and calculating the updated results.
The updated results can then be compared to the ones obtain from the industry assessment. This will enable the elucidation of how the company is positioned in comparison to the industry average.
Another action that can be taken is to compile the information about existing programs that are creating social changes in the supply chain, documenting these programs and start calculating how they may reduce the company supply chain’s social footprint and increase its social handprint.

5. Conclusions

This case study has demonstrated the process and outcome of a social organizational life cycle assessment focused on a typical US electronics industry company and its supply chain.
We have calculated the social footprint of a US computer manufacturing company from generic information and identified the salient social risks and social hotspots. The results are summarized in Table 2. The social footprint shows the greater impact of the electronics industry on labor rights and decent work and health and safety. Overall, electronic equipment (China), machinery and equipment, (China), electronic equipment, (Myanmar), and chemical, rubber, and plastic products (China) are the production activities contributing most to the risks for US computer manufacturing companies.
This study has demonstrated the first step of a handprint assessment and has described the following ones. Our research shows that we can apply social LCA to quantitatively evaluate the impact of changes made to improve social conditions. We have illustrated the calculation process throughout. In addition, we have specified how to go from an industry level assessment to a company-specific one.
Some of the limitations of this research relates to the models and data used. For instance, we had constraints related to the number of sectors available in the input output model and year results available from the US BEA data.
The activities that would need refinement in other projects would be as follows: (1) The refinement of the root cause assessment and the development of a practical approach and guidelines; (2) the development of a database of root causes from the academic literature by issue, country, and, if relevant, economic sector; and (3) guidance on how to validate the positive impact (outcome and impact, e.g., what criteria should be used and defined and what type of verification would be needed).
This study represents an example of the process and requirement to assess a company-wide social footprint and also how to create and measure social handprints. The normalization method implemented is a useful guide to the interpretation of the results and enable to focus on the salient risks where the industry has a greater potential for improvement.

Supplementary Materials

The following are available online at https://www.mdpi.com/2079-9276/8/4/176/s1, Mapping of the typical computer manufacturing company supply chain.

Author Contributions

All authors have conceptualized the project, C.B.N. and G.A.N. developed the methodology, C.B.N. applied the software and wrote the original draft, G.A.N. conducted formal analysis. J.P. and L.A. supervised the project and provided review and edits.

Funding

This research was part of a project funded by Dell at Harvard School of Public Health.

Acknowledgments

Thanks to Harvard School of Public Health and Jack Spengler to have supported this project.

Conflicts of Interest

“The authors declare no conflict of interest.” Funders participated in the conceptualization of the project and are co-authors of this publication.

References

  1. Goleman, D. Handprints, Not Footprints. Time Magazine, 2012. Available online: http://content.time.com/time/magazine/article/0,9171,2108015,00.html (accessed on 25 January 2019).
  2. Norris, G. A Framework for Comparing and Understanding Net Positive Goals. SHINE MIT. 2017. Available online: http://shine.mit.edu/publications-6 (accessed on 25 June 2019).
  3. Hellweg, S.; Milà, I.; Canals, L. Emerging approaches, challenges and opportunities in life cycle assessment. Science 2014, 344, 1109–1113. [Google Scholar] [CrossRef] [PubMed]
  4. Benoit, C.; Mazjin, B. (Eds.) Guidelines for Social Life Cycle Assessment of Products; United Nations Environment Programme and Society of Environmental Toxicology and Chemistry: Paris, France, 2009; Available online: http://www.unep.fr/shared/publications/pdf/DTIx1164xPA-guidelines_sLCA.pdf (accessed on 25 June 2019).
  5. Handbook for Product Social Impact Assessment. Roundtable for Product Social Metrics. 2018. Available online: https://product-social-impact-assessment.com (accessed on 25 June 2019).
  6. Chhipi-Shrestha, G.K.; Hewage, K.; Sadiq, R. ‘Socializing’ sustainability: A critical review on current development status of social life cycle impact assessment method. Clean Technol. Environ. Policy 2015, 17, 579–596. [Google Scholar] [CrossRef]
  7. Russo Garrido, S.; Parent, J.; Beaulieu, L.; Revéret, J.P. A literature review of type I SLCA—Making the logic underlying methodological choices explicit. Int. J. Life Cycle Assess. 2016. [Google Scholar] [CrossRef]
  8. Wu, S.R.; Yang, D.; Chen, J. Social life cycle assessment revisited. Sustainability 2014, 6, 4200–4226. [Google Scholar] [CrossRef]
  9. Benoît Norris, C. Data for social LCA. Int. J. Life Cycle Assess. 2014, 19, 261–265. [Google Scholar] [CrossRef]
  10. Benoit Norris, C. Social Life Cycle Assessment: A Technique Providing a New Wealth of Information to Inform Sustainability-Related Decision-Making. In Life Cycle Assessment Handbook: A Guide for Environmentally Sustainable Products; Curran, M.A., Ed.; Scrivener Publishing LLC: Beverly, MA, USA, 2012; pp. 433–452. [Google Scholar]
  11. Benoit Norris, C.; Norris, G.; Valdivia, S.; Ciroth, A.; Moberg, Å.; Bos, U.; Prakash, S.; Ugaya, C.; Beck, T. The Guidelines for Social Life Cycle Assessment of products: Just in time! Int. J. Life Cycle Assess. 2010, 15, 156–163. [Google Scholar] [CrossRef]
  12. Manhart, A.; Grießhammer, R. Social Impacts of the Production of Notebook PCs; Oko-Institut e.V.: Freiburg, Germany, 2006; Available online: https://www.prosa.org/fileadmin/user_upload/pdf/notebooksurvey_final_engl.pdf (accessed on 25 June 2019).
  13. Ciroth, A.; Franze, J. LCA of an Ecolabeled Notebook—Consideration of Social and Environmental Impacts along the Entire Life Cycle; Lulu.com: Berlin, Germany, 2011; Available online: http://www.greendeltatc.com/uploads/media/LCA_laptop_final.pdf (accessed on 25 June 2019).
  14. Ekener-Petersen, E.; Finnveden, G. Potential hotspots identified by social LCA—Part 1: A case study of a laptop computer. Int. J. Life Cycle Assess. 2013, 18, 127–143. [Google Scholar] [CrossRef]
  15. Benoit, C.; Aulisio, D.; Overraker, S.; Hallisey-Kepka, C.; Tamblyn, N.; Norris, G. Social Scoping Prototype Report Product Category 2: Laptop Computer; The Sustainability Consortium: Tempe, AZ, USA, 2011. [Google Scholar]
  16. Subramanian, K.; Yung, W.K.C. Modeling Social Life Cycle Assessment framework for an electronic screen product: A case study of an integrated desktop computer. J. Clean. Prod. 2018, 97, 417–434. [Google Scholar] [CrossRef]
  17. Wilhelm, M.; Hutchins, M.; Mars, C.; Benoit-Norris, C. An overview of social impacts and their corresponding improvement implications: A mobile phone case study. J. Clean. Prod. 2015, 102, 302–315. [Google Scholar] [CrossRef]
  18. Umair, S.; Björklund, A.; Ekener, E. Social impact assessment of informal recycling of electronic ICT waste in Pakistan using UNEP SETAC guidelines. Resour. Conserv. Recycl. 2015, 95, 46–57. [Google Scholar] [CrossRef]
  19. Responsible Business Alliance. Available online: https://www.responsiblebusiness.org (accessed on 25 June 2019).
  20. Ramchandani, A. Forced Labor Is the Backbone of the World’s Electronics Industry. The Atlantic, 28 Junuary 2018. Available online: https://www.theatlantic.com/business/archive/2018/06/malaysia-forced-labor-electronics/563873/ (accessed on 25 June 2019).
  21. Condliffe, J. Foxconn Is under Scrutiny for Worker Conditions. It’s Not the First Time. The New York Times, 11 Junuary 2018. Available online: https://www.nytimes.com/2018/06/11/business/dealbook/foxconn-worker-conditions.html (accessed on 25 June 2019).
  22. Locke, R.M.; Samel, H. Beyond the Workplace: “Upstream” Business Practices and Labor Standards in the Global Electronics Industry. Stud. Comp. Int. Dev. 2018, 53, 1–24. [Google Scholar] [CrossRef]
  23. European Coalition for Corporate Justice. French Corporate Duty of Vigilance Law Information Sheet. Available online: https://www.business-humanrights.org/sites/default/files/documents/French%20Corporate%20Duty%20of%20Vigilance%20Law%20FAQ.pdf (accessed on 25 June 2019).
  24. Shift and Mazars. UN Guiding Principles Reporting Framework. 2015. Available online: https://www.ungpreporting.org (accessed on 25 June 2019).
  25. Benoit Norris, C.; Norris, G.; Xiao, Y.; Murray, J. Human Rights Due Diligence with the Social Hotspots Database. In The Social Effects of Global Trade: Quantifying Impact Using Multiregional Input Output Analysis; Murray, J., Malik, A., Geshke, A., Eds.; Pan Stanford Publishing PTE: Singapore, Singapore, 2018. [Google Scholar]
  26. Martinez Blanco, J.; Finkbeiner, M.; Inaba, A. Guidance on Organizational Life Cycle Assessment; United Nations Environment Programme and Society of Environmental Toxicology and Chemistry. 2015. Available online: https://www.lifecycleinitiative.org/wp-content/uploads/2015/04/o-lca_24.4.15-web.pdf (accessed on 25 June 2019).
  27. Martínez-Blanco, J.; Annekatrin, L.; Ya-ju, C.; Matthias, F. Social organizational LCA (SOLCA)—A new approach for implementing social LCA. Int. J. Life Cycle Assess. 2015, 20, 1586–1599. [Google Scholar] [CrossRef]
  28. Benoit-Norris, C.; Aulisio Cavan, D.; Norris, G. Identifying Social Impacts in Product Supply Chains: Overview and Application of the Social Hotspot Database. Sustainability 2012, 4, 1946–1965. [Google Scholar] [CrossRef]
  29. Norris, G.A. Social impacts in product life cycles: Towards life cycle attribute assessment. Int. J. Life Cycle Assess. 2006, 1, 97–104. [Google Scholar] [CrossRef]
  30. US Department of Commerce, Bureau of Economic Analysis. Benchmark Input/Output Accounts; US Department of Commerce. Available online: https://www.bea.gov/industry/input-output-accounts-data (accessed on 25 June 2019).
  31. Yang, Y.; Ingwersen, W.; Hawkins, T.; Srocka, M.; Meyer, D.E. USEEIO: A new and transparent United States environmentally-extended input-output model. J. Clean. Prod. 2017, 158, 308–318. [Google Scholar] [CrossRef] [PubMed]
  32. Narayanan, G.B.; Walmsley, T.L. Global Trade, Assistance, and Production: The GTAP 7 Data Base; Center for Global Trade Analysis, Purdue University: West Lafayette, IN, USA, 2008; Available online: http://www.gtap.agecon.purdue.edu/databases/v7/v7_doco.asp (accessed on 25 June 2019).
  33. Tang, C.; Zhao, L.; Zhao, Z. Child Labor in China; Institute for the study of labor IZA: Bonn, Germany, 2016. [Google Scholar]
  34. United Nations Human Rights, Office of the High Commissioner. End of Visit Statement by the United Nations Special Rapporteur on Human Rights and Hazardous Substances and Wastes, Baskut Tuncak; OHCHR: Phnom Penh, Cambodia, 2015; Available online: https://www.ohchr.org/EN/NewsEvents/Pages/DisplayNews.aspx?NewsID=16639&LangID=E (accessed on 25 June 2019).
Figure 1. Key technical elements of the methodology (original artwork).
Resources 08 00176 g001
Figure 2. Social Hotspots Database (SHDB) categories and subcategories (themes) (Benoit Norris, C., Bennema, M., Norris, G., Social Hotspots Database documentation, 2018).
Resources 08 00176 g002
Figure 3. Social footprint results by impact category.
Resources 08 00176 g003
Figure 4. Social footprint results by impact subcategory.
Resources 08 00176 g004
Figure 5. Social hotspot results for overall social risks.
Resources 08 00176 g005
Figure 6. Supply chain risks for the US computer sector. Normalized by supply chain risks for the US total final demand.
Resources 08 00176 g006
Figure 7. Handprint creation steps.
Resources 08 00176 g007
Figure 8. Handprint calculation.
Resources 08 00176 g008
Figure 9. Social net positive.
Resources 08 00176 g009
Table 1. SHDB Impact Assessment method.
Risk LevelWeight
Very High Risk10
High5
Medium1
Low0.1
Table 2. Summary of the results.
Result TypeResult Outcome
Overall Social Footprint
(A)
Categories with the highest Mrheq
(B)
Purchases supply chains total Mrheq
-
Labor rights and decent work
-
Health and safety
-
Computer storage device readers’ supply chain and computer manufacturing’ supply chain are the biggest contributors to the overall risks.
Overall Social Hotspots
individual production activity/country which contributes most to the risk (overall, by impact category or subcategory)
-
Electronic equipment, China,
-
Machinery and equipment, China,
-
Electronic equipment, Myanmar
-
Chemical, rubber, and plastic products, China
Salient Social Risks
social impact subcategories that account for a greater share of the overall risk
-
Toxics and hazards,
-
Improved sanitation,
-
High conflict,
-
Gender equity,
-
Excessive working time
-
Child labor

