1. Introduction
There are several methods that measure poverty, taking into account variables such as income, household living standards, and access to basic services, among others. All of these methods present strengths and weaknesses, meaning that they need to be adapted to the objectives implemented in the planned study.
Conventional techniques for measuring and decomposing poverty remain useful and valuable, but it is important to broaden them and highlight the importance of undertaking poverty analyses that take into account the different aspects of the phenomenon and its multidimension.
However, measuring poverty is not an easy task due to the fact that statistical data sometimes do not exist, are unreliable, index ignore important information, do not contain the information required, are not updated, lose validity quickly, or simply are not useful to show the multidimensional aspects of poverty.
In this article, applying the Rasch model to the data used to elaborate the Multidimensional Poverty Index (MPI) established by the United Nations for 91 selected countries, we set three objectives:
First, we will elaborate a new classification of the countries according to their degree of poverty (step one).
Second, we will be able to define which factors most affect poverty for each country according to three selected factors: Health, education, and standard of living (step two). This additional information provided by the Rasch model, concerning how health, education, and standards of living affect poverty levels, can uncover why countries are in their current position and how they could improve their situation by enacting with policies that could bring solid progress in these fields.
Third, the Rasch model also shows the anomalous cases, reflected in the values that apply to certain specific items for any of the countries. This information can be very useful in follow-up studies, analyzing why these singularities take place in those countries (step three).
The paper is organized as follows. We first present a literature review on how to measure poverty and how health, education, and living standards affect it. Second, we describe data and we apply the Rasch model to them, which will allow us to develop a comparative analysis of the poverty of these countries, to determine their hierarchical position, and to ascertain the factors that most affect that position. Thirdly, we will comment on our findings.
2. Literature Review
Poverty is a topic of great interest in economic literature, but before tackling the analysis of the causes and potential consequences of such phenomena, we have to face the issue of which is the best way to measure them in the sense that poverty is a complex phenomenon influenced by a large number of factors that can be studied from many different perspectives. Therefore, interpreting poverty is not a simple task [
1].
Conventional measures of poverty correlate household per capita income to a poverty baseline, but this approach has provoked a widespread criticism, on the grounds that it fails to capture important dimensions of poverty and often fails to reflect subjective perceptions of well-being [
2,
3]. Since 1990, the Human Development Index (HDI) for measuring human development has certainly provided a broad assessment of human well-being, but it is not a comprehensive measure. For that reason, other human development measures and indices have been progressively introduced due to a greater availability of data, enabling the understanding of human progress [
4,
5,
6].
Over the last 25 years, the concept of what human development has evolved to reflect broader understandings. The new Sustainable Development Goals (SDGs) demands necessary progress in measuring human development and a better illustration of inequality among groups (women, ethnic minorities, persons with disabilities, and children) and must take into account the quality of human development achievements [
7,
8].
There is a broad consensus that a long and healthy life, access to knowledge, and a decent standard of living are the basic aspects of well-being and opportunity. In education, it is necessary to consider school availability, attendance, years of schooling, and child enrollment; in health, we must consider nutrition and child mortality; and for a decent standard of living, there are multiple factors, such as access to electricity, clean drinking water (located less than a 30 min walk away), improved sanitation, cooking fuel, housing, assets concerning information (radio, TV, telephone), mobility (bike, motorbike, car, truck, animal cart, motorboat), and life amenities (refrigerator, arable/farmable land, livestock).
These three variables have been considered by different authors to be key pieces on which to build a more prosperous society:
(a) Education and poverty
Education is a universal human right, but in the poorest countries, the access to quality education is unequal and lack of access to public education is further aggravated by factors such as gender and rural environments.
In a world moving toward meritocracy and creating knowledge-based societies, education should be the right of every child, as it is a vital component essential for acquiring skills. However, it is still a privilege, especially in the underdeveloped countries. General poverty and the unwillingness of the government to invest are major factors preventing improvements in education, but additional factors must be added, including: Cultural barriers, inadequate school infrastructure, such as water and sanitation, long distance walks, unsafe environments, and inadequate teaching skills.
The development of human capital is a crucial challenge that confronts poverty and inequality [
9,
10], improves other life aspects such as the integration into the labor market, narrows the wage gap, and reduces infectious diseases and infant mortality [
11]. However, this goal becomes more difficult to achieve in nations involved in internal conflicts, as the number of out-of-school children increases just as it does in areas with a high incidence of child labor, where the school dropout rate undermines the possibilities of improving education [
12].
Notwithstanding these structural impediments, the design of educational public policies remains key to reducing the educational, social, and economic differences of the population. Policies in education will not be completely effective if the social, health, food, disability, and political situations, among others, are not considered [
13], and must be aptly tailored by financing them with an adequate governmental budgetary allocations for teacher training and school infrastructure [
14].
Past research shows that the expansion of education systems has a dynamic of its own. Once the children of a country begin enrolling and completing school, schooling begins to diffuse across the population more broadly, especially in lower family sizes [
15].
(b) Health and poverty
Advancing human development requires the expansion of real opportunities, people need conditions that permit them to avoid premature death by disease or injury, live in a healthy environment, maintain a healthy lifestyle, receive quality medical care, and attain the highest possible standard of health [
16,
17,
18]. Physical and mental health are key factors in the strategy of poverty reduction.
Poverty and poor health are closely linked, as poor health increases the risk that poverty will be transmitted to the next generation [
19] and an investment in health allows countries to achieve economic development and poverty reduction [
20]. International institutions have evaluated the impact of health policies by establishing guidelines and programs to manage health resources and capabilities for implementing appropriate actions [
21,
22].
(c) Decent standard of living
Even though the gross domestic product (GDP) is one of the main indicators of well-being, it is known that GDP is not suitable to measure standard of living. Many important factors are neglected because an increase in real GDP per capita does not mean that the standard of living is increasing for the general population, and activities affecting living standards do not involve market transactions, and therefore, are not necessarily reflected in GDP (i.e., health, life expectancy, and infant mortality).
Standard of living means the level of wealth, comfort, material goods, and necessities available to a certain group and includes income, economic and political stability, environmental quality, and safety [
23,
24].
These above three variables are going to be considered in our research to assess how they are affecting the degree of poverty in the analyzed countries.
3. Data and Methodology: The Rasch Model
The aim of this article is to quantify poverty at the national level in countries for which the United Nations Development Program calculates the Multidimensional Poverty Index. Applying the Rasch model (Version, supplier, city, state, country), we can measure the potential for success or failure of each country according to three items (health, education, and standard of living). This approach will allow us to compare the poverty of these countries and set up a hierarchy. We will further evaluate the impact of each of these three factors on the poverty of each country, which will be useful to reduce the impact on the incidence of penury [
25].
Starting from the latent variable of our study (poverty) calculated for 91 subjects (countries) defined by a set of three uncorrelated items (health, education, and standard of living) that we will study individually and comparatively, we will also synthesize all this information in a single measure to be analyzed them in an integral way. All of these processes will be carried out by applying the method of Rasch, characterized by its mathematical property [
26,
27,
28]. With this technique, it is possible to measure their status on a line, evaluating them on a scale of 1 to 25 (lesser to greater poverty) and along which the items and the countries are located (
Table 1).
This “poverty line”, which is derived from the data, permits us to readily see where the poverty levels of these countries stand in relation to each factor and to each other. The differences in poverty between two countries are observed by the relative positions of the factors on the line. So, the latent variable, poverty, is a continuum along which are located the parameters δi for the three items and the parameters βn for the countries. That is, there may be countries that do not surpass the value of each category in any item and will be placed among those that present strengths, and on the other hand, when the countries exceed the values of all items, they have weaknesses.

Consider Xni the dichotomous variable poverty that describes the fact that a country “n” endorses the item “i”. If Xni = 1, then country “n” is said to be poor. On the contrary, if Xni = 0, it is said that country “n” is not poor.

Let the variable Xn be a polytomic that describes the fact that a country n is given a category m in item i. If Xni = 1, the country n will present category m in the item i, and if Xni = 0, the country n will not present category m in the item i.
In this way, P [Xni = 1] would be the probability that country n comprises endorses category m in item i, and P [Xni = 0] would be the probability that country n does not endorse category m in item i.
Relating the Figureal representation to the random variable described:
The difference (β
n − δ
i) can range from
to
, and the probability from 0 to 1, that is:
If we use the difference β
n − δ
i as an exponent of e, then:
With a further adjustment and by applying the limits, we reach the following expression:
In this way, we achieve the Rasch formula, showing in our case the probability that the country “n” referred to item “i” is a poor country, given the parameters βn and δi [
29]:
In order to analyze the poverty of the chosen countries, we will determine what factors affect their position in the list. On one side, the research units (countries), and on the other, the main factors that have influence upon poverty: Health, standard of living, and education [
30].
Since the Rasch model is polytomous, we have established categories {1, 2, ..., 25} in terms of the parameter (country) and item (the three poverty factors) [
31,
32].
The Rasch method has specific properties to which the obtained data may or may not adjust. The model transforms the categorical responses of the items into measurement scales and consolidates data, even if they are not in the same unit of measurement [
33,
34].
To obtain the parameters, we used the WINSTEPS Rasch Measurement software with the database applied in the Human Development Report of the United Nations Development Program (UNDP) (
Table 1).
4. Empirical Results
Starting from the latent variable studied (poverty in countries according to MPI), calculated by UNDP according to the three mentioned items (index of deprivation by dimension of education in estimated poverty, deprivation index by health dimension in estimated poverty, and index of deprivation by dimension of the standard of living in estimated poverty), with regard to the unidimensionality required by this technique, the items that affect the latent variable, and therefore, the measuring instrument, present an underlying latent single rank.
To justify this rank, the following considerations must be satisfied: (a) That the variance explained by the items is greater than 4 times the variance of the first contrast and is higher than 3.7; (b) that the variance explained by the measures observed (93.2% in our case) is greater than 50%; and (c) that the variance not explained in the first contrast (eigenvalue) is less than 3 (1.68 logits) and in percentage terms less than 5% (3.8% in our case) (
Table 2). All this implies a good one-dimensionality.
The reliability of the measurement is optimal when it represents 100% and is acceptable when it is higher than 70%. In our results, the level of reliability obtained is 89% for the 91 subjects. Even when it reaches 93% in the 72 countries, it does not present the extreme value (1-1-1) in the items. For the set of items, it is 97%, an excellent level that shows the more than acceptable reliability of the items in the construction of our latent variable. In other words, the method is measuring what it is supposed to measure.
On the other hand, the validity or adjustment to determine which items and countries deviate more than expected by the Rasch model can be detected by its OUTFIT (adjustment due to external factors, sensitive to unexpected behavior) and its INFIT (adjustment to internal factors, sensible to unexpected behavior). The adjustment is good since our measurement has acceptable ranges for the construction of measurements (0.5–1.5), both for subjects (0.89 in INFIT and 0.94 in OUTFIT) and for items (0.96 in the INFIT and 0.94 in the OUTFIT).
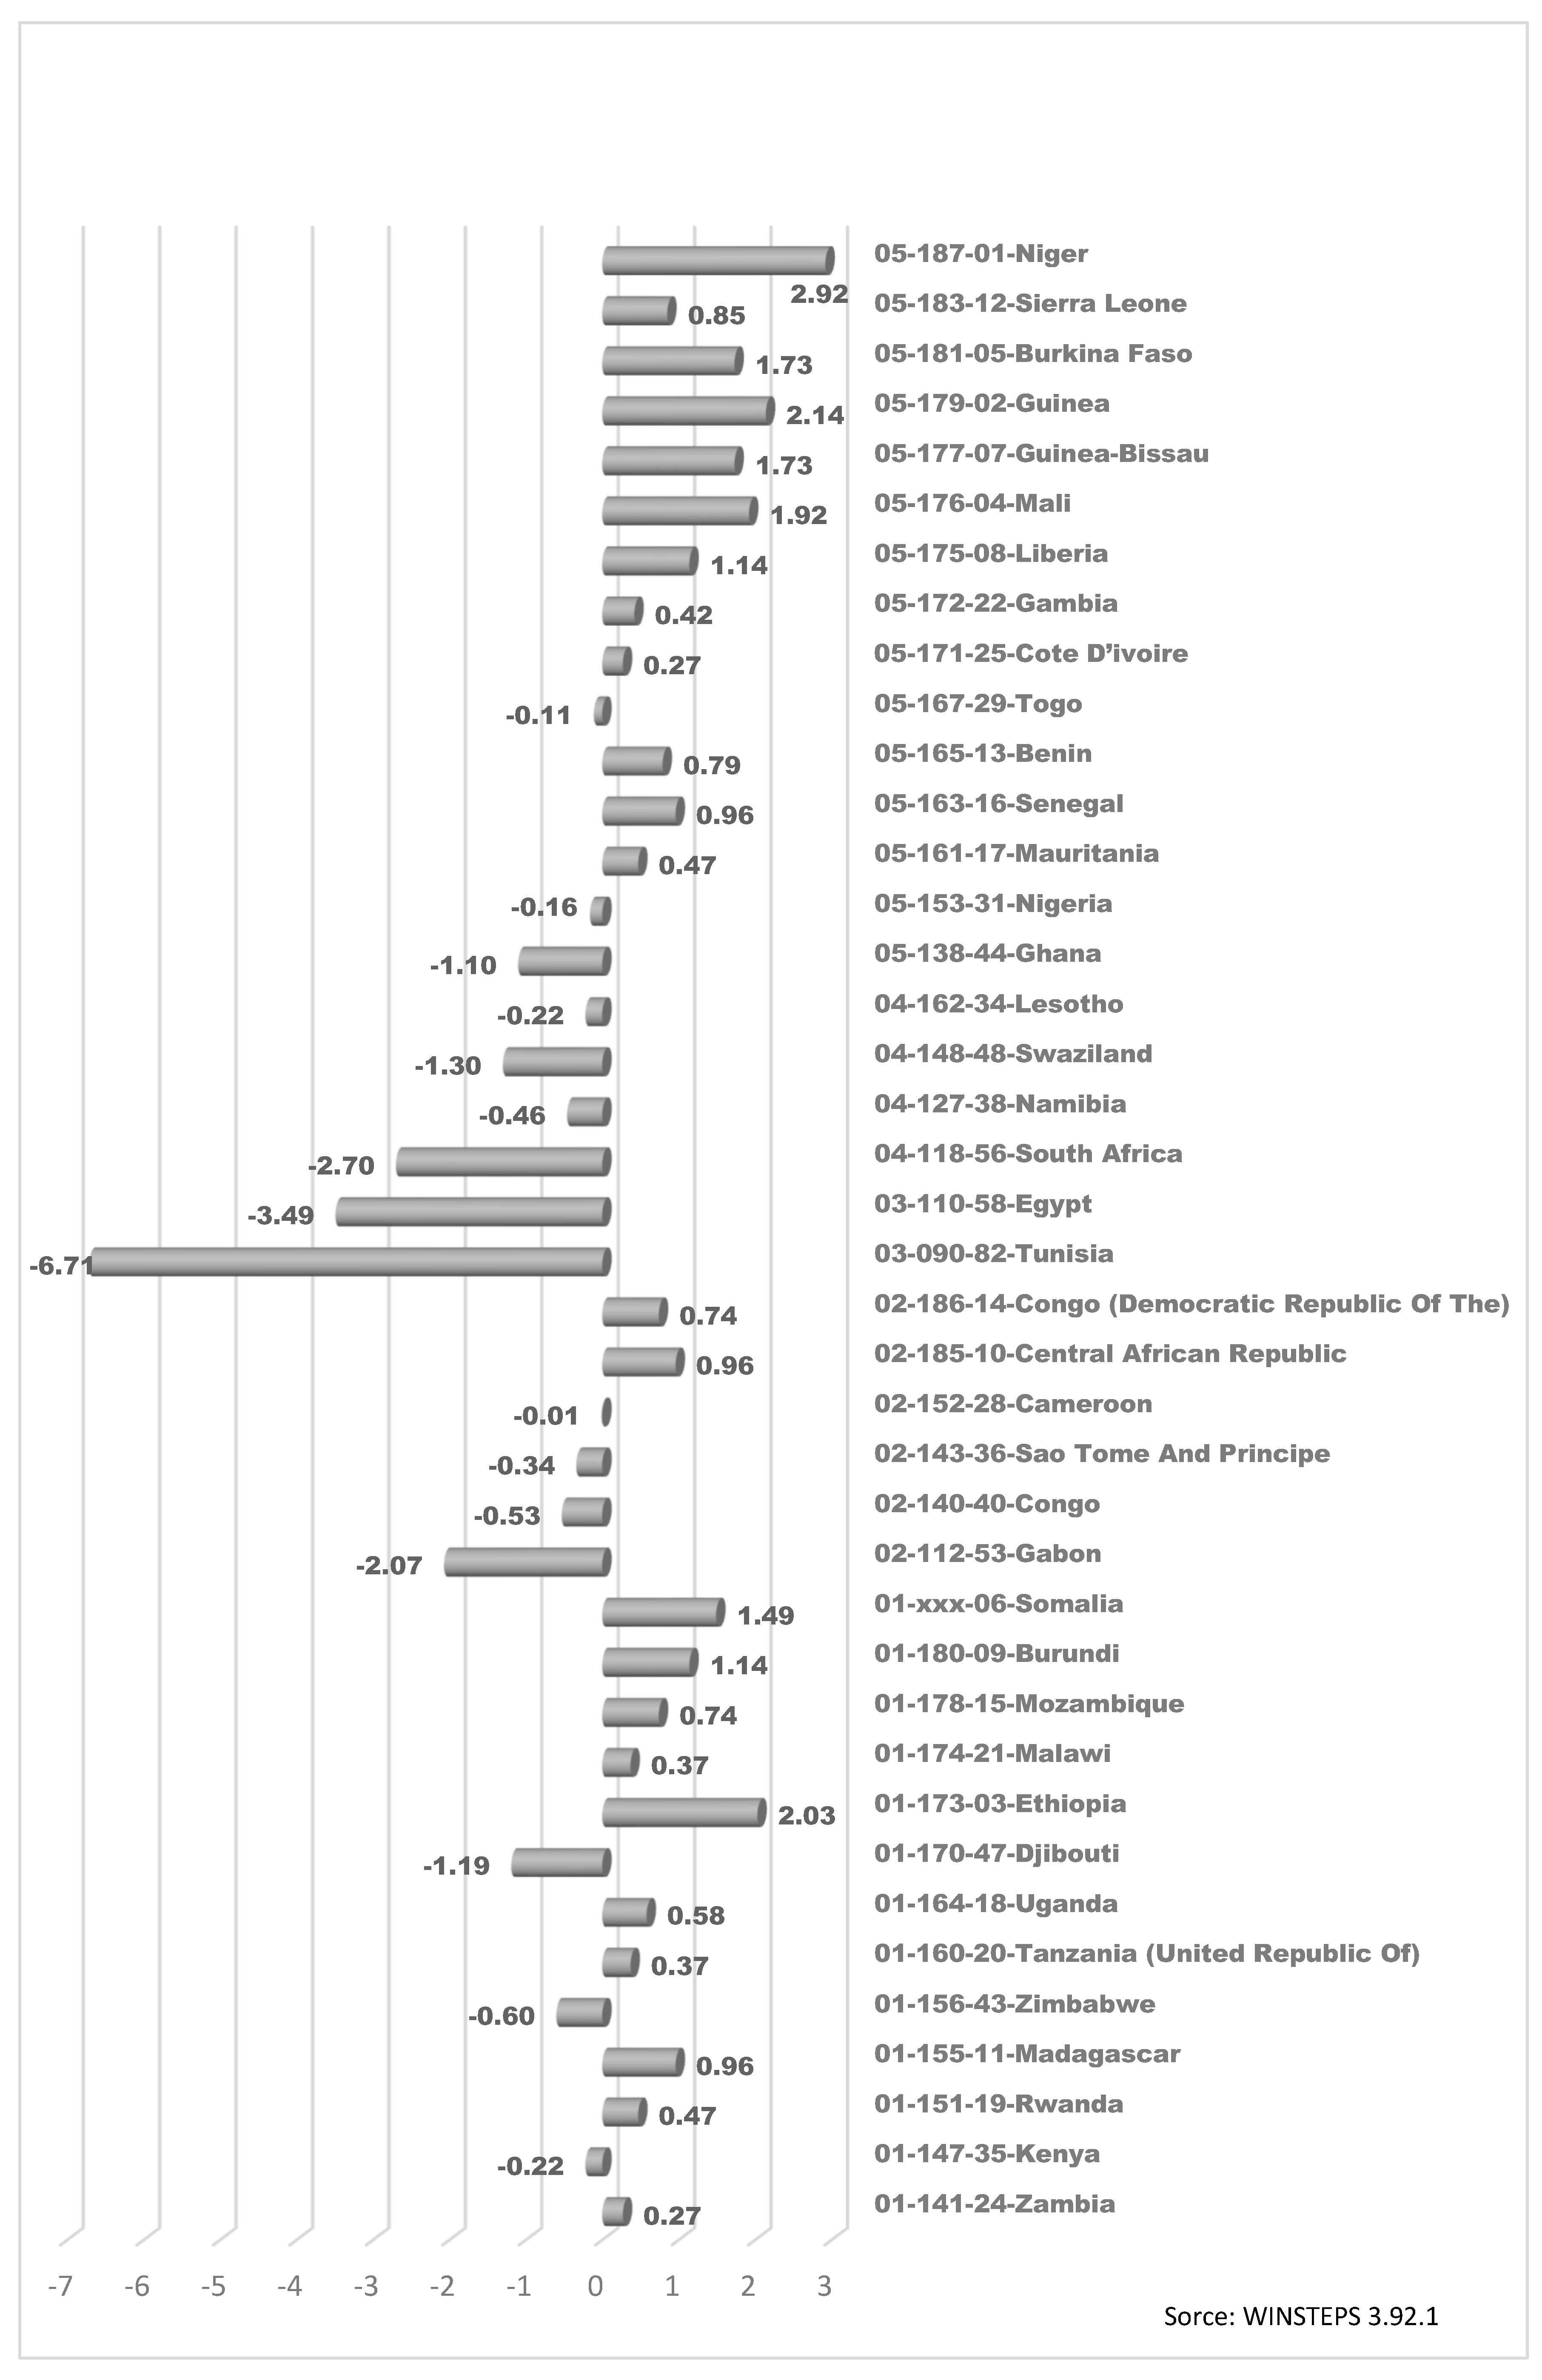
The results of our measurement ranking countries according to their degree of poverty, Multidimensional Poverty Measurement (MPM), are shown in
Figure 1. Thus, there are 19 countries in alphabetical order with the least degree of poverty with the lowest logits units (6.71) (
Table 3).
All of the 19 reach category 1 in the three items considered, so they have the lowest level of comparative deprivation in education, health, and standard of living, compared to the other countries. According to the first code (two digits) of these countries, five out of 19 are in West Asia (digit number 13), three of them in Eastern Europe (digit 14) and three of them for Southern Europe. This does not mean that they do not present deprivations, but do so in a lower degree compared to the rest of considered countries, which must continue working to reduce their deprivation level.
According to
Figure 1, the country with the highest multidimensional poverty level is Niger (2.92 logits), followed by Guinea (2.14 logits), Ethiopia (2.03 logit), and Mali (1.92 logit). This highlights greatly that poverty measured by deprivation of education, health, and standard of living has a clear African location (22 out of 40 of the countries with the greatest poverty).
In Africa (40 countries with an average of −2.19 logits units), only three out of the 40 countries are below the Multidimensional Poverty average, among them Tunisia (−6.71 logit), one of the less poor, Egypt (−3.49 logit), and South Africa (logits −2.70). Among the rest, only Gabon (logits −2.07 units) is near this average. African countries with the highest poverty level are Guinea and Ethiopia (the second and third highest poverty of the considered countries), Burkina Fasso, and Guinea-Bissau. Within Africa, East Africa (05) is in a special negative situation concerning deprivation, followed by West Asia (01), and Northern and Southern Africa [
35].
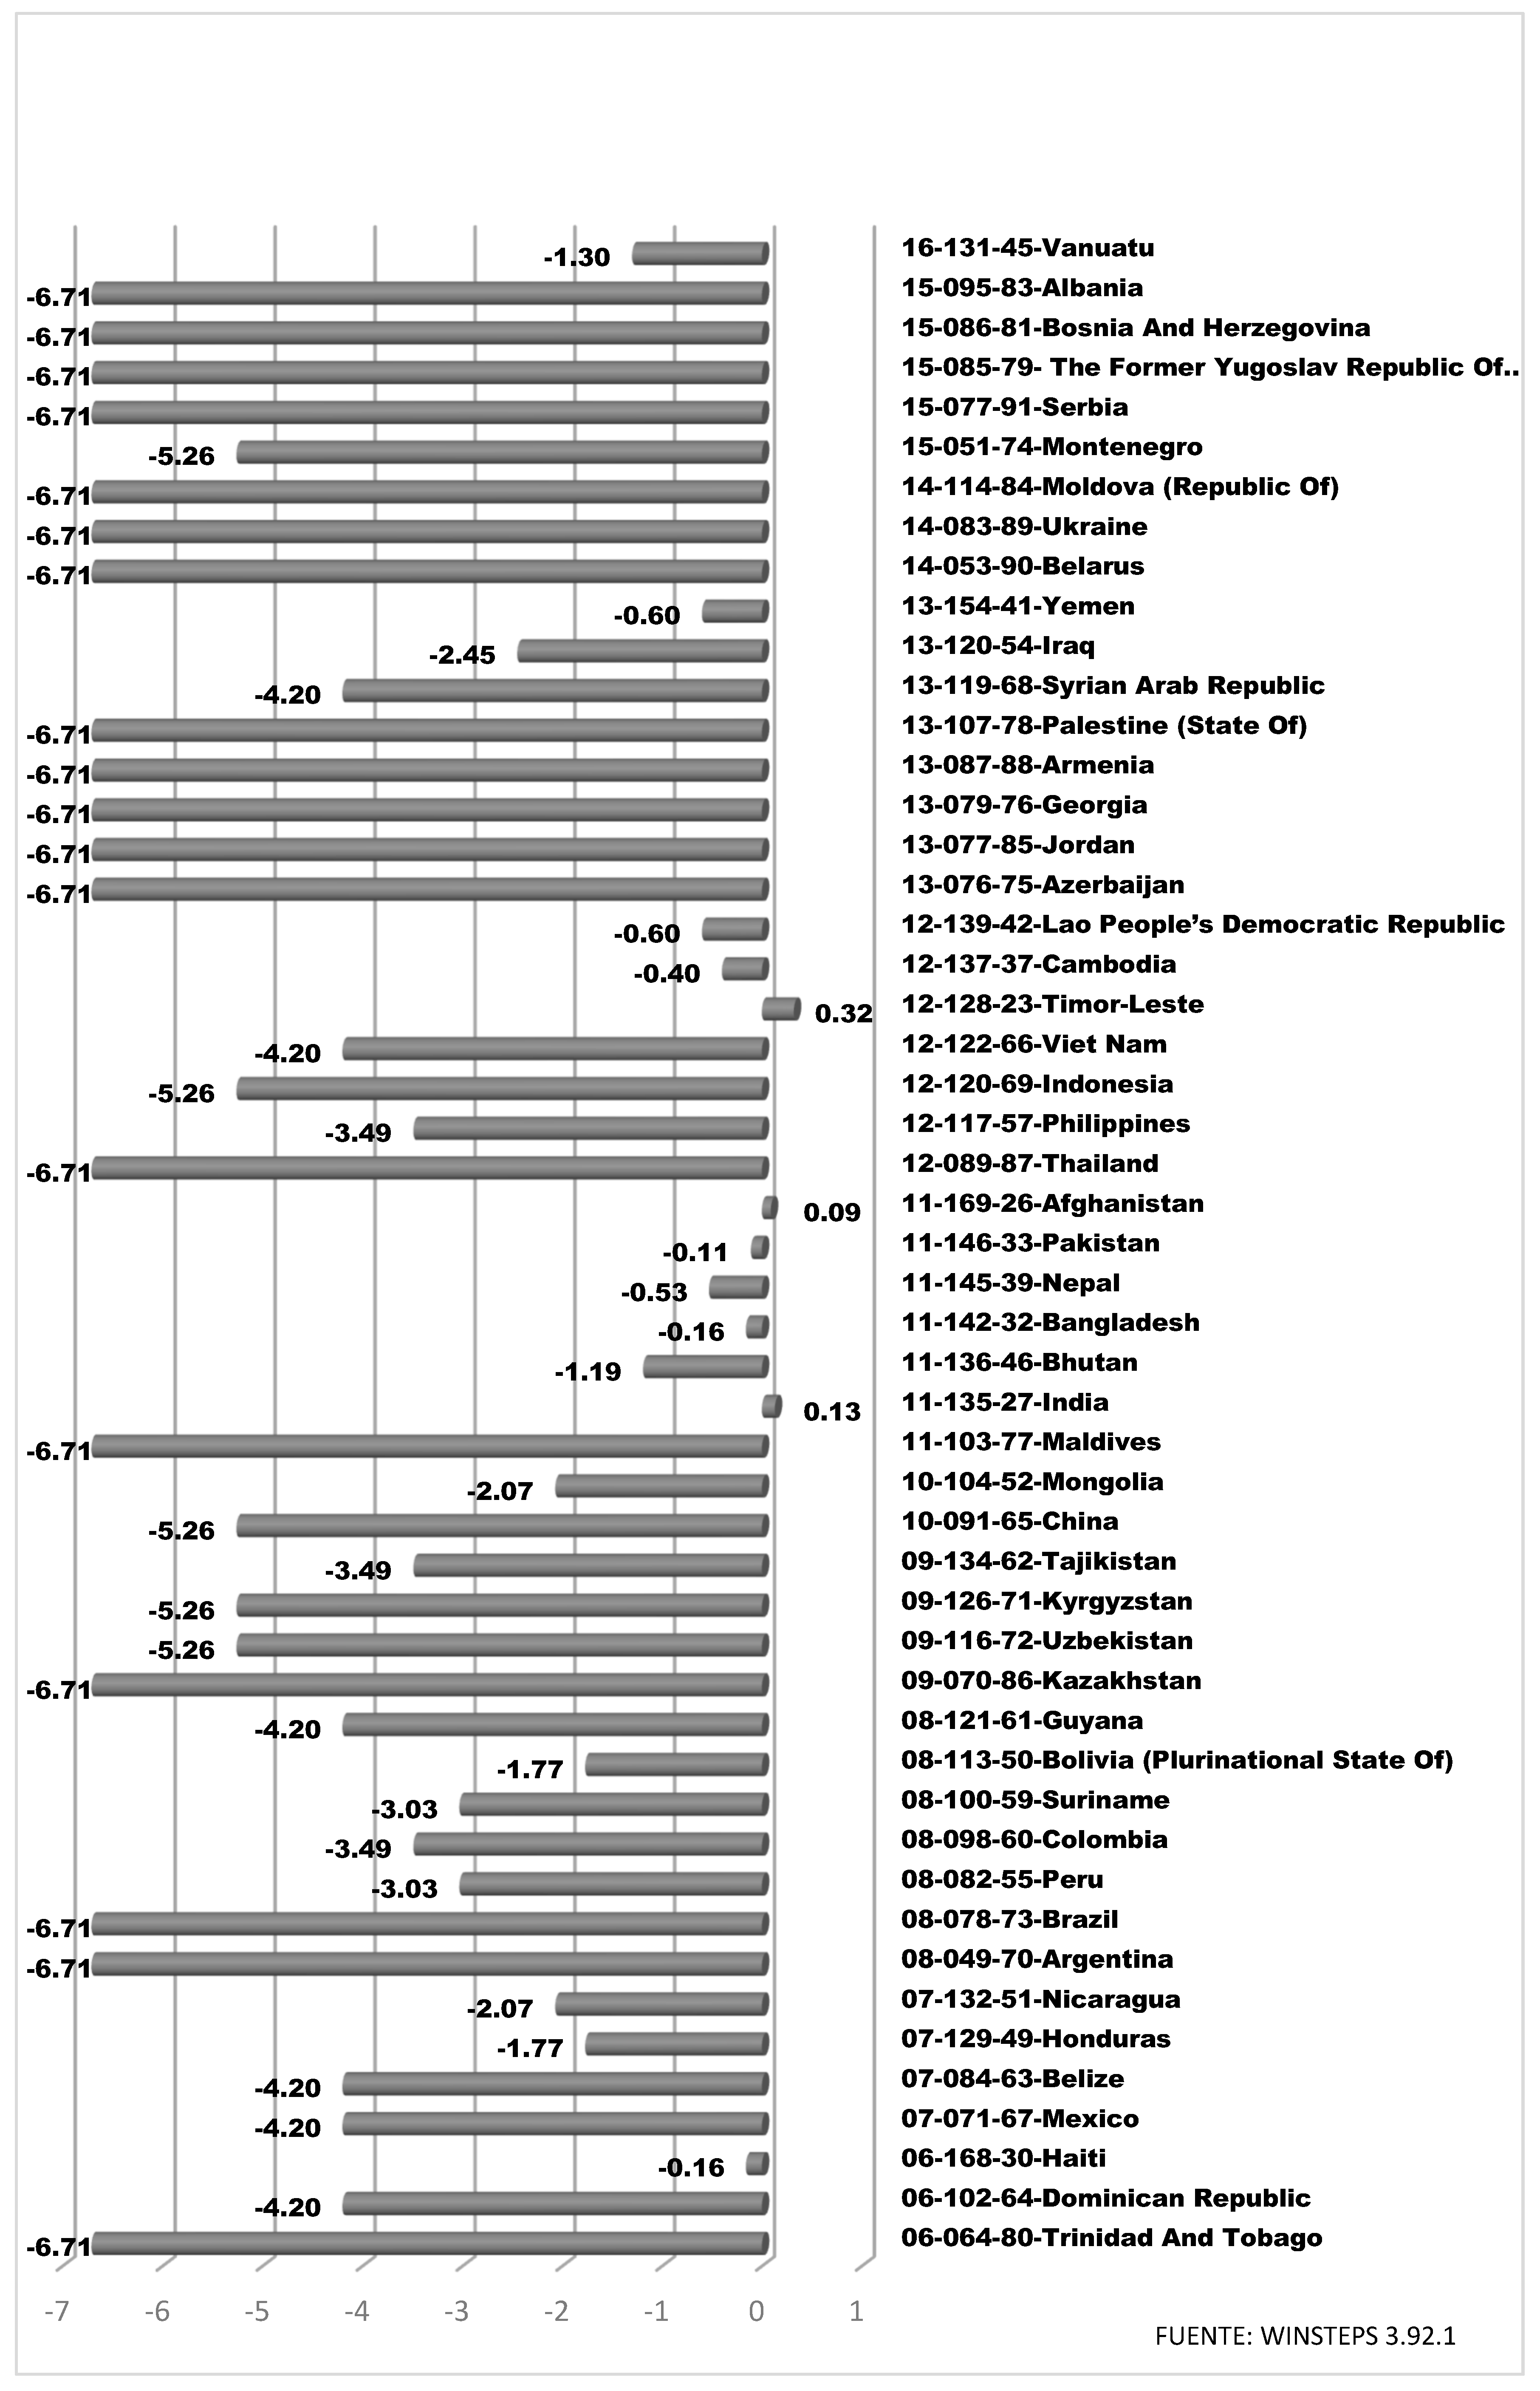
Out of the rest of the 51 countries, 16 are above the average: One in the Caribbean (Haiti); two in Central America (Honduras and Nicaragua); one in South America (Bolivia); six in South Asia, (India, Afghanistan, Pakistan, Bangladesh, Nepal and Bhutan); one in East Asia (Mongolia); three in Southeast Asia (East Timor, Cambodia and Laos); one in Western Asia (Yemen), and one in Oceania (Vanuatu). None arose in Central Asia, Eastern Europe, or Southern Europe. That is, Africa and South Asia, with high levels of population, reflect the actual poverty of the world.
If we observe the corresponding HDI numbers, represented by the three intermediate digits, and the MPI from the last three digits, we can see that the highest levels of poverty correspond to a large extent with levels of low human development and high multidimensional poverty reflected in both indices. Tunisia is one of the countries with the highest HDI ranking (a position of 90, see
Figure 1) and with an MPI among the highest, coinciding with a low level of poverty as shown by our measurement (MPM).
In this case, the differences between MPM and MPI are shown in
Figure 2. There is an important correlation between both, and although they are some notable differences, these differences are not important. Here, Montenegro (−5.26 logits) has a better IPM than Brazil, while in our measurement, Brazil (−6.71 logits) has a lower degree of poverty than Montenegro. The same happens with Argentina (−6.71 logits), which has an MPM that indicates lower poverty than Montenegro, Uzbekistan, and Kyrgyzstan (all with −5.26 logits).
At the other extreme, in the poorest countries, we also find certain differences, such as an MPM of 0.96 logits from Senegal, which puts it at a higher poverty level than Mozambique (0.74 logits), the Democratic Republic of Congo (0.74 logits), Benin (0.79 logits), and Sierra Leone (0.85 logits), which according to the IPG, have greater poverty than Senegal.
The differences are greater in these same countries with regard to their position in the HDI. Here, Peru ranks 56th in the MPM, with greater poverty than Moldova (ranked 87th in the MPM) or the Dominican Republic (ranked 62nd in the MPM), and many others. However, Peru has an HDI that places it 82nd, far behind Moldova at 114th or the Dominican Republic at 164th, and so on.
The opposite happens with Moldova, which is among the countries with the lowest poverty. However, it occupies the 184th place in the HDI ranking of lowest levels of human development.
These differences of the HDI, with respect to the MPI (which tries to measure the same with a different methodology), do not reach the same conclusions. They use a different concept and presents differences as there are between the HDI and the MPI.
Another advantage of the Rasch model is that it allows us to better understand which conditions have the greatest effect on the degree of poverty of the chosen countries. It measures which items are easier to address (situated on the left of the continuum) and which present a greater level of difficulty for improvement.
The Table below shows the conditions (items) that influence the poverty level of a country, ordered by their location in the given range, according to the perception or achievement of each country in terms of economic strength (values of each item along the continuum).

According to the global data obtained in our measurement, the highest measure, and therefore the most difficult to achieve, is the ‘deprivation index measured by education in the estimated poverty,’ which presents a value of 0.48 logits. This is the only value above average and for which most countries show a reduced level, such that those with a higher value are more entrenched in poverty.
This is not the case with the ‘deprivation index measured by living standards in the estimated poverty’ with −0.14 logits or the ‘deprivation index measured by health in the estimated poverty’ with −0.34, both below the mean and presenting high scores.
This indicates that the health variable, as an objective to fight poverty, is more difficult to achieve and causes countries to be at greater poverty levels, followed by the standard of living as the second most difficult to achieve. Thus, countries with poor levels of education, which are the easiest to improve, will have lower MPM values. Those countries which achieve a good level of health will be able to reduce poverty much faster.
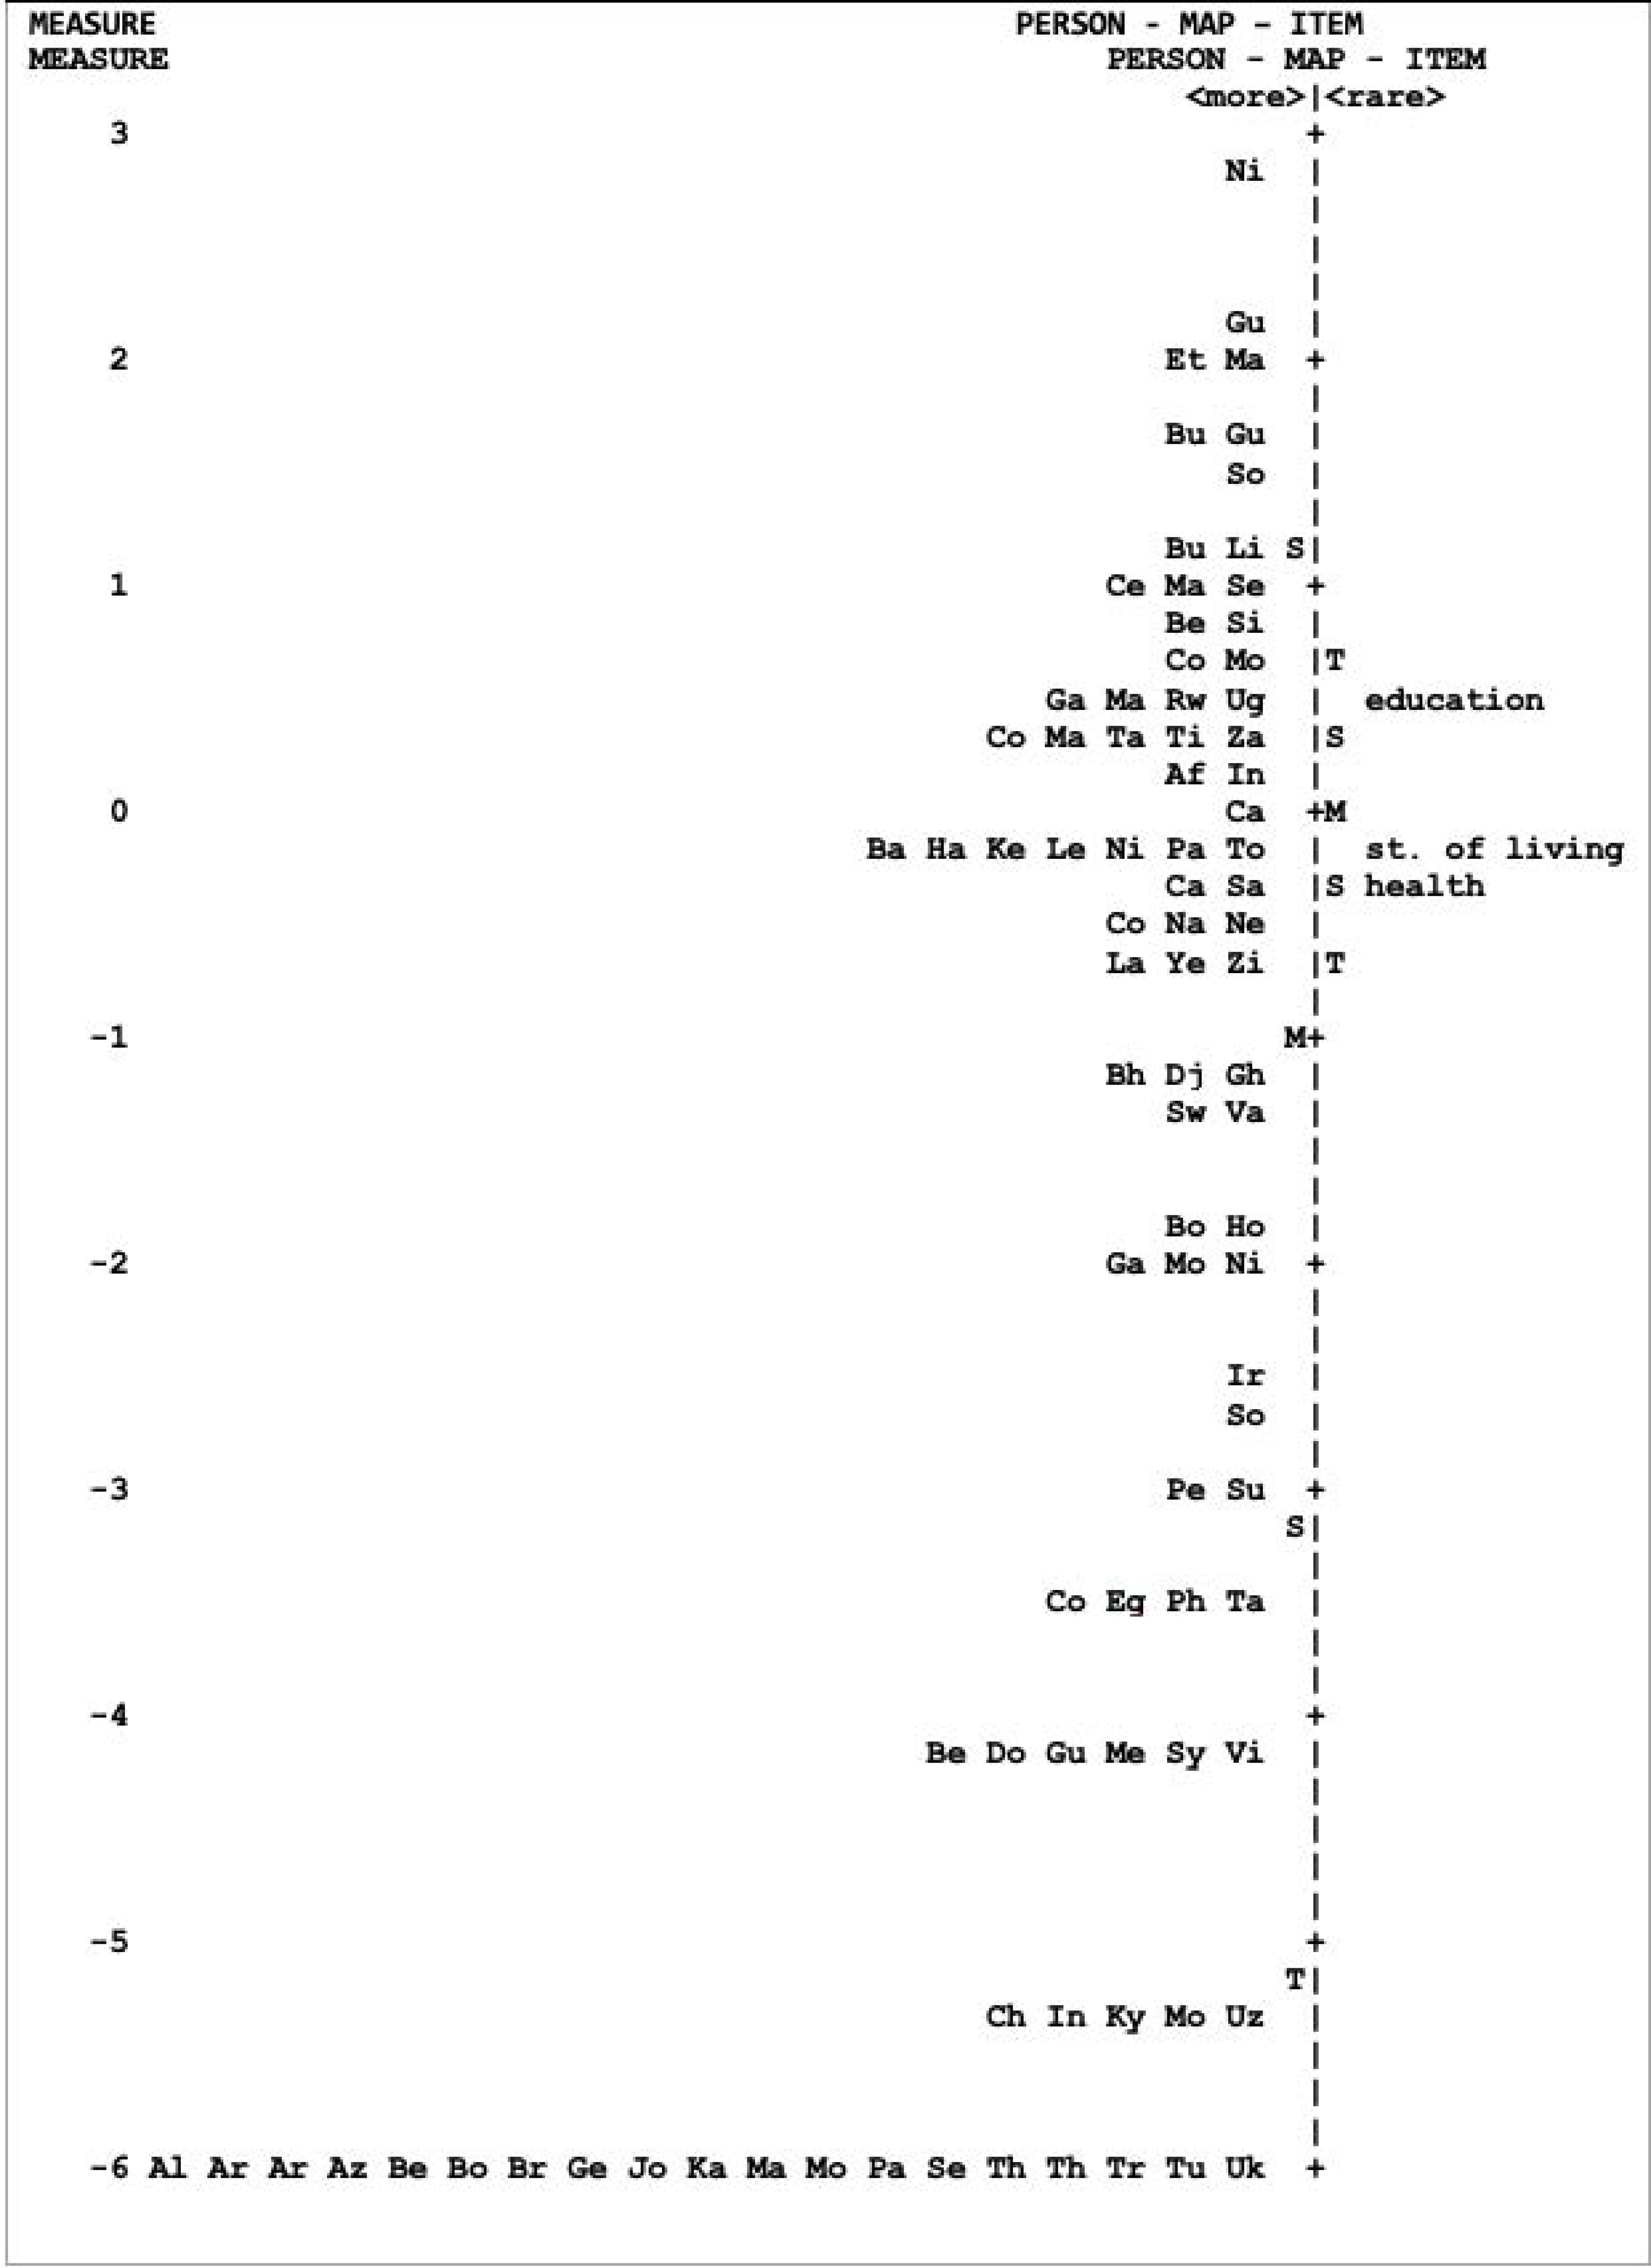
Figure 3 represents a map of the variables with the measures for many of the items for each country.
The main advantage of the Rasch model is that it allows a joint measurement of the values of the items and the countries in the same scale. The country with the highest measurement (more logits units) is the poorest (up to 3 units) and the one with lowest measurement is the least poor (up to −6 units). In regards to the items, education is the easiest to attain and health is the most difficult (0.48 Education, −0.14 Standard of living, −0.34 Health. See
Table 4).
Thus, a higher level of health allows a faster reduction of poverty. The item health is the most difficult to achieve, but at the same time, a good level in this item reduces poverty notably. Consequently, if the achievements are low, the progression in reducing poverty is scarce.
On the other hand, a high level of education is something that the model considers to be normal, therefore, such achievement does not heavily contribute to the progression of reducing poverty. Likewise, a low level of education is something that the model does not expect, and therefore, decreases the possibilities of reducing poverty.
In
Figure 3, the variations in logits units range between 3 and −6, thus, the countries in the last row (close to −6) are those with the lowest levels of poverty, and those close to 3 (on the top of Table) are those with the highest poverty.
Countries above the education line (Ni, Gu, Et, Ma, ... Ug), are the poorest and are unable to even overcome the value of the easiest item to fulfill (education. 0.48 logit,
Table 4).
The countries that are between the lines of education and standard of living (Co, Ma, Ta, Ti, ... Ca) have made progress in education, but have not achieved the suitable levels in standard of living and health (between 0, 14, and 0.48 in
Table 4).
Those below the health line are the least poor and have managed to overcome even the most difficult item (health).
The INFFIT and OUTFIT statistics obtained through the quadratic measure (MNSQ), comparing the difference between the levels observed in the items and the estimate of the Rasch model, provide a comparison of the data set of
Table 2. All the items fit together perfectly, and the degree of poverty for each country appears normal with respect to the whole group.
However, there are a few countries which have been adjusted poorly, where the INFIT or OUTFIT are greater than ±2 logits. Here, the positive residual values in the recorded countries in
Table 5 indicate that they have scored above the expected value for an item, whereas negative residual values indicate they have scored below what the model expected.
This data allows us to consider what actions are necessary to correct the maladjustments.
The main mismatch is Senegal, one of the poorest countries according to the MPM and MPI. The mismatch can be attributed to both internal and external factors. It stems from the standard of living item, with a level of 12 less than the model expected for this country, which presents a significant residual of (−3).
According to
Table 1, Senegal shows a ‘deprivation index measured by standard of living in the estimated poverty’ of 0.11778, lower than other countries with similar levels of education and health than in Senegal. Others, such as Mozambique, with better levels of health and education, show a higher standard of living. The mismatch is due more to external reasons than internal ones, given the higher OUTFIT. Additionally, Senegal has much higher levels of education and health. Concerning the health level, this could be normal. However, the education and health levels are rarely much higher than the standard of living. Afghanistan is close, but no other country shows such a high difference in this regard (
Table 1).
Afghanistan is the second country with maladjustments, not in the standard of living, but in education, with a residual 3, implying that the model expected a level much lower than the one obtained. However, it is certain there are gender-related factors that influence this case and increase the deprivation of education, given that there are very low levels of schooling for girls and women. According to the UNDP report in 2014, in Afghanistan 34% of men and only 5.8% of women had received some form of secondary education.
In Burkina Faso, lower levels of education were also expected, with only 3.2% of men and 0.9% of women receiving secondary education, well below the average of low HDI countries (26.9% of men and 14.9% of women). This explains why the model expects a lower level given their standard of living and health, and the residual (2) shows a level that is too high. However, the fact is still overwhelming with regard to education in this country.
Zimbabwe mismatches in education, since the model states that is too low given the levels of deprivation of health and standard of living (residual −2). In this case, the population with some form of secondary education is 62% of men and 48.8% of women, well above the average level in countries with a weak human development, although this country is among those with an MDM of −0.60 logits, far from the 2.92 of the poorest country (
Figure 1). This maladjustment is in the OUTFIT (2.5 logits), mainly due to external factors, although the INFIT also mismatch (2.1 logits).
Somalia also mismatches in both INFIT and OUTFIT (3.1 and 3.3 logits, respectively), due to the ‘deprivation in health.’ Category 17 is considered too low for the model, taking into account our data set.
Mauritania also shows a maladjustment in health similar to Somalia (−2), as the model considers it underrated. Somalia is the country with the sixth highest poverty index (
Figure 1), while Mauritania is the 17th. The life expectancy at birth in both countries are 55.1 years and 66.1 years, respectively, which are very close to the average of countries with the lowest levels of human development (59.4 years).
5. Summary and Conclusions
Our goal in this article was to quantify poverty in a group of countries for which the United Nations Development Program (UNPD) calculates the Multidimensional Poverty Index (MPI). Throughout our study, we clearly contributed a classification of these countries that does not completely coincide with the MPI. Our results represent a new form of measuring poverty as an alternative to existing methods.
Acknowledging that the two ways of measuring poverty in the two mentioned studies (our index and that of the United Nations) yield very similar results, both are valid despite their slight differences. Our technique, based on probabilities, besides offering a measure of poverty for the countries considered, also provides information that the MPI does not include. The additional information provided can be useful to act with more precision on the variables that determine poverty in the MPI (health, education and standard of living).
Applying the Rasch technique, the results show us the reliability of the achieved results that satisfy the unidimensionality, reliability, validity, and adjustment required for this kind of analysis.
Our findings reaffirm also that the greatest poverty in the world is concentrated in Sub-Saharan African and Southern Asia. On the contrary, Europeans and North Africa present better results.
Another advantage offered by Rasch technique is to clarify which items defining the latent variable (poverty) are more difficult to reach. According to
Table 4, progress in health are the most difficult to achieve but those that make the country to advance more rapidly in its fight against poverty. On the other hand, progress in education are easier to achieve but have less impact in order to reduce poverty.
Table 4 shows the measurement of each item, concluding that countries with the lowest levels of poverty are those that achieve the best results in health. The easiest item to accomplish is education (0.48 logits units), followed by standard of living (−0.14 logits units). These achievements are important, but they do not guarantee a significant advance in the poverty ranking. Consequently, countries with good standard in health progress toward a lower poverty level in a faster way. This information, the weight that each item plays in the poverty measure, is not included in the MPI.
Health is the most difficult objective to achieve, followed by standard of living (with the next degree of difficulty to achieve). Countries with a low standard in education, the easiest goal to achieve, have a higher poverty level.
Additionally, the Rasch technique also shows the anomalous cases, which are reflected in the values that are reached in certain specific items (
Table 5). This information may be very useful in regards to future studies of why these singularities take place in those countries. For example, Senegal has a category 12 in standard of living, which the model estimates to be undervalued (−3), according to the high categories reached in the other two items (18 in education and 24 in health). In Afghanistan, according to the model, the level of education should be lower (the indicator is overvalued in 3), and in Somalia health levels are undervalued (−2). The country should have a higher level of health according to the information obtained.
The rest of the countries do not present anomalous indicators, their infit and outfit are acceptable (all below ±2 units logit).
The Rasch technique offers many other possibilities by expanding the number of items or analyzing a different group of countries. Also, due to the limited extension of this article, we did not include another output offered by Rasch, detecting the items for each country that the model considers to be a strength or a weakness facing its development.
Finally, it must be considered that we calculate the dimensions while taking into account the context of each country and the period of time referred, as variations in these data could change the results. It is true that other factors may influence the results obtained.
In conclusion, our objective was not to make a comparison with the United Nations Index. Instead, our contribution focused on revealing the advantages and the additional information that Rasch offers concerning factors that determine poverty. This additional information is important to underline the topics of special interest in each country in order to plan more in-depth studies, or improve government actions on the three mentioned variables to reduce poverty.


