Article

Simulating the Hydrological Impact of Green Roof Use and an Increase in Green Areas in an Urban Catchment with i-Tree: A Case Study with the Town of Fontibón in Bogotá, Colombia

by
David Bautista
and
Carlos Peña-Guzmán
*
Environmental Engineering Program, Universidad Santo Tomas, Bogotá 110311, Colombia
*
Author to whom correspondence should be addressed.
Resources 2019, 8(2), 68; https://doi.org/10.3390/resources8020068
Submission received: 8 February 2019 / Revised: 1 April 2019 / Accepted: 3 April 2019 / Published: 9 April 2019
(This article belongs to the Special Issue Integrated Urban Water Resources Management and Policy)

Abstract

:
Urbanization has produced various social, environmental, and hydrological impacts, such as reduced biodiversity, increased urban temperatures, ecosystem degradation, air and water pollution, changes to hydrological processes, groundwater recharge alterations, increased prevalence of floods, vegetation removal, and potential increases in unstable soils. Finding solutions to mitigate the impacts of urbanization is of vital importance in the development and planning of cities, and particularly so for developing countries. One strategy gaining momentum is the use of green roofs and larger green areas (greater green cover under trees, with the purpose of increasing the permeable area) for runoff control. In this study, a simulation was carried out using the i-Tree Hydro software that involved the urban basin in the Fontibón area of Bogotá, Colombia, with the aim of observing the hydrological benefits of trees, green areas, and permeable zones. Five scenarios were proposed in which green roof coverage was implemented (20% and 50% increases in green areas in Scenarios 1 and 2), coverage under existing trees was enhanced (50% and 100% increase in Scenarios 4 and 5), and finally a complete removal of green zones in Fontibón was simulated (Scenario 3). The town is relatively susceptible to a reduction in its existing green areas, with an increase in total flow of more than 50% for one scenario considered. Thus, an increase in the permeable coverage under trees (50% and 100% increased coverage under existing trees) provided the best strategy for mitigating the impacts of urbanization by reducing the total, maximum, and average impervious flow by 3%, 4%, and 8%, respectively. Finally, an increase in permeable zones corresponding to plants was proposed via the implementation of green roofs. However, this strategy showed a response to the reduction in the lowest total flow at 1%.

1. Introduction

More people currently live in urban areas than in rural ones [1]; by 2014, 54% of the world population were living in urban areas and it is projected that by 2050 66% of the population will live in this type of zone [2]. Rapid growth and poor planning of cities has created numerous environmental, social, and landscape impacts, such as biodiversity loss, ecosystem degradation, natural resource pollution, an increased prevalence of floods, decreased area of natural resources, increased demand for water, elimination of vegetation layers, increased extent of unstable soils, decreased groundwater recharge, and various human health effects [3,4,5,6,7,8].
The alteration of hydrological processes is of great concern since these can considerably modify the water balance [9], reduce evapotranspiration [10], affect groundwater recharge [11], alter hydraulic runoff processes [12], cause surface water quality and runoff degradation [13], and increase the peak during precipitation events [14], which can cause the overflow of storm drains or combined sewers [15]. Flows in urban basins may exceed those in less urbanized or non-urbanized basins by between 30% and 100% [16].
Permeable zones and green structures in urban environments are fundamental components of the design and planning for sustainable cities. Various investigations have determined the role that these structures play in mitigating heat island effects, pollutant removal from air and runoff water, their influence on the carbon cycle, and greenhouse gas reduction [17,18]. Vegetation cover is necessary to avoid oversaturating the processes taking place within a water system (e.g., infiltration, runoff, evapotranspiration). Urban green areas are also used as a strategy to prevent flooding since they increase the permeable surface within basins [19,20], on the other hand, some research has shown that the green roof help to reduce the annual runoff volume by 40% and peak discharge by 15% [21]. The World Health Organization has therefore established as an objective that at least nine square meters of green space are available per inhabitant, which would reduce runoff rates and decrease the maximum water flow levels; in contemporary Latin American cities an average of only 3.5 square meters of green space is available per inhabitant [22]. Finally, other benefits found to arise from the adoption and implementation of green areas in urban spaces include the better physical condition of inhabitants, improvements to the health and wellbeing of the people who live and work in these spaces, purification of the air and the water, filtering of wind and noise, and stabilization of the microclimate [23].
Models and tools that integrate different components of the spatial and temporal dynamics of the urban water cycle can aid in deciphering the complexity associated with long-term planning [24]. The i-Tree hydro software application is one of these tools. i-Tree is a semi-distributed physical model based on rainfall runoff that combines concepts of urban and forest hydrology [25]. This model takes into account processes previously carried out in an OBJect-oriented TOPographic-based (OBJTOP) model [25] (Figure 1) and simulates the hydrological processes of precipitation, interception, evaporation, infiltration, and runoff using data inputs that include near-surface weather, land surface elevation, and land cover along with parameters characterizing the channel, soil, and vegetation [26]. Potential evapotranspiration is calculated using a modified Penman–Monteith equation [27] and the water balance is simulated based on mechanical equations and the topographic index [28]. The model functions to quantify and assess the structure of urban forests and effects associated with them, such as pollution removal, carbon dioxide capture, greenhouse gas emissions avoided by the implementation of green structures or tree cover, energy savings, and pluvial runoff water reduction [29].
Factors important for flood generation include poor city planning, climate change, accelerated population growth, and the spread of impervious areas. These global problems are present in Bogotá, Colombia, where surface runoff and poor flood control have generated several areas that are vulnerable to flooding. One specific area in Bogotá is the town of Fontibón [30]. According to the European Commission, a green structure is recognized as infrastructure providing an intelligent solution to the challenges of today [31]. Regardless of their type and structure, green structures form a set of spaces with specific uses and different biological functions, meant to allow multipurpose uses for both outdoor recreational and landscape integration of buildings or building ensembles [32]. This research presents the results of five simulations of runoff flows in the town of Fontibón, Bogotá, with either increased or reduced numbers of impermeable areas.

2. Materials and Methods
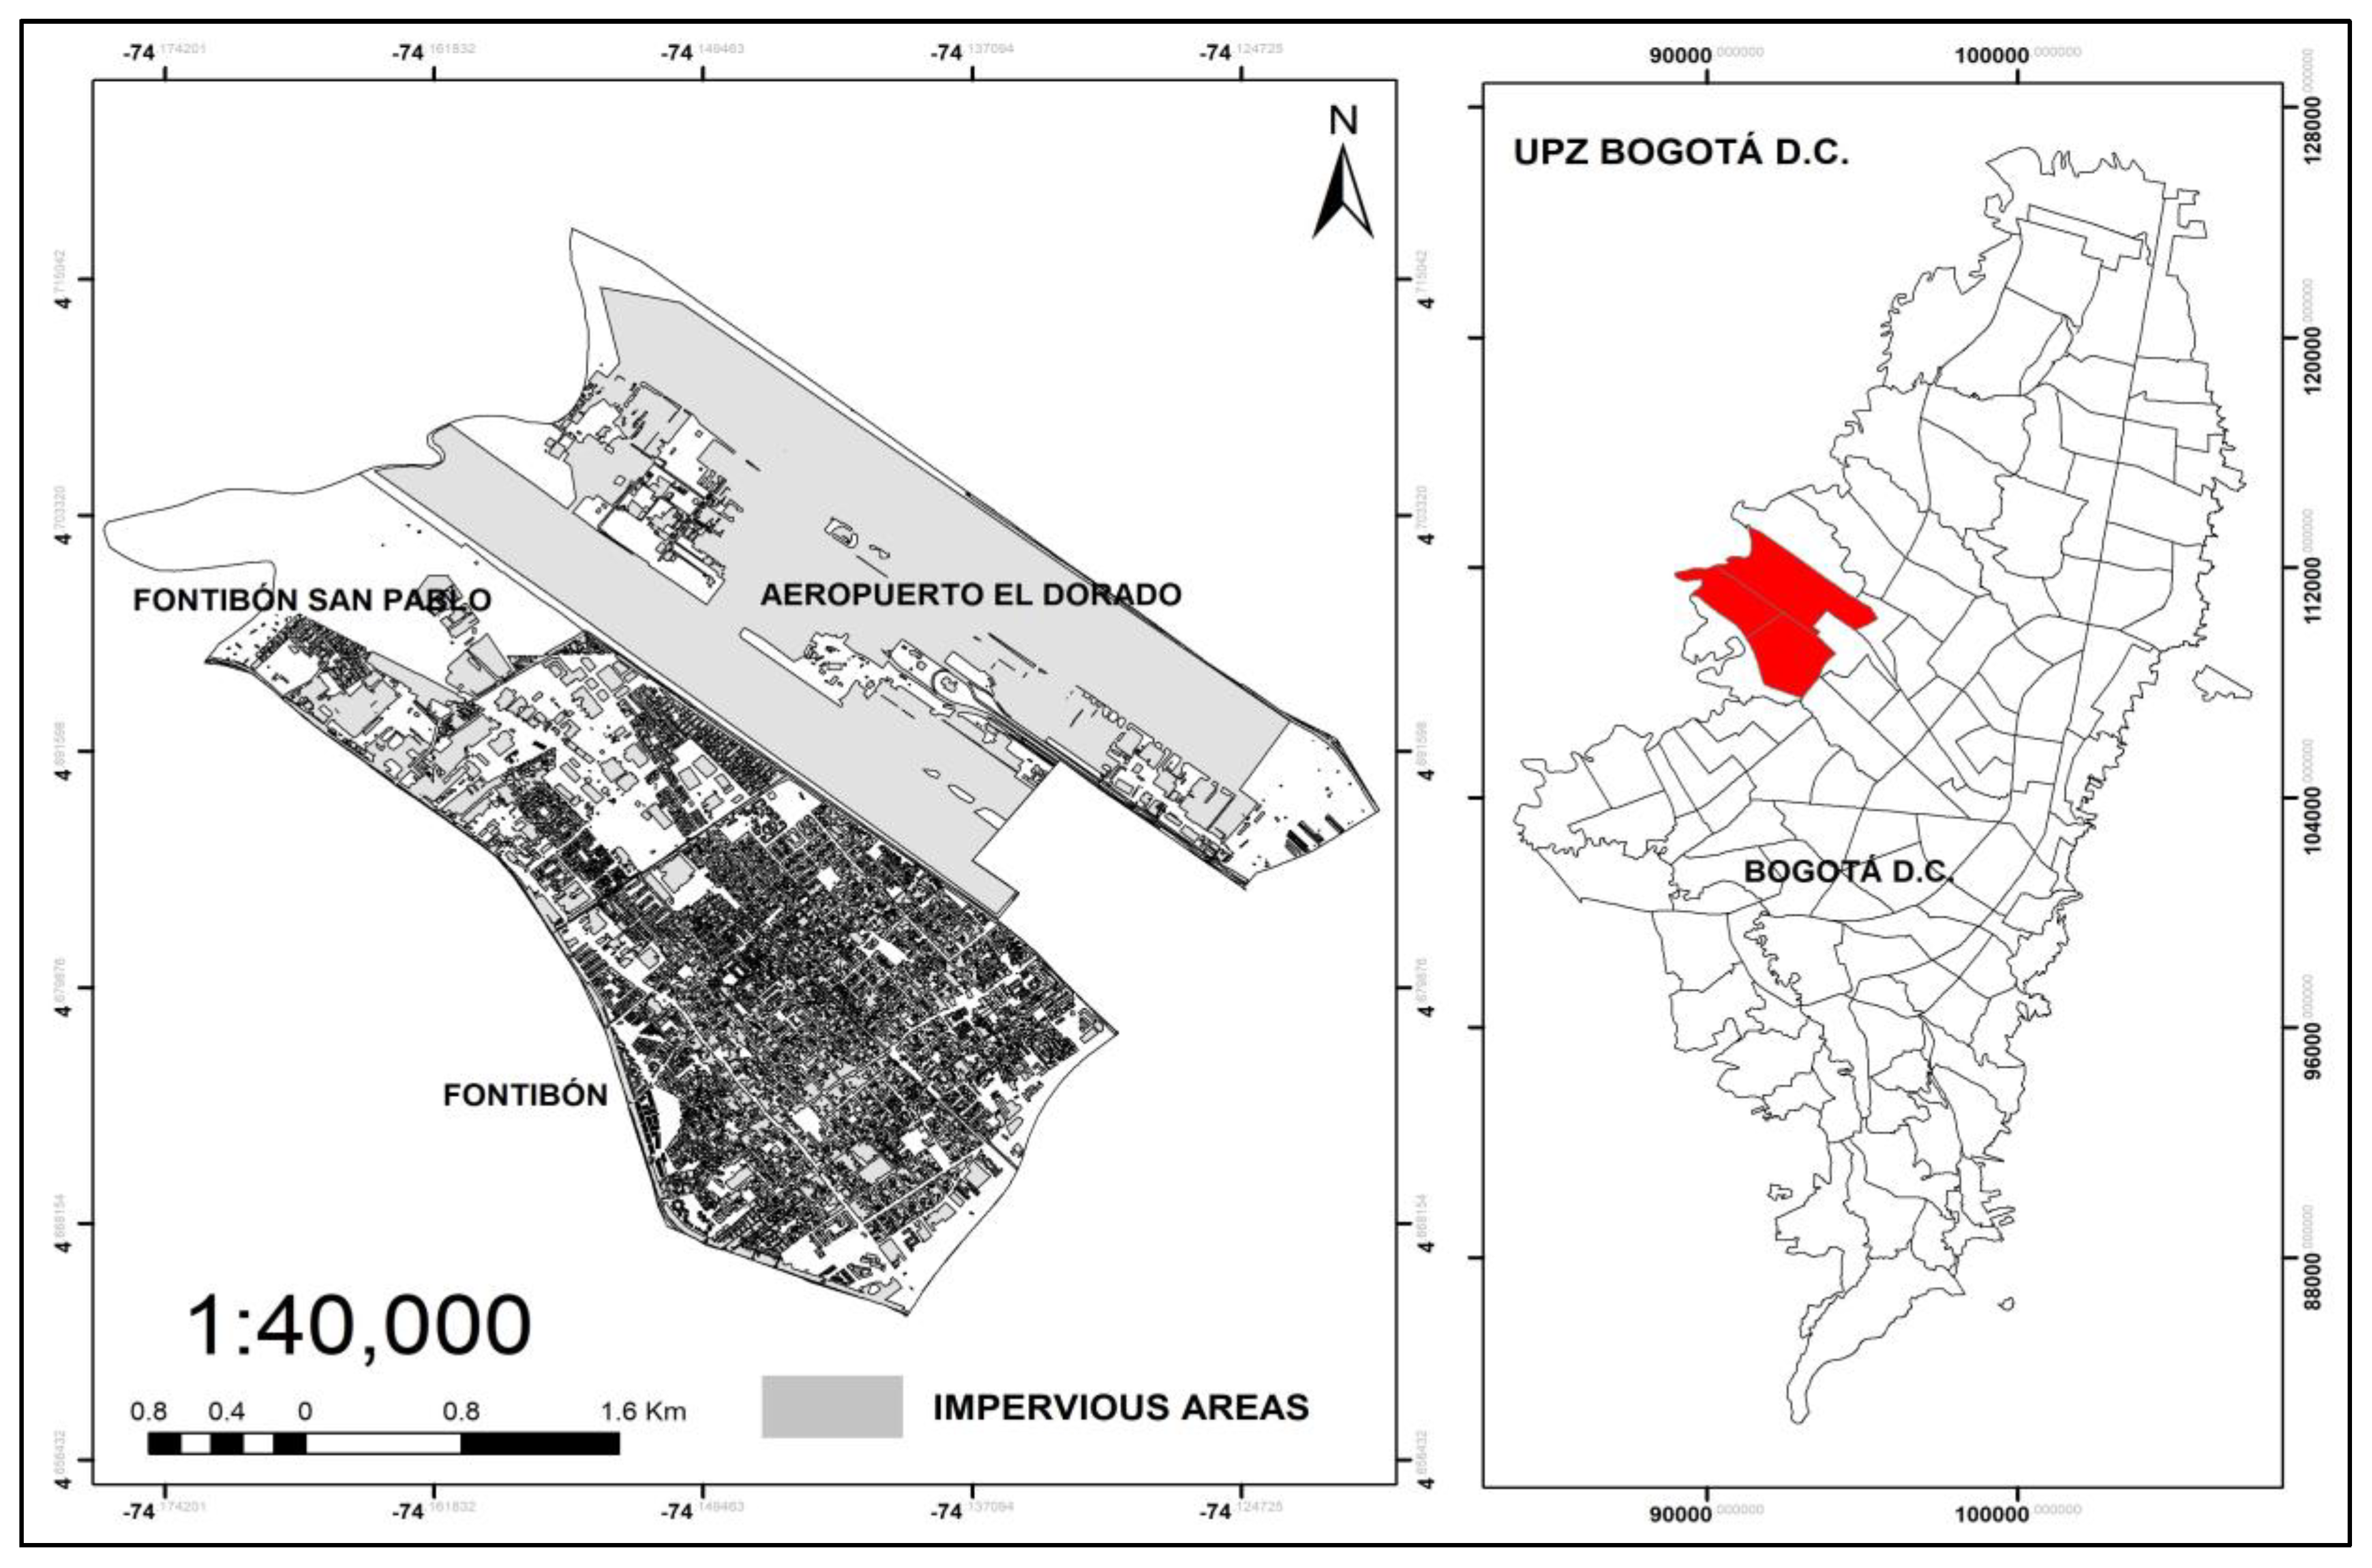
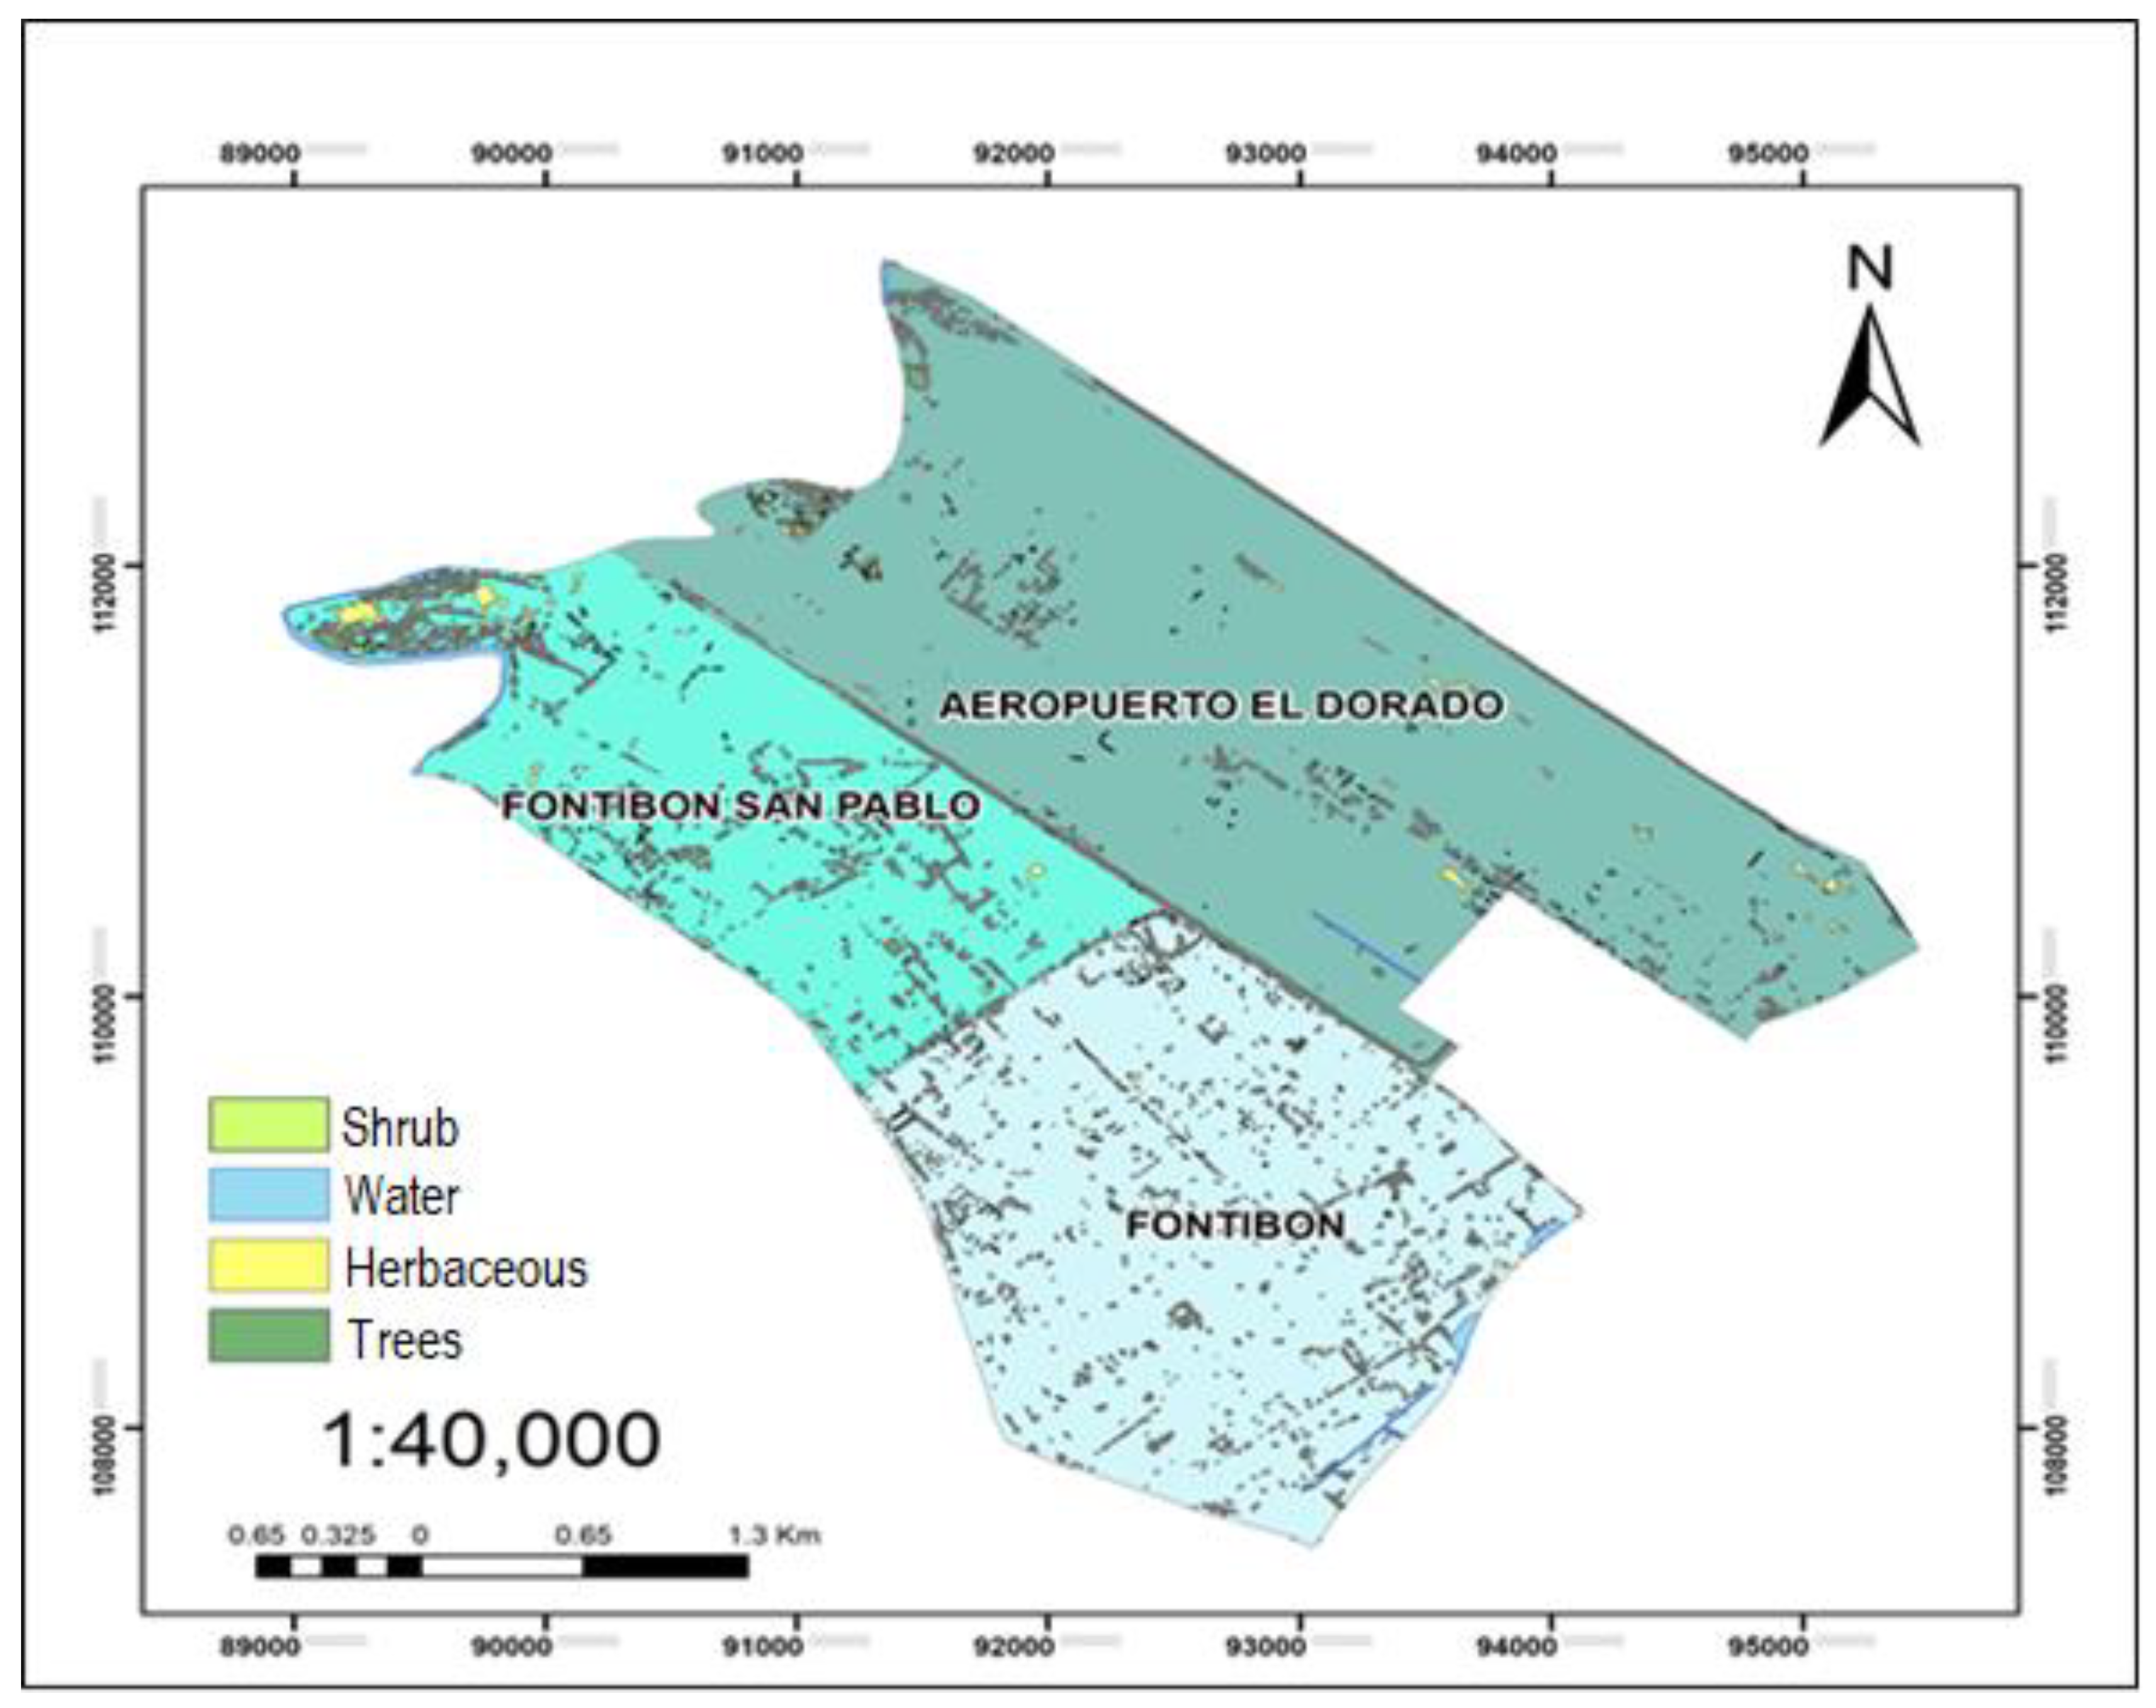
2.1. Location

Fontibón is located in the northwestern part of Bogotá, and has a total area of 3325.88 hectares, corresponding to 3.9% of Bogotá’s total urban area. Of the total area, 91.78% is urban land and 8.22% is expanding soils, which are areas where conditions are very good for further urbanization during the period for which the Bogotá Distrito Capital (D.C) Land Use Plan is valid. Considering the demand for new housing and environmental protection areas, in 2010, the population of Fontibón had a greater number of women (52.6%) than men (47.4%), and the age structure was 51% adult (167,521 individuals), 25% youth (82,041), 15% children (50,713), and 9% older adults (29,881) [33]. The average annual temperature is 14.5 °C and average annual rainfall is 794 mm, with April–June and October–November rainy periods, and periods with less rain and a predominance of dry weather during December–January and July–August [34]. The land-use of Fontibón is divided into six areas of activity: 24.7% is non-residential land designated as land for the location of the services necessary for urban life and to ensure recreation and relaxation of the population and El Dorado airport; 20.5% is residential land; 20.9% is integral urban land intended for urban projects that combine residential, commercial, and service, industrial, and non-residential areas (development of mixed projects); 19% is used for industrial purposes; 10.3% is used for commercial and service purposes; and 4.6% is protected land [35]. For this investigation, the zonal planning units (ZPU) encompassing the El Dorado Airport, Fontibón, and Fontibón San Pablo with 1,027, 148,156, and 35,589 inhabitants in 2015, respectively, were selected as areas of study for two reasons. First these areas have the fewest parks and green areas per inhabitant (0.25, 1.65, and 2.16 m2 per inhabitant, respectively) [36], and second, because of the constant flooding from stormwater drainage systems in these areas. These areas are shown in Figure 1.
In Figure 1 we can see the three ZPU as the administrative units selected for research as described above. In the upper part the gray color indicates impermeable areas throughout the study area, which cover most of the area selected for the investigation. On the other hand, in the model it is necessary to enter the permeable zones, which are divided into trees, shrubs, herbaceous, and water bodies, as can be observed in the lower part of Figure 1 in the three ZPU selected (which differ with a combination of blue colors). This permeable cover was digitized by means of a Geographic Information System (GIS) with the orthophoto of Bogotá DC as Web Map Service (WMS) data provided by the Special Administrative Unit of the Cadastral District (IDECA). Finally, the soil cover is calculated by subtracting from the total area of the three zones the sum of each permeable and impermeable area described above. Lastly, it is emphasized that Figure 1 does not provide any information regarding the land-use in the study area.

2.2. i-Tree Hydro

i-Tree Hydro is a software application developed by the United States Department of Agriculture (USDA) Forest Service, which enables comparative analysis of different land cover scenarios and their hydrological impacts at various scales [37]. i-Tree is parameterized with several sets of data, of which the following are predominant: soil cover percentage, digital elevation model (DEM), meteorology, and hourly flow data. These data are used to calibrate the model by comparing the simulated flow in the basin with real flow data. This tool simulates the hydrological processes of precipitation, interception, evapotranspiration, infiltration, and runoff [26], and was developed to replace runoff models based on a curve number with hydrological model-based processes. The i-Tree Hydro application therefore represents the latest generation of computational development in this area. The i-tree process is shown in Figure 2.
TOPMODEL (TOPography based hydrological MODEL) is a semi-distributed model that represents a simplified version of hydrological response spatial variability in which topography is spatially considered [38]. The present version of OBJTOP (OBJect-oriented programming TOPMODEL) is a rainfall-runoff model that incorporates and extends the hydrologic concepts developed in the original TOPMODEL [39]. OBJTOP is designed to represent heterogeneity in topography, soil, and rainfall, which all cause spatial differences in runoff [40]. The Urban Forest Effects Model, UFORE, was developed to help managers to quantify urban forest structure and its functions. This model was designed to use standardized data from randomly located plots, local hourly air pollution, and meteorological data to quantify the urban forest structure and numerous urban forest effects for cities across the world [41]. UFORE is designed for municipal land cover managers and researchers, with algorithms selected, modified, or developed for minimal data input requirements such that most urban areas are able to readily apply the model [42].
Models like SWAT (Soil and Water Assessment Tool) account for very specific hydrological aspects that help to manage a resource and assess impacts [43], but are limited with respect to processes such as infiltration since they only take into account the curve number, without considering the interception of vegetation and the contribution of evapotranspiration [44]. Other models, such as TR-55, present very simplified procedures for estimating runoff and maximum discharge in small urban watersheds [45,46]. On the other hand, programs or programming language such as FORTRAN, developed in the late 1970s [47], and SWMM, a tool that simulates both the quantity and the quality of water evacuated in urban sewage systems [48], require numerous input parameters, but do not provide an adequate simulation of vegetation influences [42]. Each model is differentiated by a series of unique attributes, mainly in their potential applications, temporal resolution, scale, catchment and drainage network representation, runoff generation, flow routing, pollutant range, water transport and treatment, user interface, and model integration [49]. Given these considerations, the i-Tree hydro program was selected as a tool for estimating the hydrological benefits of green areas in this study since it takes into account both hydrological and climatological parameters.
Results of the i-Tree model are useful for reporting on urban forest management, urban planning, and design to improve water quality and reduce the risk of flooding. Further, the results indicate how various management practices affect water quality. The precipitation input data can be altered in order to simulate storms of various intensities. The model can assess how management practices affect the responses of local currents to storms. It can inform the community, and more specifically, the entities responsible for planning and urban design, to help improve water quality and reduce the risk of flooding [50].
Results obtained with i-Tree hydro by different authors around the world are presented in Table 1.

2.3. Input Data

The input variables used, their sources, and their units are listed in Table 2. Geographic information was obtained from the IDECA using a 2017 reference map for Bogotá that represents the impermeable areas in the Fucha basin, and shows the shapes of platforms, roadways, cycle paths, construction, and bridges. Digitalization of the permeable zones coverage was carried out with the help of an orthophotograph of Bogotá from 2014.
Hourly climatological data for the years 2000–2016 from the APTO EL DORADO station (code 21205790, latitude 4° 42′, longitude 74° 09′, elevation of 2547 m a.s.l.) were obtained from the Institute of Hydrology, Meteorology, and Environmental Studies (IDEAM). Data units were converted (from the International System of units to English units) and the data was formatted according to the archives standard of the National Climatic Data Center (NCDC) of the United States so that it conformed with the i-Tree Hydro software. Hydrological data (average daily flows of the Fucha river) were obtained from the ESP Sewerage and Sanitation Company of Bogotá ESP (hereinafter EAAB) and daily flow data from the Fontibón–Río Fucha station (item 20822 (L-017), latitude 4° 40′, longitude 74° 09′, elevation of 2,585 m a.s.l.). Hydrologic data were obtained for the years 2000–2007 since these were all that was available from the Water Supply and Sewerage Company of Bogotá (EAB for its acronym in Spanish).
Data for 2000–2005 was used for calibration. i-Tree Hydro software based on UFORE-Hydro is designed for municipal land cover managers and researchers, with algorithms selected, modified, or developed for minimal data input requirements such that most urban areas would be able to readily apply the model. Land cover inputs into the model can take any spatial dimensions. Meteorological data for the model can be entered at any regular timestep (hourly data for this research were used). UFORE-Hydro provides an option for automated calibration of the observed discharge using the Parameter ESTimation (PEST) routines of Doherty, which, based on user preferences, are called either a gradient-based or genetic algorithm-based calibration procedure. Outputs at each timestep include canopy interception, impervious depression storage, infiltration, evapotranspiration, surface (pervious and impervious) and subsurface runoff, and channel discharge [42]. For validation, it uses temporality data from 2006 to 2007.

2.4. Scenarios

Five scenarios were proposed with respect to the base scenario for the three ZPU selected for research (Table 3).
The proposed land cover distribution descriptions of Fontibón for the five scenarios and the baseline condition are provided in Table 4. For scenarios 4 and 5, the base land cover conditions were not changed, only the coverage under the trees was modified to increase the permeable area as described in Table 3. The total area was 33.28 km2.

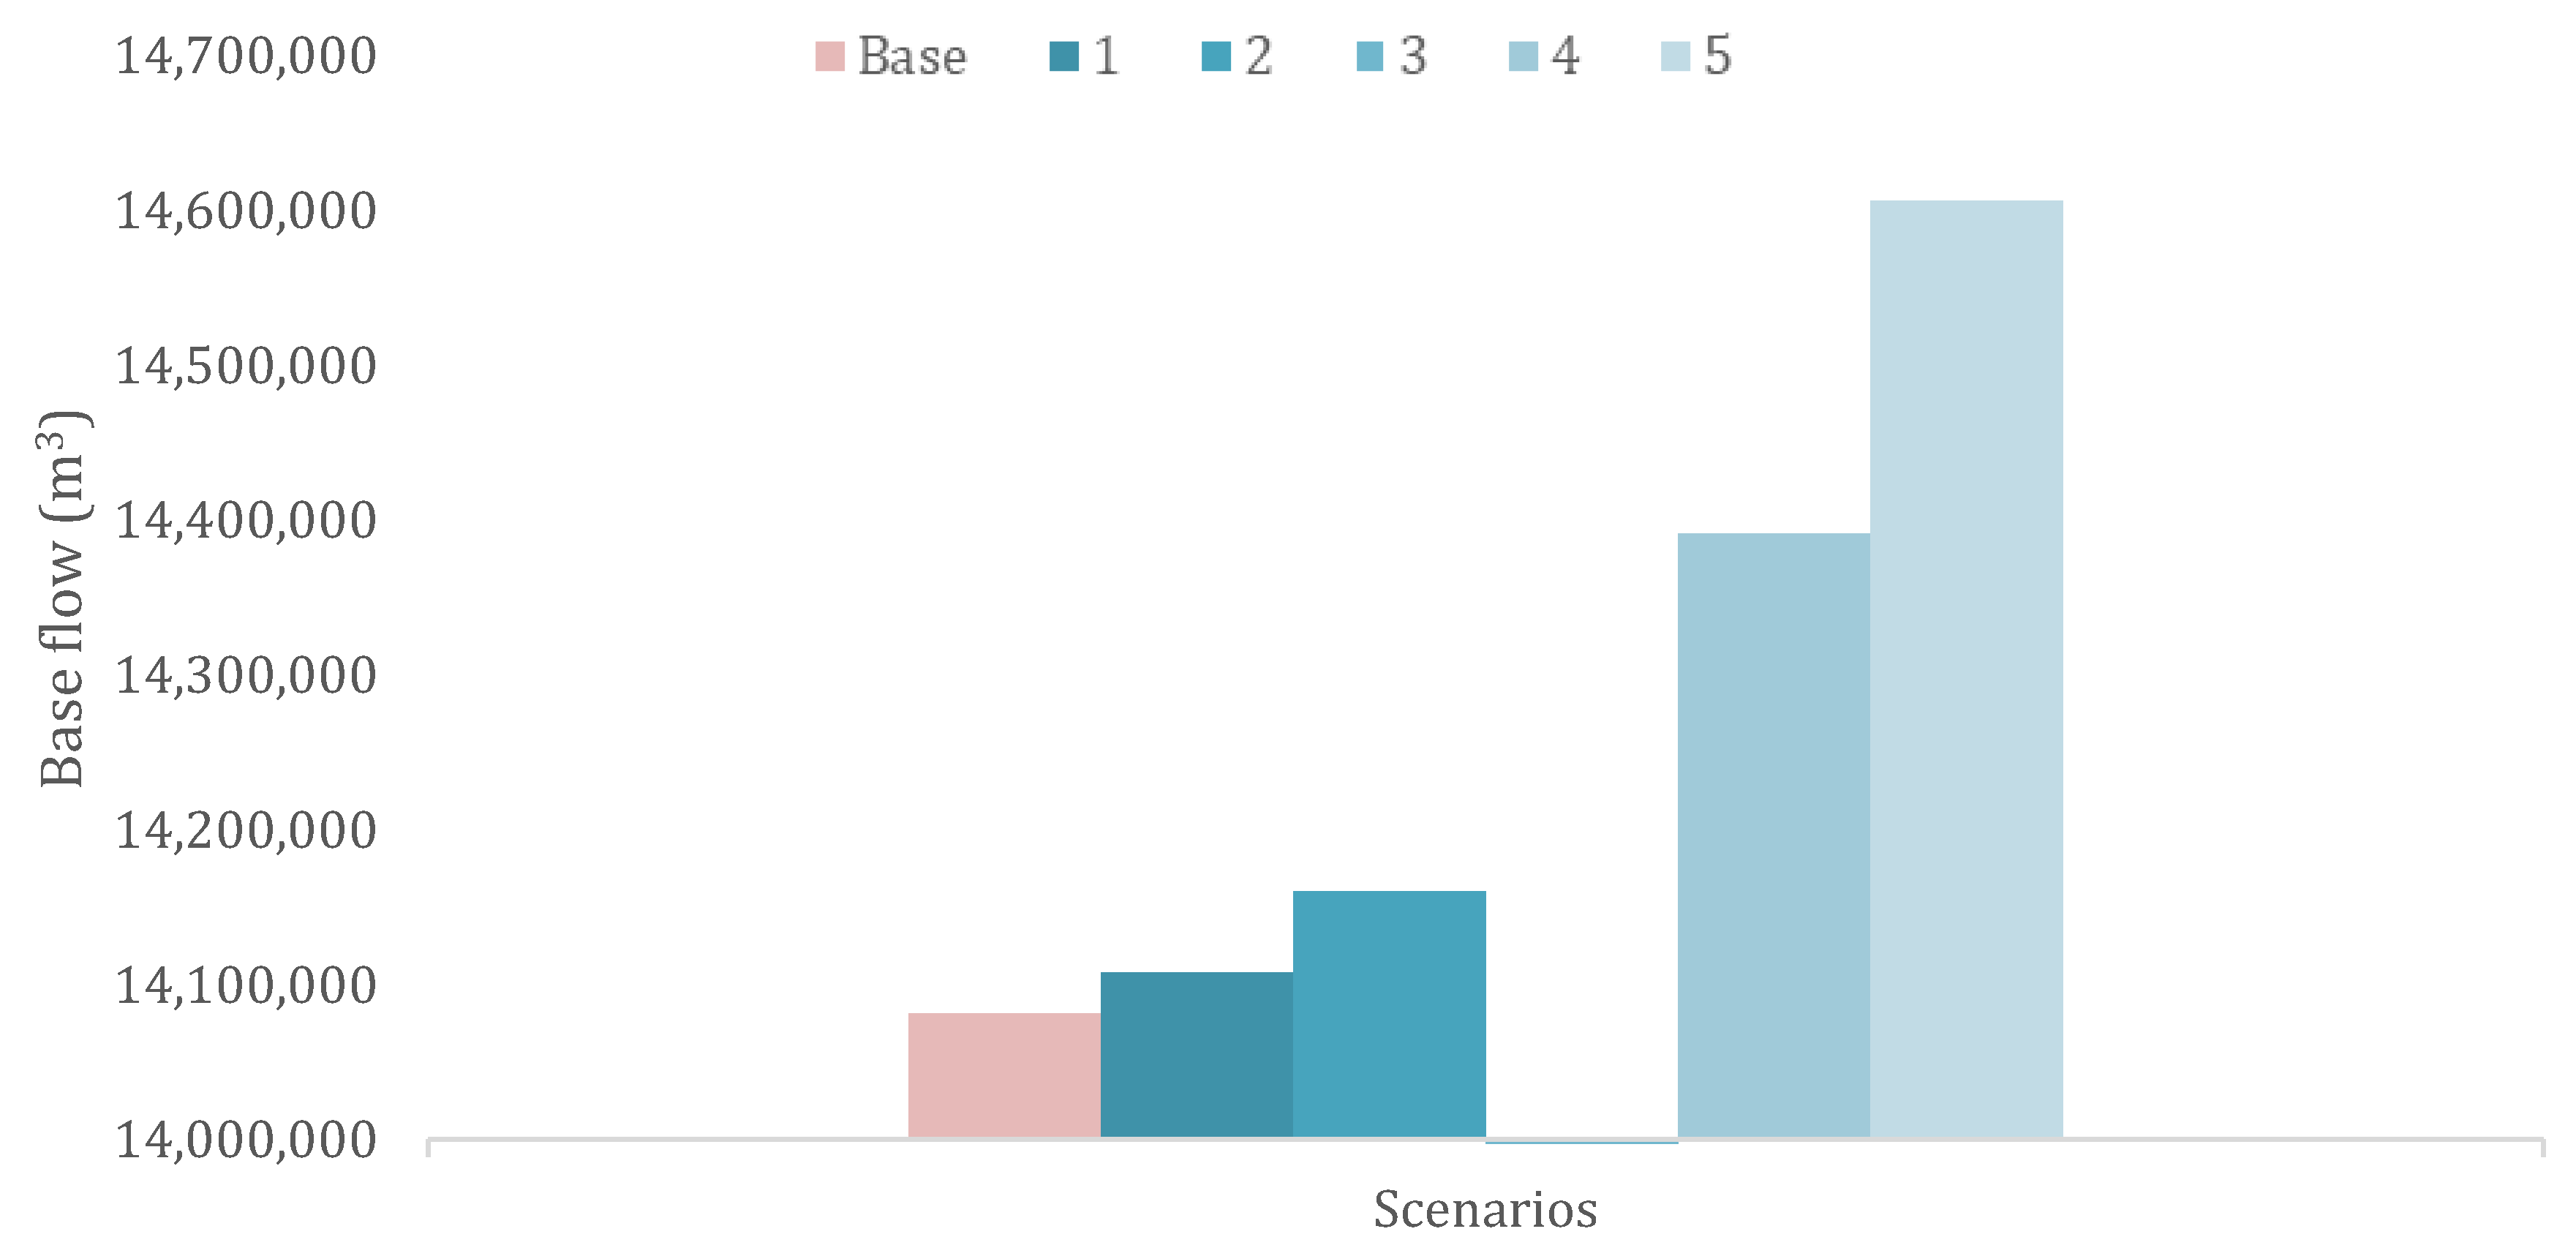
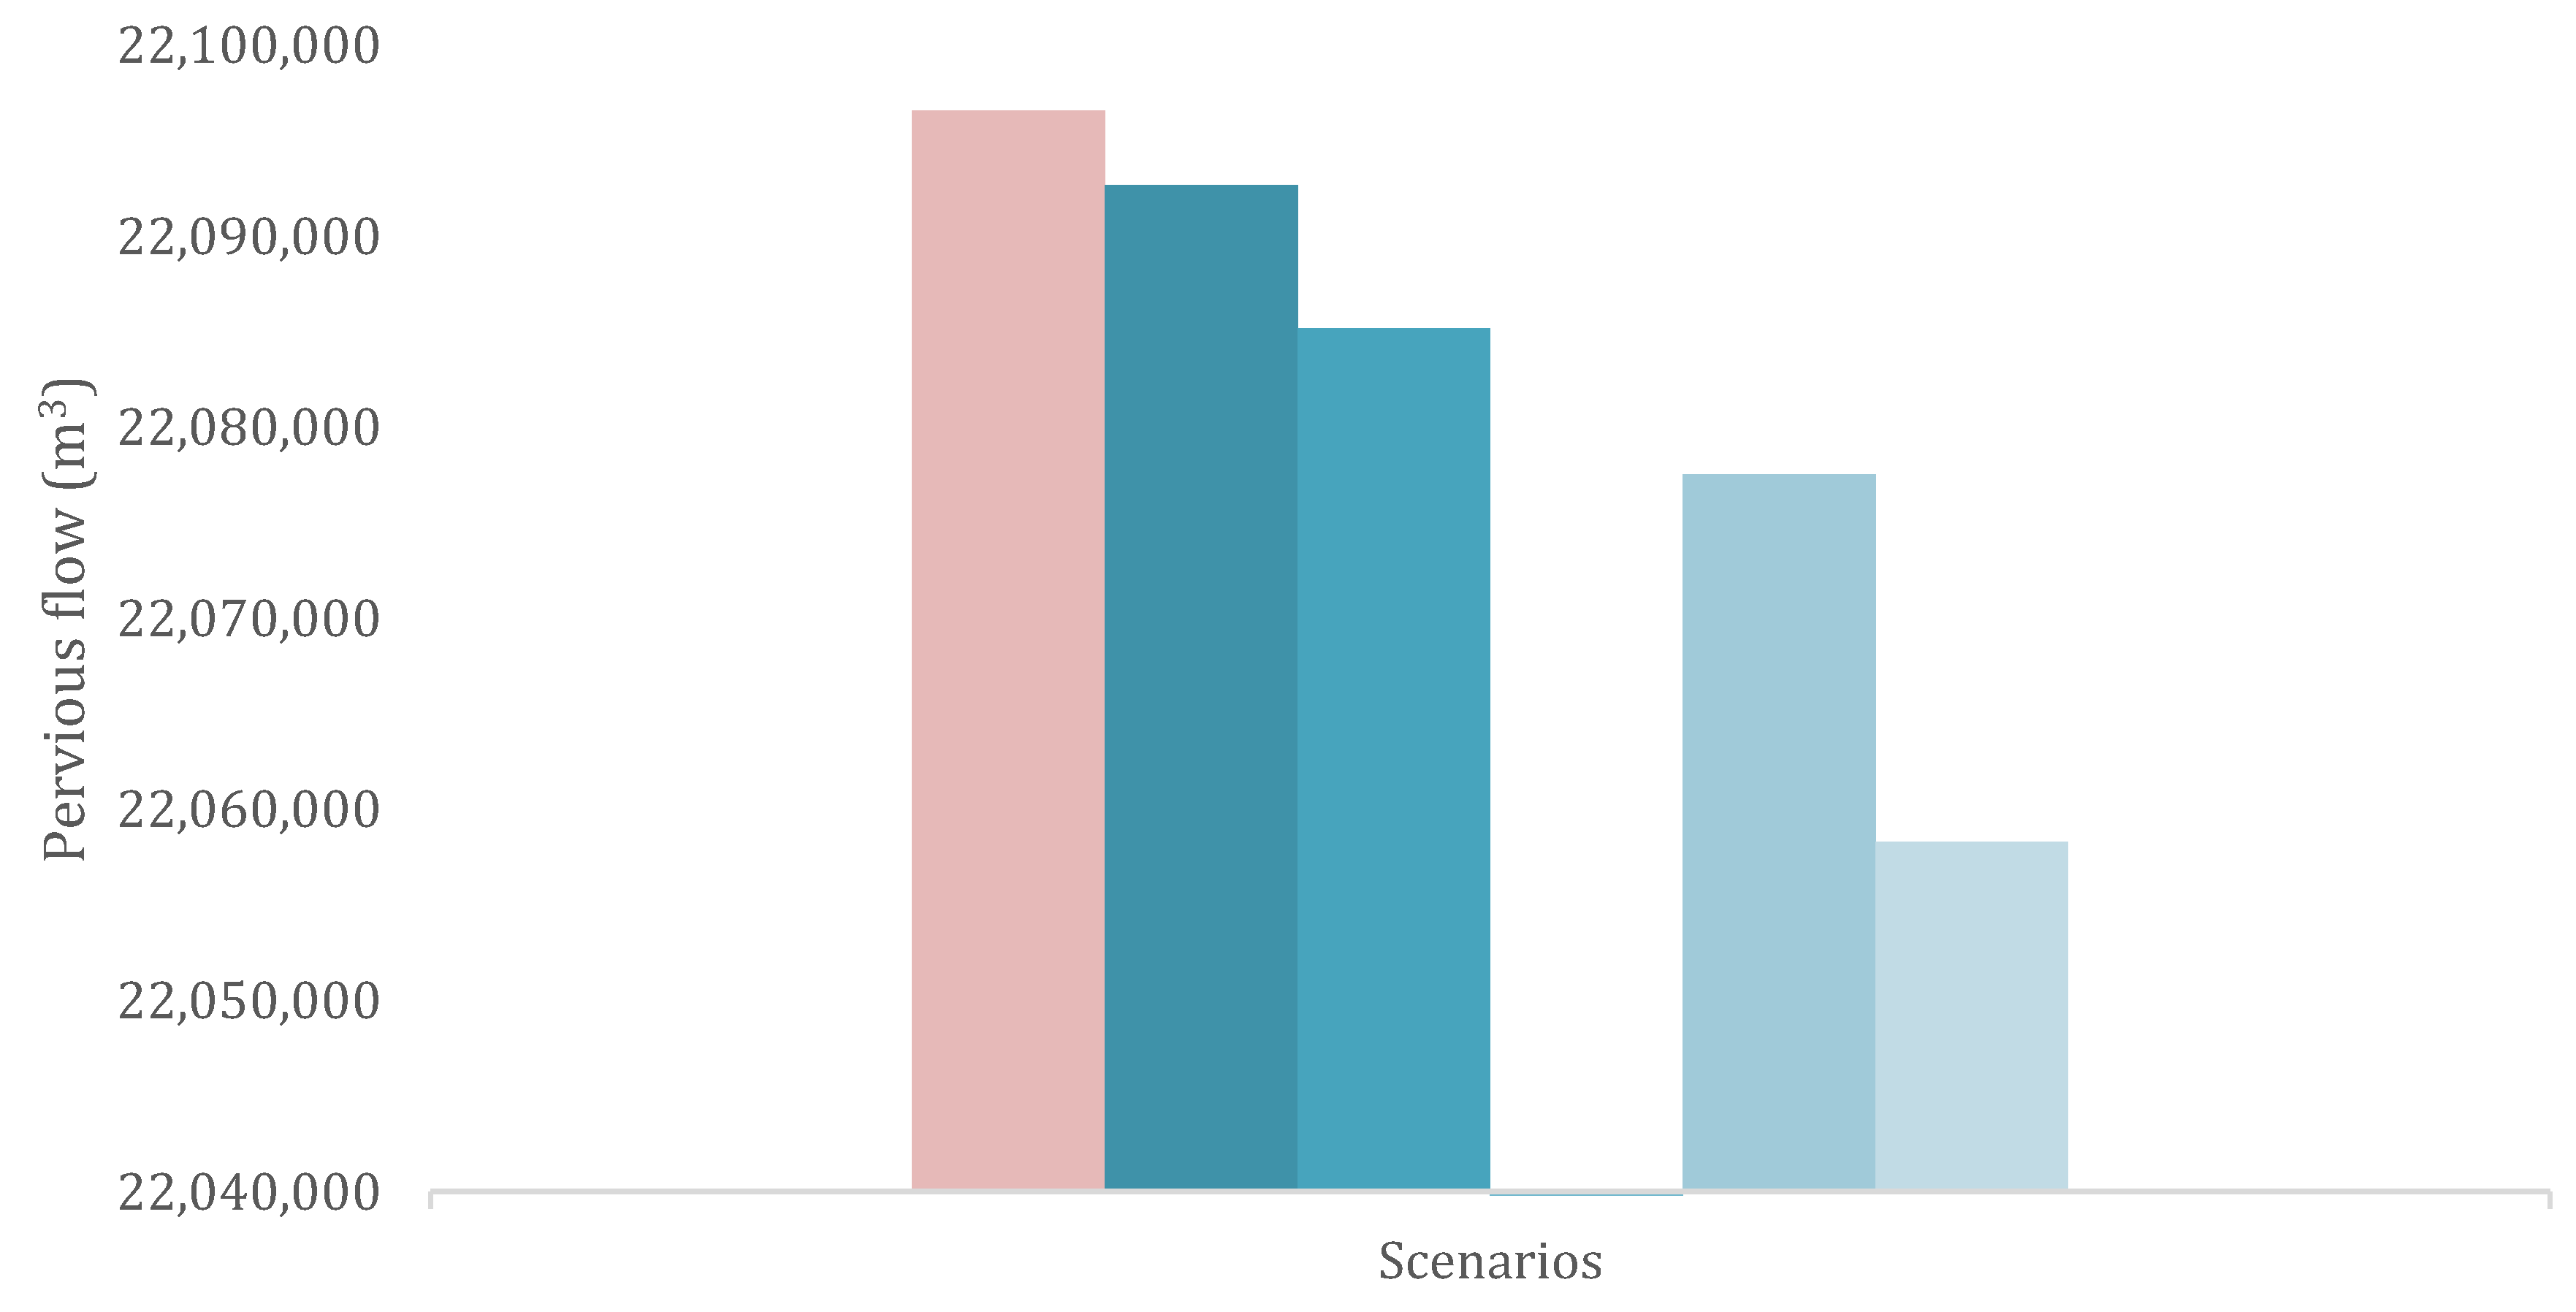
3. Results and Discussion

Figure 3, Figure 4 and Figure 5 show the different flow changes in the two-year period resulting from each of the proposed scenarios.
In Figure 3, it is observed how the baseflow increases in scenarios 1, 2, 4, and 5, which is associated with flows in groundwater, and an inversely proportional relationship with the reduction in significant volumes for runoff flows in permeable and impervious zones is shown in Figure 4 and Figure 5, where the most relevant impact was generated by the increase in permeable coverage under existing trees in the study area for scenario 5.

3.1. Scenario 1

The predicted total flow (baseflow plus pervious flow plus impervious flow) decreased by 0.0192% over seven years with respect to the base-current scenario. With respect to underground flow, an increase of 26,244 m3 was observed, representing a contribution of 0.2%. For the permeable and impermeable flow, the changes observed were not significant.

3.2. Scenario 2

In Scenario 2, the predicted total flow decreased by 30,082 m3, equivalent to 0.057% with respect to the base-current scenario. A 1.24 m3 h−1 decrease was observed in the predicted maximum flow, which would help to alleviate the flow generated by strong precipitation events. In the permeable zones, an 11,391 m3 reduction in the predicted flow and a 78,782 m3 increase in the underground flow were observed. Permeable zones increased, favoring infiltration. However, due to the baseline scarcity of green areas in the town of Fontibón, the 50% increase in plant cover did not result in the best strategy for mitigating urbanization impacts. Finally the two scenarios, 1 and 2, in which the percentage of permeable and impermeable coverage under trees corresponded to 50% for each, were considered.

3.3. Scenario 3

In Scenario 3, total flow increased by more than 53%, representing 28,456,934 m3 and demonstrating the vulnerability of the Fontibón region to loss of green areas. The predicted maximum flow increased by 51% with respect to the base-current scenario.

3.4. Scenario 4

A reduction in the total flow of 3,960 m3 was observed in Scenario 4. This was equivalent to 0.008% of the total flow observed in the base-current scenario. The maximum flow decreased by 2.75 m3 h−1. The impact of Scenario 4 was more sizable for the underground flow, which increased by 310,013 m3 (2.2 % with respect to the base-current scenario) and led to substantial groundwater recharge and infiltration increases within the town. Also of note, the impervious flow declined by 287,002 m3.

3.5. Scenario 5

Finally, in Scenario 5 the total predicted maximum flow was reduced by 5.29 m3 h−1. The underground flow increased by 610,951 m3 with respect to the base-current scenario, and the average and maximum underground flows also increased with respect to the base-current scenario. The most sizeable flow reductions were observed for the impervious flow, which was reduced by 3%, 4%, and 8% for total flow, maximum flow, and median flow, respectively.
The total number of simulated peaks in the impermeable zones was greater in the base-current scenario than in Scenario 5, where a reduction in the amount of flow greater than 1200 m3 h−1 was attributable to the implementation of this strategy. The positive peaks indicate that the flow predictions were greater in Scenario 5 than in the base scenario.
Regarding the difficulties of the research, the absence of hourly hydrological data is highlighted, so it was necessary to use a data record for every 6 hours (the same record every 6 hours for each hour in the input file was used) which reduces the precision of the model. On the other hand, the Leaf area index (LAI) was not measured in-situ, but values described in bibliography related to the topic for urban specimens were used.
The benefits of increasing the green areas in the town of Fontibón are obvious from the hydrological point of view. There was an increase in the permeable zones under existing trees in the scenarios with an improved town. It is very important to encourage the implementation of strategies that increase tree cover so that coverage under trees is always more than 75% permeable. For Scenarios 1 and 2, a much smaller impact than in Scenarios 4 and 5 was observed, due to the fact that currently the zones occupied by trees are much larger than the areas proposed in Scenarios 1 and 2. However, this impact is significant for the reduction in water volumes in impermeable areas, so a combination of these two strategies (implementation of green areas and an increase in the area under the current trees in the locality) would have a significant impact on stress water generated in intense precipitation events.
On the other hand, since the 1960s, the large cities of Latin America have been characterized by a process of industrialization, implemented by companies in the largest cities [61]. This factor has a significant influence on the growth of the urban population [62] as well as planning, and the applicable legislation, has focused on this facet of growth [63]. Fontibón’s susceptibility to green area reductions is evident, as was observed in Scenario 3 (taking into account that it is one of the towns with the lowest green coverage indices in Bogotá [36]) and it is therefore necessary to increase green zones and to potentiate the existing zones as proposed in Scenarios 4 and 5, in order to reduce risks, since flows in urban basins may exceed those in less urbanized or non-urbanized basins by between 30% and 100% [16]. Another important factor to analyze is the transport of urban pollutants, as waterproof surfaces with a material of low roughness and associated with intense rainfall greatly favor the increase in the rate of transport of pollutants [64]. This has a detrimental impact on the quality of runoff water; due to non-point sources, contaminants such as solids, metals and nutrients are washed away [65]. Besides promoting the creation of new green areas through implementing strategies that do not slow the city’s growth, buildings with permeable roofs (green roofs) will also lead to improved hydrological performance. Additionally slowing the loss of existing green areas is necessary. Taking into account the background of emergencies and disasters related to water and poor management of rainwater that have arisen in the city, future enhancement and expansion of green areas is urgently needed, implementing planning and environmental management initiatives at the urban level, which should focus on addressing issues of proper management of the relationship between internal urban systems and the quality of life of their inhabitants [66].

4. Conclusions

The implementation of strategies that reduce the impacts of large-scale urbanization, for example waterproofing of the soil, which considerably affect the natural dynamics of the hydrological cycle, is vitally important for improving residents’ quality of life. Useful strategies will reduce peak flows in terms of both maximum and total flow resulting from intense rainfall, and increase the flow into groundwater resulting from increased infiltration and flow into permeable zones. Scenarios 1 and 2 simulated here produced just these results. According to reports in the literature, the strategies simulated here also improve the air quality, improve the quality of runoff water, and reduce the air temperature.
The vulnerability of Fontibón to green area reduction is highlighted in Scenario 3. With a reduced green area, the total and maximum runoff flows both increased by more than 50%. Despite the fact that the increase in green areas is not significant, a decrease in the number of these has a relatively large impact. The best strategy for mitigating the impact of urbanization was achieved using permeable coverage under trees. This strategy (Scenario 5) substantially increased the flow of groundwater and decreased the flow on impermeable areas. When planning green spaces in an area, the incorporation of these zones, and especially of arboreal zones, should be implemented with 100% permeable coverage underneath them in order to optimize the hydrological benefits.
Finally, no previous studies were found that implemented i-Tree in Latin America, so this is its first application as a tool for administration and urban development in cities in developing Latin American countries. The i-Tree tool is especially useful for quantifying the benefits of trees and permeable zones since it is straightforward to investigate different scenarios, such as the implementation of projects that significantly reduce the percentage of permeable zones in urban environments or the response of a specific area to intense rainfall.

Author Contributions

S.B. and C.P.-G. worked on model construction and the development of scenarios.

Funding

This research received no external funding.

Conflicts of Interest

The authors declare no conflicts of interest.

References

  1. Angel, S.; Sheppard, S.; Civco, D.L.; Buckley, R.; Chabaeva, A.; Gitlin, L.; Kraley, A.; Parent, J.; Perlin, M. The Dynamics of Global Urban Expansion; Transport and Urban Development Department the World Bank: Washington, DC, USA, 2005. [Google Scholar]
  2. Buhaug, H.; Urdal, H. An urbanization bomb? Population growth and social disorder in cities. Glob. Environ. Chang. 2013, 23, 1–10. [Google Scholar] [CrossRef]
  3. Shuster, W.D.; Bonta, J.; Thurston, H.; Warnemuende, E.; Smith, D.R. Impacts of impervious surface on watershed hydrology: A review. Urban Water J. 2005, 2, 263–275. [Google Scholar] [CrossRef]
  4. Jacobson, C.R. Identification and quantification of the hydrological impacts of imperviousness in urban catchments: A review. J. Environ. Manag. 2011, 92, 1438–1448. [Google Scholar] [CrossRef] [PubMed]
  5. Walsh, C.J.; Fletcher, T.D.; Burns, M.J. Urban Stormwater Runoff: A New Class of Environmental Flow Problem. PLoS ONE 2012, 7, e45814. [Google Scholar] [CrossRef] [PubMed]
  6. Walters, D.M.; Roy, A.H.; Leigh, D.S. Environmental indicators of macroinvertebrate and fish assemblage integrity in urbanizing watersheds. Ecol. Indic. 2009, 9, 1222–1233. [Google Scholar] [CrossRef]
  7. Barron, O.V.; Barr, A.D.; Donn, M.J. Effect of urbanisation on the water balance of a catchment with shallow groundwater. J. Hydrol. 2013, 485, 162–176. [Google Scholar] [CrossRef]
  8. Ten Veldhuis, J.A.E.; Clemens, F.H.L.R.; Sterk, G.; Berends, B.R. Microbial risks associated with exposure to pathogens in contaminated urban flood water. Water Res. 2010, 44, 2910–2918. [Google Scholar] [CrossRef] [PubMed]
  9. Yuan, F.; Bauer, M.E. Comparison of impervious surface area and normalized difference vegetation index as indicators of surface urban heat island effects in Landsat imagery. Remote Sens. Environ. 2007, 106, 375–386. [Google Scholar] [CrossRef]
  10. Wouters, H.; Demuzere, M.; Ridder, K.D.; van Lipzig, N.P.M. The impact of impervious water-storage parametrization on urban climate modelling. Urban Clim. 2015, 11, 24–50. [Google Scholar]
  11. Rahardjo, P.; Hartono, D.M.; Suganda, E.; Arifin, H.S. Conservation of Underground Water with the Ecosystem Approach to the Development of the New Towns in Bogor, Tangerang, Bekasi (Botabek) Region. Procedia-Soc. Behav. Sci. 2016, 227, 720–727. [Google Scholar] [CrossRef] [Green Version]
  12. Endreny, T.A. Land Use and Land Cover Effects on Runoff Processes: Urban and Suburban Development. In Encyclopedia of Hydrological Sciences; American Cancer Society: Atlanta, GA, USA, 2006; ISBN 978-0-470-84894-4. [Google Scholar]
  13. Gitau, M.W.; Chen, J.; Ma, Z. Water Quality Indices as Tools for Decision Making and Management. Water Resour Manag. 2016, 30, 2591–2610. [Google Scholar] [CrossRef]
  14. Riley, A.L. Restoring Streams in Cities: A Guide for Planners, Policymakers, and Citizens; Island Press: Washington, DC, USA, 1998; ISBN 978-1-61091-353-9. [Google Scholar]
  15. Burns, M.J.; Fletcher, T.D.; Walsh, C.J.; Ladson, A.R.; Hatt, B.E. Hydrologic shortcomings of conventional urban stormwater management and opportunities for reform. Landsc. Urban Plan. 2012, 105, 230–240. [Google Scholar] [CrossRef]
  16. Rose, S.; Peters, N.E. Effects of urbanization on streamflow in the Atlanta area (Georgia, USA): A comparative hydrological approach. Hydrol. Process. 2001, 15, 1441–1457. [Google Scholar] [CrossRef]
  17. Galarza-Molina, S.; Torres, A.; Rengifo, P.; Puentes, A.; Cárcamo-Hernández, E.; Méndez-Fajardo, S.; Devia, C. The benefits of an eco-productive green roof in Bogota, Colombia, The benefits of an eco-productive green roof in Bogota, Colombia. Indoor Built Environ. 2017, 26, 1135–1143. [Google Scholar] [CrossRef]
  18. Chianucci, F.; Puletti, N.; Giacomello, E.; Cutini, A.; Corona, P. Estimation of leaf area index in isolated trees with digital photography and its application to urban forestry. Urban For. Urban Green. 2015, 14, 377–382. [Google Scholar] [CrossRef] [Green Version]
  19. Sorensen, M.; Barzetti, V.; Keipi, K.; Williams, J. Manejo de las areas verdes urbanas. Banco Interam. Desarro. 1998, 1, 0–81. [Google Scholar]
  20. Zhang, B.; Xie, G.; Li, N.; Wang, S. Effect of urban green space changes on the role of rainwater runoff reduction in Beijing, China. Landsc. Urban Plan. 2015, 140, 8–16. [Google Scholar] [CrossRef] [Green Version]
  21. Rozos, E.; Makropoulos, C.; Maksimović, Č. Rethinking urban areas: An example of an integrated blue-green approach. Water Sci. Technol. Water Supply 2013, 13, 1534–1542. [Google Scholar] [CrossRef]
  22. Gardner, G. Toward a Vision of Sustainable Cities. In State of the World: Can a City Be Sustainable? State of the World; Island Press/Center for Resource Economics: Washington, DC, USA, 2016; pp. 45–64. ISBN 978-1-61091-756-8. [Google Scholar]
  23. Chiesura, A. The role of urban parks for the sustainable city. Landsc. Urban Plan. 2004, 68, 129–138. [Google Scholar] [CrossRef]
  24. Rauch, W.; Urich, C.; Bach, P.M.; Rogers, B.C.; de Haan, F.J.; Brown, R.R.; Mair, M.; McCarthy, D.T.; Kleidorfer, M.; Sitzenfrei, R.; et al. Modelling transitions in urban water systems. Water Res. 2017, 126, 501–514. [Google Scholar] [CrossRef]
  25. Wang, J.; Hassett, J.M.; Endreny, T.A. An object oriented approach to the description and simulation of watershed scale hydrologic processes. Comput. Geosci. 2005, 31, 425–435. [Google Scholar] [CrossRef]
  26. Yang, Y.; Endreny, T.A.; Nowak, D.J. iTree-Hydro: Snow Hydrology Update For the Urban Forest Hydrology Model1: Itree-Hydro: Snow Hydrology Update for the Urban Forest Hydrology Model. JAWRA J. Am. Water Resour. Assoc. 2011, 47, 1211–1218. [Google Scholar] [CrossRef]
  27. Shuttleworth, W.J. Evaporation Models in Hydrology. In Land Surface Evaporation: Measurement and Parameterization; Schmugge, T.J., André, J.-C., Eds.; Springer: New York, NY, USA, 1991; pp. 93–120. ISBN 978-1-4612-3032-8. [Google Scholar]
  28. BEVEN, K.J.; Kirkby, M.J. A physically based, variable contributing area model of basin hydrology/Un modèle à base physique de zone d’appel variable de l’hydrologie du bassin versant. Hydrol. Sci. Bull. 1979, 24, 43–69. [Google Scholar] [CrossRef]
  29. Hirabayashi, S.; Endreny, T.A. Surface and Upper Weather Pre-processor for i-Tree Eco and Hydro. 2014, 1, pp. 0–19. Available online: https://www.itreetools.org/eco/resources/Surface_weather_and_upper_air_preprocessor_description.pdf (accessed on 10 March 2019).
  30. Yee-Batista, C.; Rincón, J.; Browder, G.; Acosta, A.; Catacoli, R. Rio Bogotá Environmental Recuperation and Flood Control Project; The Water Environment Federation: Boston, MA, USA, 2010; Volume 14, pp. 987–1000. [Google Scholar]
  31. Comisión Europea. Building a green infrastructure for Europe; Oficina de Publicaciones de la Unión Europea: Luxembourg, 2013. [Google Scholar]
  32. Fadigas, L. The Green Structure in the Urban Planning Process; Universidad Técnica de Lisboa: Lisboa, Portugal, 2009. [Google Scholar]
  33. Secretaría Distrital de Salud. Localidad de Fontibón. In Diagnostico Local con Participación Social 2009–2010; Secretaría Distrital de Salud: Bogotá, Colombia, 2010. [Google Scholar]
  34. Alcaldía Mayor de Bogotá. Plan Ambiental Local de Fontibon; Alcaldía Mayor de Bogotá: Bogotá, Colombia, 2012.
  35. Camara de Comercio de Bogotá. Perfil económico y empresarial Localidad Fontibón. In Factores Asociados al Entorno Económico; Camara de Comercio de Bogotá: Bogotá, Colombia, 2007; pp. 17–28. [Google Scholar]
  36. Alcaldía Local de Fontibón. Plan Ambiental Local Localidad de Fontibón 2017–2020; Alcaldía Local de Fontibón: Bogotá, Colombia, 2017.
  37. USDA Forest Service. i-Tree Hydro Users Manual; USDA Forest Service: Washington, DC, USA, 2006.
  38. Beven, K.J.; Kirkby, M.J.; Schofield, N.; Tagg, A.F. Testing a physically-based flood forecasting model (TOPMODEL) for three U.K. catchments. J. Hydrol. 1984, 69, 119–143. [Google Scholar] [CrossRef]
  39. Wang, J.; Endreny, T.A.; Hassett, J.M. A flexible modeling package for topographically based watershed hydrology. J. Hydrol. 2005, 314, 78–91. [Google Scholar] [CrossRef]
  40. Wood, E.; Sivapalan, M.; Beven, K. Similarity and Scale in Catchment Storm Response. Rev. Geophys. 1990, 28, 1–18. [Google Scholar] [CrossRef]
  41. Urban Forest Effects Model-UFORE-Online Tools-Tools & Applications-Northern Research Station-USDA Forest Service. Available online: https://www.nrs.fs.fed.us/tools/ufore/ (accessed on 18 February 2019).
  42. Wang, J.; Endreny, T.A.; Nowak, D.J. Mechanistic Simulation of Tree Effects in an Urban Water Balance Model. JAWRA J. Am. Water Resour. Assoc. 2008, 44, 75–85. [Google Scholar] [CrossRef]
  43. Arnold, J.G.; Srinivasan, R.; Muttiah, R.S.; Allen, P.M. Continental Scale Simulation of the Hydrologic Balance1. JAWRA J. Am. Water Resour. Assoc. 1999, 35, 1037–1051. [Google Scholar] [CrossRef]
  44. Arnold, J.; Srinivasan, R.; Muttiah, R.; Williams, J.R. Large Area Hydrologic Modeling and Assessment Part I: Model Development. JAWRA J. Am. Water Resour. Assoc. 1998, 34, 73–89. [Google Scholar] [CrossRef]
  45. USDA. Urban Hydrology for Small Watersheds. Tech. Release 1986, 55, 2–6. [Google Scholar]
  46. Schneider, K. An Introduction to TR-55; University of Texas at Austin: Austin, TX, USA, 2001; p. 22. [Google Scholar]
  47. Singh, V.P.; Frevert, D.K. Watershed Models; CRC Press: Boca Raton, FL, USA, 2005; ISBN 978-1-4200-3743-2. [Google Scholar]
  48. Rossman, L. Storm Water Management Model User’s Manual Version 5.1—Manual; US EPA Office of Research and Development, EPA: Washington, DC, USA, 2015.
  49. Elliott, A.H.; Trowsdale, S.A. A review of models for low impact urban stormwater drainage. Environ. Model. Softw. 2007, 22, 394–405. [Google Scholar] [CrossRef]
  50. i-Tree Hydro. Available online: http://www.itreetools.org/hydro/ (accessed on 23 February 2019).
  51. Hirabayashi, S. i-Tree Eco Precipitation Interception Model Descriptions; US Department of Agriculture Forest Service: Washington, DC, USA, 2013; 1, pp. 0–21.
  52. Lega, M.; Endreny, T. Quantifying the environmental impact of pollutant plumes from coastal rivers with remote sensing and river basin modelling. Int. J. Sustain. Dev. Plan. 2016, 11, 651–662. [Google Scholar] [CrossRef] [Green Version]
  53. Stephan, E.A.; Endreny, T.A.; Nowak, D.J. Development of Nutrient Model for i-Tree Hydro using Sampling Results from the Mianus River Watershed; American Geophysical Union: Washington, DC, USA, 2013. [Google Scholar]
  54. Dooley, K.; Kpachavi, A.; Skinner, E. The Impact of Land Use Change on Lake Phosphorus Concentrations in Dakota USA, MN. In Educational work paper; Carleton Collage: Northfield, MN, USA, 2015. [Google Scholar]
  55. Kirnbauer, M.C.; Baetz, B.W.; Kenney, W.A. Estimating the stormwater attenuation benefits derived from planting four monoculture species of deciduous trees on vacant and underutilized urban land parcels. Urban For. Urban Green. 2013, 12, 401–407. [Google Scholar] [CrossRef]
  56. Nowak, D.J.; Bodine, A.R.; Robert, E., III; Crane, D.E.; Ellis, A.; Endreny, T.A.; Yang, Y.; Jacobs, T.; Shelton, K. Assessing Urban Forest Effects and Values: The Greater Kansas City Region; US Department of Agriculture, Forest Service, Northern Research Station: Newtown Square, PA, USA, 2013; Volume 75, pp. 1–72.
  57. Bodnaruk, E.W.; Kroll, C.N.; Yang, Y.; Hirabayashi, S.; Nowak, D.J.; Endreny, T.A. Where to plant urban trees? A spatially explicit methodology to explore ecosystem service tradeoffs. Landsc. Urban Plan. 2017, 157, 457–467. [Google Scholar] [CrossRef]
  58. Taggart, T.P.; Endreny, T.A.; Nowak, D. Modeling the effect of urban infrastructure on hydrologic processes within i-Tree Hydro, a statistically and spatially distributed model; American Geophysical Union: Washington, DC, USA, 2014. [Google Scholar]
  59. IDEAM FOPAE. Estudio de la Caracterización Climática de Bogotá y Cuenca Alta del Río Tunjuelo; Alcaldía Mayor de Bogotá: Bogotá, Colombia, 2005.
  60. Susan, F.; Appleton, B.L. A Guide to Successful Pruning, Pruning Evergreen Trees; Virginia Polytechnic Institute and State University: Blacksburg, VA, USA, 2009. [Google Scholar]
  61. Herrera, L.; Pecht, W.; Olivares, F. Crecimiento Urbano de America Latina; Centro latinoamericano de demografia; Comisión Económica para América Latina y el Caribe CEPAL: Santiago, Chile, 1976. [Google Scholar]
  62. Ruiz, P.A.C.; Linar, J.P.L. Análisis del crecimiento urbano: Una aproximación al estudio de los factores de crecimiento de la ciudad de Manizales como aporte a la planificación. Gestión Y Ambiente 2010, 13, 53–66. [Google Scholar]
  63. García Catalá, R. Crecimiento Urbano y el Modelo de Ciudad; Centre de Política de Sòl i Valoracions: Lérida, España, 2009; pp. 51–58. [Google Scholar]
  64. Xiao, Y.; Zhang, T.; Liang, D.; Chen, J.M. Experimental study of water and dissolved pollutant runoffs on impervious surfaces. J. Hydrodyn. Ser. B 2016, 28, 162–165. [Google Scholar] [CrossRef]
  65. Butler, D.; Davies, J.W. Urban Drainage, 3rd ed.; Spon Press: London, UK; New York, NY, USA, 2011; ISBN 978-0-415-45525-1. [Google Scholar]
  66. Allen, A. Environmental planning and management of the peri-urban interface: Perspectives on an emerging field. Environ. Urban. 2003, 15, 135–148. [Google Scholar] [CrossRef]
Figure 1. Zonal planning units (ZPU) used in this work.
Resources 08 00068 g001aResources 08 00068 g001b
Figure 2. Development of i-Tree Hydro. TOPMODEL: TOPography based hydrological MODEL; OBJTOP: OBJect-oriented programming TOPMODEL; UFORE; Urban Forest Effects Model.
Resources 08 00068 g002
Figure 3. Change in the baseflow in each of the proposed scenarios.
Resources 08 00068 g003
Figure 4. Change in the pervious flow in each of the proposed scenarios.
Resources 08 00068 g004
Figure 5. Change in the impervious flow in each of the proposed scenarios.
Resources 08 00068 g005
Table 1. Case studies using the i-Tree Hydro software.
AuthorCountryType of Application
QRIBUHMPGACQRPUHEISRCBMPCWSEEUAEGEQWTISPDFS
[51]USAX
[52]ItalyXX X
[53]USA XXX X
[26]USA X X
[42]USAX X X
[54]USAX X XX
[55]NetherlandsXXX X
[56]USAX X X X
[57]USAXXX X X
[58]USAX X X X
QRI: quantification of rainfall intercepted, BUH: balance of the urban hydrological cycle, MPGA: model for the planning of green areas, CQR: change in the quality of rainwater in urban environments, PUH: pollutants in urban hydrological cycle, EIS: environmental impacts on surface water, RC: rainwater contamination, BMP: best management practices, CWS: chemical water simulation, EEUA: evaluation of the effects of urban areas, EGE: evaluation of green structures, QWTI: quantification of water–tree interaction, SPD: simulation of peaks in the storm discharge rate, FS: flow simulation.
Table 2. Model input data.
VariableUnitSourceObservation
Digital elevation model (DEM)-NASA websiteA resolution of 30 m in a study area delimited using ArcGis
Areakm2MeasuredMeasured using ArcGis
Percentage coverage of trees, shrubs, grass, bodies of water, soil, and impervious areas#MeasuredMeasured using ArcGis
Leaf area index (LAI)m2 m−2Literature3.8 for trees, 2 for shrubs and 1.2 for pastures [31,32].
Daily flow (m3 s−1) in the Fucha Riverft3 s−1MeasuredHydrological station
Percent coverage of shrubs and evergreens%Literature[59,60]
Wind speedMiles h−1MeasuredWeather station
CloudinessOctasMeasuredWeather station
Air temperatureDegrees Fahrenheit MeasuredWeather station
Dew point temperatureDegrees FahrenheitMeasuredWeather station
Atmospheric pressure at the study locationMillibarMeasuredWeather station
Adjustment of altimetry by pressure and altitudeInchesMeasuredWeather station
Atmospheric pressure at sea levelMillibarMeasuredWeather station
Maximum temperatureDegrees FahrenheitMeasuredWeather station
PrecipitationInchesMeasuredWeather station
Table 3. Description of scenarios.
Scenario StrategyDescription
1Increase green space 20% Increase plant coverage by 20% as a strategy promoting green roofs, resulting in codification of ground cover from an area of 0.22 km2 to 0.26 km2 plant coverage, and from 15.72 km2 to 15.68 km2 of impermeable coverage.
2Increase green space 50%Following the analysis of incorporating green roofs as a measure to reduce the number of impermeable areas in the town of Fontibón, a proposal was made to increase shrub cover by 50%, from 0.22 km2 to 0.33 km2, and from 15.72 km2 to 15.61 km2 of impermeable areas.
3Fontibón area without green zonesA proposal was made to analyze the dynamics of the water resources in the Fontibón area for a total loss of green zones, assuming a hypothetical case in which urbanization increases in an uncontrolled way, completely covering pocket parks, small gardens, vacant land, and any other permeable zone.
4Increase tree cover 50%The coding was performed with 75% permeable area under trees and 25% impervious area. The current codification of the existing green areas in the Fontibón locality was not altered, only the area under the trees.
5Increase tree cover 100%The permeable coverage under trees was increased by 100% without changing the conditions of land use in the area.
Table 4. Description of land cover in the five scenarios.
Land Cover in FontibónBase ScenarioScenario 1Scenario 2Scenario 3Scenario 4Scenario 5
Area (km2)%Area (km2)%Area (km2)%Area (km2)%Area (km2)%Area (km2)%
Tree cover1.574.71.574.71.574.7001.574.71.574.7
Shrub cover0.220.70.260.80.331.0000.220.70.220.7
Herbaceous cover0.240.70.240.70.240.7000.240.70.240.7
Water cover0.692.10.692.10.692.10.692.10.692.10.692.1
Soil cover14.8444.614.8444.614.8444.60014.8444.614.8444.6
Impervious over15.7247.215.6847.115.6146.932.5997.915.7247.215.7247.2

