Article

A Systems-Based Approach to Ecosystem Services Valuation of Various Atmospheric Calcium Deposition Flows

1
Department of Forestry and Environmental Conservation, Clemson University, Clemson, SC 29634, USA
2
Department of Environmental Engineering and Earth Sciences, Clemson University, Anderson, SC 29625, USA
3
Agricultural Sciences Department, Clemson University, Clemson, SC 29634, USA
*
Author to whom correspondence should be addressed.
Resources 2019, 8(2), 66; https://doi.org/10.3390/resources8020066
Submission received: 14 March 2019 / Revised: 1 April 2019 / Accepted: 6 April 2019 / Published: 8 April 2019

Abstract

:
Atmospheric resources are very important for assessing ecosystem services at different administrative levels (e.g., state, region, etc.). Quantification of atmospheric calcium (Ca2+) deposition on the total basis provides incomplete information about the ecosystem services flows (both “natural” and “human-derived”), therefore lacking a systems approach to guide sustainable management of the flows which support many ecosystem services. This study assessed the value of wet, dry, and total atmospheric calcium deposition flows in the contiguous United States (U.S.) by different spatial aggregation levels (e.g., state, region) using information from the National Atmospheric Deposition Program (NRSP-3) and commodity prices of human-derived materials: agricultural limestone (CaCO3) and uncalcined gypsum (CaSO4•2H2O). The total provisioning ecosystem value of atmospheric calcium deposition flows was $66.7M (i.e., 66.7 million U.S. dollars) ($30M wet + $36.7M dry) based on an average 2014 price of $10.42 per U.S. ton of agricultural limestone (CaCO3) or nearly $364M ($164M wet + $200M dry) based on an average 2014 price of $33.00 per U.S. ton gypsum (CaSO4•2H2O). The quantified spatial distribution of wet, dry, and total atmospheric calcium deposition could be used to identify areas with opportunities for more efficient use of “human-derived” materials since they are already being supplied by atmospheric deposition.

1. Introduction

Atmospheric-derived ecosystem services are important for achieving some of the United Nations (UN) 17 Sustainable Development Goals (SDGs) to sustain global human societies [1], for example: “2. End hunger, achieve food security and improve nutrition and promote sustainable agriculture; 3. Ensure healthy lives and promote well-being for people at all ages; 6. Ensure availability and sustainable management of water and sanitation for all, and 15. Protect, restore and promote sustainable use of terrestrial ecosystems, sustainably manage forests, combat desertification and halt and reverse land degradation and biodiversity loss”. Atmospheric-derived ecosystem services fall in all four types of ecosystem services: (1) provisioning; (2) regulating; (3) cultural, and (4) supporting [2]. Because the atmosphere is often considered to be a “public good”, the value of its services has rarely been considered [2]. Thornes et al. (2016) [2] reports that “the total economic value of the atmosphere is estimated to be at least between 100 and 1000 times the Gross World Product (GWP), which was approximately £43 Trillion in 2008.”
Mikhailova et al. (2018) [3] examined the role of markets in transforming atmospheric resources into goods and services by quantifying the contribution of average annual atmospheric total calcium deposition to soil provisioning services (e.g., food production; liming and fertilizer equivalent) in the contiguous United States. Quantification of atmospheric deposition on the total basis provides incomplete information about ecosystem services flows, however, thereby lacking a systems approach to guide sustainable management of the flows which support many ecosystem services [2,4,5].
Jones et al. (2016) [4] proposed a combined social-ecological system where ecosystem services (provisioning, regulating, cultural, and supporting) are dependent on “natural” capital and “human-derived” capital, stocks, and their flows. Because the atmosphere is an open system it can be better characterized as “natural”, “natural + human derived”, or “human-derived” types of capital (Table 1). Atmospheric “natural” capital would be typical for areas with minimum human impact and can be defined as the “natural” stock of physical assets in the atmosphere and “natural” processes from which humans obtain benefits [4] (Table 1). Atmospheric “human-derived” capital would be typical of urban environments and can be defined as the “human-derived” stock of physical assets in the atmosphere (e.g., fertilizer-enriched dust, etc.), and “human-derived” processes (e.g., climate regulation: urban heat island, etc.) from which humans obtain benefits [4] (Table 1). “Natural + human-derived” capital, stock, and processes are the mixture of “natural” and “human-derived” and can be found, for example, in peri-urban areas.
Atmospheric stocks are quantifiable amounts of material with units defined in a spatial context (e.g., volume of CO2 in parts per million) [4]. According to Jones et al. (2016) [4], stocks can be measured as separate constituent stocks (e.g., volume of CO2 in parts per million) or as composite stocks (e.g., air). Flows into or from stocks represent fluxes, that is, quantities per unit area per unit of time (e.g., mean Ca2+ deposition (kg ha−1) on a per year basis in Figure 1).
These flows/fluxes also can be determined as separate constituent stocks (e.g., annual mean wet Ca2+ deposition or annual mean dry Ca2+ deposition in kg·ha−1) or a composite stock (e.g., annual mean total Ca2+ deposition in kg ha−1) (Figure 2). In addition, these flows can be determined within science-based boundaries (e.g., soil order, etc.; Table 2) and/or administrative boundaries (e.g., country, state, region, etc.), and evaluated based on different substitutes. In the example provided in Table 2, mean atmospheric wet calcium deposition is evaluated as a separate constituent flow on the basis of two different substitutes: agricultural limestone (raises soil pH), and uncalcined gypsum (does not raise soil pH) based on data from Goddard et al. (2009) [6]. The top three soil orders with the highest total mean value of wet Ca2+ deposition based on a $10.42 price per U.S. ton of CaCO3 in U.S. (2014) were: (1) Mollisols ($8.76M), (2) Alfisols ($6.40M), and (3) Entisols ($2.93M). The top three soil orders with the highest area-normalized total mean annual value were: (1) Alfisols ($0.05 ha−1), (2) Mollisols ($0.05 ha−1), and (3) Histosols ($0.05 ha−1).
Top three soil orders with the highest total mean value of wet Ca2+ deposition based on a 2014 U.S. average price of $33.00 per U.S. ton of uncalcined gypsum were: (1) Mollisols ($47.8M), (2) Alfisols ($34.9M), and (3) Entisols ($15.9M). Top three soil orders with the highest area-normalized total mean annual value were: (1) Alfisols ($0.27 ha−1), (2) Mollisols ($0.27 ha−1), and (3) Histosols ($0.26 ha−1) (Table 2). The impact of wet Ca2+ likely varies by soil order, where highly weathered soil orders often contain little Ca2+. Carrillo et al. (2002) [7] found that for a site in Hawaii, Ca2+ deposition (wet, fog, and dry) can be a significant source, particularly in highly weathered soils where smaller quantities of Ca2+ are supplied from the weathering of rock substrate [7].
Although the atmospheric calcium deposition can be valued by soil order within the contiguous U.S., this type of analysis has limited application to decision making because decisions are made using administrative levels. Very often the atmosphere is considered a “public good” and many of its services do not always go through the market therefore creating negative externalities [10]. Mikhailova et al. (2018) [3] argued that it is not always a “public good” since atmospheric deposition (flow) can be deposited in the soils (pedosphere) within “private boundaries” in which case it becomes a “private good” (Table 1). The objective of this study is to conduct ecosystem services valuation of various (wet, dry, and total) atmospheric calcium deposition flows within the contiguous United States (U.S.) by different spatial aggregation levels (e.g., country, state, and region) using the State Soil Geographic (STATSGO) soil database.

2. Materials and Methods

2.1. The Accounting Framework

Atmospheric calcium deposition (flow) from atmospheric capital into soil capital represents the amount of calcium defined in a spatial and temporal context, which in this study is the quantity of calcium deposition (kg) per area (ha) per unit time (year) (Figure 1). Table 3 provides a conceptual overview of the accounting framework for valuation of various atmospheric calcium deposition flows: wet, dry, and total.

2.2. The Monetary Valuation

A monetary valuation of the mean (wet, dry, and total) atmospheric deposition of Ca2+ was calculated based on an average U.S. price of $10.42 in the year 2014 per U.S. ton of limestone (CaCO3) [8], and on an average U.S. price of $33.00 in the year 2014 per U.S. ton of uncalcined gypsum (CaSO4•2H2O) [9] at the country scale by state, and region. The annual mean atmospheric Ca2+ deposition (kg ha−1) over the study period was obtained from the National Atmospheric Deposition Program (NRSP-3) [12] and then the values were computed for each map cell using the Cell Statistics function in ArcGIS® 10.4 (ESRI, 2016) [13] and then converted to U.S. dollars per area (e.g., hectare) and U.S. dollars in Microsoft Excel using the following equations [3]:
$ / h a =   ( C a 2 + d e p o s i t i o n ,   k g / h a ) × 100.09 g   C a C O 3 40.08   g   C a 2 + × 2.205   l b m 1   k g × 1   U . S .   t o n 2000   l b m × $   p r i c e U . S .   t o n   C a C O 3
$ / h a =   ( C a 2 + d e p o s i t i o n ,   k g / h a ) × 172.17 g   C a S O 4 · 2 H 2 O 40.08   g   C a 2 + × 2.205   l b m 1   k g × 1   U . S .   t o n 2000   l b m × $   p r i c e U . S . t o n   C a S O 4 · 2 H 2 O
$ =   ( p r i c e   p e r   a r e a   f r o m   e q n .   1   o r   2 ) × ( a r e a   i n   h a )
For example, the State of Iowa has an area of 1.46 × 10⁷ ha and a state-wide annual mean wet Ca2+ deposition of 3.13 kg ha−1 (Table 4). Using these values in Equations (1) and (3), together with the average 2014 price of agricultural limestone of $10.42 per U.S. ton [8], results in an area-normalized value of $0.09 per hectare for Iowa or $1.31 million ($1.31M) for the entire state. In contrast, if the price of gypsum is used instead of agricultural limestone, then Equations (2) and (3) reveal that the annual wet deposition of Ca2+ would be valued at $0.49 per hectare and $7.12M total for Iowa. These values do not include other costs such as the as the equipment, fuel, and labor that would be necessary to incorporate the calcium amendments into the soil, nor any external costs associated with mining the limestone, gypsum, etc. [11]. It is assumed that all calcium being deposited onto the soils by deposition remains in the soil and is not subject to losses due to runoff, erosion, groundwater recharge, etc. The original sources of calcium in the atmosphere that make it available for deposition are not accounted for with these analyses, because calcium in rainfall and dust is thought to originate primarily from terrestrial sources (e.g., wind erosion of soils), there is likely calcium recycling and redistribution that occurs both spatially and temporally across the U.S.) [14].

3. Results

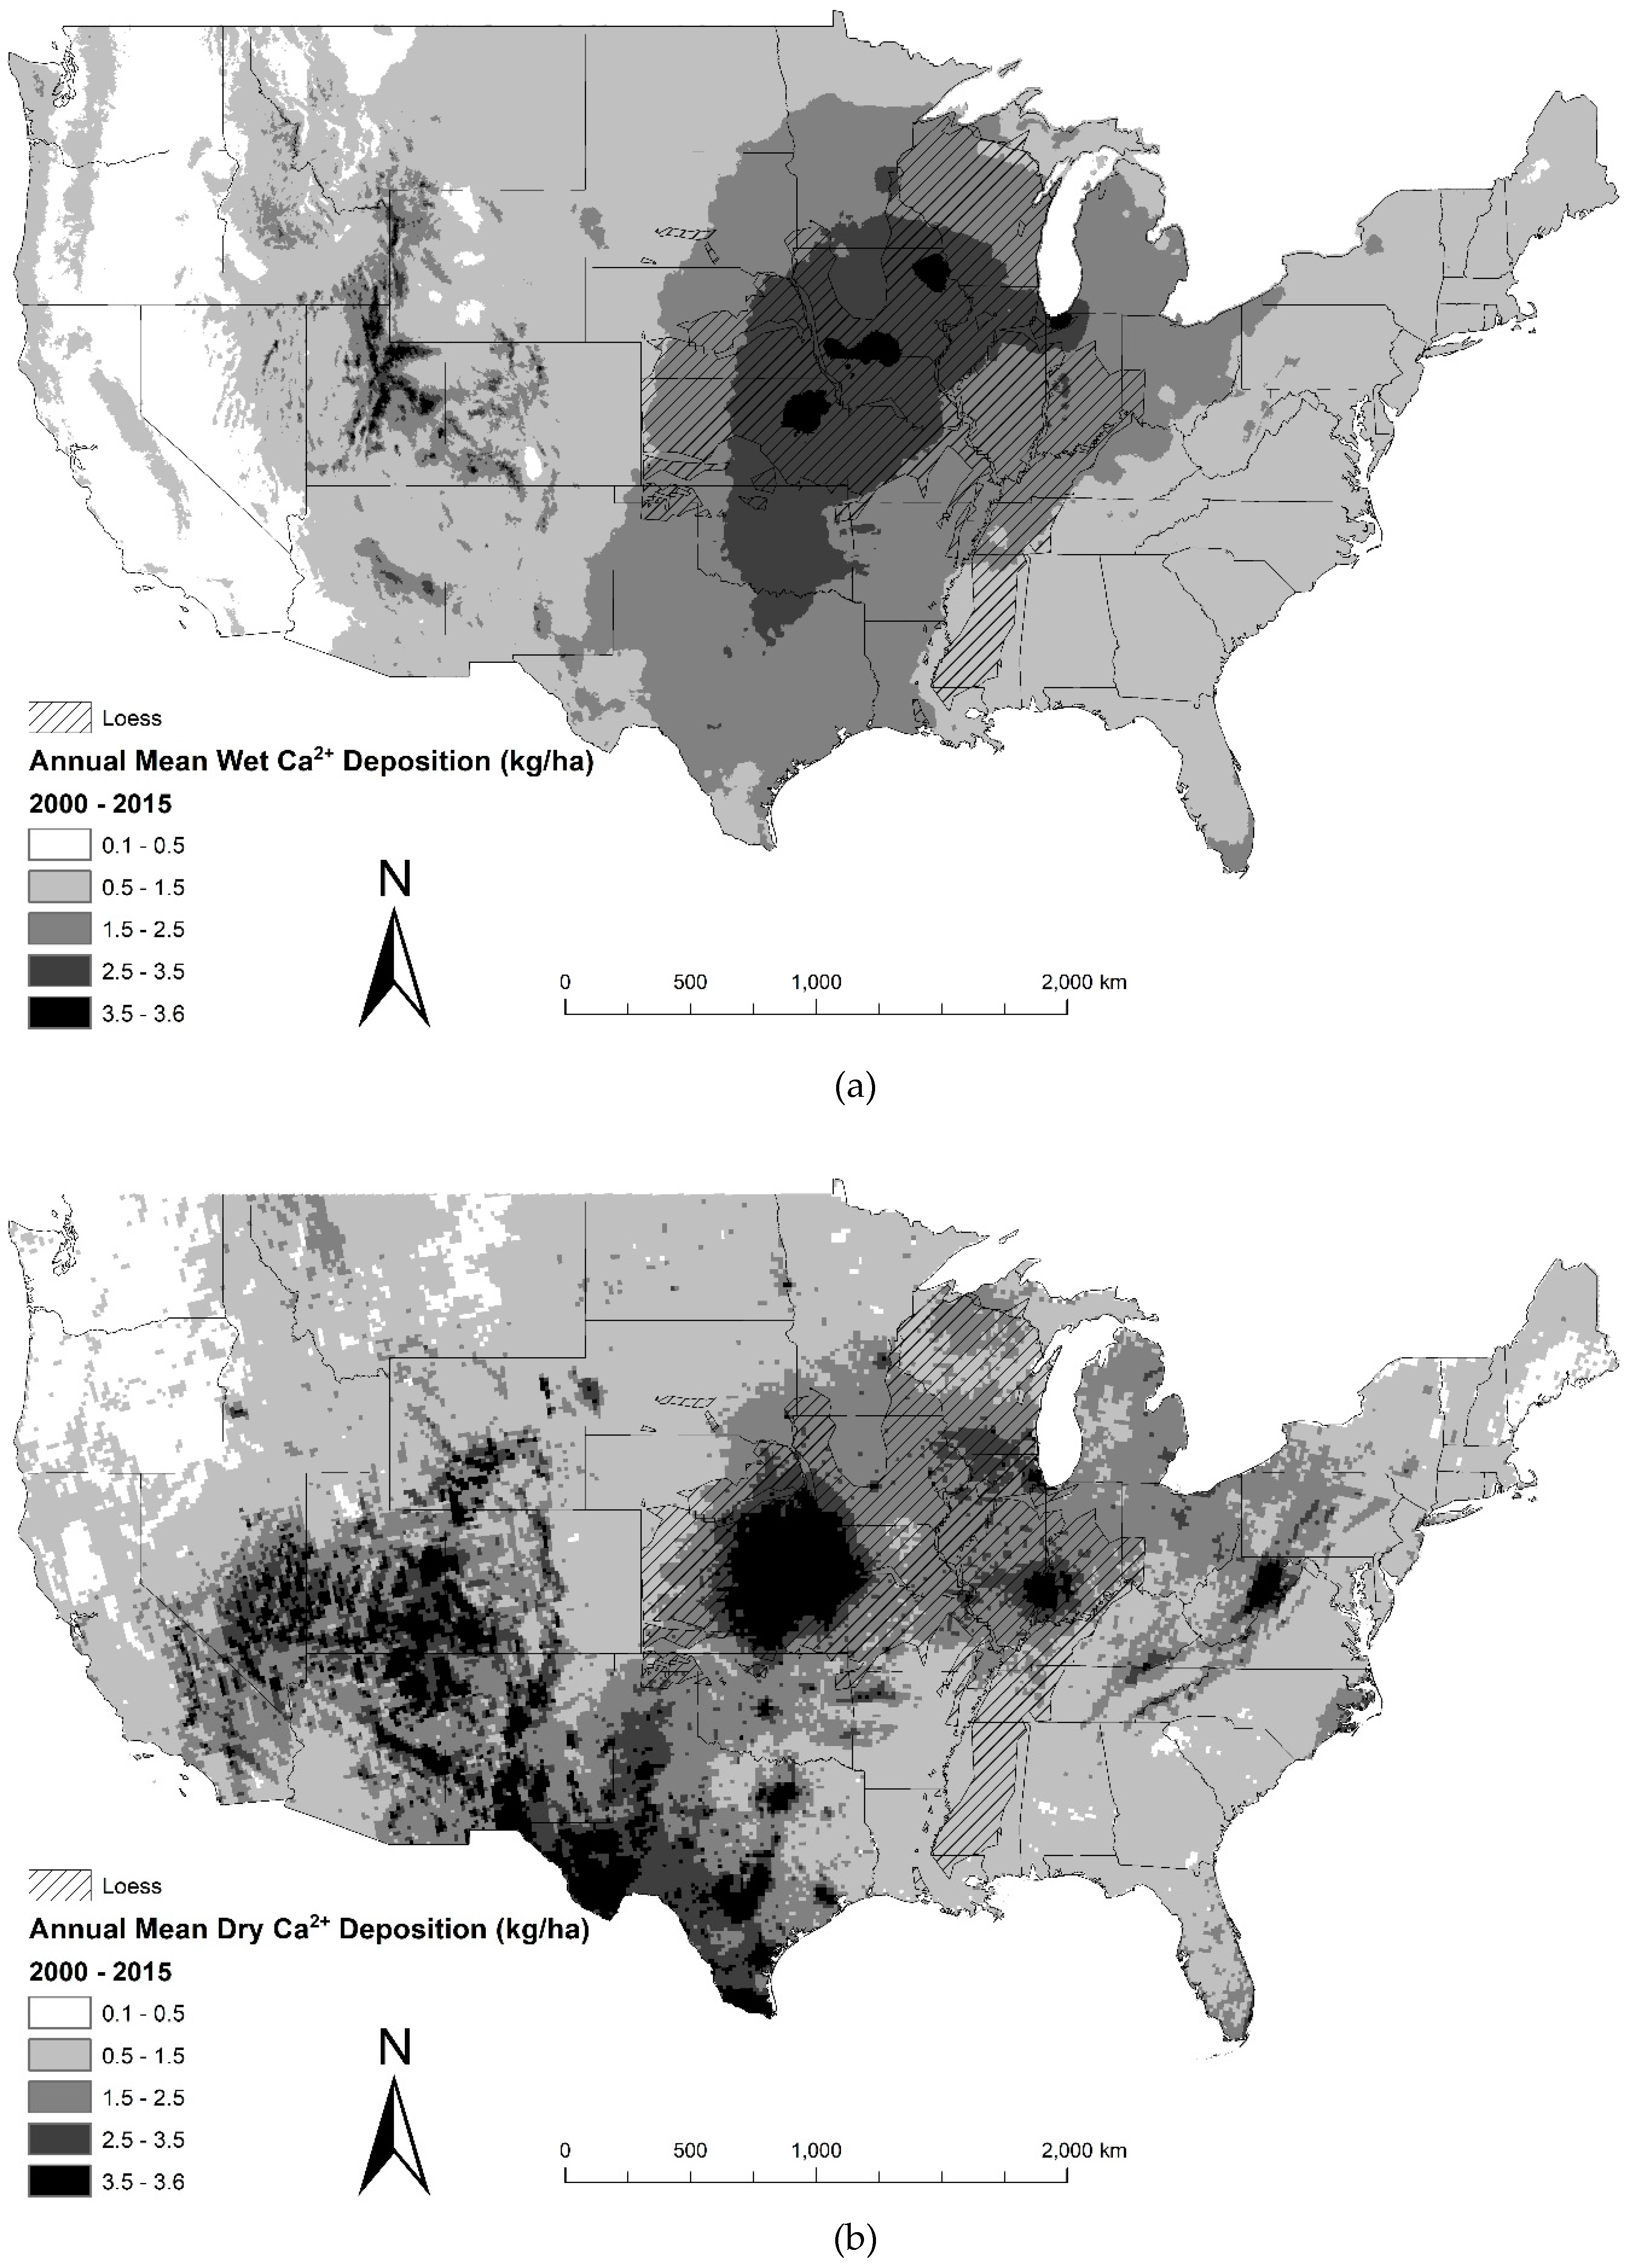
3.1. The Value of Annual Mean Wet Ca2+ Deposition at the Country Scale by State, Region (2000–2015)

The highest ranked states for total value of wet Ca2+ deposition based on a $10.42 price per U.S. ton of CaCO3 in the U.S. (2014) were: (1) Texas ($3.74M), (2) Kansas ($1.60M), and (3) Missouri ($1.38M). Top three states with the highest area-normalized total mean annual value were: (1) Iowa ($0.09 ha−1), (2) Missouri ($0.08 ha−1), and (3) Kansas ($0.08 ha−1) (Table 4).
The highest ranked states for total value of wet Ca2+ deposition based on a 2014 U.S. average price of $33.00 per U.S. ton of uncalcined gypsum were: (1) Texas ($20.04M), (2) Kansas ($8.75M), and (3) Missouri ($7.54M). Top three states with the highest area-normalized total mean annual value were: (1) Iowa ($0.49 ha−1), (2) Missouri ($0.42 ha−1), and (3) Kansas ($0.41 ha−1) (Table 4).
The highest ranked regions for total value of wet Ca2+ deposition based on a $10.42 price per U.S. ton of CaCO3 in U.S. (2014) were: (1) Midwest ($7.58M), (2) Northern Plains ($6.90M), and (3) South Central ($6.38M), while the highest ranked regions based on area-normalized wet Ca2+ deposition value were: (1) Midwest ($0.06 ha−1), (2) South Central ($0.06 ha−1), and (3) Northern Plains ($0.04 ha−1) (Table 4).
The highest ranked regions for total value of wet Ca2+ deposition based on a 2014 U.S. average price of $33.00 per U.S. ton of uncalcined gypsum were: (1) Midwest ($41.3M), (2) Northern Plains ($37.6M), and (3) South Central ($34.8M), while the highest ranked regions based on area-normalized wet Ca2+ deposition value were: (1) Midwest ($0.35 ha−1), (2) South Central ($0.31 ha−1), and (3) Northern Plains ($0.22 ha−1) (Table 4).

3.2. The Value of Annual Mean Dry Ca2+ Deposition at the Country Scale by State, Region (2000–2015)

The highest ranked states for total value of dry Ca2+ deposition based on a $10.42 price per U.S. ton of CaCO3 in the U.S. (2014) were: (1) Texas ($5.54M), (2) New Mexico ($2.44M), and (3) Kansas ($2.04M). Top three states with the highest area-normalized total mean annual value were: (1) Kansas ($0.10 ha−1), (2) Texas ($0.08 ha−1), and (3) Utah ($0.08 ha−1) (Table 5).
The highest ranked states for total value of dry Ca2+ deposition based on a 2014 U.S. average price of $33.00 per U.S. ton of uncalcined gypsum were: (1) Texas ($30.2M), (2) New Mexico ($13.3M), and (3) Kansas ($11.1M). Top three states with the highest area-normalized total mean annual value were: (1) Kansas ($0.52 ha−1), (2) Texas ($0.44 ha−1), and (3) Utah ($0.42 ha−1) (Table 5).
The highest ranked regions for total value of dry Ca2+ deposition based on a $10.42 price per U.S. ton of CaCO3 in U.S. (2014) were: (1) West ($9.97M), (2) Northern Plains ($7.85M), and (3) South Central ($7.28M), while the highest ranked regions based on area-normalized dry Ca2+ deposition value were: (1) South Central ($0.06 ha−1), (2) Midwest ($0.05 ha−1), and (3) Northern Plains ($0.05 ha−1) (Table 5).
The highest ranked regions for total value of dry Ca2+ deposition based on a 2014 U.S. average price of $33.00 per U.S. ton of uncalcined gypsum were: (1) West ($54.3M), (2) Northern Plains ($42.8M), and (3) South Central ($39.7M), while the highest ranked regions based on area-normalized dry Ca2+ deposition value were: (1) South Central ($0.35 ha−1), (2) Midwest ($0.29 ha−1), and (3) Northern Plains ($0.25 ha−1) (Table 5).

3.3. The Value of Average Annual Total Ca2+ Deposition at the Country Scale by State, Region (2000–2015)

The highest ranked states for total value of total Ca2+ deposition based on a $10.42 price per U.S. ton of CaCO3 in the U.S. (2014) were: (1) Texas ($9.28M), (2) Kansas ($3.65M), and (3) New Mexico ($3.51M). The top three states with the highest area-normalized total mean annual value were: (1) Kansas ($0.17 ha−1), (2) Iowa ($0.15 ha−1), and (3) Illinois ($0.14 ha−1) (Table 6).
The highest ranked states for total value of total Ca2+ deposition based on a 2014 U.S. average price of $33.00 per U.S. ton of uncalcined gypsum were: (1) Texas ($50.6M), (2) Kansas ($19.9M), and (3) New Mexico ($19.2M). The top three states with the highest area-normalized total mean annual value were: (1) Kansas ($0.93 ha−1), (2) Iowa ($0.84 ha−1), and (3) Illinois ($0.76 ha−1) (Table 6).
The highest ranked regions for total value of total Ca2+ deposition based on a $10.42 price per U.S. ton of CaCO3 in U.S. (2014) were: (1) Northern Plains ($14.80M), (2) West ($14.2M), and (3) Midwest ($13.4M), while the highest ranked regions based on area-normalized total Ca2+ deposition value were: (1) South Central ($0.12 ha−1), (2) Midwest ($0.12 ha−1), and (3) Northern Plains ($0.09 ha−1) (Table 6).
The highest ranked regions for total value of total Ca2+ deposition based on a 2014 U.S. average price of $33.00 per U.S. ton of uncalcined gypsum were: (1) Northern Plains ($80.4M), (2) West ($77.3M), and (3) Midwest ($76.0M), while the highest ranked regions based on area-normalized total Ca2+ deposition value were: (1) South Central ($0.67 ha−1), (2) Midwest ($0.64 ha−1), and (3) Northern Plains ($0.47 ha−1) (Table 6).

4. Discussion

4.1. Implications for Ecosystem Services and Sustainable Development Goals (SDGs)

Inclusion of atmospheric calcium deposition flows as part of ecosystem services valuation is important for achieving the SDGs to sustain global human societies [1]. Atmospheric calcium deposition flows (dry, wet, composite) are significant and valuable sources of Ca2+, which is an essential nutrient [15]. The significance of Ca2+ in the environment and agriculture (especially as a soil amendment) is well documented by Vargas et al. (2018) [16], and the following examples are directly linked to the selected SDGs [1]:
2. End hunger, achieve food security and improve nutrition and promote sustainable agriculture;
Atmospheric calcium deposition has many beneficial impacts on soils, including: increase in soil alkalinity [17], availability of nutrients and biota, and improved soil structure [16], which can promote sustainable agriculture and food security. Calcium from atmospheric deposition enriches the nutrient cycling which contributes to increased yield of grain and biomass necessary for food security [18].
3. Ensure healthy lives and promote well-being for all at all ages;
Atmospheric deposition can be a significant source of “free-of-charge” calcium which is essential for human health [19].
6. Ensure availability and sustainable management of water and sanitation for all;
Atmospheric calcium deposition plays an important role in counteracting acid deposition in rain, acidification of watersheds, and lakes [20]. For example, studies have found that calcium-enriched Saharan dust deposition may have contributed to the progressive recovery of European lakes from acidification [21].
15. Protect, restore and promote sustainable use of terrestrial ecosystems, sustainably manage forests, combat desertification and halt and reverse land degradation and biodiversity loss.
Atmospheric calcium contributes to the increases in the pH of rainwater, and can counteract the effects of acid deposition on ecosystems [22]. It is especially crucial in the forest ecosystems with soil-calcium depletion linked to acid rain [23]. Schlesinger et al. (1982) [14] reported that atmospheric deposition was an important source of calcium in a chaparral ecosystem of southern California.
Although remarkable progress has been made in communicating the value of atmospheric services, the monetary valuation of these services has not been adequately developed [2].

4.2. Economic Implications

The atmosphere is one of the most valuable resources on planet Earth yet its contributions to SDGs and ecosystem services are not recognized, but instead are taken for granted. Thornes et al. (2010) [2] identified twelve atmospheric ecosystem services, which encompass all four types of ecosystem services, for example: (1) provisioning (e.g., air; direct use for ecosystems and agriculture; fuel combustion; direct use for power; the extraction of atmospheric gases, etc.); (2) regulating (e.g., the cleansing capacity of the atmosphere and dispersion of air pollution, etc.); (3) cultural (e.g., atmospheric recreation and climate tourism; aesthetic, spiritual and sensual properties, etc.), and (4) supporting (e.g., production of atmospheric oxygen, etc.). Thornes et al. (2010) [2] estimated the total economic value of the atmosphere to be at least between 100 and 1000 times the Gross World Product (GWP), which is most likely a gross underestimation of its total economic value. The fact that the ecosystem services value, or “true value,” of atmosphere is not recognized in the current market results in a negative externality because atmosphere with a positive value has zero market price, resulting in the market failure and the inefficient use of atmospheric resources. There is an urgent need to identify as many atmospheric ecosystem services as possible as well as the methods to assess the economic value of them. Most of the time the atmosphere is evaluated based on its disservices such as acid rain, ozone depletion, climate change, severe storms, etc. [2]. For example, Munich (2009) [24] estimated the cost of atmospheric disservices in the form of severe weather events at $250 billion per year by 2050.
This study examined one of the 12 atmospheric services, which is ranked in the sixth place in value according to Thornes et al. (2010) [2]: 6. Direct use of the atmosphere for ecosystems and agriculture (service type: provisioning and supporting). This study used a systems-based approach [4] to ecosystem services valuation of various atmospheric calcium deposition flows: separate constituent flows (wet, dry), and composite flow (total). In this study, flow refers to the “stock flow” and it is defined as the quantity per unit area per unit of time (e.g., annual mean Ca2+ deposition (kg ha−1) in Figure 1). These flows also can be measured as separate constituent stocks (e.g., annual mean wet Ca2+ deposition or annual mean dry Ca2+ deposition in kg ha−1) or composite stock (e.g., annual mean total Ca2+ deposition in kg ha−1) (Figure 1).
These flows provide both provisioning (e.g., food), and supporting ecosystem services. The value of wet, dry, and total atmospheric calcium deposition flows was estimated in the contiguous United States (U.S.) by different spatial aggregation levels (e.g., state, region) using the State Soil Geographic (STATSGO) soil database, and the prices of human-derived materials: agricultural limestone (CaCO3), uncalcined gypsum (CaSO4•2H2O). The results demonstrate the complex nature of atmospheric calcium deposition flows with different contributions of wet and dry depositions within states and regions (Figure 1). This study used a “crisp” boundary approach in showcasing the monetary values of atmospheric calcium deposition flows without error assessment or uncertainty evaluation [25]. There are other sources of variation as well. For example, atmospheric calcium contributions can vary in value based on the type of human-derived materials they are being compared to. For example, the values are higher based on gypsum. It is important to note that the values of human-derived materials used in this study are average prices for the country, which are not fixed in time and space. A more detailed valuation would require direct market valuation using replacement cost method based on market-based value of liming and fertilizer commodities requires detailed information for a particular state (e.g., most suitable human-derived materials to use, transportation costs, etc.).
Although a systems approach was effective in separating the types of flows (e.g., separate constituents: wet, dry; composite: total) it was not possible to separate “natural” and “human-derived” atmospheric calcium deposition (e.g., calcium from loess-derived particle; suspended human-derived liming, fertilizer materials, etc.). For example, Figure 1 clearly shows high concentration of atmospheric calcium deposition in the central areas of the country with high agricultural production and corresponding loess deposits, which tend to be highly susceptible to the wind erosion [26]. Atmospheric ecosystem services are posing particular challenges when it comes to distinguishing “natural” versus ”human-derived” flows due to its volatile nature. These challenges can be typical in agro-ecosystems [27].
Other set of challenges relate to spatial and temporal structure of the flows. Spatial structure refers to the geographic extent where the flow is delivering its goods [4]. In this study, the maps show the flow of “goods” with a high level of spatial accuracy, but the sources of flows are unknown (e.g., locally-derived versus long distance transport). Temporal structure refers in the timing of flows (e.g., seasonality) [4], and this aspect was not investigated in the present research.

5. Conclusions

Atmospheric calcium deposition (wet, dry, and total), which can be considered a naturally occurring liming and fertilizer materials, has not been included in economic valuations of ecosystem services. The amount of this naturally occurring “atmospheric” liming and fertilizer material varies in the U.S. within science-based boundaries, and administrative boundaries. Although the atmospheric calcium deposition can be valued by soil order within the contiguous U.S., this type of analysis has limited application to decision making, because decisions are made using administrative levels. National Atmospheric Deposition Program (NRSP-3) databases contain science-based information about elemental composition of the atmospheric depositions, which are of great importance in assessing ecosystem services at different administrative levels. The value of atmospheric deposition flows (separate constituent, composite) in the contiguous United States (U.S.) varies by state, and region. This spatial distribution information could be linked to existing or future policy with regards to more efficient use of ecosystem services. The fact that atmospheric deposition flows have positive value but zero market price results in the negative externality and the inefficient use of “human-derived” materials. Estimating the value of atmospheric deposition flows is the crucial step to correcting the market failure. Future research on atmospheric deposition flows, and ecosystems services should combine spatial and temporal variation in ecosystem services valuation. Another important future research consideration is understanding supply and demand for atmospheric deposition flows to meet the SDGs, especially considering that changes in climate may alter the quantity and delivery pattern of atmospheric deposition flows and its associated elements.

Author Contributions

Conceptualization, E.A.M.; methodology, G.R.G., M.A.S. and L.Z.; Writing—Original Draft preparation, G.R.G. and E.A.M.; Writing—Review and Editing, G.R.G., E.A.M., C.J.P., M.A.S. and L.Z.; visualization, M.P.C. and C.J.P.

Funding

This research received no external funding.

Acknowledgments

This study was based on data from the National Atmospheric Deposition Program (NRSP-3). We would like to thank the reviewers for the constructive comments and suggestions.

Conflicts of Interest

The authors declare no conflicts of interest.

References

  1. Keestra, S.D.; Bouma, J.; Wallinga, J.; Tittonell, P.; Smith, P.; Cerda, A.; Montanarella, L.; Quinton, J.N.; Pachepsky, Y.; Van der Putten, W.H.; et al. The significance of soils and soil science towards realization of the United Nations Sustainable Development Goals. Soil 2016, 2, 111–128. [Google Scholar] [CrossRef] [Green Version]
  2. Thornes, J.; Bloss, W.; Bouzarovski, S.; Cai, X.; Chapman, L.; Clark, J.; Dessai, S.; Du, S.; van der Horst, D.; Kendall, M.; et al. Communicating the value of atmospheric services. Meteorol. Appl. 2010, 17, 243–250. [Google Scholar] [CrossRef] [Green Version]
  3. Mikhailova, E.; Cope, M.; Groshans, G.; Post, C.; Schlautman, M.; Zhang, L. Contribution of atmospheric deposition to soil provisioning ecosystem services in the contiguous United States: Part 1. Calcium. Conference Proceesings of the 3rd International Conference on Atmospheric Dust—DUST 2018. ProScience 2018, 5, 58–68. [Google Scholar]
  4. Jones, L.; Norton, L.; Austin, Z.; Browne, A.L.; Donovan, D.; Emmett, B.A.; Grabowski, Z.J.; Howard, D.C.; Jones, J.P.G.; Kenter, J.O.; et al. Stocks and flows of natural and human-derived capital in ecosystem services. Land Use Policy 2016, 52, 151–162. [Google Scholar] [CrossRef] [Green Version]
  5. Cooter, E.J.; Rea, A.; Bruins, R.; Schwede, D.; Dennis, R. The role of the atmosphere in the provision of ecosystem services. Sci. Total Environ. 2013, 448, 197–208. [Google Scholar] [CrossRef] [PubMed]
  6. Goddard, M.A.; Mikhailova, E.A.; Post, C.J.; Schlautman, M.A.; Galbraith, J.M. Continental United States atmospheric calcium wet deposition and soil inorganic carbon stocks. Soil Sci. Soc. Am. J. 2009, 73, 989–994. [Google Scholar] [CrossRef]
  7. Carrillo, J.H.; Hastings, M.G.; Sigman, M.; Huebert, B.J. Atmospheric deposition of inorganic and organic nitrogen and base cations in Hawaii. Glob. Biogeochem. Cycles 2002, 16, 1076. [Google Scholar] [CrossRef]
  8. USGS. Minerals Yearbook, 2014: Stone, Crushed [Advance Release]. U.S. Department of the Interior, U.S. Geological Survey. April 2016. Available online: https://minerals.usgs.gov/minerals/pubs/commodity/stone_crushed/myb1-2014-stonc.pdf (accessed on 5 March 2019).
  9. USGS. Minerals Yearbook, 2015: Gypsum [Advance Release]. U.S. Department of the Interior, U.S. Geological Survey. September 2017. Available online: https://minerals.usgs.gov/minerals/pubs/commodity/gypsum/myb1-2015-gypsu.pdf (accessed on 5 March 2019).
  10. Heal, G. Nature and the Marketplace: Capturing the Value of Ecosystem Services; Island Press: Washington, DC, USA; Covelo, CA, USA, 2000. [Google Scholar]
  11. Groshans, G.; Mikhailova, E.; Post, C.; Schlautman, M.; Zurqani, H.; Zhang, L. Assessing the value of soil inorganic carbon for ecosystem services in the contiguous United States based on liming replacement costs. Land 2018, 7, 149. [Google Scholar] [CrossRef]
  12. National Atmospheric Deposition Program (NRSP-3). NADP Program Office, Wisconsin State Laboratory of Hygiene, 465 Henry Mall, Madison, WI 53706, USA. 2018. Available online: http://nadp.slh.wisc.edu/ (accessed on 15 November 2018).
  13. ESRI. ArcGIS Desktop: Release 10.4; Environmental Systems Research Institute: Redlands, CA, USA, 2016. [Google Scholar]
  14. Schlesinger, W.H.; Gray, J.T.; Gilliam, F.S. Atmospheric deposition processes and their importance as sources of nutrients in a chaparral ecosystem of southern California. Water Resour. Res. 1982, 18, 623–629. [Google Scholar] [CrossRef]
  15. Kirkby, E.A.; Pilbeam, D.J. Calcium as a plant nutrient. Plant Cell Environ. 1984, 7, 397–405. [Google Scholar] [CrossRef]
  16. Vargas, G.; Verdejo, J.; Rivera, A.; Suárez, D.; Youlton, C.; Celis-Diez, J.L.; Le Bissonnais, Y.; Dovletyarova, E.A.; Neaman, A. The effect of four calcium-based amendments on soil aggregate stability of two sandy topsoils. J. Plant Nutr. Soil Sci. 2018. [Google Scholar] [CrossRef]
  17. Watmough, S.A.; Whitfield, C.J.; Fenn, M.E. The importance of atmospheric base cation deposition for preventing soil acidification in the Athabasca Oil Sands Region of Canada. Sci. Total Environ. 2014, 493, 1–11. [Google Scholar] [CrossRef]
  18. Holland, J.E.; Bennett, A.E.; Newton, A.C.; White, P.J.; McKenzie, B.M.; George, T.S.; Pakeman, R.J.; Bailey, J.S.; Fornara, D.A.; Hayes, R.C. Liming impacts on soils, crops and biodiversity in the U.K.: A review. Sci. Total Environ. 2018, 610, 316–332. [Google Scholar] [CrossRef]
  19. Pravina, P.; Sayaji, D.; Avinash, M. Calcium and its role in human body. Int. J. Res. Pharm. Biomed. Sci. 2013, 4, 659–668. [Google Scholar]
  20. Schmitt, A.; Stille, P. The source of calcium in wet atmospheric deposits: Ca-Sr isotope evidence. Geochim. Cosmochim. Acta 2005, 69, 3463–3468. [Google Scholar] [CrossRef]
  21. Rogora, M.; Mosello, R.; Marchetto, A. Long-term trends in the chemistry of atmospheric deposition in northwestern Italy: The role of increasing Saharan dust deposition. Tellus Ser. B 2004, 56, 426–434. [Google Scholar] [CrossRef]
  22. Löye-Pilot, M.D.; Martin, J.M.; Morelli, J. Influence of Saharan dust on the rain acidity and atmospheric input to the Mediterranean. Nature 1986, 321, 427–428. [Google Scholar] [CrossRef]
  23. Markewitz, D.; Richter, D.D.; Allen, H.L.; Urrego, J.B. Three decades of observed soil acidification in the Calhoun Experimental Forest: Has acid rain made a difference? Soil Sci. Soc. Am. J. 1998, 62, 1428–1439. [Google Scholar] [CrossRef]
  24. Munich, R.E. Topics GEO: Natural Catastrophes 2009. Analyses, Assessments, Positions. 2009. Available online: https://www.munichre.com/site/touch-publications/get/documents_E711248208/mr/assetpool.shared/Documents/5_Touch/_Publications/TOPICS_GEO_2017-en.pdf (accessed on 15 November 2018).
  25. Grunwald, S.; Thompson, J.A.; Boettinger, J.L. Digital soil mapping and modeling at continental scales: Finding solutions to global issues. Soil Sci. Soc. Am. J. 2011, 75, 1201–1213. [Google Scholar] [CrossRef]
  26. Follmer, L.R. Loess studies in central United States: Evolution of concepts. Eng. Geol. 1996, 45, 287–304. [Google Scholar] [CrossRef]
  27. Remme, R.P.; Schröter, M.; Hein, L. Developing spatial biophysical accounting for multiple ecosystem services. Ecosyst. Serv. 2014, 10, 6–18. [Google Scholar] [CrossRef]
Figure 1. Area-normalized annual mean Ca2+ deposition (kg ha−1) for the years 2000 to 2015 in the contiguous United States: (a) wet, (b) dry, and (c) total (adapted from [3]).
Resources 08 00066 g001aResources 08 00066 g001b
Figure 2. Example of types of atmospheric flows.
Resources 08 00066 g002
Table 1. The building blocks of a systems approach to describing atmosphere and pedosphere ecosystem services exchange (adapted from [4]).
Atmosphere
Natural CapitalNatural + Human-Derived CapitalHuman-Derived Capital
StocksStocksStocks
FlowsFlowsFlows
StocksStocksStocks
Natural CapitalNatural + Human-Derived CapitalHuman-Derived Capital
Pedosphere
Table 2. Example of valuation within science-based boundaries: soil order. Total value of mean and area-normalized annual atmospheric wet Ca2+ deposition by soil order for the 10-year period 1994 to 2003 based on a 2014 average price of $10.42 per U.S. ton of agricultural limestone (CaCO3) [8], and a 2014 U.S. average price of $33.00 per U.S. ton of uncalcined gypsum (CaSO4•2H2O) [9] within contiguous United States (calculated based on data from [6]).
Based on Average Price of LimestoneBased on Average Price of Gypsum
Soil OrderTotal Area (ha)Mean Value ($ ha1)Total Value ($)Mean Value ($ ha1)Total Value ($)
Slight weathering
Entisols9.2E+070.032.93E+060.171.59E+07
Inceptisols6.0E+070.031.82E+060.179.93E+06
Histosols6.8E+060.053.27E+050.261.78E+06
Gelisols-----
Andisols5.9E+060.021.20E+050.116.54E+05
Intermediate weathering
Aridisols7.8E+070.032.23E+060.161.22E+07
Vertisols1.5E+070.056.75E+050.253.68E+06
Alfisols1.3E+080.056.40E+060.273.49E+07
Mollisols1.8E+080.058.76E+060.274.78E+07
Strong weathering
Spodosols2.6E+070.038.86E+050.194.83E+06
Ultisols9.1E+070.003.13E+050.021.71E+06
Oxisols-----
Totals or averages6.9E+080.032.45E+070.191.33E+08
Note: Total areas and thus subsequent calculated values for Oxisols and Gelisols were negligible and therefore are not shown.
Table 3. Conceptual overview of the accounting framework for a systems-based approach in the ecosystem services valuation of various atmospheric calcium deposition flows used in this study (adapted from [11]).
Biophysical Accounts (Science-Based)Administrative Accounts (Boundary-Based)Monetary AccountsBenefitTotal Value
Science-based extent:Administrative extent:Ecosystem good(s) and service(s):Sector:Types of value:
Separate constituent flow 1: Annual mean atmospheric wet Ca2+ deposition
Separate constituent flow 2: Annual mean atmospheric dry Ca2+ deposition
Composite flow (sum of flows: wet + dry): Annual mean atmospheric total Ca2+ deposition
- Not determined- Country
- Region
- State
Goods:
- Ca2+ in wet and dry deposition
Services:
- Provisioning (e.g., food)
- Supporting (e.g., nutrient cycling)
Agriculture:
- Liming equivalent
(e.g., pH buffering)
- Fertilizer equivalent (e.g., Ca2+ as an essential nutrient)
Direct market valuation using replacement cost method based on
market-based value of commodities:
- Price of agricultural agricultural limestone (CaCO3) [8] if soil pH needs to be raised
- Price of uncalcined gypsum (CaSO4•2H2O) [9] with no change in pH
Table 4. Total value and area-averaged value of annual mean atmospheric wet Ca2+ deposition for each state (region) for the 16-year period 2000–2015 based on a 2014 U.S. average price of $10.42 per U.S. ton of agricultural limestone (CaCO3) [8], and a 2014 U.S. average price of $33.00 per U.S. ton of uncalcined gypsum (CaSO4•2H2O) [9].
State (Region)Area (ha)Mean Wet Ca2+ (kg ha−1)Based on Average Price of LimestoneBased on Average Price of Gypsum
Mean Value ($ ha−1)Total Value ($)Mean Value ($ ha−1)Total Value ($)
Connecticut1.28E+060.910.033.35E+040.141.83E+05
Delaware5.24E+050.950.031.43E+040.157.78E+04
Massachusetts2.08E+060.820.024.89E+040.132.66E+05
Maryland2.48E+060.980.036.97E+040.153.80E+05
Maine8.26E+060.640.021.51E+050.108.26E+05
New Hampshire2.38E+060.700.024.78E+040.112.61E+05
New Jersey1.93E+061.030.035.69E+040.163.10E+05
New York1.25E+071.030.033.70E+050.162.02E+06
Pennsylvania1.17E+071.210.034.07E+050.192.22E+06
Rhode Island2.61E+050.820.026.12E+030.133.34E+04
Vermont2.49E+060.890.026.34E+040.143.46E+05
West Virginia6.28E+061.270.042.28E+050.201.25E+06
(East)5.22E+070.940.031.50E+060.168.16E+06
Iowa1.46E+073.130.091.31E+060.497.12E+06
Illinois1.46E+072.410.071.01E+060.385.49E+06
Indiana9.43E+062.330.076.29E+050.363.43E+06
Michigan1.50E+071.660.057.13E+050.263.89E+06
Minnesota2.18E+071.850.051.16E+060.296.31E+06
Missouri1.81E+072.670.081.38E+060.427.54E+06
Ohio1.07E+071.690.055.16E+050.262.82E+06
Wisconsin1.45E+072.100.068.73E+050.334.76E+06
(Midwest)1.19E+082.230.067.58E+060.354.13E+07
Arkansas1.37E+071.900.057.45E+050.304.06E+06
Louisiana1.18E+071.590.055.37E+050.252.93E+06
Oklahoma1.81E+072.620.081.36E+060.417.42E+06
Texas6.83E+071.910.053.74E+060.302.04E+07
(South Central)1.12E+082.000.066.38E+060.313.48E+07
Alabama1.34E+071.110.034.25E+050.172.32E+06
Florida1.43E+071.260.045.16E+050.202.81E+06
Georgia1.52E+070.850.023.69E+050.132.01E+06
Kentucky1.04E+071.560.044.67E+050.242.54E+06
Mississippi1.23E+071.330.044.70E+050.212.56E+06
North Carolina1.26E+070.840.023.03E+050.131.65E+06
South Carolina7.96E+060.850.021.94E+050.131.06E+06
Tennessee1.09E+071.380.044.31E+050.222.35E+06
Virginia1.03E+070.850.022.50E+050.131.36E+06
(Southeast)1.07E+081.110.033.43E+060.171.87E+07
Colorado2.70E+071.290.049.96E+050.205.43E+06
Kansas2.13E+072.630.081.60E+060.418.75E+06
Montana3.81E+070.790.028.62E+050.124.70E+06
North Dakota2.00E+071.210.036.93E+050.193.78E+06
Nebraska2.00E+072.030.061.16E+060.326.35E+06
South Dakota2.00E+071.510.048.65E+050.244.72E+06
Wyoming2.53E+070.990.037.18E+050.153.92E+06
(Northern Plains)1.72E+081.490.046.90E+060.223.76E+07
Arizona2.94E+070.930.037.84E+050.154.28E+06
California4.08E+070.310.013.62E+050.051.97E+06
Idaho2.16E+071.030.036.37E+050.163.47E+06
New Mexico3.15E+071.190.031.07E+060.195.86E+06
Nevada2.87E+070.530.024.35E+050.082.37E+06
Oregon2.51E+070.360.012.59E+050.061.41E+06
Utah2.20E+070.720.024.53E+050.112.47E+06
Washington1.74E+070.420.012.09E+050.071.14E+06
(West)2.16E+080.690.024.21E+060.112.30E+07
Totals or averages7.78E+081.310.043.00E+070.211.64E+08
Table 5. Total value and area-averaged value of annual atmospheric dry Ca2+ deposition for each state (region) for the 16-year period 2000–2015 based on a 2014 U.S. average price of $10.42 per U.S. ton of agricultural limestone (CaCO3) [8], and a 2014 U.S. average price of $33.00 per U.S. ton of uncalcined gypsum (CaSO4•2H2O) [9].
State (Region)Area (ha)Mean Dry Ca2+ (kg ha−1)Based on Average Price of LimestoneBased on Average Price of Gypsum
Mean ValueTotal ValueMean ValueTotal Value
($ ha−1)($)($ ha−1)($)
Connecticut1.28E+060.830.023.05E+040.131.67E+05
Delaware5.24E+050.980.031.47E+040.158.03E+04
Massachusetts2.08E+060.820.024.89E+040.132.66E+05
Maryland2.48E+061.390.049.88E+040.225.39E+05
Maine8.26E+060.630.021.49E+050.108.13E+05
New Hampshire2.38E+060.710.024.85E+040.112.64E+05
New Jersey1.93E+061.160.036.40E+040.183.49E+05
New York1.25E+071.060.033.81E+050.172.07E+06
Pennsylvania1.17E+071.580.055.32E+050.252.90E+06
Rhode Island2.61E+050.790.025.90E+030.123.22E+04
Vermont2.49E+060.780.025.55E+040.123.03E+05
West Virginia6.28E+062.380.074.28E+050.372.33E+06
(East)5.22E+071.090.041.86E+060.191.01E+07
Iowa1.46E+072.250.069.38E+050.355.12E+06
Illinois1.46E+072.460.071.03E+060.385.60E+06
Indiana9.43E+062.170.065.86E+050.343.20E+06
Michigan1.50E+071.600.056.87E+050.253.75E+06
Minnesota2.18E+071.260.047.88E+050.204.30E+06
Missouri1.81E+072.040.061.06E+060.325.76E+06
Ohio1.07E+071.830.055.59E+050.293.05E+06
Wisconsin1.45E+071.710.057.11E+050.273.88E+06
(Midwest)1.19E+081.920.056.35E+060.293.46E+07
Arkansas1.37E+071.220.034.79E+050.192.61E+06
Louisiana1.18E+070.880.032.97E+050.141.62E+06
Oklahoma1.81E+071.850.059.61E+050.295.24E+06
Texas6.83E+072.830.085.54E+060.443.02E+07
(South Central)1.12E+081.700.067.28E+060.353.97E+07
Alabama1.34E+070.760.022.91E+050.121.59E+06
Florida1.43E+071.770.057.25E+050.283.95E+06
Georgia1.52E+070.710.023.09E+050.111.68E+06
Kentucky1.04E+071.510.044.52E+050.242.46E+06
Mississippi1.23E+070.800.022.82E+050.121.54E+06
North Carolina1.26E+071.110.034.01E+050.172.19E+06
South Carolina7.96E+060.630.021.44E+050.107.83E+05
Tennessee1.09E+071.310.044.09E+050.202.23E+06
Virginia1.03E+071.230.043.62E+050.191.97E+06
(Southeast)1.07E+081.090.033.37E+060.171.84E+07
Colorado2.70E+071.740.051.34E+060.277.33E+06
Kansas2.13E+073.350.102.04E+060.521.11E+07
Montana3.81E+070.850.029.28E+050.135.06E+06
North Dakota2.00E+071.110.036.36E+050.173.47E+06
Nebraska2.00E+071.970.061.13E+060.316.16E+06
South Dakota2.00E+071.170.036.70E+050.183.65E+06
Wyoming2.53E+071.510.041.10E+060.245.97E+06
(Northern Plains)1.72E+081.670.057.85E+060.254.28E+07
Arizona2.94E+072.220.061.87E+060.351.02E+07
California4.08E+071.210.031.41E+060.197.70E+06
Idaho2.16E+070.840.025.19E+050.132.83E+06
New Mexico3.15E+072.700.082.44E+060.421.33E+07
Nevada2.87E+071.870.051.53E+060.298.37E+06
Oregon2.51E+070.410.012.95E+050.061.61E+06
Utah2.20E+072.710.081.71E+060.429.30E+06
Washington1.74E+070.380.011.89E+050.061.03E+06
(West)2.16E+081.540.059.97E+060.255.43E+07
Totals or averages7.78E+081.440.043.67E+070.222.00E+08
Table 6. Total value and area-averaged value of annual atmospheric total Ca2+ deposition for each state (region) for the 16-year period 2000–2015 based on a 2014 U.S. average price of $10.42 per U.S. ton of agricultural limestone (CaCO3) [8], and a 2014 U.S. average price of $33.00 per U.S. ton of uncalcined gypsum (CaSO4•2H2O) [9].
State (Region)Area (ha)Mean Total Ca2+ (kg ha1)Based on Average Price of LimestoneBased on Average Price of Gypsum
Mean ValueTotal ValueMean ValueTotal Value
($ ha1)($)($ ha1)($)
Connecticut1.28E+061.740.056.40E+040.273.49E+05
Delaware5.24E+051.890.052.90E+040.301.55E+05
Massachusetts2.08E+061.650.059.77E+040.265.36E+05
Maryland2.48E+062.350.071.68E+050.379.11E+05
Maine8.26E+061.250.043.01E+050.201.61E+06
New Hampshire2.38E+061.370.049.63E+040.215.10E+05
New Jersey1.93E+062.180.061.21E+050.346.56E+05
New York1.25E+072.120.067.50E+050.334.15E+06
Pennsylvania1.17E+072.750.089.39E+050.435.04E+06
Rhode Island2.61E+051.580.051.20E+040.256.43E+04
Vermont2.49E+061.620.051.19E+050.256.29E+05
West Virginia6.28E+063.620.106.57E+050.573.55E+06
(East)5.22E+072.010.063.35E+060.351.83E+07
Iowa1.46E+075.530.152.24E+060.861.22E+07
Illinois1.46E+074.880.142.03E+060.761.11E+07
Indiana9.43E+064.520.131.22E+060.716.63E+06
Michigan1.50E+073.240.091.40E+060.517.63E+06
Minnesota2.18E+073.120.091.94E+060.491.06E+07
Missouri1.81E+074.760.132.44E+060.741.33E+07
Ohio1.07E+073.530.101.08E+060.555.87E+06
Wisconsin1.45E+073.810.111.58E+060.608.64E+06
(Midwest)1.19E+084.170.121.39E+070.647.60E+07
Arkansas1.37E+073.060.091.22E+060.496.67E+06
Louisiana1.18E+072.460.078.34E+050.394.55E+06
Oklahoma1.81E+074.490.132.32E+060.701.27E+07
Texas6.83E+074.750.149.28E+060.745.06E+07
(South Central)1.12E+083.690.121.37E+070.677.45E+07
Alabama1.34E+071.900.057.16E+050.293.91E+06
Florida1.43E+072.480.091.24E+060.476.77E+06
Georgia1.52E+071.540.046.78E+050.243.70E+06
Kentucky1.04E+073.040.099.18E+050.485.01E+06
Mississippi1.23E+072.120.067.52E+050.334.10E+06
North Carolina1.26E+071.910.067.04E+050.303.84E+06
South Carolina7.96E+061.490.043.38E+050.231.84E+06
Tennessee1.09E+072.670.088.40E+050.424.58E+06
Virginia1.03E+072.060.066.12E+050.323.34E+06
(Southeast)1.07E+082.130.066.80E+060.353.71E+07
Colorado2.70E+073.040.092.34E+060.471.28E+07
Kansas2.13E+076.020.173.65E+060.931.99E+07
Montana3.81E+071.600.051.79E+060.269.76E+06
North Dakota2.00E+072.300.071.33E+060.367.24E+06
Nebraska2.00E+074.030.112.29E+060.621.25E+07
South Dakota2.00E+072.660.081.53E+060.428.37E+06
Wyoming2.53E+072.470.071.81E+060.399.89E+06
(Northern Plains)1.72E+083.160.091.48E+070.478.04E+07
Arizona2.94E+073.160.092.66E+060.491.45E+07
California4.08E+071.490.041.74E+060.249.48E+06
Idaho2.16E+071.830.051.13E+060.296.17E+06
New Mexico3.15E+073.910.113.53E+060.611.93E+07
Nevada2.87E+071.870.071.53E+060.378.37E+06
Oregon2.51E+070.410.022.95E+050.121.61E+06
Utah2.20E+072.710.101.71E+060.549.30E+06
Washington1.74E+070.380.021.89E+050.121.03E+06
(West)2.16E+081.970.071.42E+070.367.73E+07
Totals or averages7.78E+082.860.086.67E+070.453.64E+08

