Article

Urban Water Security Assessment Using an Integrated Metabolism Approach—Case Study of the National Capital Territory of Delhi in India

1
Research Associate, Centre for Sustainable Technologies, Belfast School of Architecture and the Built Environment, Ulster University, Belfast BT37 0QB, UK
2
Professor, Coca-Cola Department of Regional Water Studies, TERI School of Advanced Studies, 10 Institutional Area, Vasant Kunj, 110 070 New Delhi, India
3
Department of Engineering and Chemical Sciences, Karlstad University, 65188 Karlstad, Sweden
*
Authors to whom correspondence should be addressed.
Resources 2019, 8(2), 62; https://doi.org/10.3390/resources8020062
Submission received: 20 February 2019 / Revised: 28 March 2019 / Accepted: 29 March 2019 / Published: 3 April 2019
(This article belongs to the Special Issue Integrated Urban Water Resources Management and Policy)

Abstract

:
Water is a non substitutable resource and a social good, which governments must perforce provide to its citizens in the right quantity and quality. An integrated urban metabolism model is useful in understanding the status quo of an urban water and sanitation system. By defining and measuring the values of relevant hydrological performance indicators—deliverables of the model referred to—a thorough knowledge of the present performance and the gaps, which need to be plugged en route to a sustainable urban water infrastructure, can be obtained, as demonstrated in this paper. This then forms the bedrock for decision-making and policy formulation for change to be introduced top-down as well as advice, which would enable the much needed bottom-up support to policies. The authors have chosen Delhi as the case study city, but would like to point out that this application can be reproduced for any other town/city/region of the world. The water balance within the chosen system boundaries shows that the annual unutilized flows, amounting to 1443 million cubic meters, dominate the metabolic flows of water in Delhi, and the annual groundwater withdrawal, which exceeds 420 million cubic meters, is much greater than the recharge rate, resulting in a rapid depletion of the groundwater level. There is an urgent need thereby to improve the rate of infiltration of stormwater and reduce the rate of runoff by focusing on increasing the share of permeable surfaces in the city, as well as to consider the wastewater streams as potential sources of water, while not forgetting demand side of management measures, as the pressure on the urban water system in the city is likely to intensify with a combination of population growth, economic development, and climate change in the near future. The recommendations provided by the authors towards the end of the article, can, if suitable measures are undertaken and robust policies are implemented, result in Delhi’s enjoying a water surplus in the short term, and progressively attain complete sustainability with regard to the utilization of its water resources.

Graphical Abstract

1. Introduction

A sustainable city is characterized by, inter alia, economic vitality, long-term environmental sustainability (which includes a greater share of green energy in the mix), good healthcare facilities, and energy and water security. A review of the relevant literature clearly brings out the fact that natural systems, physical infrastructure, lifestyles, behaviors, and aspirations of the populace should be viewed interactively to design a sustainable city [1,2,3]. As far as water security is concerned, an analysis to determine what needs to be done, starts with the setting up of water balances using the MFA (material flow analysis) approach, which tracks the flows of substances/materials/goods through for defined periods of time and selected geographical system boundaries. However, the conventional water balance approach, as used by many urban planners, is confined to assessing water demand of the city and identifying water sources to meet such demand. Such a method does not provide any insights into the hydrological performance of a city (e.g., the water flux rate and potential of utilization of internal flows). In this paper, the authors have demonstrated the usefulness of an urban water metabolism model (used earlier to study urban water systems in other cities by, inter alia, [4,5,6]), which takes a more comprehensive view of the metabolic flows [7] of water and wastewater, and contributes by offering insights into the current performance. These insights then enable decision-makers to devise and structure interventions to improve the long-term water security of the region. Flows that are neglected in the conventional approach are factored in when an urban water metabolism model is adopted, and factors impeding water security are more easily identified.
In this paper, the authors have chosen Delhi as the ‘case-megacity’ to be analyzed for water security and sustainability. The questions which the authors have tried to answer through the said analysis bolstered by the urban water metabolism model are as follows.
Is Delhi self-reliant as far as its water requirements are concerned?
If yes, how long can it expect to be self-reliant?
What measures must be undertaken to ensure a more durable self-reliance and sustainability in the long run?
Instead of starting from scratch and defining new indicators, we have taken recourse to the hydrological performance indicators used in [8]), while taking the liberty to make some modifications in the context of the objectives of this case study, to select dominant indicators impacting urban hydrology. Thus, it must be stated at the outset, that the authors do not stake any claims to complete novelty as regards as the methodology adopted. The urban water metabolism model is being used for the first time to study the system in Delhi, and the calculation of the values of the indicators defined by [8] serve as inputs to decision-making and policy formulation at the city–government level, as far as much needed interventions in the near future are concerned. The questions which have been raised above, and answered later on in the paper, make this analysis one of practical significance.

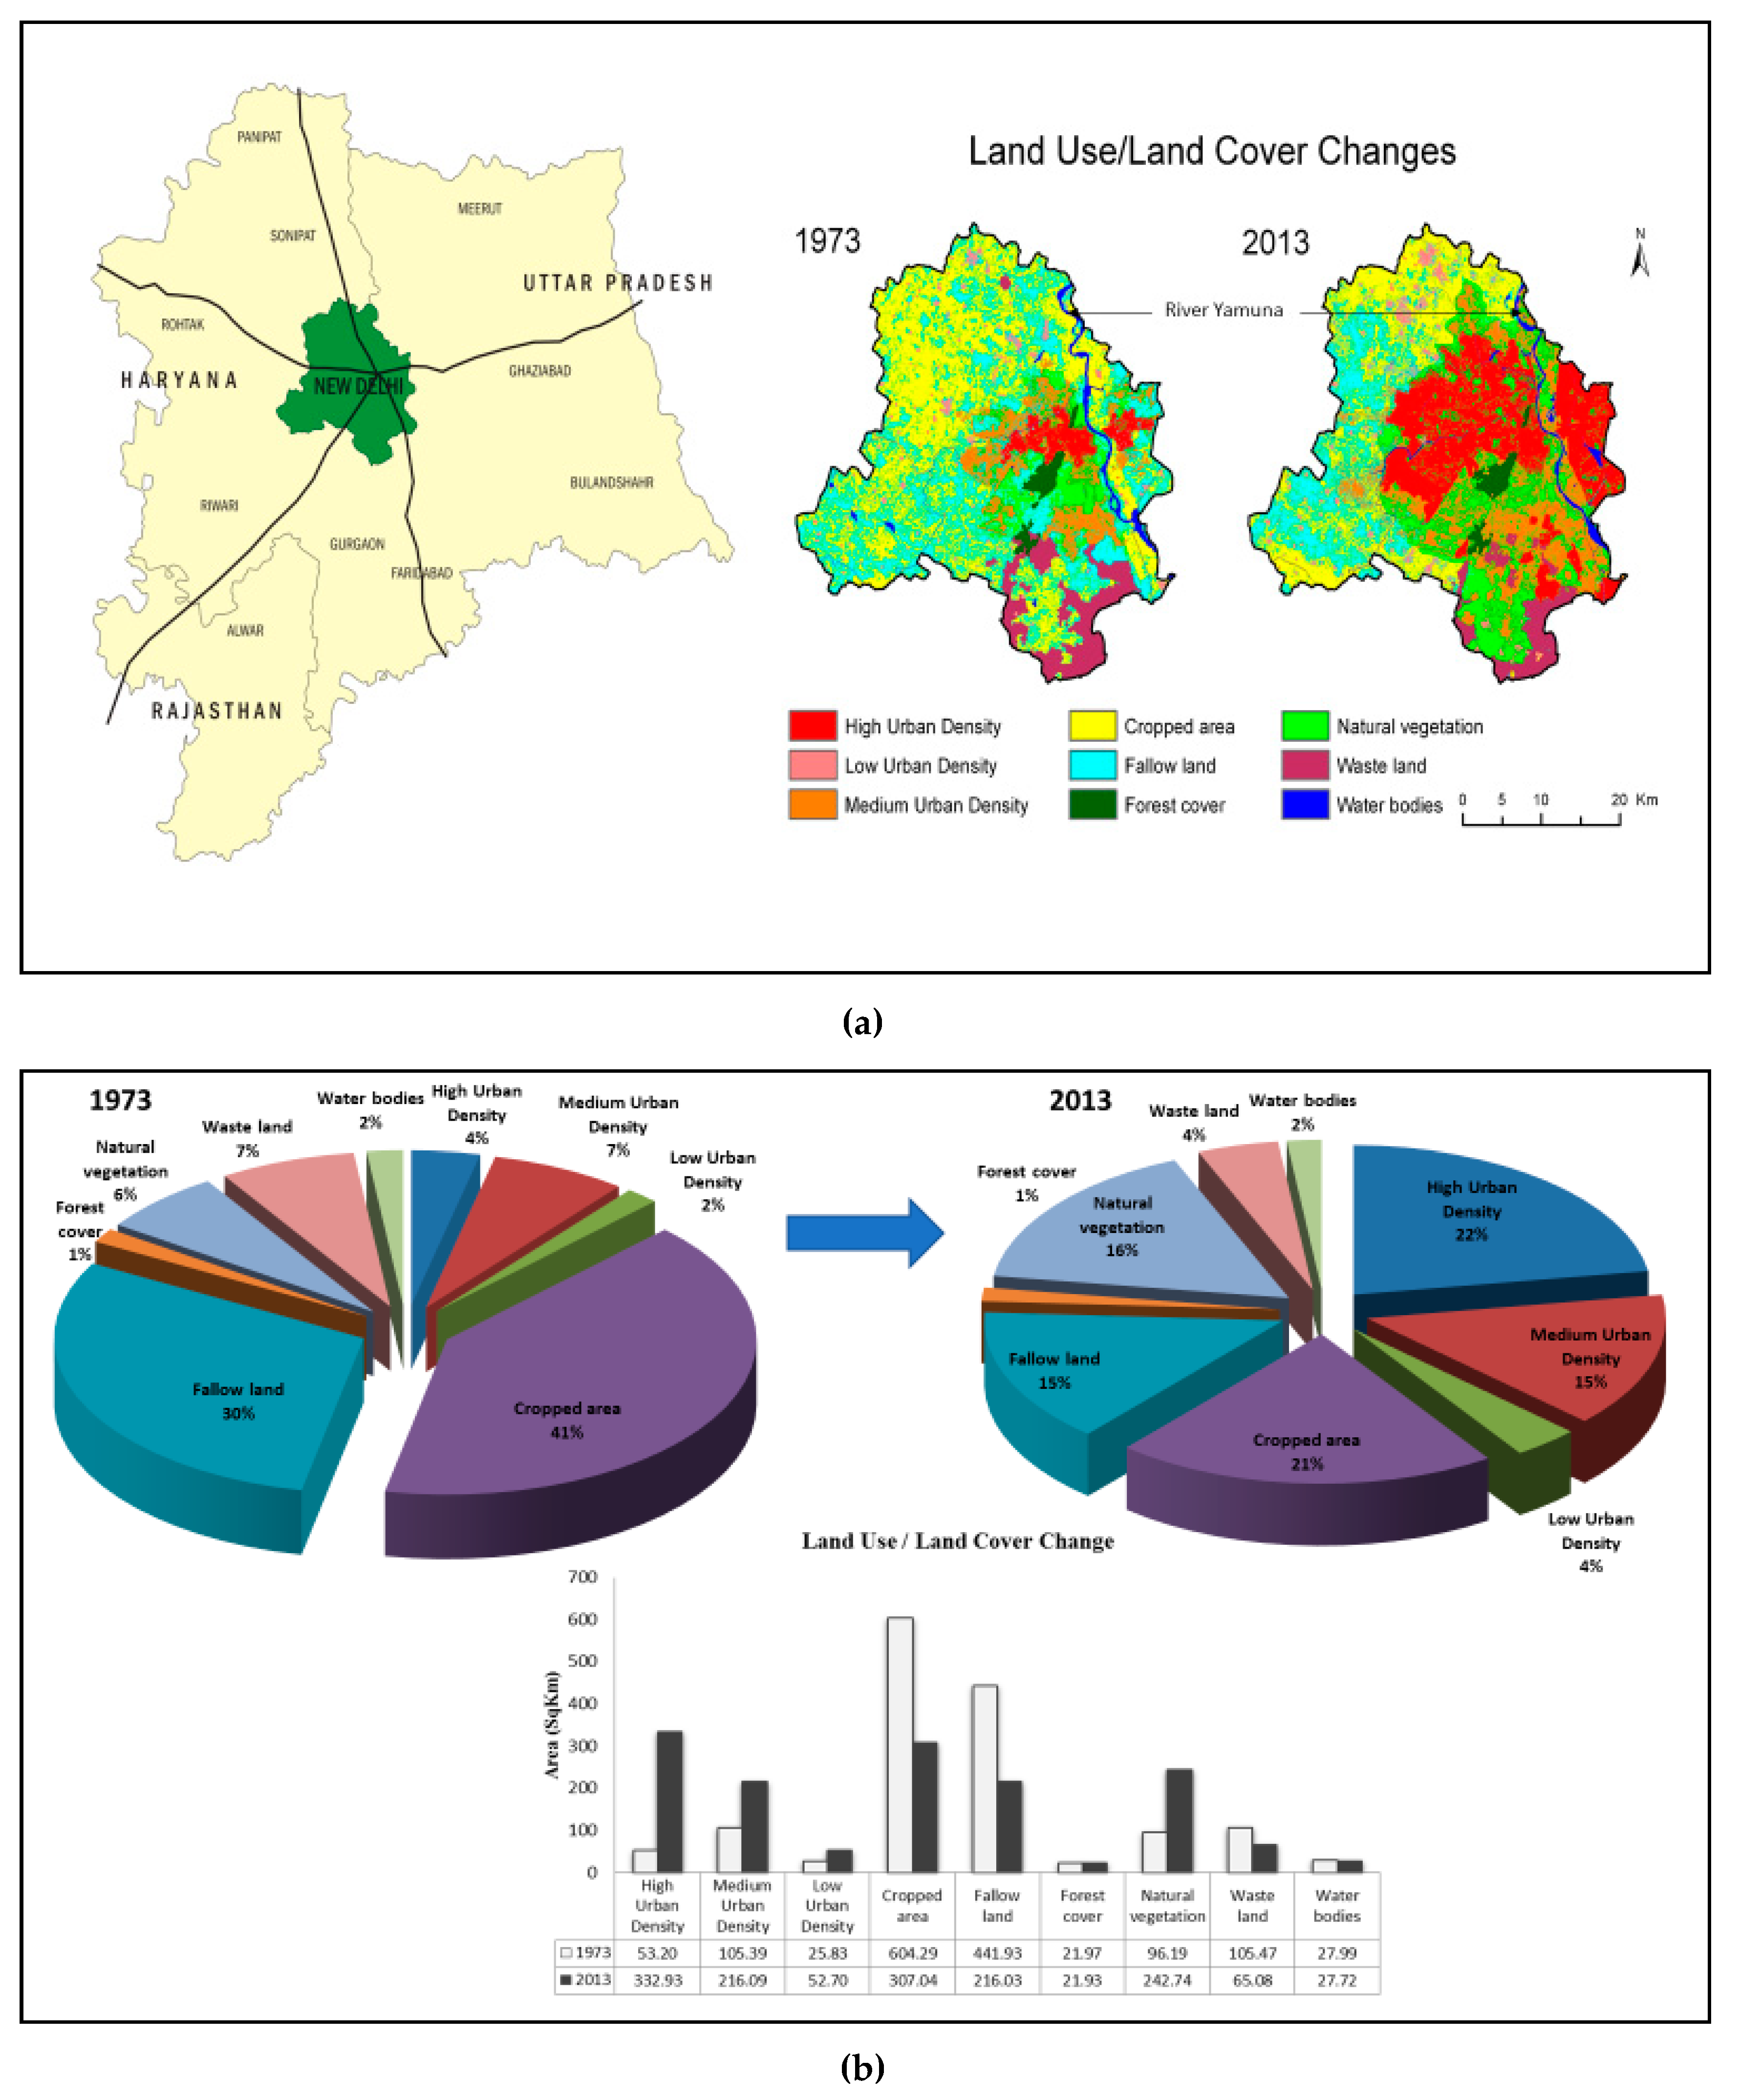
Water Resource Characteristics of the Study Area
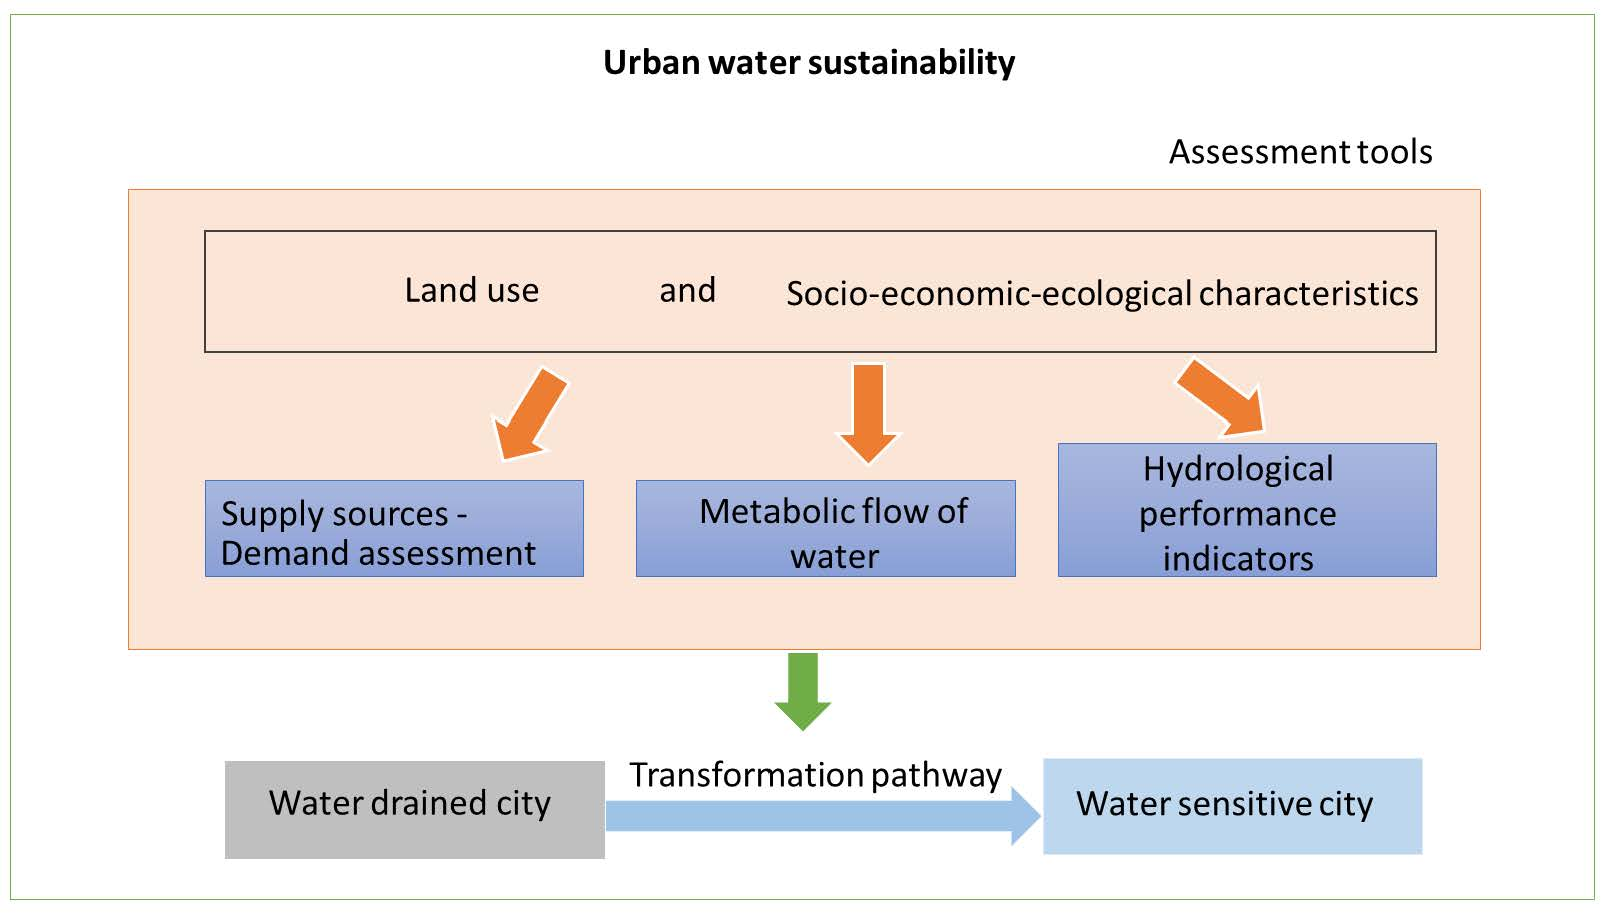
The surface area of Delhi, also known as the National Capital Territory of Delhi (NCTD), is approximately 1483 km2 [9]. In 2011, Delhi’s population was 16.78 million and is expected to reach 26 million by 2030 [10]. Of the total area, 1114 km2 (~75%) can be classified as urban [9]. Urban Delhi accounts for a significant proportion of the population of the NCTD [10]. Apart from the rivers Ganga and Yamuna, which are the main surface water sources serving the needs of the city, there are three additional canals—Agra, Western Yamuna, and Hindon—fed by reservoir of the Bhakra-Nangal Dam [11] (on the Sutlej River in northern India, referred to in the text hereafter, as the Bhakra storage), which is the third largest reservoir in the country. The rapid rise in the built-up area in Delhi over the last 40 years has happened at the expense of its farmland [12], as shown in Figure 1.
The Himalayan rivers Yamuna and Ganga supply 1.49 million cubic meters (MCM) and 0.94 MCM per day, respectively, while nearly one MCM comes from the Bhakra storage [9]. Recycling filter backwash water in water treatment plants and loss reduction by taking recourse to parallel-lined canals, which contribute ~0.64 MCM to the water supply [9]. Due to the high pollution load on the river Yamuna and issues related to water sharing with the neighboring States, Delhi is highly dependent on groundwater sources for meeting its water requirements [13]. The net annual water availability (the annual recharge) is 0.29 billion cubic meters (BCM), whereas the annual groundwater extraction is 0.39 BCM as reported by Central Ground Water Board (CGWB) [14], and the depth to the water table has been increasing rapidly. Rainfall is the major source of groundwater recharge (Table 1), supplemented by other sources such as recharge from canals, irrigated fields, and surface water bodies [14].

2. Methodology

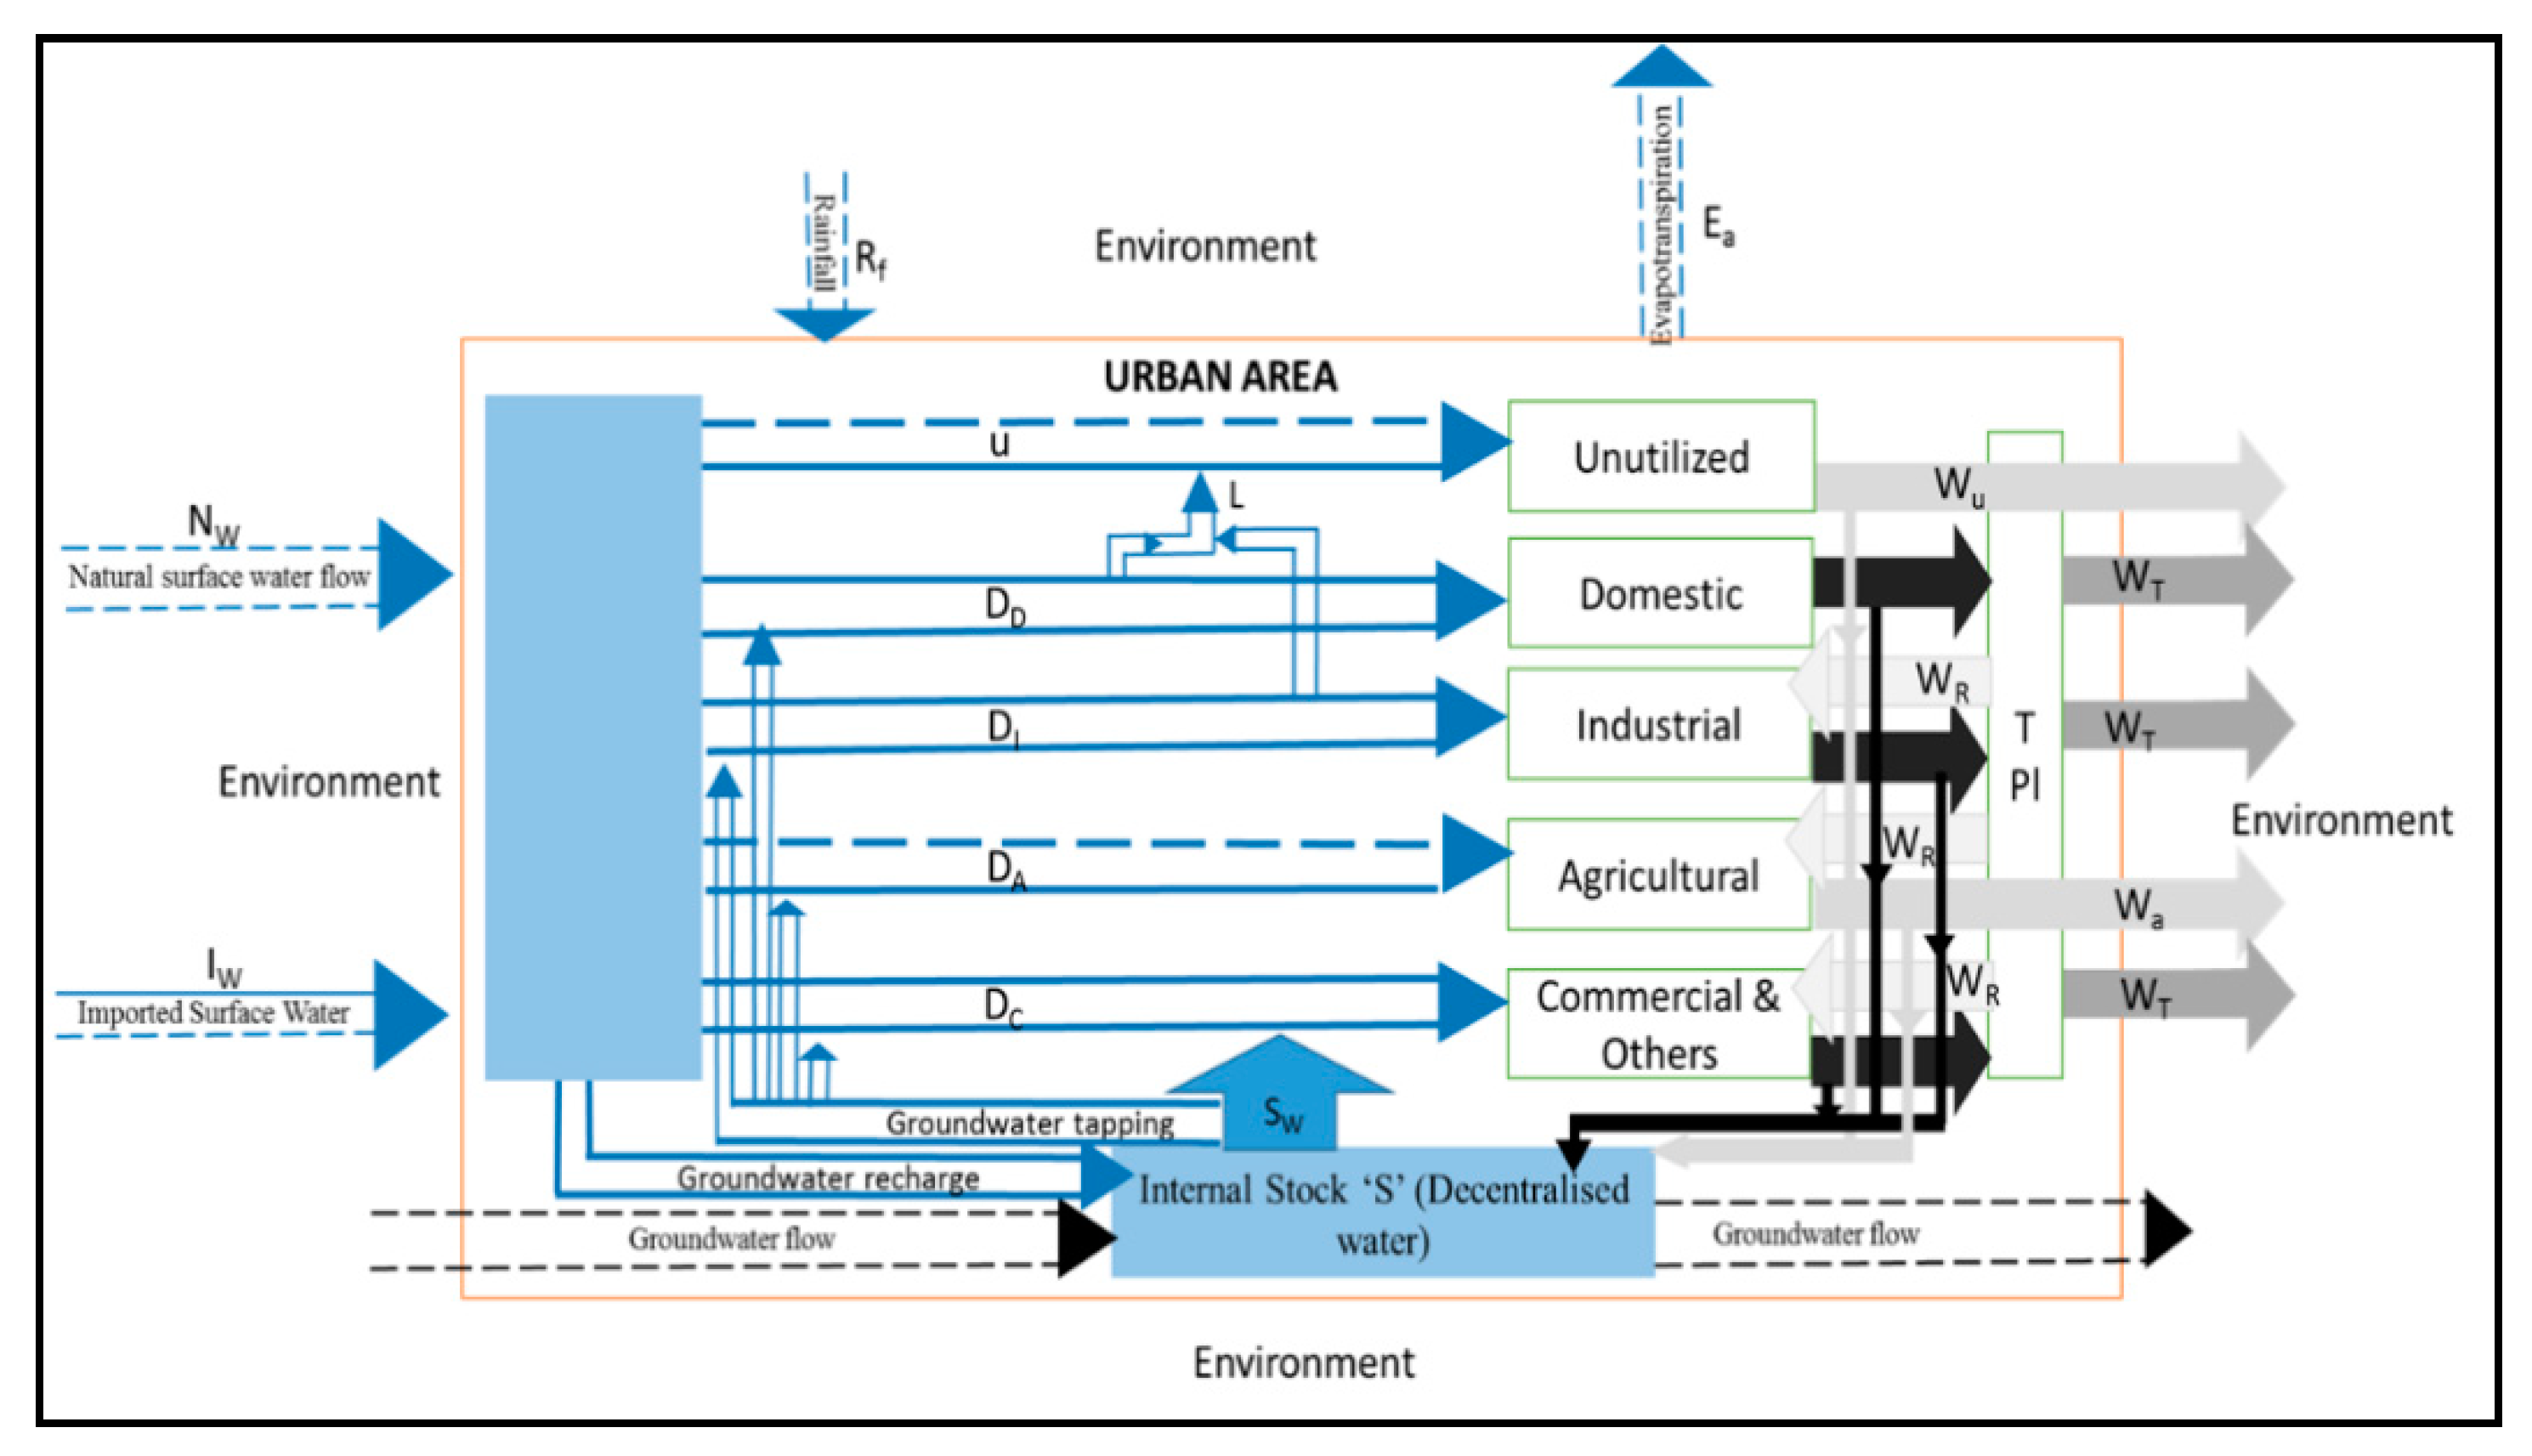
2.1. Water Metabolism in Delhi—Modeling the Flows

Water flows into an urban area are split up, divided, and redirected to different end-use processes (Figure 2). The inflow fulfills the water demand from the households (DD) and the industrial sector (DI), and a part of it recharges groundwater aquifers and fills storage structures, thereby adding to the stocks of water in a city; while the remaining is unutilized (U) and leaves the city (the system boundary defined in Figure 2) in the form of surface runoff through natural or constructed drainage systems. This unutilized flow (U) therefore includes the Yamuna River water flowing through Delhi, the stormwater runoff, water losses in the distribution network, leakages from water pipelines, etc. Agricultural water demand (DA) is met through natural flows and using structures such as tube wells and canals, whereas DD and DI are met mainly through infrastructure built for the purpose, as the water quality has to be modified prior to supply for these end-uses. There are some other minor flows of water to commercial establishments in the city and for other public uses (DC), which are also met through dedicated infrastructure. Changes in the stocks of water (S) are influenced by the balance between (a) the inflow of water through natural sources (Nw) such as rainfall, river, and imported water (Iw) from faraway places (through interstate agreements) and (b) the outflow of water in the form of wastewater (WT), unutilized flow (WU), and evapotranspiration (Ea). The stock of water (in other words, water available within the boundaries of the city, including both ground water and open water bodies/ponds) in an urban area can be categorized into groundwater, ponds, and anthropogenic storage structures (reservoirs and tanks), and this is augmented through rainwater harvesting, diverting, or stopping the flows that would otherwise exit the city as unutilized outflows, and infiltration of water into the soil to recharge the groundwater resources. The stock also contributes to urban water flows internally as decentralized supplies. In addition, a small part of water is recycled or reused (WR) in industries, agriculture, and other sectors, which helps reduce water flux.

2.2. Calculating Water Demand—Data Gathering for the Model

Domestic water demand is estimated using a primary survey [16]. Industries draw water from the Delhi Jal Board (DJB), from private tankers, and from privately owned groundwater sources. Due to multiple sources of water supply, reliable estimates of water used by industries are not available. For estimating industrial water demand, the following approaches were used.
  • Estimation of water demand from the consent-to-operate applications submitted by industries to the Delhi Pollution Control Committee (DPCC, a statutory environmental agency in Delhi).
  • Assessment of water use through primary surveys in a sample of industries and extrapolating the data.
  • Assessment from wastewater flows received by the Common Effluent Treatment Plants (CETPs).
Water requirements at Thermal Power Plants (TPPs) are estimated separately, using data obtained from Central Electricity Authority [17] and Federation of Indian Chambers of Commerce [18]. Data on water demand from commercial areas and miscellaneous areas (Dc- parks, defense services areas, municipal, or public areas such as railway stations, railway yards, and bus terminals) were collected from DJB. The water demand for agriculture (DA) was calculated as the product of the cropping intensity (calculated as the percentage of gross cropped area to net sown area, i.e., number of times crops are raised in the same field during a year) with the water use intensity of different crops [9]. Discussions with farmers during the survey conducted in 2014/15 in this study revealed that farmers grow vegetables during the fallow period between the main crops. The cropping intensity in Delhi is approximately 148%. Water needs of the forestland and natural vegetation are met through precipitation, whereas parks and green belt areas are irrigated using treated sewage or through water tankers supplied by DJB.
It has to be mentioned at this juncture that data gathering for this article was a challenging exercise and for the data elements which have been fed into the model, to calculate the output metrics/indicators, recourse has been taken to time-averaged values, or extrapolations from the available historical data or collection of primary data. In this context, the researchers have succeeded in tiding over the obstacles to data access.

2.3. Water Supply Sources

Potential supply of fresh water was estimated for surface water (including water sourced from faraway sources as imports) and groundwater sources. The waters of the river Ganga flow from the Upper Ganga Canal through a pipeline and hence evaporation losses are negligible. Evaporation and other losses from open canal are assessed as 30% (personal interaction, Department of Irrigation, Govt. of Haryana). Groundwater recharge potential of the city is estimated using rounded-off average of the past 50 years of rainfall and pan evaporation data (refer Table 1) and the methodology used by [19]. The total annual rain-fed groundwater recharge is calculated by multiplying the area with its recharge potential. Deeper underground and lateral flows from external sources are excluded due to non-availability of data.

2.4. Urban Hydrological Performance Indicators

2.4.1. Water Use Intensity (WUI)

WUI, measured in MCM/square kilometers/year, helps in comparing cities for their water use efficiency, water infrastructure, and water sustainable urban design. It is estimated as shown below, in Equation (1).
W U I = D D + D A + D I + D C A
In Equation (1), DD, DA, DI, and DC are the quantities of water supplied for domestic, industrial, agriculture, and commercial purposes, respectively, and A is the surface area of the city in square kilometers. Water demand includes real demand, water supply includes both centralized and decentralized supply, and water lost includes distribution losses like leakages.

2.4.2. Overall Water Balance (OWB)

OWB, expressed as a percentage, provides information about losses from planned water infrastructure. It is the ratio, expressed as a percentage, of total inflow to total outflow, estimated using Equation (2).
O W B = [ R f + S w + ( I w + N w L o s s e s   i n   I w   a n d   N w   ) W U + W T + W a ] × 100
In Equation (2), Rf is total annual precipitation and Sw is water inflow from stock. Iw and Nw are the imported water and natural water flows, respectively, which are diverted for urban use. Together, these constitute the centralized urban flow Cw, WU is unutilized water, WT is wastewater, which may be treated or untreated, and Wa is runoff from agriculture.

2.4.3. Supply Centralization (SC)

SC, expressed as a percentage, which measures the dependency of urban water demand on centralized public infrastructure, is estimated using Equation (3). Lower the value of SC, greater is the decentralized nature of the water supply, which implies a greater reliance on groundwater in the private water market. Cw and Sw, as already defined, are the centralized urban flow and the water inflow from stock, respectively.
S C = C w C w + S w × 100

2.4.4. Rainfall Harvesting (RH)

RH (in %) is the theoretical value representing the percentage of decentralized supply accounted for the total rainfall, if harvested fully, is estimated using Equation (4). Sw and Rf have already been defined earlier.
R H = S w R f × 100

2.4.5. Centralized Rainfall Supply Replaceability (CSR)

CSR (measured as a percentage) is the percentage of centralized supply that can be replaced by rainfall is estimated using Equation (5). Cw and Rf have already been defined earlier.
C S R = R f C w × 100

2.4.6. Total Rainfall Use Substitutability (TUR)

TUR is the percentage of total urban water needs that can be met by rainfall, is estimated using Equation (6). Cw, Sw, and Rf have already been defined earlier.
T U R = R f C w + S w × 100

2.4.7. Wastewater Potential for Water Supply (TURw)

TURw—as a percentage—gives the potential of wastewater flowing through built infrastructure to meet urban water demand, and is estimated using Equation (7). WT, defined earlier, is treated or untreated wastewater.
T U R w = W T C w + S w × 100

2.4.8. Turnover Rate

Turnover rate (as a percentage) is the reciprocal of residence time of water within a system. A higher turnover rate means a lower residence time of water and an indication that the urban area is moving away from sustainability instead of towards it. The turnover rate can be measured as three different variants: Overall turnover rate (OTR), Anthropogenic turnover rate (ATR), and Rainfall turnover rate (RTR). OTR estimates the residence time of water in a city, ATR has implications for the water quality of the region (the longer the turnover time, the greater the pollution, unless treated before discharge), and RTR measures the efficiency of stormwater management and probability of urban flooding. These are estimated using Equations (8)–(10), respectively. Most of the parameters have already been defined earlier. ‘S’ in the three equations, is the stock of water.
O T R = ( I w + N w L o s s e s   i n   I w   a n d   N w   ) +   S w + R f S
A T R = ( I w + N w L o s s e s   i n   I w   a n d   N w   ) +   S w S
R T R = R f S

2.4.9. Water Budget

The water budget—in MCM per year—indicates changes in water reserves of a city, is estimated using Equation (11). In Equation (11), ∆S is the change in the stock of water in MCM a year and EaU is the evaporation loss from urban surface flows.
R f + N w + I w ( L o s s e s   i n   I w   a n d   N w   )   = W T + W u + E a + E a U +   W a ± Δ S

3. Results and Discussion

3.1. Water Demand in Delhi

Calculated using a per capita daily water requirement of 76 liters (lpcd or liters per capita per day) [16], for a total water-consuming population of 16.78 million, the ‘real domestic water demand’ is estimated at 465.7 MCM a year. Nearly 18% of this demand is met by decentralized groundwater by individual households, ~9% is met through groundwater stock harnessed by the Delhi Jal Board, for centralized supply, another 4% is through groundwater extracted by suppliers in the private water market, and the rest is met through surface water sources through centralized supply. The share of groundwater in total domestic demand is therefore estimated at 144.5 MCM a year, of which, approximately 102.4 MCM a year is from decentralized sources.
The industrial water demand (excluding TPPs) in Delhi is 23.7 MCM a year. From the sample survey of the industries conducted in this study, ~32% of this demand is met through decentralized groundwater sources. Specific water consumption of TPPs is 21.4 MCM a year, nearly 35% of which is met through treated sewage and the remaining by diverting flow through barrages on the Yamuna. Total wastewater (cooling water which is warmed up within the plants) released by the TPPs is 1.4 MCM a year. Based on the discussions with farmers carried out in this study, it was assumed that 40% of this demand is met through groundwater, 20% through treated sewage, and the rest through canals or surface water irrigation. The Government of Delhi reports that commercial water consumption is 52.9 MCM a year [9]. Miscellaneous water demand—totaling 61.7 MCM a year—includes parks, defense services areas, and other municipal areas. A survey carried out as part of this study revealed indiscriminate use of tube wells to draw groundwater up to the surface, by individual entities. The share of the households in the decentralized withdrawal of groundwater was found to be 18%, and the same figure was assumed for commercial demand.
The current annual water needs of Delhi are estimated at ~1017.7 MCM (see Table 2). The water requirements, as estimated by the DJB, are 1891 MCM a year [9]. There is thus a huge disparity between the two estimates, the estimate of the authors of this paper being only about 54% of the DJB estimate. No information is available about the estimation method used by the DJB. Some plausible reasons for the disparity are as follows.
(a)
Domestic water requirement constitutes nearly 74% of the total. The DJB’s norm for estimating the domestic requirements is 172 lpcd [9], whereas the real demand is estimated as 76 lpcd, on the basis of the current lifestyles of, and the use of water-related appliances by the residents of Delhi [16].
(b)
The estimate of industrial water demand is fraught with uncertainties. The industrial profile of Delhi has changed significantly over the past decade, and it is not clear whether the DJB has considered these changes.
Considering that under the best-case scenario, water distribution losses should be no more than 15%; the annual water demand is estimated at 694.7 MCM or 119 lpcd (only urban demand, excluding demand for agriculture and TPPs). The DJB currently supplies 1393.2 MCM a year (they use a normative value of 270 lpcd for water supply infrastructure design, to account for the leakages). In addition, the annual shares of decentralized groundwater in urban supplies are as follows: 102.4 MCM for the domestic sector, 7.6 MCM for the industrial sector, and 20.5 MCM for commercial and other uses. Therefore, the total annual water supply for urban uses is ~1524 MCM. Hence, it can be considered that approximately 829 MCM is lost annually in the form of distribution losses and leakage or wastage at the consumer level. This lost water contributes to the unutilized flows. The estimates worked out in this paper are consistent with the popular perception of huge water losses in Delhi.

3.2. Water Supply Potential

It is estimated that, on average, 364.1 MCM of water is lost (is unused) annually as surface runoff, of which, 273 MCM occurs during the monsoon for want of storage capacity [15]. Therefore, the total water available from the Yamuna is approximately 183 MCM a year (547 MCM, as given in Figure 3, minus 364.1 MCM). Of this, substantial quantities (~30%) are lost through evaporation, infiltration, and other ways, accounting for ~55 MCM a year. Thus, the actual water available from the Yamuna is approximately 128 MCM a year. Delhi imports water from the Upper Ganga Canal through a pipeline (343 MCM a year). Of late, Delhi has been receiving 361 MCM of water per year from Bhakra through an open canal, which joins the Western Yamuna Canal; considering evaporation and other losses at 30%, this figure is reduced to 253 MCM a year. The actual water available from all these sources (surface water) is thus approximately 72 MCM a year (128 plus 343 plus 253).
Table 3 shows 182 mm as the balance of useable rainfall in a year that can be absorbed by an aquifer or is lost through runoff, with the month of August contributing well over 50% of this, and July registering the greatest loss in terms of evaporation. With an infiltration potential of 50%, one gets a recharge potential of 91 mm a year. Of the total area of Delhi, as referred to earlier, ~75% is urban (Figure 1). Again, simple wetting (less than 2.5 mm a day) will not contribute to this source. Of the 452 mm received in the monsoon, excluding evaporation and line losses, a maximum of 315 mm may be recovered. Total water harvesting can thus add ~40 mm a year to groundwater recharge. A large fraction of this water is imported from other river basins. The total annual rain-fed groundwater recharge is estimated at 194.3 MCM (surface area of 1483 km2 × 131 mm).

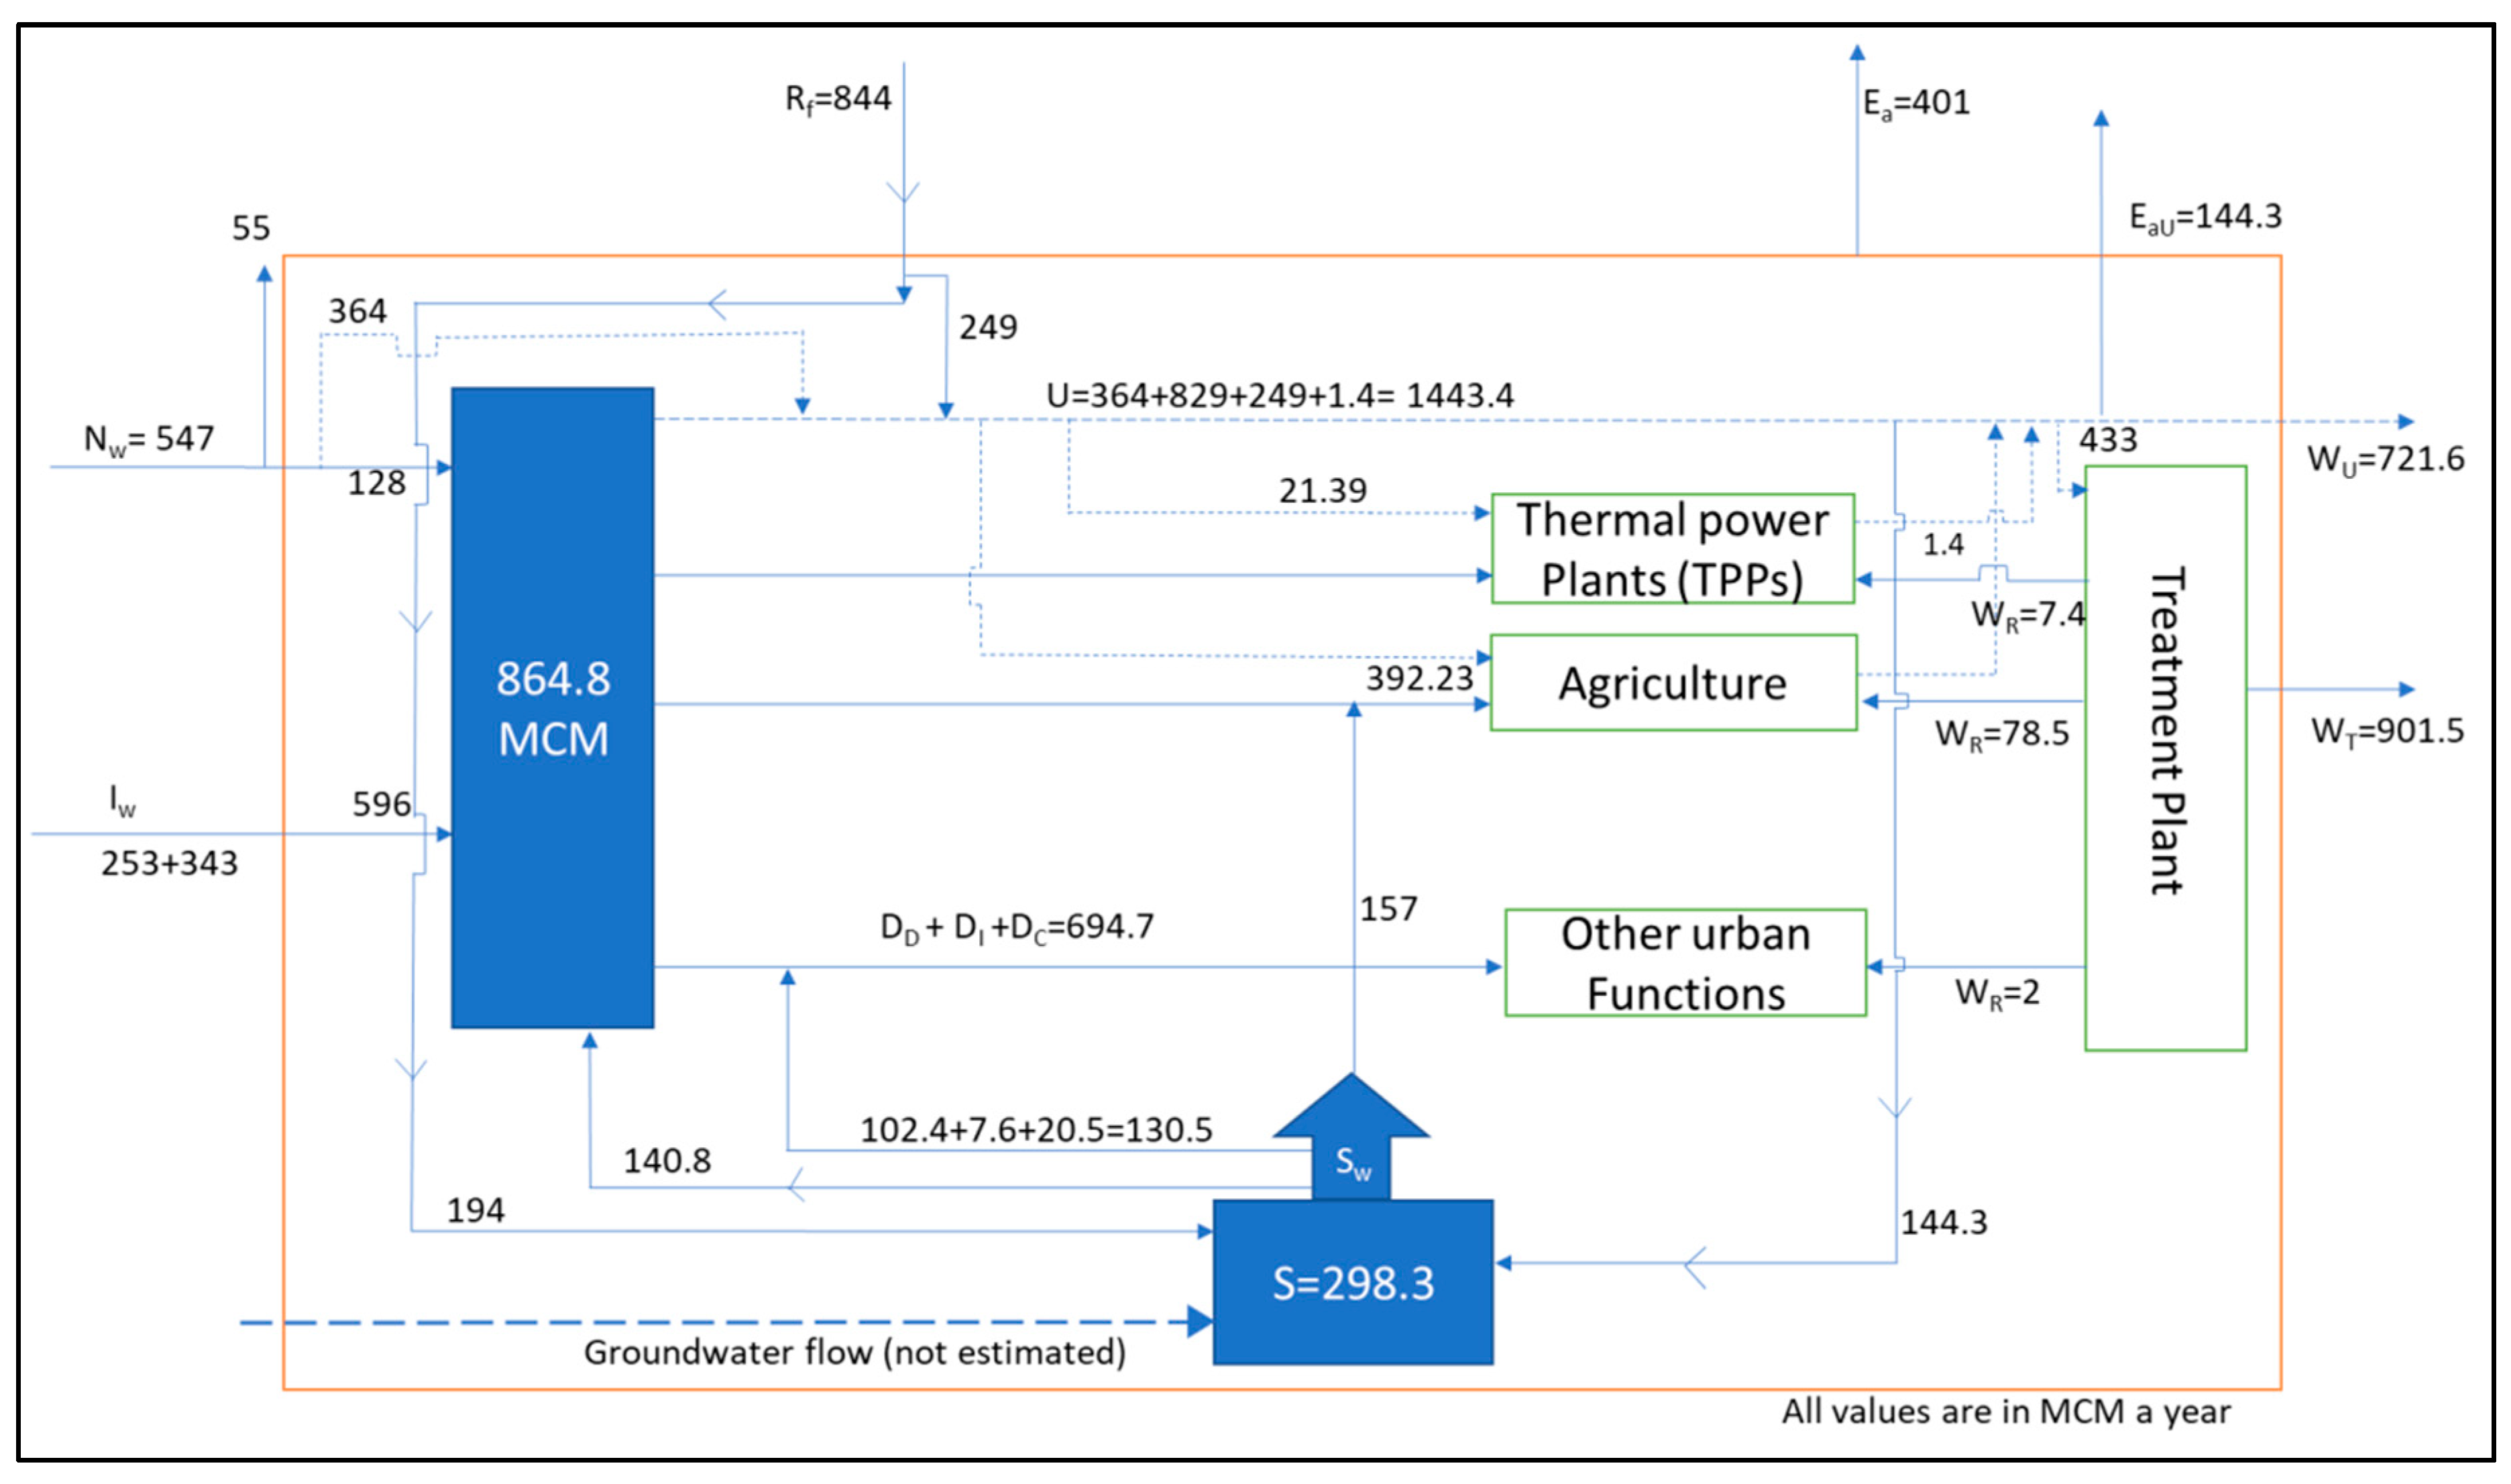
3.3. Water and Wastewater Flows Through the City

Figure 3 shows the water flows in the metabolism model constructed for this study. After accounting for losses, the net centralized flow (Cw) is 864.8 MCM a year (128 MCM a year as net Nw, 596 MCM a year as net Iw, and 140.8 MCM a year from groundwater extracted by the DJB), 16% of which is accounted for by groundwater.
Rf brings 844 MCM to Delhi, which is uniformly distributed throughout the city. Of this, 401 MCM is lost annually through Ea, approximately 194 MCM goes into groundwater recharge, and the remaining 249 MCM is a constituent of WU. A part of Rf may be used in agriculture, though the volume would be relatively negligible.
The total annual decentralized flow is 287.5 MCM a year, 130.5 MCM a year of which meets the urban end-uses, while the remaining 157 MCM a year caters to the agricultural sector in rural Delhi. Adding 140.8 MCM a year extracted by DJB for centralized supply, Sw is therefore estimated at 428.3 MCM/year, a value which is ~10% greater than the reported value of 390 MCM/year [14]. Annual stock of surface water in Delhi is estimated by assuming that the depth of surface water is 30 cm and the area of surface water bodies is 27.72 km2 (which is 8.3 MCM), and the annual groundwater is taken from CGWB assessment as 290 MCM [14]. Therefore, total stock (S) of surface and ground water is 298.3 MCM a year.
The net flow of water for urban functions is 694.7 MCM a year. In addition, TPPs and agriculture require 21.4 MCM and 392.2 MCM per year, respectively. Therefore, the total annual water demand for all the sectors in Delhi is 1108.3 MCM. Nearly, 42% of this demand stems from the domestic sector.
WU in Delhi is 1443.4 MCM a year: 364 MCM from Nw, 249 MCM from Rf, 1.4 from TPPs, and 829 MCM from distribution losses and wastage. Much of this flow is through unlined open drains. Approximately 10% (144.3 MCM a year) of this WU is assumed to recharge groundwater [20], another 10% is lost through EaU, 30% (~433 MCM a year) mixes with sewage going into the wastewater treatment plants, and the remaining 721.6 MCM leaves the city as unutilized water. Of the total water used for urban end-uses, 80% comes out as WT. This, when added to the diverted WU of 433 MCM (30% of total WU) brings the value of total WT (load on the wastewater treatment plants) to 989.4 MCM a year. Of the volume of wastewater treated annually, 7.4 MCM is used in TPPs as cooling water, 78.5 MCM in agriculture for ‘irrigation’, and ~2 MCM in public parks (irrigation) and other commercial areas (cleaning, etc.). WR in domestic and industrial sectors is negligible. Total WR is thus estimated to be ~87.9 MCM a year; which implies that 901.5 MCM flows back to the hydrosphere every year.

3.4. Hydrological Performance

Hydrological performance indicators for Delhi are summarized in Table 4. WUI of Delhi is about 2.5 times greater than those of Australian cities [8]. One of the reasons for the high WUI in Delhi could be the inclusion of rural areas (where agriculture is a big end-use sector) in the model. Since water demand for agriculture is just 38% of the total water demand of the region, it means that a significant amount of water is wasted in the form of leakage in water supply infrastructure and as runoff (given the absence of water storage structures).
The share of the centralized water supply is ~67%, which is low and points to the existence of a private water market. If one accounts for the 20% water losses in the form of infiltration and evaporation [20] the OWB should be at the most 120%. In Delhi, this is 136.7%, indicating that water inflows add to the existing stock of water.
Delhi is a net water deficit region because even under the best-case scenario, Rf can meet only 65.3% of Delhi’s current water needs (based on TUR) and can replace ~50.7% of the decentralized and 97% of the centralized supply. Therefore, water demand of the city far exceeds the natural water resources it has been endowed with. The supply from river Yamuna therefore must be augmented at all costs. Due to the lack of rainwater harvesting facilities in the city, Rf is not able to attain its potential value of 65% (TUR). The key to sustainable water supply for Delhi then, is the utilization of WT (use potential is 78.2%). If we consider the potential of rainfall utilization coupled with strategies that reduce water losses in the system and realistic domestic water supply norms, Delhi has the potential to be a net water exporter in the short term, and to evolve over time to become a water sustainable city.
The OTR is 7.91, which means that water remains in the city for ~46 days before it leaves the system. We do not have similar data for other regions to judge whether the residence time for Delhi is high or low. The ATR for Delhi is 5.08, which validated by presence of pollution in its water bodies [14,21]. Delhi’s RTR is 2.83 times a year, which reflects on the poor stormwater management and presence of frequent urban flooding.

3.5. Towards Water Sustainability

The urban metabolism model when applied to study water and wastewater flows into, within and out of a city, provides a sound conceptual entry point to understand the water-related challenges faced by the city [22]. However, the indicators derived are at a macrolevel, and the inferences drawn from them can lead to some flawed conclusions if they are not interpreted judiciously. If the rapid increase in Delhi’s population over the last few decades and the city’s indiscriminate spatial sprawl are superimposed over the metabolic water balance, the hydrological performance indicators will tell a different story. The share of imported water in the centralized supply is more than 50%. The sources of this water are a few hundred kilometers from the city boundaries. On one hand, the imports reflect the linear approach and continued augmentation of water resources from outside the city limits; on the other hand, the imports also indicate the pressure to meet the growing demands of a growing population. The population of Delhi has increased nearly tenfold over the last five decades (at an average annual rate of 4.7%). Water supply capacity has increased by a factor of 23 over the same period, and yet a significant population is without access to treated and piped water supply and sanitation facilities [23]. However it must be noted here that the increase in demand for water has been not just from households, which have burgeoned over time, but also commercial and industrial end-users. An alarming negative fallout has been the increase in the depth to the groundwater table. The stage of groundwater development is 137% [14], which is critical. Such a situation makes Delhi highly vulnerable and increases its water insecurity.
Exploring resources within the city is essential if Delhi is to become independent of such uncertainties and augment its future supplies sustainably. This is possible if the following is achieved.
  • Wastewater can be looked upon as a water resource, which can be utilized after proper treatment (as advocated by Alves [24] for Portugal and Opher [25] & Opher [26] for Israel)—it can meet 78.2% of the total needs. The use of groundwater can be discontinued altogether if even half the potential of wastewater is tapped.
  • Stormwater has the potential to reduce the decentralized use of groundwater, if rainwater harvesting and artificial ponds can be created, and if water-permeable surfaces can be incorporated into the cityscape.

3.6. Summarizing the Results and Observations Made

The total annual water inflow in Delhi is 2095 MCM whereas the discharge is about 1621 MCM (excluding evaporation and transpiration). Delhi’s own renewable stock of surface water and groundwater is 338.2 MCM. Nearly 50% of the water flowing through the system remains unutilized: 364 MCM a year as stormwater (mostly during the monsoon months) and 545 MCM a year as evaporation. The remaining inflow is utilized only once, except for 7.38, 78.5, and 2 MCM of cascaded water used by TPPs, agriculture, and public uses, respectively. Some other minor reuses of water—treated sewage to irrigate city parks and the surrounding farms—have not been quantified in this model. Annual WT flow from the city is 901.5 MCM, to which industry contributes approximately 19 MCM and TPPs 3.3 MCM. The residence time of water in the city is 46 days and the ATR is 5 times a year.
Real urban water demand is assessed at 694.7 MCM a year (equivalent to 119 lpcd). This includes reasonable water losses of 15%. The normative value of 270 lpcd, as used by the DJB, is therefore excessive in today’s context, which leads to inefficient use of water. The WUI of Delhi is high and the share of centralized supply in the total water supply is only 66.9%, which points to the existence of a private water market and lack of regulatory control over private groundwater abstraction. Total annual groundwater recharge by rain and urban infiltration is 338.3 MCM, and groundwater withdrawal is 428.3 MCM a year. This explains the decline in the water table beneath the surface in Delhi.
The current population of Delhi is 10 times that in 1951. One may think of some ‘could-have-been’ factors, which may have enabled the city to trim down its water consumption. There are other factors which other factors may have helped the city in managing its water resources in a better way:
  • Decreasing the area under tillage
  • Focus on less water-intensive crops
  • Restructuring of the industry base over the last decade and a half, in favor of industries with smaller water footprints
  • Early changes in lifestyle habits and better control over the use of water using white goods like washing machines and dishwashers
Unfortunately, these possibilities, which went begging, have not been acknowledged by the local governments that have been. The inefficiencies of the urban water infrastructure have never been given adequate attention. Consumer habits and lifestyles, have over the years, expanded the trans-boundary water footprint of the city, courtesy the rise in imports of ‘embedded water’ in its less visible forms like food, industrial goods, and electricity from outside the city boundaries. It is noteworthy that almost half of household expenses in the city are for food and electricity.
One of the hidden benefits of urbanization (rise in demand from households which have a lower WUI), at the expense of farmlands and water-intensive agricultural activities, is that the rise in water demand can be controlled. This is offset (or more than offset in some cases), by the fact that a growth in built-up areas (which reduces the average permeability of land surfaces) implies lesser recharge of the groundwater, augmenting the surface runoff and the nonutilized water flow. It follows that the city’s water stock will decrease over time, making it more vulnerable to fluctuations in water availability and less resilient to changes in the future.

4. Conclusions and Recommendations

The authors, by availing of an urban metabolism model to study the water and wastewater flows [22] into, within, and out of Delhi, have successfully documented the status quo, identified the ‘hotspots’ which need to be addressed by a combination of top-down policy-making and bottom-up demand side management, derived performance indicators and suggested approaches which could be adopted to transit slowly but surely and steadily to more durable water sustainability. This promises to be of practical significance to decision-makers in the Indian capital, who have been availing of conventional water balance models hitherto. The absence of a comprehensive outlook has jeopardized water security in Delhi, and hindered effective water management, as observed in the previous subsection. The urban water metabolism approach explained by [27] has been modeled in this study applied to Delhi, to present the status quo in a refined manner and motivate the planning of interventions is what the authors posit as a novelty of this paper and a key contribution to the sphere of applications of metabolism models in general.
The questions that the authors posed at the beginning of the paper have been answered, thanks to the aforesaid model, the availability of data from a plethora of sources and the indicators, which helped the authors to quantify the status quo, for the sake of possible comparison with other cities in the world. A brief summary of the results and the insights gathered therefrom has been presented in the following paragraphs. On the basis of this understanding of the ‘what-is’ and ‘what-can-be’, the interventions can be analyzed from a sustainability perspective using industrial ecology tools like E-LCA, LCC and S-LCA (as has been done for instance, for Israel, by [25,26]
The key takeaway message from this paper is that megacities have the potential to supply water to other regions in the short term, and set examples for them to follow, as water sustainable regions. This paper, using the metabolism approach for a chosen case city, has emphasized on the need for a conscious diversification of water sources (by factoring in more of the wastewater and the stormwater) and also effective demand side management, whereby water must be used more wisely. There is an urgent need thereby to improve the rate of infiltration of stormwater and reduce the rate of runoff, by increasing the share of permeable surfaces in the city (permeable paving for instance), as well as consider the wastewater streams as potential sources of water [28] (Angelakis and Synder 2015), while not forgetting demand side management measures, as the pressure on the urban water system in the city is likely to intensify with a combination of population growth, economic development, and climate change in the near future. Furthermore, real water demand of megacities should be assessed periodically in more realistic terms than using historical normative values for design of urban water infrastructure.

Author Contributions

The research article has contribution from all the mentioned authors. The research conceptualization and the methodology have been developed jointly by all authors. The models used by R.G. were supervised by A.K. and G.V. The validation of the results has been done jointly by all authors. The data collection and field work in this research work has been carried out by R.G., with resources support from A.K. R.G. and A.K. did data curation. Writing of the original draft of the research paper has been done jointly by all authors. The project administration and funding acquisition support was given by A.K.

Funding

This research was funded by ENEL FOUNDATION through sub-contract between University of TORONTO, Canada and TERI-SAS, India with grant number #495312.

Acknowledgments

We thank the Enel Foundation and University of Toronto for financial support. We are thankful to the graduate students of TERI-SAS for their support in conducting field surveys, interviews, and data collection. We also extend our sincere gratitude to Yateendra Joshi for copy-editing the manuscript.

Conflicts of Interest

The authors declare no conflict of interest. The funders had no role in the design of the study; in the collection, analyses, or interpretation of data; in the writing of the manuscript, or in the decision to publish the results.

References

  1. Andries, J.M.; Jansen, M.A.; Ostrom, E. A framework to analyse the robustness of social-ecological systems from an institutional perspective. Ecol. Soc. 2004, 9, 18. Available online: http://www.ecologyandsociety.org/vol9/iss1/art18/ (accessed on 11 June 2016). [CrossRef]
  2. Purkey, D.R.; Huber-Lee, A.; Yates, D.N.; Hanemann, M.; Herrod-Julius, S. Integrating a climate change assessment tool into stakeholder-driven water management decision-making processes in California. Water Resour. Manag. 2006, 21, 315–329. [Google Scholar] [CrossRef]
  3. Wong, T.H.; Brown, R.R. The water sensitive city: Principles for practice. Water Sci. Technol. 2009, 60, 673–682. [Google Scholar] [CrossRef] [PubMed]
  4. Behzadian, K.; Kapelan, Z.; Venkatesh, G.; Brattebø, H.; Sægrov, S.; Rozos, E.; Makropoulos, C.; Ugarelli, R.; Milina, J.; Hem, L. Urban water system metabolism assessment using watermet2 model. Procedia Eng. 2014, 70, 113–122. [Google Scholar] [CrossRef]
  5. Venkatesh, G.; Helge, B.; Sveinung, S. Dynamic metabolism modeling of urban water services-demonstrating effectiveness as a decision-support tool for Oslo, Norway. Water Res. 2014, 61, 19–33. [Google Scholar] [CrossRef] [PubMed]
  6. Zappone, M.; Fiore, S.; Genon, G.; Venkatesh, G.; Brattebø, H.; Meucci, L. Life-cycle energy and GHG emission within the turin metropolitan area urban water cycle. Procedia Eng. 2014, 89, 1382–1389. [Google Scholar] [CrossRef]
  7. Wolman, A. The metabolism of cities. Sci. Am. 1965, 213, 179–190. [Google Scholar] [CrossRef] [PubMed]
  8. Kenway, S.; Gregory, A.; McMahon, J. Urban water mass balance analysis. J. Ind. Ecol. 2011, 15, 693–706. [Google Scholar] [CrossRef]
  9. Government of National Capital Territory of Delhi (GNCTD). Economic Survey of Delhi 2014–15; Directorate of Economics & Statistics, GNCTD: Delhi, India, 2015. Available online: http://delhi.gov.in/wps/wcm/connect/DoIT_Planning/planning/economic+survey+of+dehli/economic+survey+of+delhi+2014+-+2015 (accessed on 12 September 2016).
  10. Bhagat, R.B. Emerging pattern of urbanisation in India. Econ. Political Wkly. 2011, 34, 10–12. Available online: http://suburbin.hypotheses.org/files/2011/09/RBBhagatUrbanisation.pdf (accessed on 17 July 2016).
  11. Sharma, D.; Kansal, A. Water quality analysis of River Yamuna using water quality index in the national capital territory, India (2000–2009). Appl. Water Sci. 2011, 1, 147–157. [Google Scholar] [CrossRef] [Green Version]
  12. DDA. Master Plan of Delhi-2021; Delhi Development Authority: Delhi, India, 2010; Available online: http://dda.org.in/ddanew/pdf/Planning/reprint%20mpd2021.pdf (accessed on 22 March 2019).
  13. GNCTD. State of Environment Report for Delhi. Chapter 2, Water Supply; Department of Environment and Forests, Government of India: New Delhi, India, 2010. Available online: http://www.indiaenvironmentportal.org.in/files/SoEDelhi2010.pdf (accessed on 22 March 2019).
  14. Central Ground Water Board (CGWB). Dynamic Ground Water Resources of India (As on 31st March 2011); Ministry of Water Resources, River Development & Ganga Rejuvenation, Government of India: Faridabad, India, 2014. Available online: http://www.cgwb.gov.in/documents/Dynamic-GW-Resources-2011.pdf (accessed on 29 September 2016).
  15. Ministry of Urban Development (MoUD). Functional Plan on Drainage for National Capital Region; National Capital Region Planning Board Ministry of Urban Development, Government of India: New Delhi, India, 2016. Available online: http://ncrpb.nic.in/pdf_files/FP%20on%20Drainage/Chapter%203%20-%20HYDROMETEROLOGY.pdf (accessed on 20 August 2016).
  16. Ghosh, R.; Kansal, A.; Aghi, S. Implications of end-user behaviour in response to deficiencies in water supply for electricity consumption—A case study of Delhi. J. Hydrol. 2016, 536, 400–408. [Google Scholar] [CrossRef]
  17. Central Electricity Authority (CEA). Report on Minimisation of Water Requirement in Coal Based Thermal Power Stations; Central Electricity Authority: New Delhi, India, 2012. Available online: http://cea.nic.in/reports/others/thermal/tetd/min_of%20water_coal_power.pdf (accessed on 29 September 2016).
  18. FICCI. Water Use and Efficiency in Thermal Power Plants; Federation of Indian Chambers of Commerce & Industry and HSBC Knowledge Initiative Federation House: New Delhi, India, 2010; Available online: http://ficci.in/spdocument/20147/ficci-water-use.pdf (accessed on 29 September 2016).
  19. Soni, V. Water and carrying capacity of a city—Delhi. Econ. Political Wkly. 2003, 38, 4745–4749. [Google Scholar]
  20. Central Public Health and Environmental Engineering Organization (CPHEEO). Manual on Sewerage and Sewage Treatment, Part A: Engineering; Ministry of Urban Development, New Delhi in Collaboration with Japan International Cooperation Agency, Japan: India, 2012. Available online: http://www.cmamp.com/CP/FDocument/ManualonSewerageTreatment.pdf (accessed on 17 July 2016).
  21. Central Pollution Control (CPCB). Board Report 2007–2008; Status of Groundwater Quality in India Part–II; Central Pollution Control Board: Delhi, India, 2008; Available online: http://www.cpcb.nic.in/upload/NewItems/NewItem_50_notification.pdf (accessed on 17 July 2016).
  22. Ramos, G.C.D. Water and political ecology of urban metabolism: The case of Mexico city. J. Political Ecol. 2015, 22, 98–114. [Google Scholar] [CrossRef]
  23. Census of India 2011. Office of The Registrar General and Census Commissioner Government of India. Available online: http://www.censusindia.gov.in/2011census/population_enumeration.html (accessed on 17 July 2016).
  24. Alves, D.; Monte, H.M.D.; Albuquerque, A. Water Reuse Projects—Technical and Economic Sustainability; Official Publication of the European Water Association (EWA), E-Water: Portugal, 2011. [Google Scholar]
  25. Opher, T.; Shapira, A.; Friedler, E. A comparative social life cycle assessment of urban domestic water reuse alternatives. Int. J. Life Cycle Assess. 2017, 23, 1315–1330. [Google Scholar] [CrossRef]
  26. Opher, T.; Friedler, E.; Shapira, A. Comparative life cycle sustainability assessment of urban water reuse at various centralization scales. Int. J. Life Cycle Assess. 2018, 1–14. [Google Scholar] [CrossRef]
  27. Musango, J.K.; Currie, P.; Robinson, B. Urban Metabolism for Resource Efficient Cities: From Theory to Implementation; UN Environment: Paris, France, 2017. [Google Scholar]
  28. Angelakis, A.N.; Synder, S.A. Wastewater treatment and reuse: Past, present, and future. Water 2015, 7, 4887–4895. [Google Scholar] [CrossRef]
Figure 1. (a,b) Land use pattern in Delhi (1973–2013) (Source: Landsat image compilation).
Resources 08 00062 g001
Figure 2. Description of the water flows into, within, and out of the defined system boundary.
Resources 08 00062 g002
Figure 3. Urban water metabolism in Delhi.
Resources 08 00062 g003
Table 1. Precipitation and evaporation in Delhi (rounded-off average of past 50 years) (Ministry of Urban Development, [15]; India Meteorological Department’s website).
MonthJanFebMarAprMayJuneJulyAugSeptOctNovDecTotal
Rainfall (mm)14.913.18.96.712.044.017718193.57.84.95.0568.8
Rainy days1.210.80.50.82.17.47.94.00.80.10.427
Evaporation (mm/d)4.55.26.47.98.66.68.15.86.36.75.84.7
Table 2. Annual water needs of the city of Delhi.
SectorQuantity
(Million Cubic meters /year)
Remarks
Domestic (DD)465.7Based on sample survey. Real demand instead of water supplied.
Industrial (DI)23.7Modeled data. Inadequate and uncertain information about industrial units in Delhi.
Thermal power plants21.4Modeled data.
Agriculture (DA)392.2Modeled data.
Commercial and others (DC)114.6Reported value. Two-year-old data.
Total1017.6
Table 3. Rainfall and ‘potential rates’ of evaporation.
MonthRainfall (mm)Rainy Days (>2.5 mm)Potential Rate (cm/day)Evaporation Loss (mm)Balance (mm)
July17740.5711166
August 18150.418497
September9420.447519
Total45211 270182
Table 4. Hydrological performance indicators.
IndicatorsUnitsValues
Water use intensity (WUI)MCM/km2/year0.732
Overall water balance (OWB)%136.7
Supply centralization (SC)%66.9
Rainwater harvesting (RH)%50.7
Centralized rainfall supply replaceability (CSR)%97.6
Total rainfall use replaceability (TUR)%65.3
Wastewater potential for water supply (TURw)%78.2
Anthropogenic turnover rate (ATR)Number of times per year5.08
Rainfall turnover rate (RTR)Number of times per year2.83
Overall turnover rate (OTR)Number of times per year7.91
Change in stock (∆S)MCM/year−236

