Article

Devising Mineral Resource Supply Pathways to a Low-Carbon Electricity Generation by 2100

1
Mines ParisTech, Center for Applied Mathematics, PSL Research University, Rue Claude Daunesse, CS 10207, 06904 Sophia Antipolis Cedex, France
2
Bureau de Recherches Géologiques et Minières, avenue Claude Guillemin, 45060 Orléans, France
*
Author to whom correspondence should be addressed.
Resources 2019, 8(1), 33; https://doi.org/10.3390/resources8010033
Submission received: 1 November 2018 / Revised: 11 January 2019 / Accepted: 30 January 2019 / Published: 6 February 2019

Abstract

:
Achieving a “carbon neutral” world by 2100 or earlier in a context of economic growth implies a drastic and profound transformation of the way energy is supplied and consumed in our societies. In this paper, we use life-cycle inventories of electricity-generating technologies and an integrated assessment model (TIMES Integrated Assessment Model) to project the global raw material requirements in two scenarios: a second shared socioeconomic pathway baseline, and a 2 °C scenario by 2100. Material usage reported in the life-cycle inventories is distributed into three phases, namely construction, operation, and decommissioning. Material supply dynamics and the impact of the 2 °C warming limit are quantified for three raw fossil fuels and forty-eight metallic and nonmetallic mineral resources. Depending on the time horizon, graphite, sand, sulfur, borates, aluminum, chromium, nickel, silver, gold, rare earth elements or their substitutes could face a sharp increase in usage as a result of a massive installation of low-carbon technologies. Ignoring nonfuel resource availability and value in deep decarbonation, circular economy, or decoupling scenarios can potentially generate misleading, contradictory, or unachievable climate policies.

1. Introduction

According to the Intergovernmental Panel on Climate Change (IPCC), limiting global warming to 2 °C is possible on the condition of a drastic reduction in greenhouse gas emissions (GHGs) [1]. One of the most effective mitigation actions consists of reshaping the energy system with energy processes that produce fewer or negative CO2 emissions. Such a transformation requires energy and materials, which translates into tensions over natural assets—namely space (land, air, oceans) and material resources. Integrated assessment models (IAMs) are tools that explore the interactions between the environment and socioeconomic spheres. These tools produce scenarios that are used by policymakers to plan GHG mitigation actions while minimizing socioeconomic costs. Nonfuel mineral resources are typically not considered in IAMs [2,3], seemingly due to their apparent non-energy or non-GHG-related nature. However, nonfuel resources constitute every product in the technosphere. They are necessary to build new low-carbon infrastructures and technologies to maintain or improve living conditions while mitigating global warming. Raw materials are often exploited unsustainably and their processing chains can involve significant environmental impacts [4]. Thus, socioeconomic development, energy consumption, and environmental impacts are strongly related to resource usage.
Different approaches exist to project the future material requirements of specific regions, sectors, or technologies depending on an evolving environment. A common approach—focusing on material demand—is to combine data on material usage with development scenarios employing evolution-characteristic parameters such as population growth, monetary flows, energy produced, additional number of products, etc. [5,6,7,8,9,10,11,12,13,14,15]. Data on material usage might only include direct “consumption” by processes or material content in products. In this case, potentially large material requirements in the supply chain of a process can be omitted. To address this issue, some authors have used life-cycle inventory (LCI) data, which include indirect consumption generated by the upstream and downstream activities of processes [16,17]. In particular, this approach has been successfully demonstrated on low-carbon technologies to project the consumption of iron, aluminum, copper, and cement according to the International Energy Agency’s (IEA’s) decarbonation scenario (BLUE Map) [18] by 2050. However, a global bottom-up study covering the full mineral resource footprint of energy needs has never been made to our knowledge.
In order to investigate the consumption of all substances found in the life cycles of electricity-generating (EG) technologies, we introduced an original method [19] to combine life-cycle inventories (LCIs) with the electricity outputs of the TIMES integrated assessment model (TIAM-FR). This method used ecoinvent 3.3, one of the most complete process LCI databases. The growing number of datasets contained in ecoinvent result from life-cycle assessments (LCAs) performed by different authors in order to compare the environmental impacts of given activities and products. Each activity has its material and energy inputs and outputs reported. The calculation of an LCI gives a list of substances, the usage of which the activity is responsible for. Here, we take the same approach to assess the mineral resource use of EG technologies along two scenarios: a second shared socioeconomic pathway (SSP2) baseline [20] and a 2 °C target scenario. We set out to analyze and compare the dynamic material requirements of three groups of raw fossil fuels and forty-eight groups of mineral resources during the construction, operation, and decommissioning of each power plant in 15 world regions. We present three main types of result: First, we project the requirements of fossil fuels and metallic and nonmetallic mineral resources in both scenarios. Second, we analyze each substance individually, calculating its increasing or decreasing usage relative to the 2020 decade, as well as the decade-to-decade increase or decrease in its usage. Third, we calculate the ratio between the 2 °C and baseline scenarios for each time period, to quantify the relative difference of resource usage due to the 2 °C target. In particular, we focus on the five substances showing the highest values of each indicator, depending on the time period.
This prospective LCI approach to global electricity generation provides important insights into the link between decarbonation scenarios, climate targets and mineral resource requirement pathways.

2. Method

2.1. TIAM-FR Model

TIAM is a bottom-up optimization model pertaining to the TIMES family. It was developed by the Energy Technology Systems Analysis Program (ETSAP) group of the International Energy Agency (IEA) in order to provide global energy scenarios with emission mitigation targets. TIAM-FR is the version of TIAM developed at MINES ParisTech Center for Applied Mathematics. In each of the 15 world regions considered (see Supplementary Table S1 for a list of regions and their acronyms), TIAM-FR establishes a balance between a set of demand drivers (population, economic growth, energy, and service needs) and supply technologies (fuel, electricity, transportation, etc.) distributed in five sectors (agriculture, commercial, industry, residential, and transportation). 2010 is taken as a reference year for which the system’s state is entirely and exogenously defined. The 2010–2100 horizon is divided in 11 periods. An optimization algorithm minimizes the total net present value of the total annual cost, discounted at 5% to the selected reference year 2010. A full description of the TIAM model is available publicly [21,22]. Most technology costs and data are freely accessible from the ETSAP community’s website [23]. Some cost data were obtained from experts or manufacturers. Production, trade, consumption, and socioeconomic data were obtained from international institutions (e.g., FAO, World Bank, etc.). Energy data were purchased at IEA’s data services when they were not freely accessible. TIAM-FR has been previously used for global and regional analyses [24] and water consumption assessments [25], and was recently updated with a detailed bioenergy sector [26,27] including carbon capture and sequestration (CCS) technologies. Using TIAM-FR, we determine a baseline scenario that is comparable to a second shared socioeconomic pathway (SSP2) [20]. The assumptions regarding population and gross domestic product growth for each region were previously reported in the Supplementary Material of [19]. From the baseline scenario, a 2 °C scenario is obtained by setting a maximum global warming target of 2 °C by 2100 (with an overshoot tolerance of 0.1 °C). GHG emissions, total primary energy supply, and total final consumption are reported in the Supplementary Material of the present article. The SSP2 baseline scenario is in agreement with primary supply, final consumption, and GHG emissions found in the literature [28,29].

2.2. Linking Electricity Outputs with Life-Cycle Inventories

We compute material usage scenarios for EG technologies using a method previously described [19]. It is based on the combination of the TIAM-FR electric outputs and life-cycle inventories of EG technologies. Each of the 109 EG technologies in the TIAM-FR model is attributed a process-based LCI extracted from the ecoinvent 3.3 database. We deliberately choose not to use other sources of LCI datasets to keep the consistency provided by ecoinvent. Indeed, each life-cycle inventory in ecoinvent was built from elementary processes, which can be traced back through the entire processing chain. For the TIAM-FR technologies that are not represented in ecoinvent (e.g., marine and CCS technologies), we select alternative datasets in a close technological family. This approximation adds a layer of uncertainty; however, it allows us to cover all electricity generation. In the future, the increasing number of technologies analyzed in ecoinvent will help reduce the recourse to such approximations. Potential recycled materials are taken into account using ecoinvent’s "at the point of substitution" (APOS) system linking method. This method expands the technology’s system boundaries to include waste treatment activities. For all datasets, we separate infrastructure activities from transformation activities, which allows us to distinguish the material consumption during the construction, operation, and decommissioning phases. We allocate 90% of the infrastructure LCI to the construction phase and 10% to the decommissioning phase as described in [19]. The transformation LCI is allocated to the power plant operation phase. We study all raw fossil fuels and mineral resources that are extracted from the ground as defined in ecoinvent. Water, biomass, and non-energy gases are not considered in this study. The material use results are represented in 16 energy source categories: bioenergy, bioenergy with CCS, coal, coal with CCS, coal–bioenergy cofiring, coal–bioenergy cofiring with CCS, gas, gas with CCS, geothermal, hydro, marine, nuclear, oil, solar photovoltaics (PV), solar thermal, and wind.

3. Results

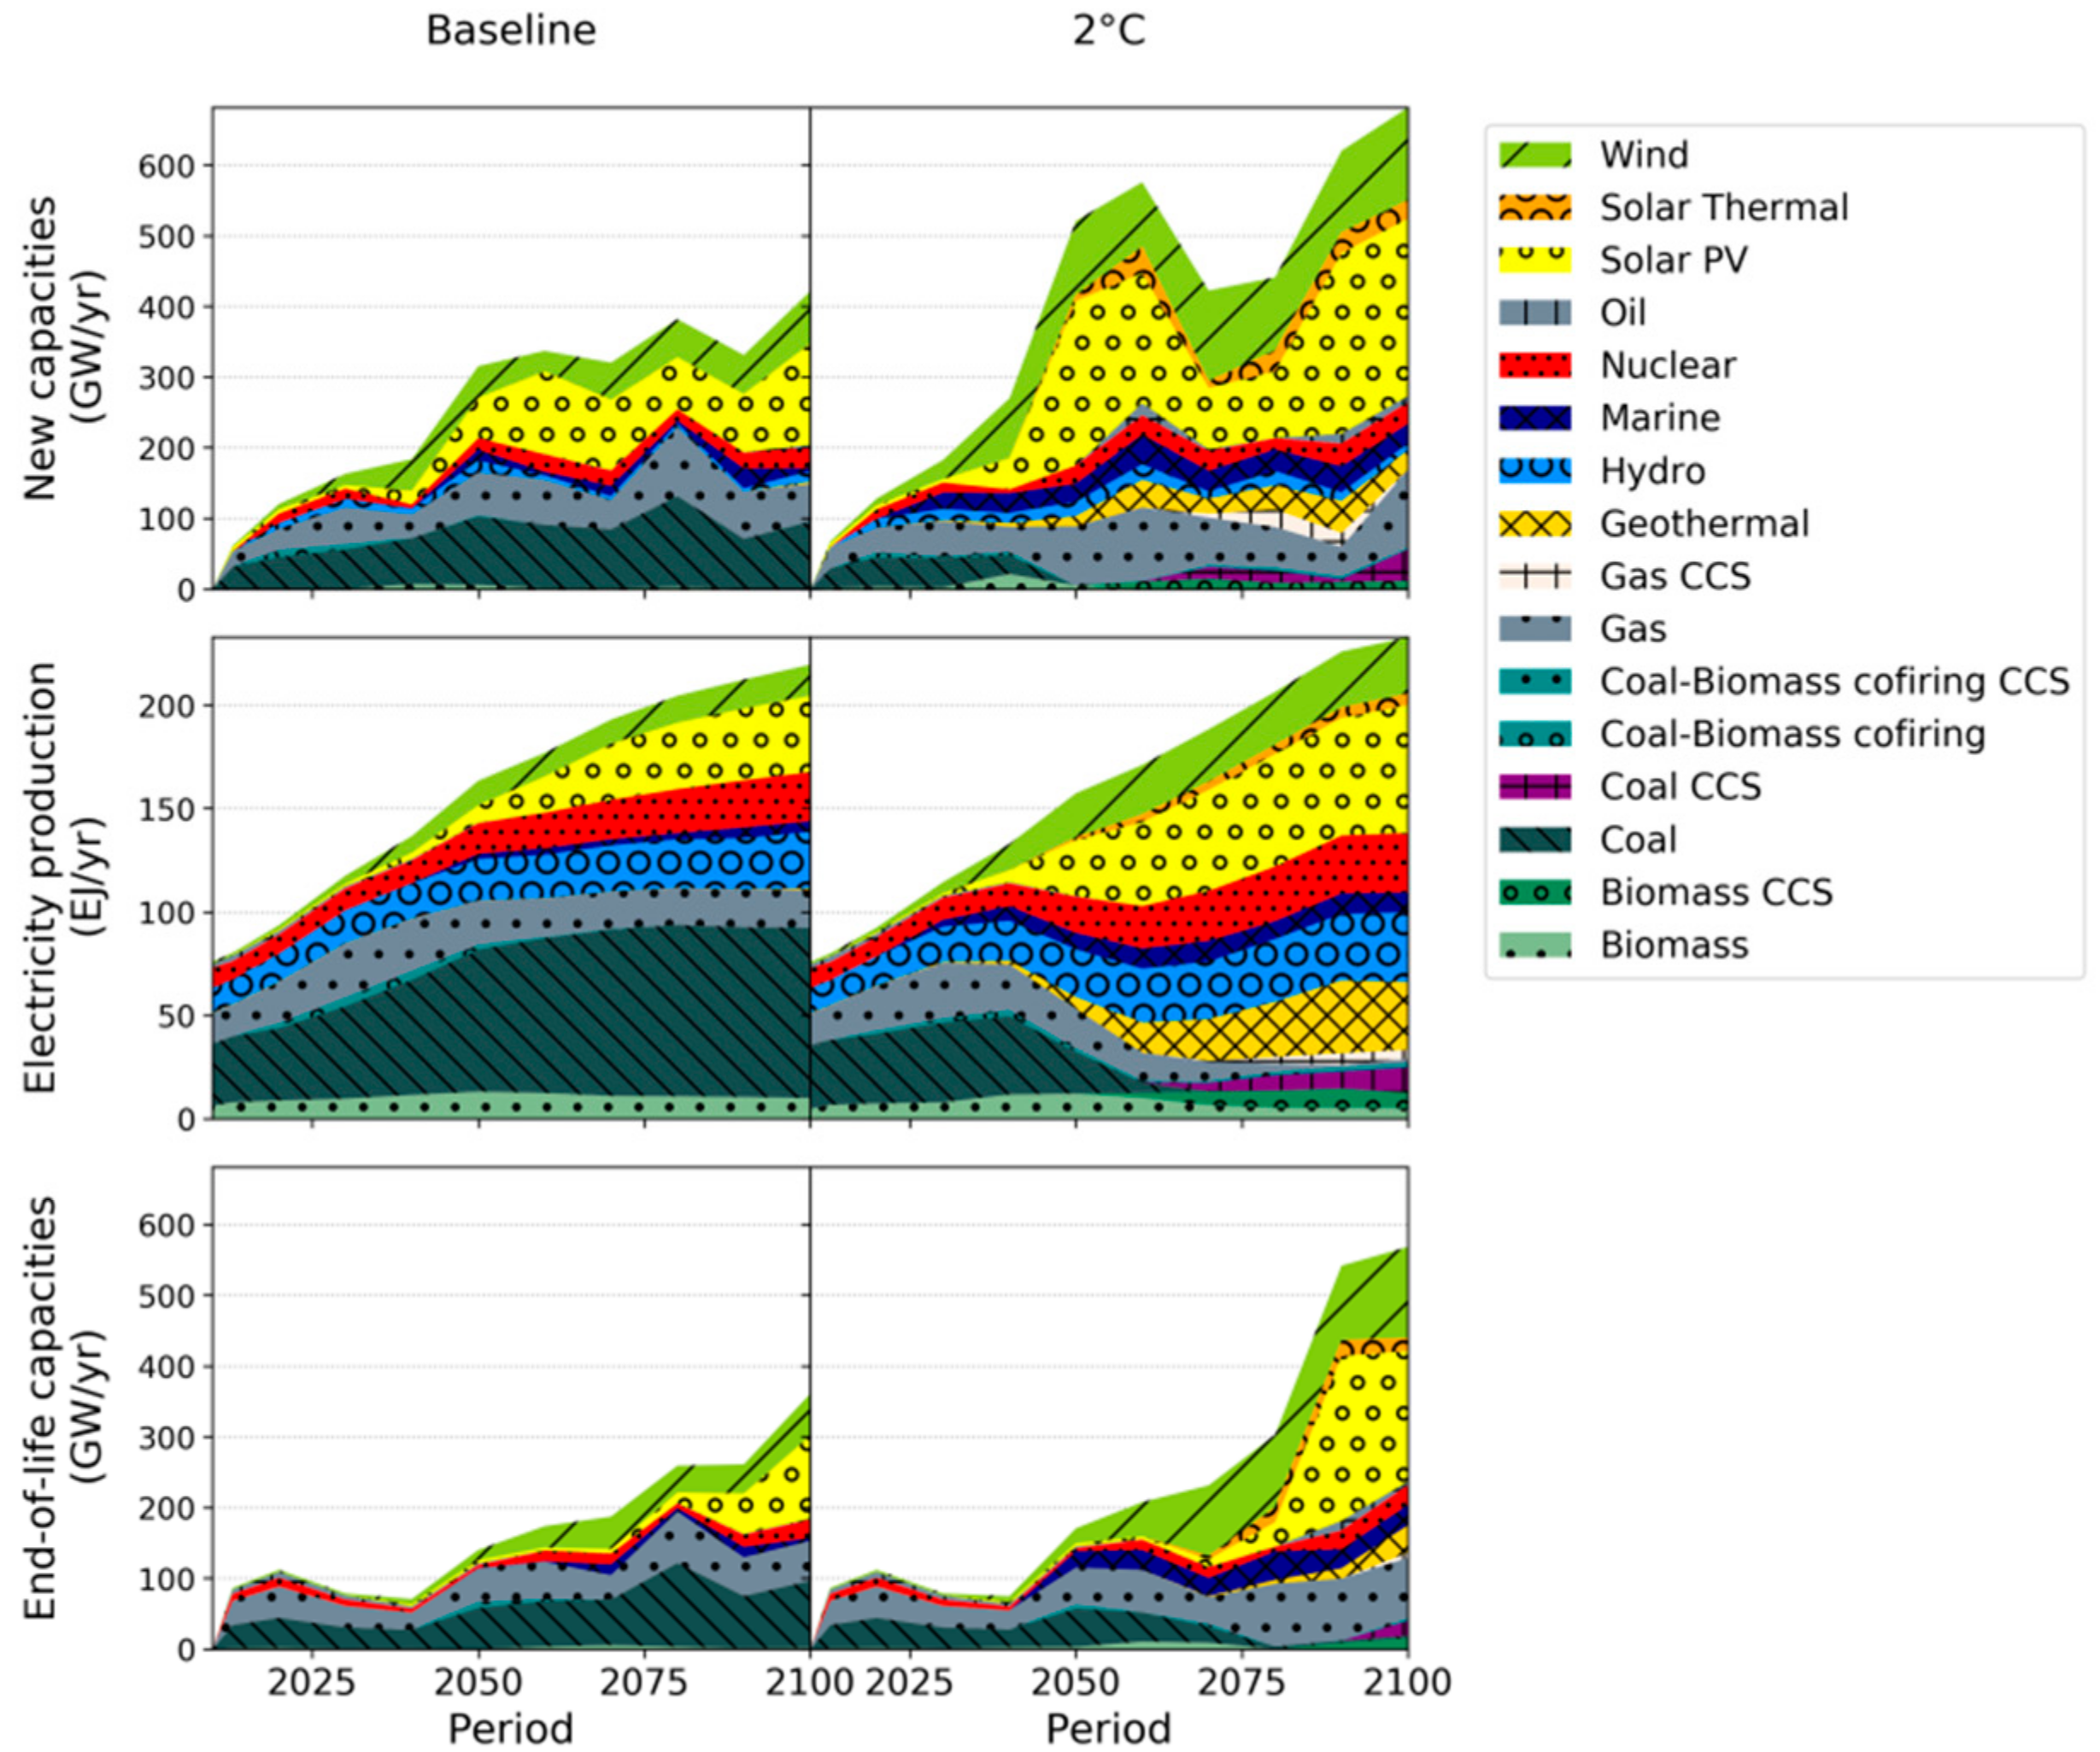
3.1. Global Electricity Generation

Global greenhouse gas emissions, primary energy supply, and final consumption are described in the Supplementary Materials (Figures S1, S2, and S3). The evolution of the power mix associated with the SSP2 baseline and 2 °C scenarios towards 2100 is represented in Figure 1. Three outputs are shown: the annual new capacities, electricity production, and end-of-life capacities of EG technologies. Global electricity production reaches 233 EJ/year in the 2 °C scenario in 2100, 13 EJ/year higher than in the baseline scenario. However, the way electricity is produced in the 2 °C scenario significantly differs from the baseline after 2040.
In the baseline scenario, electricity production is mostly coal-based and remains so until the end of the century. Coal is the major contributor to the increasing electricity supply until 2060, when wind and solar capacities take over to fulfill 23.6% of global electricity generation by 2100. In both scenarios, electricity production follows a similar trend until 2030 when, in the 2 °C scenario, coal and gas electricity production peak at 39 EJ/year and 25 EJ/year, respectively. After 2030, solar and wind capacities are increasingly installed as lower GHG emissions are needed to reduce the total system’s cost. Conventional coal capacities are phased out by 2070. Solar photovoltaics (PV) becomes the leading electricity producer, reaching 27 EJ/year in 2050. During the 2040–2050 period, up to 200 GW/year of solar PV and 90 GW/year of wind capacities are added to the world grid to limit global warming to 2 °C by 2100. 30 GW/year of natural gas power plants are installed concurrently as backups (intermittent power capacities are limited to 50% of total capacities in the TIAM-FR model). Hydropower, nuclear, and geothermal capacities develop in the 2 °C scenario to production levels of about 30 EJ/year in 2100. After a transition phase occurring between 2030 and 2060, electricity generation from solar PV increases slowly and fewer additional solar capacities are needed. Wind farms are still added to the grid to compensate for the massive end-of-life wind capacities observed in 2070. Concurrently, carbon capture and sequestration (CCS) technologies become mature, allowing new coal and bioenergy power plants to be commissioned. Coal infrastructures with CCS produce up to 12 EJ/year in 2100. End-of-life capacities mostly consist of conventional coal, oil, and gas in the first half of the century. These are partially replaced by more efficient technologies (e.g., pulverized coal and gas–oil combined cycle), allowing increased electricity generation, while the total installed capacity remains constant before 2030. After 2040, an increasing number of wind turbines enter the end-of-life phase, while the massive installation of solar PV from 2040–2050 translates into an extensive retirement phase during the 2080–2100 period. These solar PV capacities are replaced in order to maintain production, yielding a second surge of solar panel installation. Results for each world region are in the Supplementary Material (Table S2).

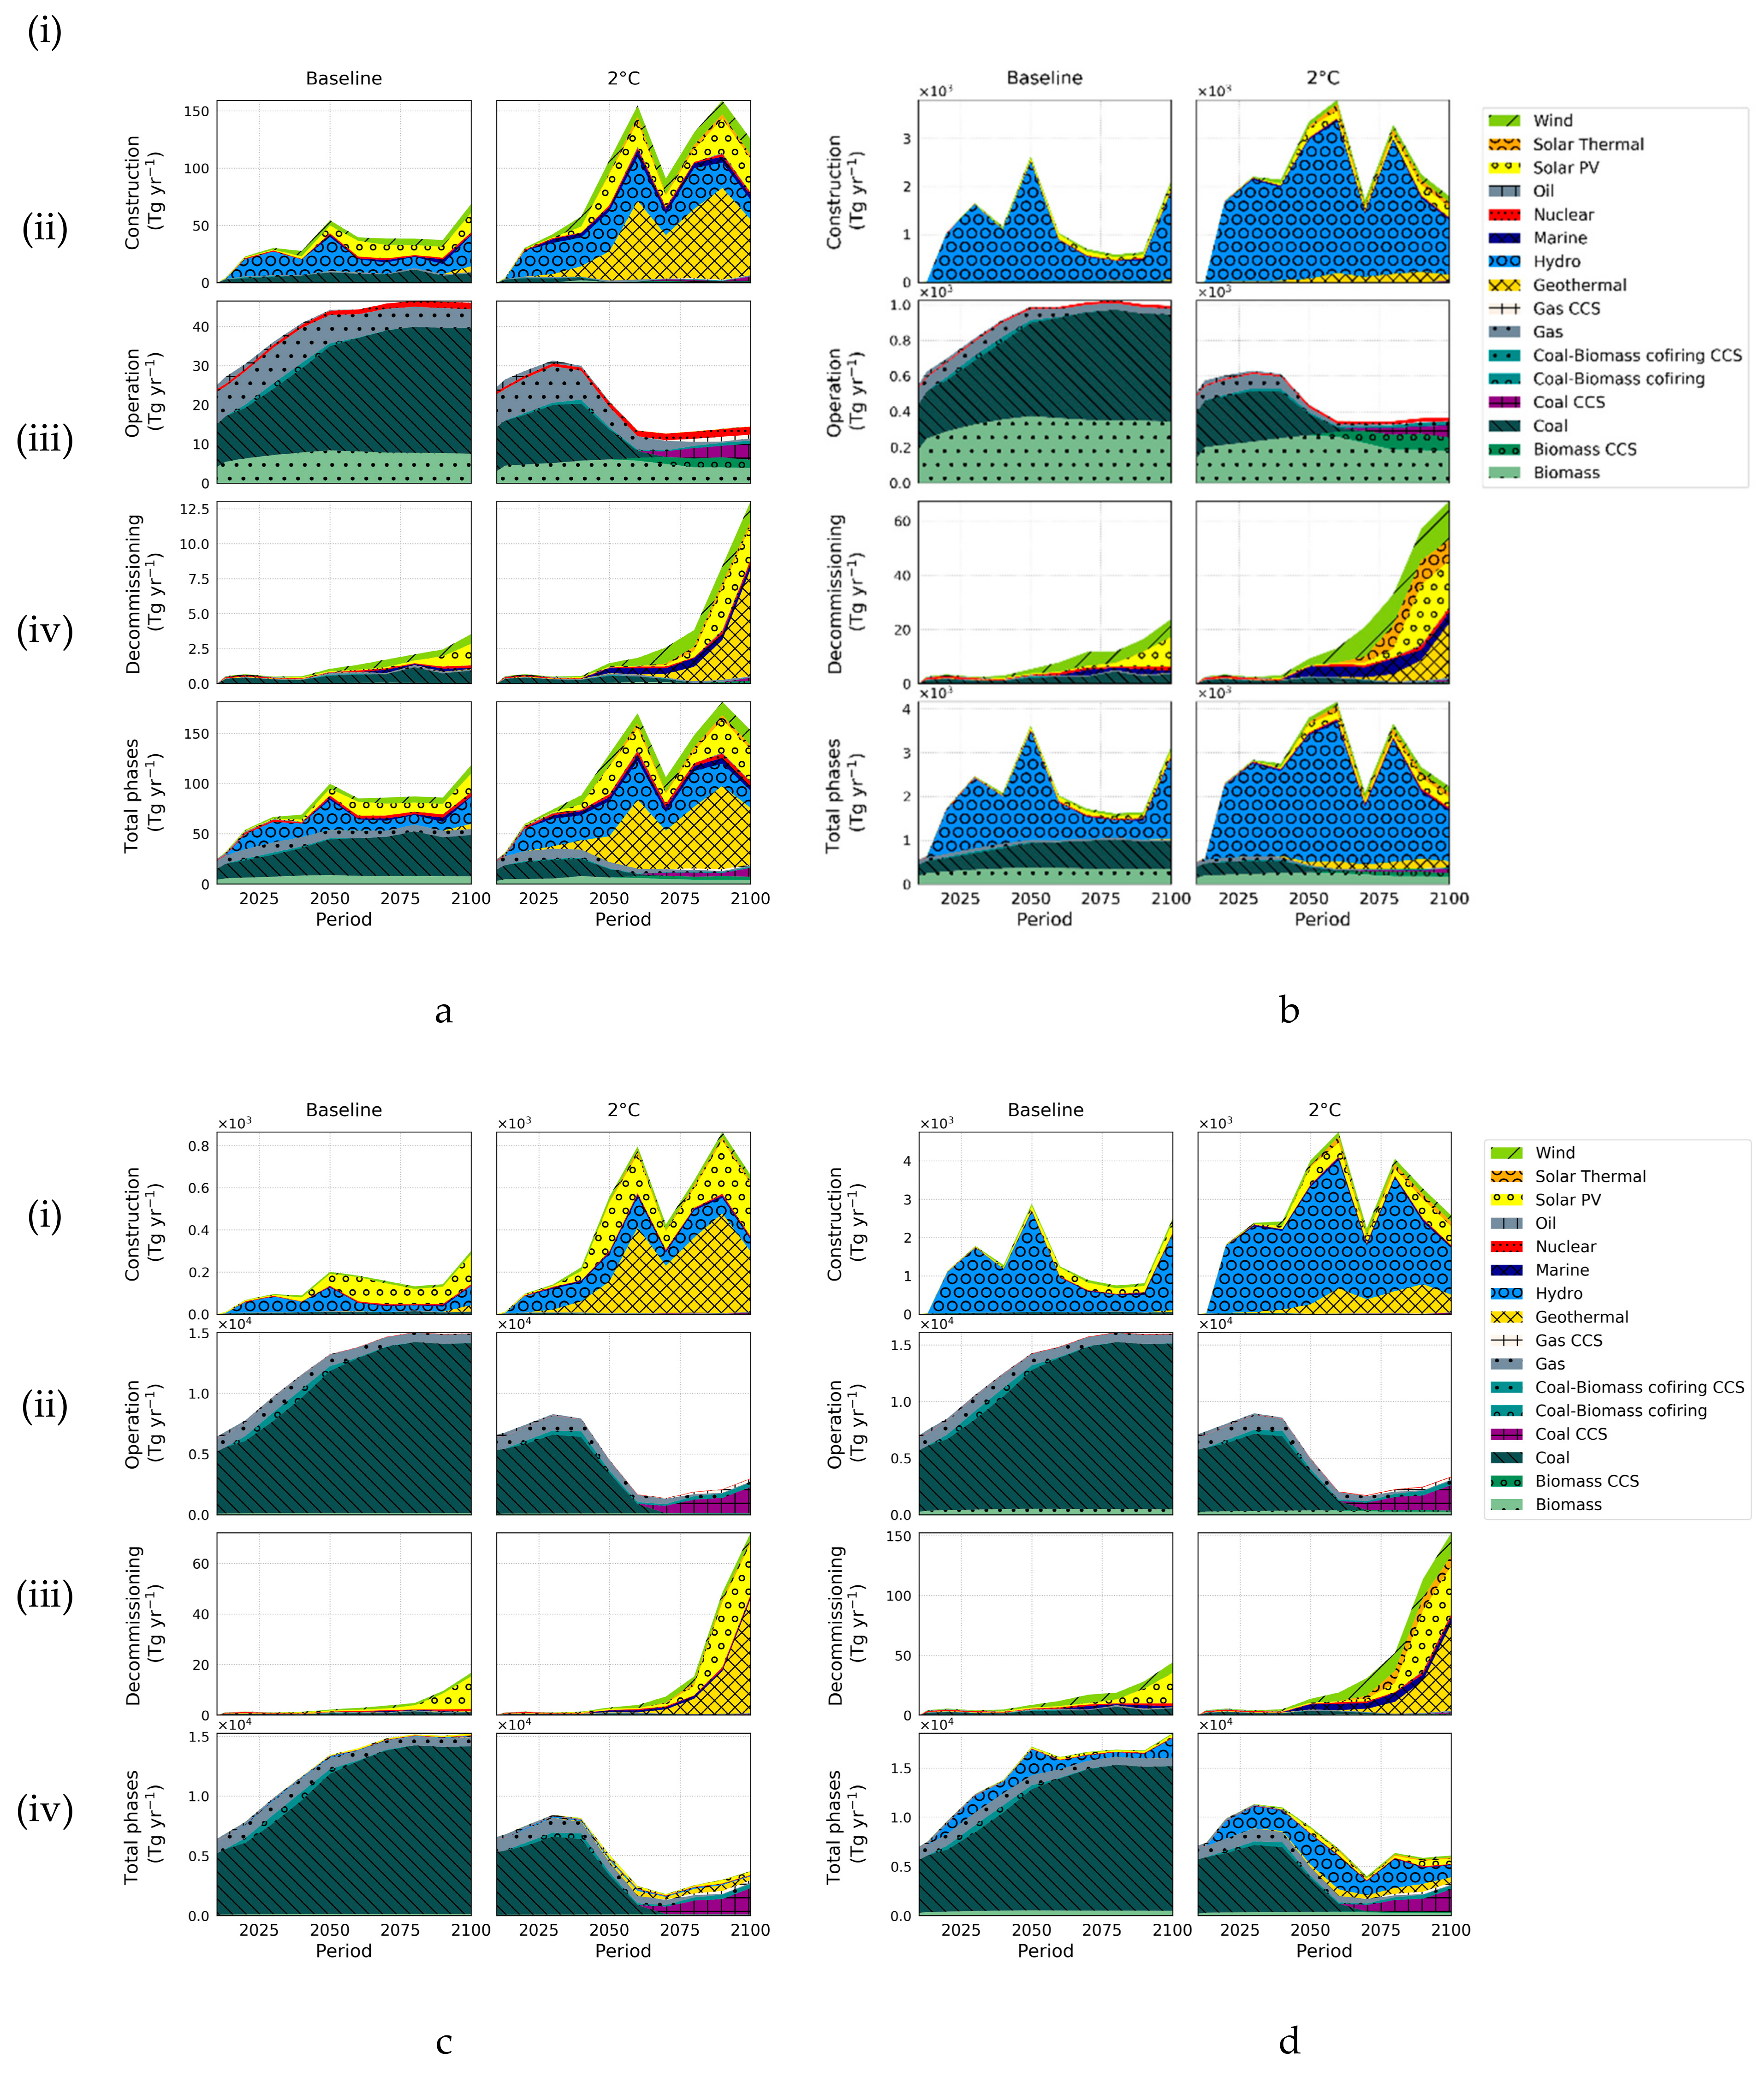
3.2. Raw Material Footprint of Electricity-Generating Technologies

Constructing, operating, and decommissioning power plants requires different kinds and amounts of energy and materials, not only due to "direct" activities at the plant site, but also during upstream and downstream “indirect” activities. The total amounts of metallic and nonmetallic mineral resources and fossil fuels involved in the construction, operation, and decommissioning of EG technologies are calculated following the combination of the TIAM-FR model with the ecoinvent LCI database. In this study, metallic mineral resources represent the metal content in ore, with the remaining ore being considered as nonmetallic mineral resources. Material usage results are shown in Figure 2 for both scenarios. Total use of metallic mineral resources (Figure 2a(iv)) increases in both the baseline and 2 °C scenarios due to the increase in electricity generation. Before 2030, this is mostly driven by bioenergy, fossil fuel, and hydropower plants. In the baseline scenario, the total use of metals is shared equally between the construction and operation phases (40‒55 Tg/year [teragrams per year] in 2050). In the 2 °C scenario, the use of metallic mineral resources decreases during operations to half of the 2010 level, while becoming much larger in the power plant construction phase after 2050 (up to 12 times that of the operation phase in 2090). In the second half of the century, the use of metals increases sharply due to the development of geothermal power. Although geothermal electricity production is lower than solar PV, its large requirements of reinforcing steel generate a significant material usage. At the end of the horizon, use of metals for decommissioning are 3.7 times greater in the 2 °C scenario than in the baseline, mostly due to end-of-life geothermal capacities. Demand for metallic mineral resources increases dramatically when new capacities are needed. Apart from economic growth, the 2 °C climate target sets additional pressure on mineral resource supplies. This pressure could vary depending on the evolution of recycling. However, we did not address the availability of recyclable end-of-life products in the technosphere.
Figure 2b shows the usage of nonmetallic mineral resources. Most of these resources are used during the construction of hydropower facilities, which involve massive earthworks and large quantities of concrete. However, there are considerable uncertainties and variations in the material footprint of hydropower technologies [30] depending on their design, location, and how material usage is accounted for. Significant nonmetallic resources—about 988 Tg/year in 2050 in the baseline scenario and 439 Tg/year in 2050 in the 2 °C scenario—are used by coal and bioenergy power plants due to resource extraction for operations. The use of nonmetallic mineral resources peaks in 2050 in the baseline scenario, and in 2060 in the 2 °C scenario. The decommissioning of coal, nuclear, and wind power plants uses similar amounts of nonmetallic resources in both the baseline and 2 °C scenarios until 2040. In the 2 °C scenario, cumulative nonmetallic mineral resource usage is of 121,971 Tg in 2050 and 264,370 Tg in 2100, compared to 105,116 Tg and 203,172 Tg in the baseline scenario.
Consumption of fossil fuels is mostly due to EG technology operations. The decline of coal in the 2 °C scenario is responsible for decreasing fossil fuel consumption until 2060, when mature CCS technologies enable the operation of new bioenergy and coal power plants without generating additional GHG emissions. In the 2 °C scenario in 2100, fossil fuels for decommissioning activities are five times greater than in the baseline scenario (Figure 2c(iii)). However, these fossil fuels only represent 2% of the total fossil fuel consumption.
Summing up all resources and phases (Figure 2d(iv)), we found that the 2 °C target generates 47% less material consumption in 2050 than in the baseline scenario, decreasing to 67% in 2100. However, accounting only for mineral resources (excluding fossil fuels), the 2 °C climate target generates a cumulative total use that is 16% higher over the 2010–2050 period and 31% higher over the 2010–2100 period compared to the baseline scenario. Regarding the metals only, the cumulative total use is 20% higher over the 2010–2050 period and 46% higher over the 2010–2100 period. Thus, the 2 °C target implies a transition in the resource required by EG technologies from fossil fuels to mineral resources.

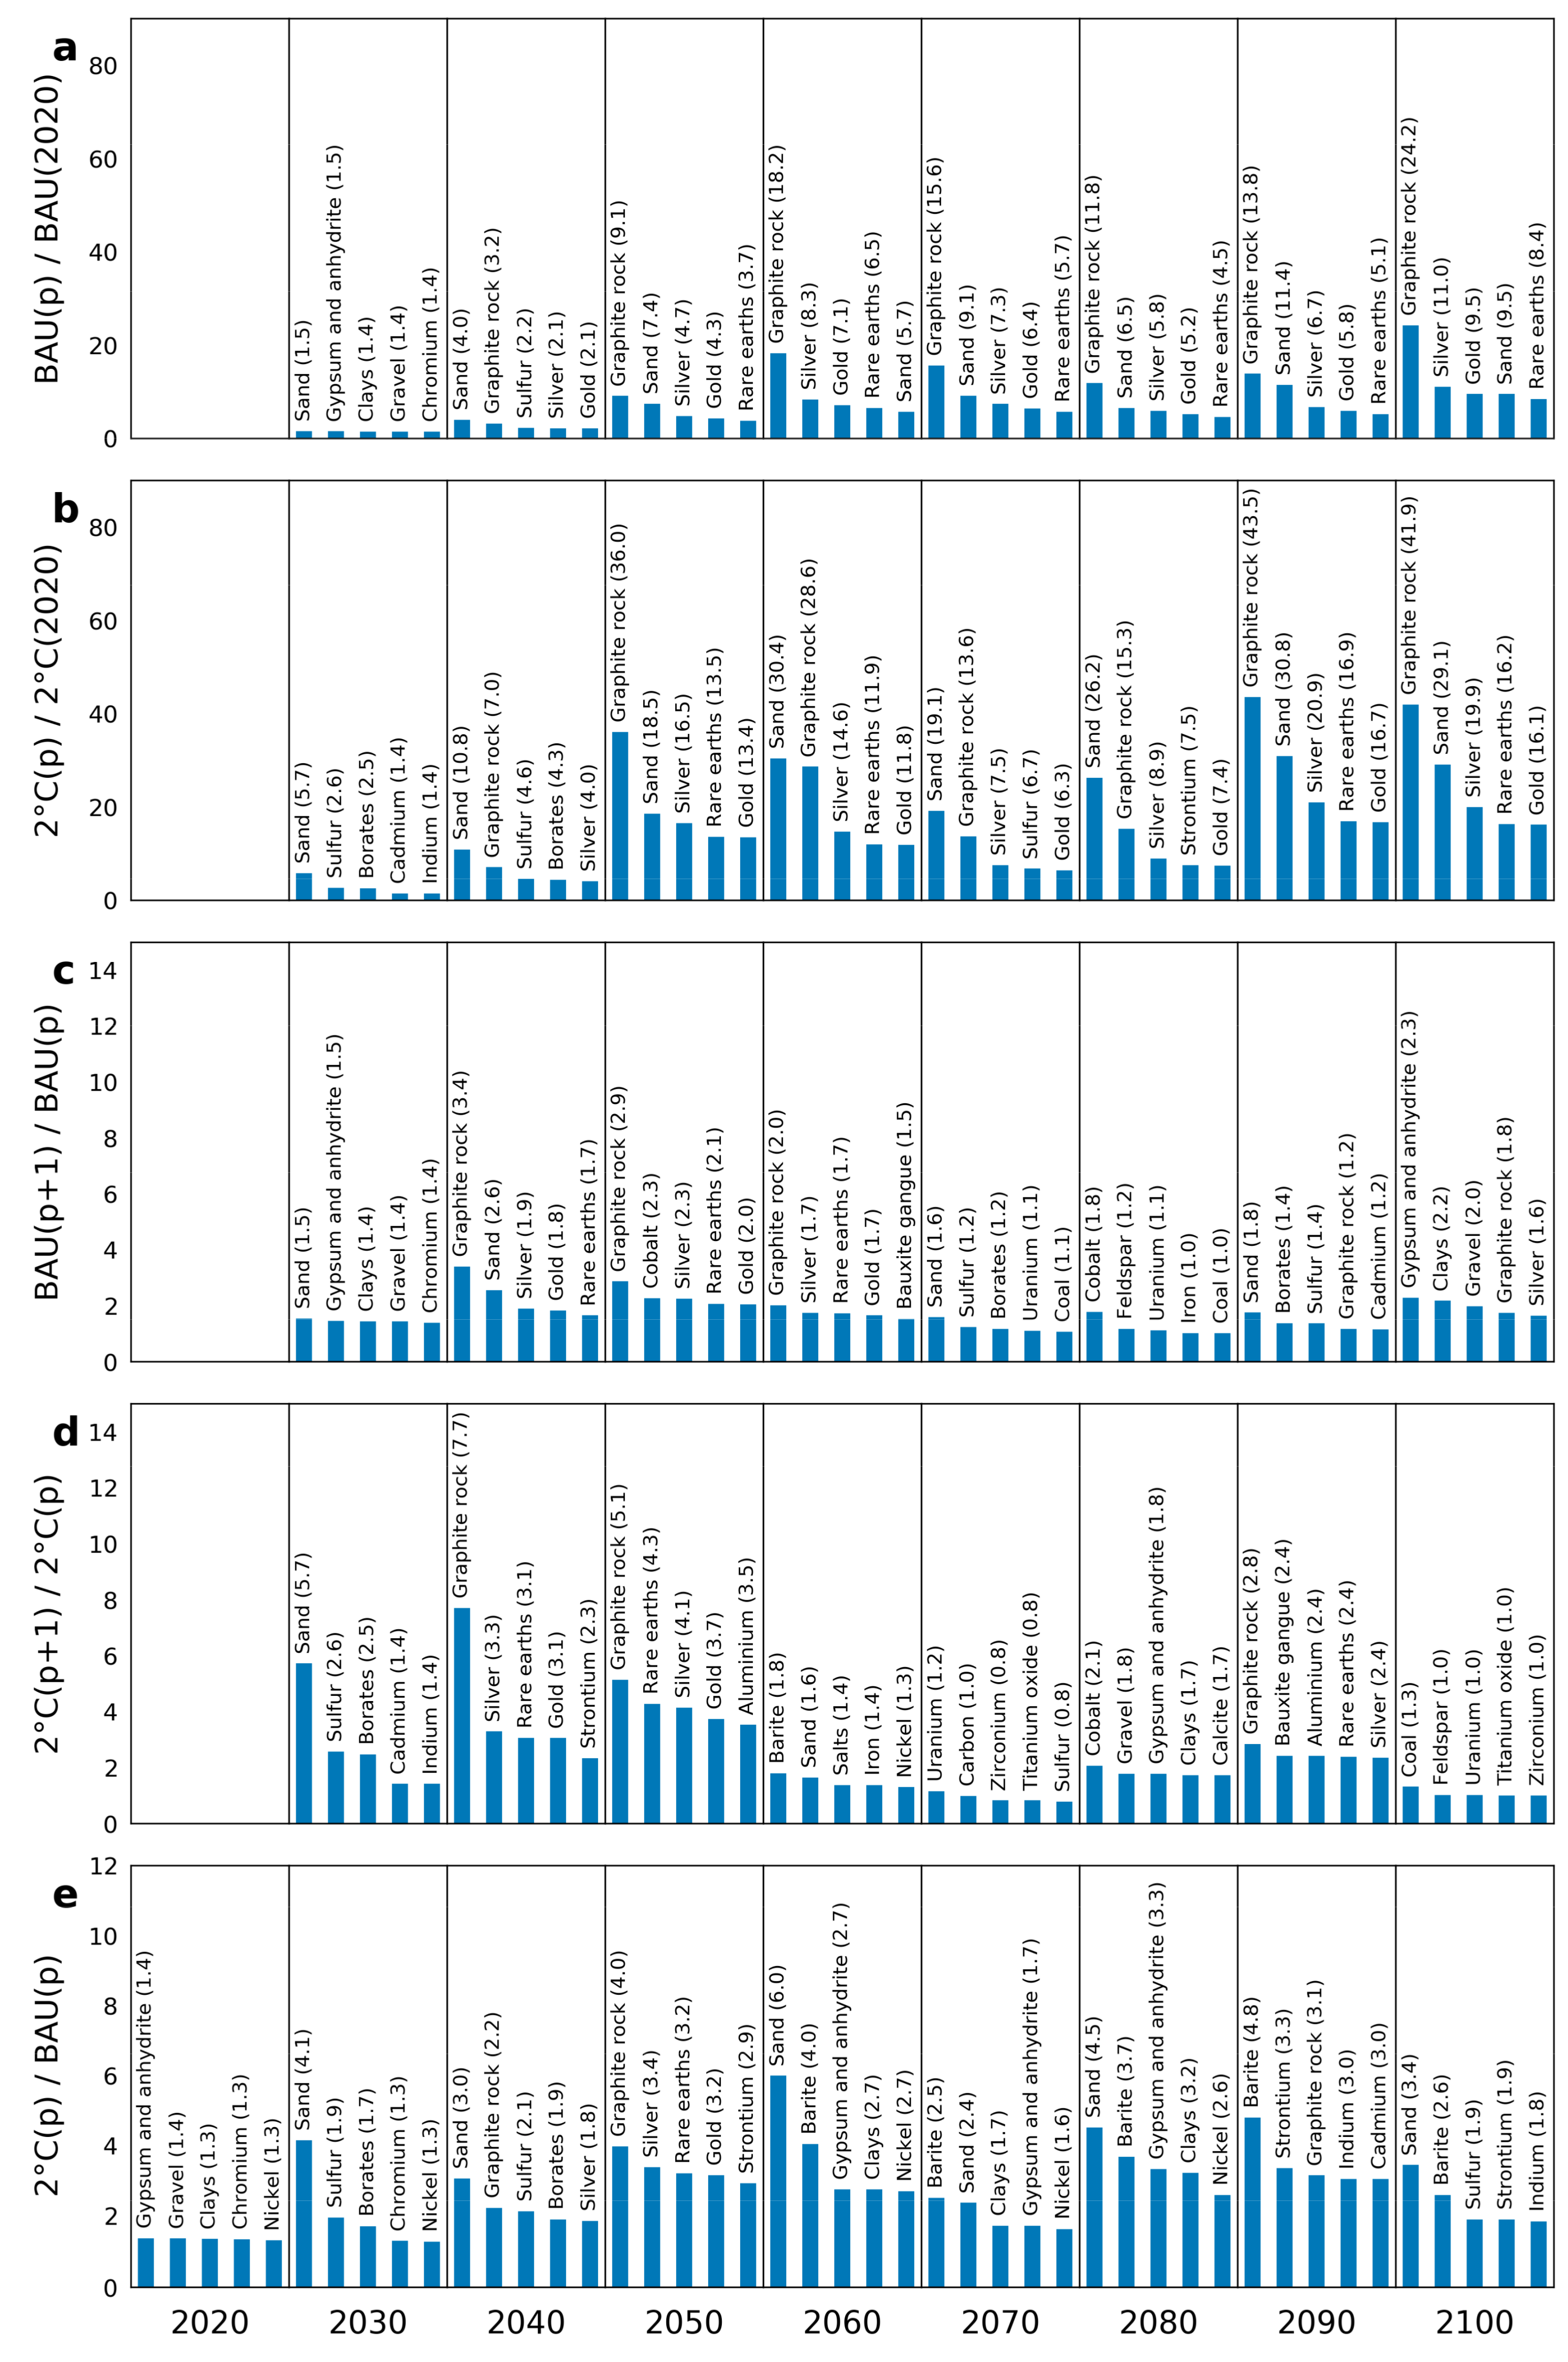
3.3. Most-Impacted Substances

Figure 3a,b show the five highest increases for each decade in the use of each group of substances relative to the 2020 decade (2016–2024), in the baseline and 2 °C scenarios, respectively. Figure 3c,d shows the relative increase in substance usage between two subsequent decades. Figure 3e shows the five highest ratios between the 2 °C and baseline scenarios in each decade. Values have no units since they are expressed in relative amounts (1 ≡ 100%). Results for the three raw fossil fuels and forty-eight metallic and nonmetallic mineral resources are provided for each region in the Supplementary Material (Table S3). In the 2030 baseline decade, construction raw materials are subject to the highest increase in usage by EG technologies relative to 2020. Sand, gypsum and anhydrite, clays, gravel, chromium, and nickel are mobilized in the construction phase of EG technologies where large amounts of steel and concrete are needed. During the 2040 decade, graphite, silver and gold are increasingly used, mostly as a result of solar PV development which requires silver and gold as conducting elements, and graphite electrodes for the fabrication of silicon wafer. Wind turbines drive sand and sulfur demand up due to the need for glass fiber and sulfuric acid. After 2045, the five highest increases in material usage relative to 2020 are sand, graphite rock, silver, gold, and rare earth elements.
In the 2 °C scenario, borates (chemical agent), cadmium, and indium are the top five most increasingly used materials in the 2030 decade relative to 2020. This results significantly from the development of CdTe (cadmium telluride) and CIGS (copper indium gallium selenide) solar PV thin films. After 2040, the use of graphite, sand, silver, rare earth elements, and gold is multiplied by up to four times relative to the baseline scenario. Although marine and solar thermal electricity productions remain moderate, their relatively large material footprints generate a significant material usage in the 2060 decade. Sand (glass for concentrating solar power systems (CSP) and glass fiber for wind turbines) is one of the most increasingly mobilized raw materials.
It is important to note that a high usage increase for raw materials used in small quantities relative to their resource potential is not necessarily a subject of concern. The results for each substance should be interpreted in the context of its share of the global market and supply risk. Substances that are used in small quantities are generally those with the highest uncertainty (substances for which annual usage is less than one ton are not reported).
Looking at the relative growth between two subsequent decades in the baseline and 2 °C scenarios (Figure 3c,d), we observed that the highest increase in usage is during the 2040 decades for both scenarios. The baseline requirements of graphite, sand, silver, gold, and rare earth elements are multiplied by 1.7 to 3.4 in about 10 years. In the 2 °C scenario, graphite use soars while strontium takes over sand in the highest period-to-period increase in usage. Strontium appears in the life-cycle inventories of solar PV and geothermal technologies, for the production of zinc and thermal insulation materials. In the 2050 decade, baseline use of cobalt is 2.3 times higher than their 2040 consumption. In the 2 °C scenario, aluminum requirements increase 3.5 times in one decade. In 2060, material usage growth is more moderate as newly built low-carbon capacities enable to cut large GHG emissions. Geothermal facilities continue to develop in the 2 °C scenario. This increases the requirements of barite, iron, and nickel, used in geothermal structure and drillings. During the 2070 decade, material requirements decrease relatively to 2060 in the 2 °C scenario, with the exception of a 20% increase in demand for uranium for nuclear power plants. After 2075, raw materials are mobilized to replace end-of-life power plants, while CCS fossil-fueled technologies develop (causing an increase of 30% in coal use during the last decade).
Copper does not feature among the five highest increases in this study. However, it has become a resource of concern since it is widely used in electric appliances. Its reserves were identified as insufficiently increasing to cover future requirements due to low-carbon technologies and global electrification [31,32,33]. We detail the results for copper in the Supplementary Material (Figures S4 and S5), along with a comparison to previous studies of the direct metal use from EG technologies (Figure S6) [9,15,16,34]. We found average copper requirements of 0.69 Tg/year in the baseline scenario and 0.96 Tg/year in the 2 °C scenario, over the 2010–2050 period, which is in agreement with Deetman et al. [15]. Copper usage growth for EG technologies could be of 0.05 Tg/year in the baseline scenario and up to 0.1 Tg/year in the 2 °C scenario during the shifting period (2040–2050). For comparison, global mine production of copper grew at an average rate of 0.57 Tg/year between 2012 and 2017.

3.4. The 2 °C Target

By calculating the ratio between the 2 °C and baseline scenarios, it was possible to rank the mineral resources that were most influenced by the 2 °C temperature target. Figure 3e shows the five highest ratios for every decade. In 2020, gypsum and anhydrite, gravel, clays (for concrete), chromium, and nickel (for steel) are 30% to 40% higher than their baseline consumption. In the 2030 decade, the 2 °C constraint generates an average four-fold increase in sand usage compared to the baseline scenario. The influence of the 2 °C constraint is highest on sand in 2060 (× 6.0), but is also substantial on a number of substances like barite, graphite rock, silver, gypsum and anhydrite, rare earth elements, and others. At the end of the horizon, the 2 °C warming limit has a strong influence on material usage, which is multiplied up to five times compared to the baseline. Nonmetallic mineral resources, some of which are nonrenewable are impacted by decarbonation even more than metals. However, this assessment does not allow us to distinguish useful resources from tailings and overburden. Such a distinction in LCI databases such as ecoinvent could help better determine the value and criticality of a given substance.

4. Discussion and Path Forward

4.1. Static vs. Evolutionary LCIs

The approach presented here uses attributional LCIs that are static, which means they are not modified according to an evolving background. This generates bias on long-term scales when the background of a process significantly differs from the initial inventory [19]. However, this approach offers the triple advantage of: (1) capturing real situations with existing activities, (2) being able to compare EG technologies on a more objective basis, and (3) providing highly reproducible results without the need for the additional assumptions of a consequential analysis. Using evolving LCIs can be conceptually more valid, but it can also lead to special case scenarios that are perceived as less likely or less consensual. The difficulty of dealing with uncertainty in LCIs and integrated assessment models and prospective exercises has been previously discussed [28] but is not resolved here.

4.2. Resource Depletion and Footprint

The influence of prospective energy scenarios and climate targets on future mineral resource use is still largely unknown. Conversely, the influence of mineral resource availability on integrated assessments with climate targets has not yet been studied.
As many mineral resources are extracted and transformed by human activities faster than they re-form [4], future socioeconomic development and climate action may be constrained by mineral resource availability. The direct consequences of resource exploitation unsustainability include an increasing number of challenges for the mining sector (exploration and extraction) [35], resource depletion, and a growing number of critical raw materials for various stakeholders [36]. Eventually, supply disruptions may result in volatile commodity prices, enhanced intersectoral competition [37], "black swan" events [38], increased environmental impacts, geopolitical tensions, and climate action withdrawals when a given resource supply becomes a greater concern than its associated environmental impacts.
Concurrently, lower-grade mining ore [4,39,40,41] may result in the need for more exploration, extraction, processing, and waste for each unit of raw material produced. Additional GHG emissions could result from low resource availability if mining technologies run on fossil fuels. Alternatively, low-carbon mining technologies may reduce GHG emissions but have a larger mineral resource footprint, raising important questions about resource efficiency [40]. Environmental impacts based on mineral resource demand scenarios have been studied previously [18,42,43]. These studies have considered decarboning electricity generation to 2050, but have not addressed an increasing mineral resource footprint of upstream activities, which could lead to significantly different results. Accounting for reuse and recycling may in turn mitigate the mineral resource footprint. Thus, variations in efficiency and resource intensity should be accounted for considering the rebound effect [44] and, if possible, taking a cradle-to-cradle life-cycle perspective compatible with the laws of thermodynamics.

4.3. Other Energy Sectors

Aspects of nonfuel mineral resources that can potentially impact energy scenarios could represent key constraints in energy and environmental policies, especially when strong GHG mitigation actions are taken. Our results show that without significant changes in the constitution of EG technologies, several mineral resources will be needed by multiple times their current requirements, as a result of the wide development of material-intensive low-carbon technologies. However, resource requirements for EG technologies might only represent a fraction of the total resource consumption in the global economy. This is why a similar approach should be extended to cover other technologies and sectors of the energy system. It could be useful to policymakers, energy modelers, industrial ecologists, and industrials interested in the future material footprint, criticality, and environmental impacts of their products, technologies, and activities. In addition, life-cycle analysts could use such a tool as a basis for developing scenario-based consequential LCAs, making it easier to highlight errors and data gaps, as well as to determine adequate system boundaries in a life-cycle sustainability analysis (LCSA) [45]. The multiregional description of the energy system in TIAM-FR could be used to perform regional criticality analysis of various substances, possibly leading to geostrategic analysis. Global electrification of the world may modify the material footprint of the electricity generation and electric products. Based on this study, prospective criticality and supply chain assessments in relation to environmental policies could help identify the resources for which criticality or supply risk is high [46]. However, an endogenous integration of nonfuel resource cycles in TIAM-FR still has to be achieved.

4.4. Towards Simpler and More Complex Models

Resource prices, reserves, access, functions, services, geographical distribution, trade, cycles, and non-GHG environmental impacts are features that could potentially be integrated into IAMs to take into account resource constraints.
Dynamic material flow analysis, life-cycle inventories, and energy system modeling can all be used as prospective tools to analyze the evolution of the socioeconomic metabolism and its environmental impacts. Thus, there is an opportunity for a symbiotic relation in a common framework, to achieve energy and environmental impact scenarios compatible with sustainable mineral resource flows. However, a major challenge to such an achievement is the definition of socioeconomic laws for a system that is dynamic, complex, and nonlinear in practice. A promising framework to investigate the systemic connections between material cycles and human activities was proposed by Pauliuk [47], building on the socioeconomic metabolism concept [48]. In this framework, the socioeconomic metabolism could be further characterized by a thermodynamical approach, considering the anthroposhere as a dissipative structure [49]. Future models will ideally represent the complexity of the socioeconomic metabolism, minimizing the number of required assumptions.

4.5. Shared Socioeconomic (Metabolism) Pathways

Development pathways have strong implications for mineral resources, not only in climate change mitigation scenarios but also in baseline pathways as shown in this study. The interests that drive societies evolve rapidly and modify the conditions of what is socially and environmentally acceptable. Adaptation to material restrictions may also be possible through societal changes and resource management policies. The extent to which economic growth and GHG emission mitigation are priorities compared to other environmental and societal-related impacts should be further analyzed and debated. SSPs (shared socioeconomic pathways) provide a suitable framework to discuss these questions. In their current form [29], they contain substantial information on energy, climate, economy, and social aspects, but do not contain equivalent information about mineral resource stocks, flows, services, and use in the socioeconomic system. In the perspective of mineral resource integration in IAMs, we suggest that the SSP narratives could be complemented with "raw materials" storylines whereby material in-use stocks and flows would be described in more detail using qualitative and quantitative indicators. Such narratives could better address the features of a circular economy (reuse, recycling, frugal innovation, etc.) as well as the key issue of decoupling environmental impacts from economic growth.

Supplementary Materials

The following are available online at https://www.mdpi.com/2079-9276/8/1/33/s1, Figure S1: Global anthropogenic GHG emissions in the baseline and 2 °C scenarios, Figure S2: Total primary energy supply in the baseline and 2 °C scenarios, Figure S3: Total final consumption in the baseline and 2 °C scenarios, Figure S4: Copper use in three life phases in the baseline and 2 °C scenarios, by technology, Figure S5: Cumulative copper use in the three phases and the total use in the baseline and 2 °C scenarios, Figure S6: Prospective copper use by global electricity generating technologies according to different studies, Table S1: TIAM elec. outputs, Table S2: TIAM-FR Regions, Table S3: Material use.

Author Contributions

A.B. processed the data and analyzed the results. N.M. supervised the study. A.B. and N.M. wrote the paper.

Funding

This research received no external funding

Acknowledgments

We acknowledge the French Ministry for the Economy and Finance and the Mines ParisTech Foundation for funding this research. We also thank Seungwoo Kang for his help with the TIAM-FR modeling framework.

Conflicts of Interest

The authors declare no financial and non-financial conflict of interest.

References

  1. Edenhofer, O. Climate Change 2014: Mitigation of Climate Change; Working Group III contribution to the Fifth Assessment Report of the Intergovernmental Panel on Climate Change; Cambridge University Press: New York, NY, USA, 2014; ISBN 978-1-107-05821-7. [Google Scholar]
  2. Semertzidis, T. Can Energy Systems Models Address the Resource Nexus? Energy Procedia 2015, 83, 279–288. [Google Scholar] [CrossRef] [Green Version]
  3. Pauliuk, S.; Arvesen, A.; Stadler, K.; Hertwich, E.G. Industrial ecology in integrated assessment models. Nat. Clim. Change 2017, 7, 13–20. [Google Scholar] [CrossRef]
  4. Van der Voet, E. Environmental Risks and Challenges of Anthropogenic Metals Flows and Cycles; Report 3; Working Group on the Global Metal Flows, Ed.; United Nations Environment Programme: Nairobi, Kenya, 2013; ISBN 978-92-807-3266-5. [Google Scholar]
  5. Van Vuuren, D.P.; Strengers, B.J.; De Vries, H.J. Long-term perspectives on world metal use—A system-dynamics model. Resour. Policy 1999, 25, 239–255. [Google Scholar] [CrossRef]
  6. Rohstoffe für Zukunftstechnologien: Einfluss des Branchenspezifischen Rohstoffbedarfs in Rohstoffintensiven Zukunftstechnologien auf die Zukünftige Rohstoffnachfrage. ISI-Schriftenreihe Innovationspotenziale; 2., überarb. Aufl; Angerer, G., Erdmann, L., Marscheider-Weidemann, F., Scharp, M., Lüllmann, A., Fraunhofer-Institut für System- und Innovationsforschung, Eds.; Fraunhofer Verl: Stuttgart, Germany, 2009; ISBN 978-3-8396-0014-6. [Google Scholar]
  7. Moss, R.; Tzimas, E.; Kara, H.; Willis, P.; Kooroshy, J. Critical Metals in Strategic Energy Technologies-Assessing Rare Metals as Supply-Chain Bottlenecks in Low-Carbon Energy Technologies; European Commission: Brussels, Belgium, 2012. [Google Scholar]
  8. Espinoza, L.A.T. The Role of Emerging Technologies in Rapidly Changing Demand for Mineral Raw Material; POLINARES Working Paper n. 27; European Commission: Brussels, Belgium, 2012. [Google Scholar]
  9. Elshkaki, A.; Graedel, T.E. Dynamic analysis of the global metals flows and stocks in electricity generation technologies. J. Clean. Prod. 2013, 59, 260–273. [Google Scholar] [CrossRef]
  10. Hoenderdaal, S.; Tercero Espinoza, L.; Marscheider-Weidemann, F.; Graus, W. Can a dysprosium shortage threaten green energy technologies? Energy 2013, 49, 344–355. [Google Scholar] [CrossRef]
  11. Stamp, A.; Wäger, P.A.; Hellweg, S. Linking energy scenarios with metal demand modeling–The case of indium in CIGS solar cells. Resour. Conserv. Recycl. 2014, 93, 156–167. [Google Scholar] [CrossRef]
  12. Habib, K.; Wenzel, H. Exploring rare earths supply constraints for the emerging clean energy technologies and the role of recycling. J. Clean. Prod. 2014, 84, 348–359. [Google Scholar] [CrossRef]
  13. Grandell, L.; Lehtilä, A.; Kivinen, M.; Koljonen, T.; Kihlman, S.; Lauri, L.S. Role of critical metals in the future markets of clean energy technologies. Renew. Energy 2016, 95, 53–62. [Google Scholar] [CrossRef]
  14. Elshkaki, A.; Graedel, T.E.; Ciacci, L.; Reck, B.K. Resource Demand Scenarios for the Major Metals. Environ. Sci. Technol. 2018, 52, 2491–2497. [Google Scholar] [CrossRef]
  15. Deetman, S.; Pauliuk, S.; van Vuuren, D.P.; van der Voet, E.; Tukker, A. Scenarios for Demand Growth of Metals in Electricity Generation Technologies, Cars, and Electronic Appliances. Environ. Sci. Technol. 2018, 52, 4950–4959. [Google Scholar] [CrossRef]
  16. Kleijn, R.; van der Voet, E.; Kramer, G.J.; van Oers, L.; van der Giesen, C. Metal requirements of low-carbon power generation. Energy 2011, 36, 5640–5648. [Google Scholar] [CrossRef]
  17. De Koning, A.; Kleijn, R.; Huppes, G.; Sprecher, B.; van Engelen, G.; Tukker, A. Metal supply constraints for a low-carbon economy? Resour. Conserv. Recycl. 2018, 129, 202–208. [Google Scholar] [CrossRef]
  18. Hertwich, E.G.; Gibon, T.; Bouman, E.A.; Arvesen, A.; Suh, S.; Heath, G.A.; Bergesen, J.D.; Ramirez, A.; Vega, M.I.; Shi, L. Integrated life-cycle assessment of electricity-supply scenarios confirms global environmental benefit of low-carbon technologies. Proc. Natl. Acad. Sci. USA 2015, 112, 6277–6282. [Google Scholar] [CrossRef] [PubMed]
  19. Boubault, A.; Kang, S.; Maïzi, N. Closing the TIMES Integrated Assessment Model (TIAM-FR) Raw Materials Gap with Life Cycle Inventories: Integrated Assessment Using Life Cycle Inventories. J. Ind. Ecol. 2018, in press. [Google Scholar] [CrossRef]
  20. O’Neill, B.C.; Kriegler, E.; Riahi, K.; Ebi, K.L.; Hallegatte, S.; Carter, T.R.; Mathur, R.; van Vuuren, D.P. A new scenario framework for climate change research: The concept of shared socioeconomic pathways. Clim. Change 2014, 122, 387–400. [Google Scholar] [CrossRef]
  21. Loulou, R.; Labriet, M. ETSAP-TIAM: The TIMES integrated assessment model Part I: Model structure. Comput. Manag. Sci. 2008, 5, 7–40. [Google Scholar] [CrossRef]
  22. Loulou, R. ETSAP-TIAM: The TIMES integrated assessment model. Part II: Mathematical formulation. Comput. Manag. Sci. 2008, 5, 41–66. [Google Scholar] [CrossRef]
  23. Energy Technology Systems Analysis Program E-TechDS–Energy Technology Data Source. Available online: https://iea-etsap.org/index.php/energy-technology-data (accessed on 31 March 2018).
  24. Selosse, S.; Ricci, O. Achieving negative emissions with BECCS (bioenergy with carbon capture and storage) in the power sector: New insights from the TIAM-FR (TIMES Integrated Assessment Model France) model. Energy 2014, 76, 967–975. [Google Scholar] [CrossRef]
  25. Dubreuil, A.; Assoumou, E.; Bouckaert, S.; Selosse, S.; Maıïzi, N. Water modeling in an energy optimization framework–The water-scarce middle east context. Appl. Energy 2013, 101, 268–279. [Google Scholar] [CrossRef]
  26. Kang, S.; Selosse, S.; Maïzi, N. Strategy of bioenergy development in the largest energy consumers of Asia (China, India, Japan and South Korea). Energy Strategy Rev. 2015, 8, 56–65. [Google Scholar] [CrossRef]
  27. Kang, S.; Selosse, S.; Maïzi, N. Is GHG mitigation policy enough to develop bioenergy in Asia: A long-term analysis with TIAM-FR. Int. J. Oil Gas Coal Technol. 2017, 14, 5–31. [Google Scholar] [CrossRef]
  28. Fricko, O.; Havlik, P.; Rogelj, J.; Klimont, Z.; Gusti, M.; Johnson, N.; Kolp, P.; Strubegger, M.; Valin, H.; Amann, M.; et al. The marker quantification of the Shared Socioeconomic Pathway 2: A middle-of-the-road scenario for the 21st century. Glob. Environ. Change 2017, 42, 251–267. [Google Scholar] [CrossRef] [Green Version]
  29. Riahi, K.; van Vuuren, D.P.; Kriegler, E.; Edmonds, J.; O’Neill, B.C.; Fujimori, S.; Bauer, N.; Calvin, K.; Dellink, R.; Fricko, O.; et al. The Shared Socioeconomic Pathways and their energy, land use, and greenhouse gas emissions implications: An overview. Glob. Environ. Change 2017, 42, 153–168. [Google Scholar] [CrossRef] [Green Version]
  30. Bruckner, T.; Bashmakov, I.A.; Mulugetta, Y.; Chum, H.; de la Vega Navarro, A.; Edmonds, J.; Faaij, A.; Fungtammasan, B.; Garg, A.; Hertwich, E.; Honnery, D.; Infield, D.; Kainuma, M.; Khennas, S.; Kim, S.; Nimir, H.B.; Riahi, K.; Strachan, N.; Wiser, R.; Zhang, X. Energy Systems. In Climate Change 2014: Mitigation of Climate Change. Contribution of Working Group III to the Fifth Assessment Report of the Intergovernmental Panel on Climate Change; Edenhofer, O., Pichs-Madruga, R., Sokona, Y., Farahani, E., Kadner, S., Seyboth, K., Adler, A., Baum, I., Brunner, S., Eickemeier, P., Kriemann, B., Savolainen, J., Schlömer, S., von Stechow, C., Zwickel, T., Minx, J.C., Eds.; Cambridge University Press: Cambridge, UK; New York, NY, USA, 2014. [Google Scholar]
  31. Gerst, M.D. Linking Material Flow Analysis and Resource Policy via Future Scenarios of In-Use Stock: An Example for Copper. Environ. Sci. Technol. 2009, 43, 6320–6325. [Google Scholar] [CrossRef] [PubMed]
  32. Nassar, N.T.; Barr, R.; Browning, M.; Diao, Z.; Friedlander, E.; Harper, E.M.; Henly, C.; Kavlak, G.; Kwatra, S.; Jun, C.; et al. Criticality of the Geological Copper Family. Environ. Sci. Technol. 2012, 46, 1071–1078. [Google Scholar] [CrossRef] [PubMed]
  33. Harmsen, J.H.M.; Roes, A.L.; Patel, M.K. The impact of copper scarcity on the efficiency of 2050 global renewable energy scenarios. Energy 2013, 50, 62–73. [Google Scholar] [CrossRef]
  34. Tokimatsu, K.; Wachtmeister, H.; McLellan, B.; Davidsson, S.; Murakami, S.; Höök, M.; Yasuoka, R.; Nishio, M. Energy modeling approach to the global energy-mineral nexus: A first look at metal requirements and the 2 °C target. Appl. Energy 2017, 207, 494–509. [Google Scholar] [CrossRef]
  35. Herrington, R. Road map to mineral supply. Nat. Geosci. 2013, 6, 892–894. [Google Scholar] [CrossRef]
  36. European Commission. Raw Materials Supply Group Study on the Review of the List of Critical Raw Materials; European Commission: Brussels, Belgium, 2017; p. 93. [Google Scholar]
  37. Rabe, W.; Kostka, G.; Smith Stegen, K. China’s supply of critical raw materials: Risks for Europe’s solar and wind industries? Energy Policy 2017, 101, 692–699. [Google Scholar] [CrossRef]
  38. Sprecher, B.; Reemeyer, L.; Alonso, E.; Kuipers, K.; Graedel, T.E. How “black swan” disruptions impact minor metals. Resour. Policy 2017, 54, 88–96. [Google Scholar] [CrossRef]
  39. United Nations Environment Programme. United Nations Environment Programme Decoupling Natural Resource Use and Environmental Impacts from Economic Growth; OCLC: 838605225; United Nations Environment Programme: Kenya, Africa, 2011.
  40. Prior, T.; Giurco, D.; Mudd, G.; Mason, L.; Behrisch, J. Resource depletion, peak minerals and the implications for sustainable resource management. Glob. Environ. Change 2012, 22, 577–587. [Google Scholar] [CrossRef]
  41. Mudd, G.M. The Sustainability of Mining in Australia: Key Production Trends and Environmental Implications; Monash University: Melbourne, Australia, 2009. [Google Scholar]
  42. Pehl, M.; Arvesen, A.; Humpenöder, F.; Popp, A.; Hertwich, E.G.; Luderer, G. Understanding future emissions from low-carbon power systems by integration of life-cycle assessment and integrated energy modelling. Nat. Energy 2017, 2, 939–945. [Google Scholar] [CrossRef]
  43. Christmann, P. Towards a More Equitable Use of Mineral Resources. Nat. Resour. Res. 2017, 27, 159–177. [Google Scholar] [CrossRef]
  44. Font Vivanco, D.; Kemp, R.; van der Voet, E. How to deal with the rebound effect? A policy-oriented approach. Energy Policy 2016, 94, 114–125. [Google Scholar] [CrossRef] [Green Version]
  45. Guinée, J. Life Cycle Sustainability Assessment: What Is It and What Are Its Challenges? In Taking Stock of Industrial Ecology; Clift, R., Druckman, A., Eds.; Springer International Publishing: Berlin, Germany, 2016; pp. 45–68. ISBN 978-3-319-20571-7. [Google Scholar] [Green Version]
  46. Habib, K.; Wenzel, H. Reviewing resource criticality assessment from a dynamic and technology specific perspective—Using the case of direct-drive wind turbines. J. Clean. Prod. 2016, 112, 3852–3863. [Google Scholar] [CrossRef]
  47. Pauliuk, S.; Majeau-Bettez, G.; Müller, D.B. A General System Structure and Accounting Framework for Socioeconomic Metabolism: General System Structure for Society’s Metabolism. J. Ind. Ecol. 2015, 19, 728–741. [Google Scholar] [CrossRef]
  48. Fischer-Kowalski, M.; Haberl, H. Sustainable development: Socio-economic metabolism and colonization of nature. Int. Soc. Sci. J. 1998, 50, 573–587. [Google Scholar] [CrossRef]
  49. England, J.L. Dissipative adaptation in driven self-assembly. Nat. Nanotechnol. 2015, 10, 919–923. [Google Scholar] [CrossRef]
Figure 1. Annual new capacities, electricity production, and end-of-life capacities of electricity-generating technologies, in the baseline scenario (left) and 2 °C scenario (right). CCS: With carbon capture and sequestration technologies. Data are found in Supplementary Material (Table S2).
Resources 08 00033 g001
Figure 2. Use of fossil fuels, metallic and nonmetallic mineral resources in electricity-generating technologies during their construction (i), operation (ii), and decommissioning (iii) phases, as well as the total amount (iv) in the baseline and 2 °C scenarios (in Tg/yr, or teragrams per year). (a) Metallic materials; (b) Nonmetallic materials; (c) Fossil fuels; (d) Total. Full data can be found in Supplementary Material (Table S3).
Resources 08 00033 g002
Figure 3. Relative increase (×100%) in the material use during decade p (horizontal axis) in the baseline scenario (BAU) compared to decade 2020 (a); in the 2°C scenario compared to decade 2020 (b); in the baseline scenario compared to decade (p-1) (c); in the 2°C scenario compared to decade (p-1) (d); and material use ratio between the 2°C and baseline scenarios (e). Trace elements, for which total usage is less than one metric ton, are not reported. Full data are in Supplementary Material (Table S3).
Resources 08 00033 g003

