Article

Enough Metals? Resource Constraints to Supply a Fully Renewable Energy System

by
Vincent Moreau
1,*,
Piero Carlo Dos Reis
2 and
François Vuille
2
1
Laboratory of Environmental and Urban Economics, Ecole Polytechnique Fédérale de Lausanne, Route Cantonale, 1015 Lausanne, Switzerland
2
Energy Center, Ecole Polytechnique Fédérale de Lausanne, Route Cantonale, 1015 Lausanne, Switzerland
*
Author to whom correspondence should be addressed.
Resources 2019, 8(1), 29; https://doi.org/10.3390/resources8010029
Submission received: 31 October 2018 / Revised: 21 January 2019 / Accepted: 23 January 2019 / Published: 31 January 2019

Abstract

:
The transition from a fossil fuel base to a renewable energy system relies on materials and, in particular, metals to manufacture and maintain energy conversion technologies. Supply constraints shift from fossil fuels to mineral resources. We assess the availability of metal reserves and resources to build an energy system based exclusively on renewable energy technologies. A mass balance of 29 metals embodied in renewable energy technologies is compiled in order to satisfy global energy demand, based on five authoritative energy scenarios for 2050. We expand upon these scenarios by modeling the storage capacity needed to support high shares of intermittent renewables (wind and solar). The metal requirements are then compared with the current demand and proven reserves and ultimate mineable resources. This allows us to distinguish between constraints related to renewable energy sources from those linked to technology mixes. The results show that proven reserves and, in specific cases, resources of several metals are insufficient to build a renewable energy system at the predicted level of global energy demand by 2050. The comparison between reserves and resources shows that scarcity relates sometimes more to techno economic supply than to raw material availability. Our results also highlight the importance of substitution among technologies and metals as well as the limited impact of recycling on the depletion of scarce metals.

1. Introduction

The current energy system relies overwhelmingly on fossil fuels, with the associated combustion technologies and storage facilities. A very different system, based on renewable energy sources, must be built by 2050 to drastically reduce carbon emissions and avert catastrophic climate change [1]. Renewable energy (RE) sources, including solar, wind, hydropower, geothermal energy, and biomass, must be converted by renewable energy technologies to cover the final energy demand for heating and transportation fuels, as well as for electricity. These RE technologies have to be manufactured and maintained, which requires a flow and stock of mineral resources and, in particular, metals. In other words, attention is shifting away from oil, gas and coal reserves, which need to stay in the ground, to the reserves of metals required in the transition to a low carbon energy system [2,3,4].
Reserves are what can be extracted economically with current technology and available energy. Resources are the amount of ore known (proven, probable or potential) in the Earth’s crust which become available as technology and prices evolve. This means that future reserves are found in today’s resources, but changes in the energy cost of extraction for example, could also mean that current reserves become future resources [5]. The number of elements utilized by human activities has grown sharply, in particular for transition metals for manufacturing electronics and RE technologies [6].
Thus, the transition towards a fully renewable energy system places additional pressure on the main mineral resources, as well as on specialty metals [7,8,9]. However, unlike fossil fuels which are chemically degraded by combustion in the current energy system, metals in RE technologies retain their properties and can in principle be recycled. This offers greater potential for a circular economy, provided sufficient metal resources are available to build this new energy system. A lot of research already exists on the metal stocks and flows associated with new technologies including renewable energy ones [7,10,11,12,13,14,15,16,17,18]. However, none address the issue of metal scarcity from a comprehensive perspective, that is, by comparing jointly the global demand from industry to reserves and resources of the main and specialty metals for multiple RE technologies. Among the key attempts, Kleijn et al. [19] and Vidal et al. [20] assessed the material and mineral implications of switching from fossil fuels to low carbon technologies. While their results show that low-carbon sources of electricity require more metals and minerals, they did not compare this growing demand with current reserves and resources. Similarly, Vesborg and Jaramillo [21] estimated the volume of metals required to generate one TWh of final energy from a range of clean energy technologies without addressing scarcity or future energy demand.
The supply of metals depends on specific geological, physical and industrial conditions, such that one metric of supply does not fit all metals. Thus, supply constraints are often performed individually and per application, such as cadmium (Cd), tellurium (Te), indium (In), gallium (Ga) or selenium (Se) for thin film solar cells like cadmium–telluride (CdTe) or copper–indium–gallium–selenide (CIGS) [22,23,24,25]. In addition, the supply of these metals depends to a large extent on the extraction of parent metals such as copper, zinc, tin or aluminum and must be evaluated as such [26,27,28].
On the demand side, Kavlak et al. [29] quantified the metal requirements for large scale deployment of photovoltaics (PVs) according to energy scenarios, as well as from historical production/consumption of the different metals found in PV panels. They conclude that demand for indium, selenium and tellurium might limit the thin film PV industry as early as 2030. Grandell and Thorenz [30] reached a similar conclusion for silver (Ag). The availability of dysprosium (Dy) might also hinder the manufacturing of permanent magnets for wind turbines [17]. More generally, Harmsen et al. [31] evaluated the potential scarcity of copper (Cu) for long term global renewable energy scenarios (2050). Similarly, Elshkaki [32] concluded through dynamic material flow analysis, that resources of platinum (Pt) would be depleted before the end of this century. The supply of other metals such as cobalt (Co) [33] and lead (Pb) [34] might be less affected because they are recoverable from multiple sources.
Among the most comprehensive evaluations of metal use for RE technologies, Elshkaki and Graedel [11] quantified the availability of different metals used for wind turbines, PV panels, concentrated solar power (CSP), hydropower, geothermal, biomass, coal, oil, gas, and nuclear power under policy and market-based scenarios for 2050. They conclude that the manufacturing and replacement of wind turbines may not face major resource constraints, whereas the production of PV panels is potentially more problematic. Tellurium in particular might become critical in terms of resource availability and production capacity for CdTe panels. Yet, this study falls short of accounting for the metal constraint of a fully renewable energy system and excludes an important subset of metals, the platinum group metals (PGMs), which might prove critical.
We build on the work of Vidal et al. [7,20] and Habib et al. [35] who estimated the demand for main metals and rare earths respectively, in several renewable energy scenarios. We systematically estimate the demand for a set of 29 metals necessary for manufacturing and replacing RE technologies. Moreover, we use well established scenarios of energy supply and demand for 2050 which rely on 100% renewable energy sources, or with a small share of non-renewables. We also estimate the short-term storage requirements of intermittent sources, namely PV and wind, and account for the necessary battery technologies. Finally, we simulate different combinations of renewable energy and battery storage technologies to estimate the impact of the technology mix on metal scarcity. We then evaluate the metal scarcity by comparing the requirements for these scenarios and technology mixes with current extraction rates as well as current reserves and ultimate mineable resources. To evaluate the relative supply constraints of each metal, we compute their respective depletion horizon in terms of reserves and resources by considering the demand from both energy and non-energy industries. However, we focus exclusively on the energy supply side of energy-related activities, although the evolution of energy demand side technologies, such as electric vehicles, necessarily influence the demand for metals as well. We assume that the supply chains of metals are equally global as that of oil and gas, with potentially new cartels and regional disparities in resource supply [4,36]. In this sense, our results are based on a mass balance analysis, comparing supply and demand volumes, without addressing economic issues.
This comprehensive evaluation of the availability of energy metals is organized as follows: Section 2 details the methodological approach. In Section 3, we present our results and the impacts of energy and technology scenarios. Section 4 discusses these results and we conclude in Section 5.

2. Materials and Methods

To evaluate the potential supply constraints of metals, we estimate depletion horizons, or the year when reserves and resources would be depleted, should the deployment of a global and fully renewable energy system take place. While reserves and resources of metals are regularly re-evaluated alongside extraction, depletion horizon provides a common measure of scarcity. We consider the main renewable energy technologies as well as the stationary batteries needed to balance electricity generation from intermittent renewables (wind and solar). Although battery electric vehicles can also store electricity temporarily, in their first or second life, we ignore this possibility for now [37]. In order to estimate the extent to which the demand from renewable energy industries will impact the extraction of metals, we include the current demand from incumbent economic activities, such as electronics and aerospace which compete for the same metals.
Metal scarcity can be defined as follows: A steady decrease in the global average grade of ores extracted over time and an increase in prices of extracted metals which cannot be compensated by improving and upgrading mining technologies [38]. Improvements in mining technologies compensate for declining ore grades, but the energy cost of extraction keeps growing, with potential impacts on renewables [39]. Thus, we model different technology mixes for photovoltaics, wind, biomass, and storage technologies to assess substitution opportunities for the renewable energy industry. Five different battery chemistries were taken into account for intraday electricity storage.
The methodological approach can be divided into four steps. First we select five scenarios of global energy supply or demand in 2050, broken down by energy sources. These scenarios account for changes in demand for energy as a result of population and economic growth as well as energy efficiency and subject to the potential of renewable sources. Second, we integrate sub-scenarios of renewable energy technologies including solar PV and battery chemistries for storage. Third, we quantify the amount of each metal needed to manufacture and maintain renewable energy technologies in each of the five scenarios by taking the life cycle inventory of each technology and metal (kg/kWh) and scaling the metal requirements according to each scenario. We ignore potential resource productivity gains, as the rate of changes required in the energy system to meet emissions targets by 2050 will likely outpace productivity. In the fourth and last step, we compare the annual demand for metal with reserves and resources, assuming a renewable energy system is deployed linearly by 2050. Although recycling has little impact as demand grows and the energy system is implemented, we nonetheless included several recycling scenarios. Indeed, PV technologies for example have already witnessed their first lifecycle.

2.1. Energy Scenarios

Two well-established scenarios attempt to estimate global energy demand based exclusively on renewables: an IPCC scenario and one that results from the work of Ecofys and WWF [40,41]. We also include three scenarios with a high share of renewables: the International Energy Agency’s “High RE” and “2 degree” scenarios, as well as the International Renewable Energy Agency (IRENA) “REMAP” scenario [42,43]. All of them have the same time horizon of 2050 but different estimates of global energy demand. They also differ on the share of each renewable (and non-renewable) energy source, such that they provide a measure of uncertainty in the energy supply and demand and the metals required to manufacture and maintain renewable energy technologies (see Figure 1).

2.2. Renewable Energy Technology Scenarios

The scenarios in Figure 1 estimate global energy demand in 2050 together with supply per energy source. Forecasting the mix of technologies per energy source, such as that of PV technologies, is challenging not only because technology improves continuously but more importantly because a range of technologies normally co-exist, in particular for solar, wind, biomass or battery storage. Given the metals needed to manufacture each technology, the mixes require different quantities and often also qualities of metals. Thus, we used sub-scenarios of renewable energy technologies for solar PV, biofuels and battery energy storage as explained below. All scenarios already accounted for the potential of onshore and offshore wind power.

2.2.1. Solar PV Scenarios

The current market for photovoltaic (PV) panels is dominated by mono- and multi-crystalline silicon solar cells for which life cycle inventory (LCI) data exists [44]. IRENA forecasts that market shares of second generation thin film solar cells (CdTe, CIGS) will slowly increase to make up approximately 10% of the market in 2030 [45]. Thus, the PV technology mix here includes close to 90% of crystalline silicon, with multi-layered panels accounting for two-thirds. The remainder is split approximately equally between CdTe and CIGS technologies for which data also came from the ecoinvent LCI database [46]. In these inventories, the lifetime of PV panels are approximately 30 years. Thus, we concentrate on commercial PV technologies and do not consider future technologies such as Perovskites given the uncertainty regarding their deployment.

2.2.2. Biofuels

We consider second generation biofuels and the corresponding LCI data is relatively well documented. Although the impact of biomass would have to be regionalized, we only consider the metal requirements, especially catalysts, for biorefinery processes and no regional disparities. The use of biogas for transportation remains marginal and a mix of biodiesel and ethanol dominate the market [47]. In Figure 1, energy from biomass, including biofuels and the generation of heat and electricity are aggregated into a single category.

2.2.3. Storage Technologies

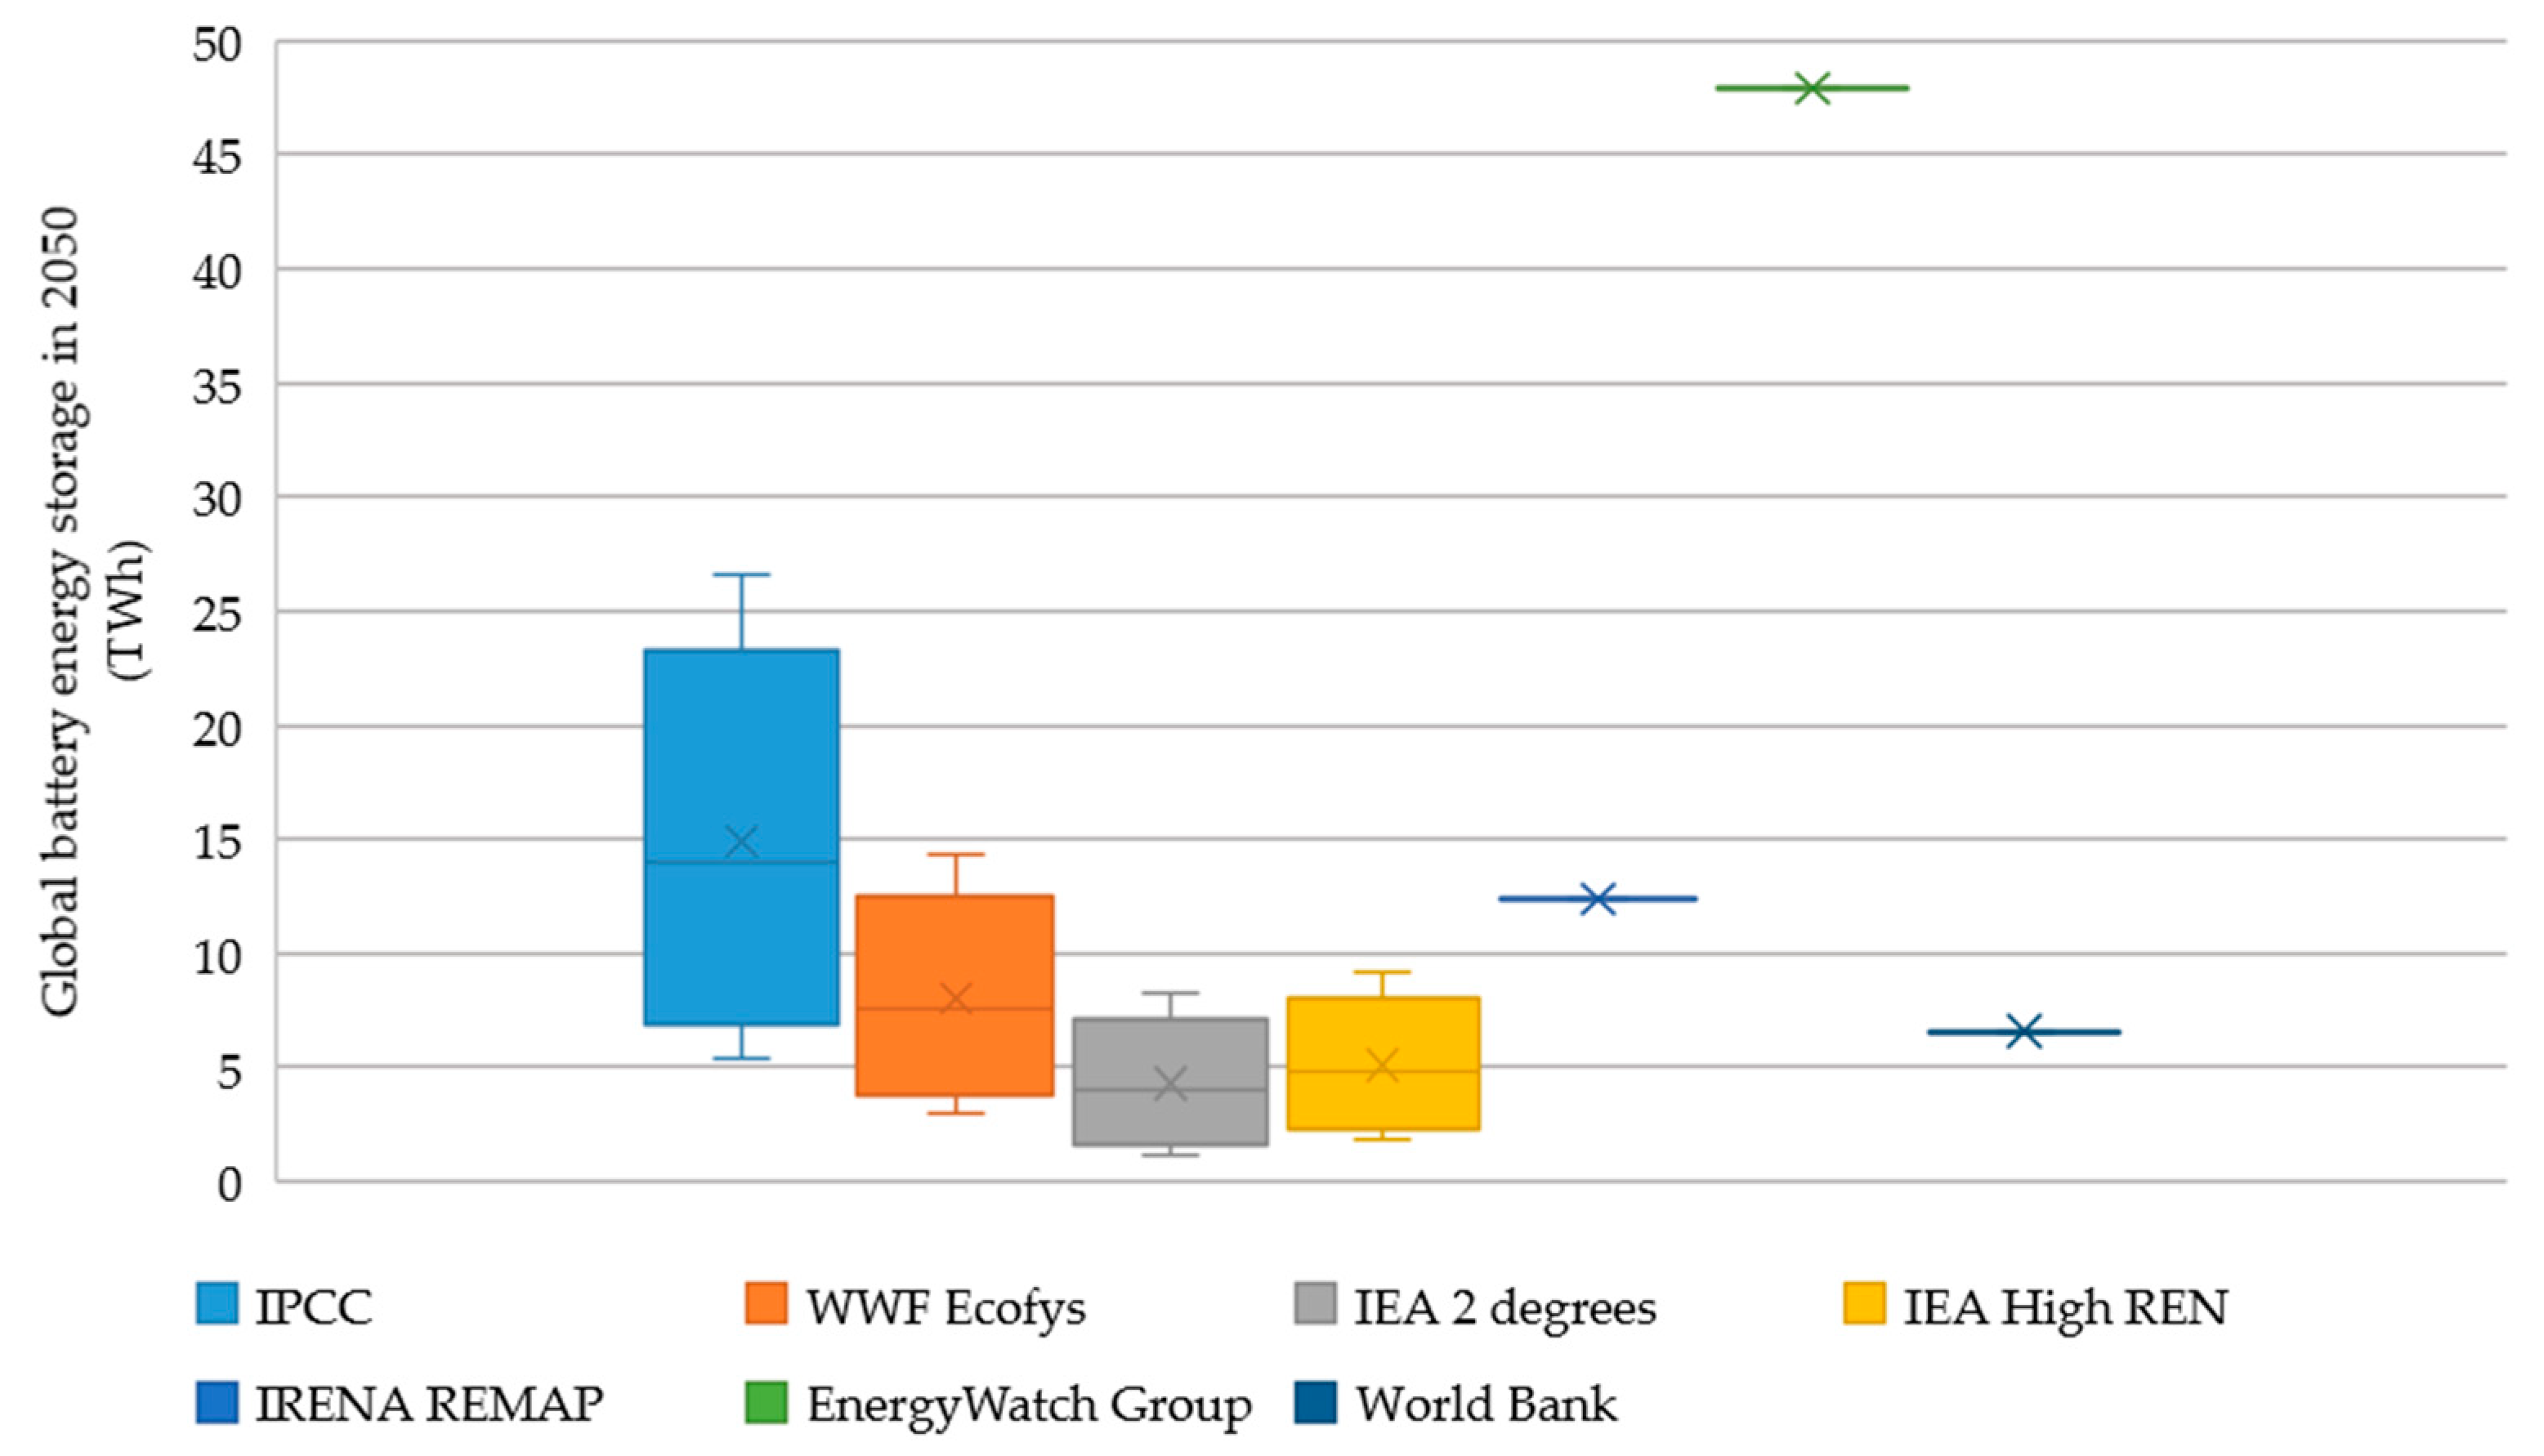
Intermittent renewable energy sources, namely solar and wind, require some forms of storage to balance supply and demand. The need for storage technologies increases non-linearly with the penetration of intermittent renewables. Many storage technologies, including batteries, also require specialty metals [48]. In Europe, the electricity surplus from renewable energy sources (approximately 40 TWh per year) is either curtailed, sold to neighboring countries or stored in pumped hydro and storage (PHS) plants [49]. Storage clearly depends on regional potential and installed capacity of solar and wind, as well as on the level of flexibility of the electric system (power plants, transportation grid, demand response). Therefore, in order to estimate the storage requirements regionally and globally, we derived the daily solar and wind profiles as well as the loads of five regions (EU, US, India, Brazil, and South Africa), representative of the five continents over a full year [50,51]. India represents Asia Pacific on its own for the lack of open data to model such profiles for China. Storage requirements were estimated by the daily surplus of renewable electricity in each region. The regionalized versions of the scenarios in Figure 1 were then used to scale up these storage requirements. We only considered intraday electricity storage, which can itself be covered by several technologies, centralized and decentralized [52]. We assumed that 50% of this storage would be covered by decentralized batteries and simulated three different mixes of five battery chemistries, including one non-lithium technology, for which LCI data is available [46,53,54] (see Appendix A for details). The estimated global storage requirements per scenario are given in Figure 2. For comparison purposes, we also show other estimates by IRENA, the Energy Watch Group and the World Bank [3,43,55].

2.3. Metal Inventory of Renewable Energy Technologies

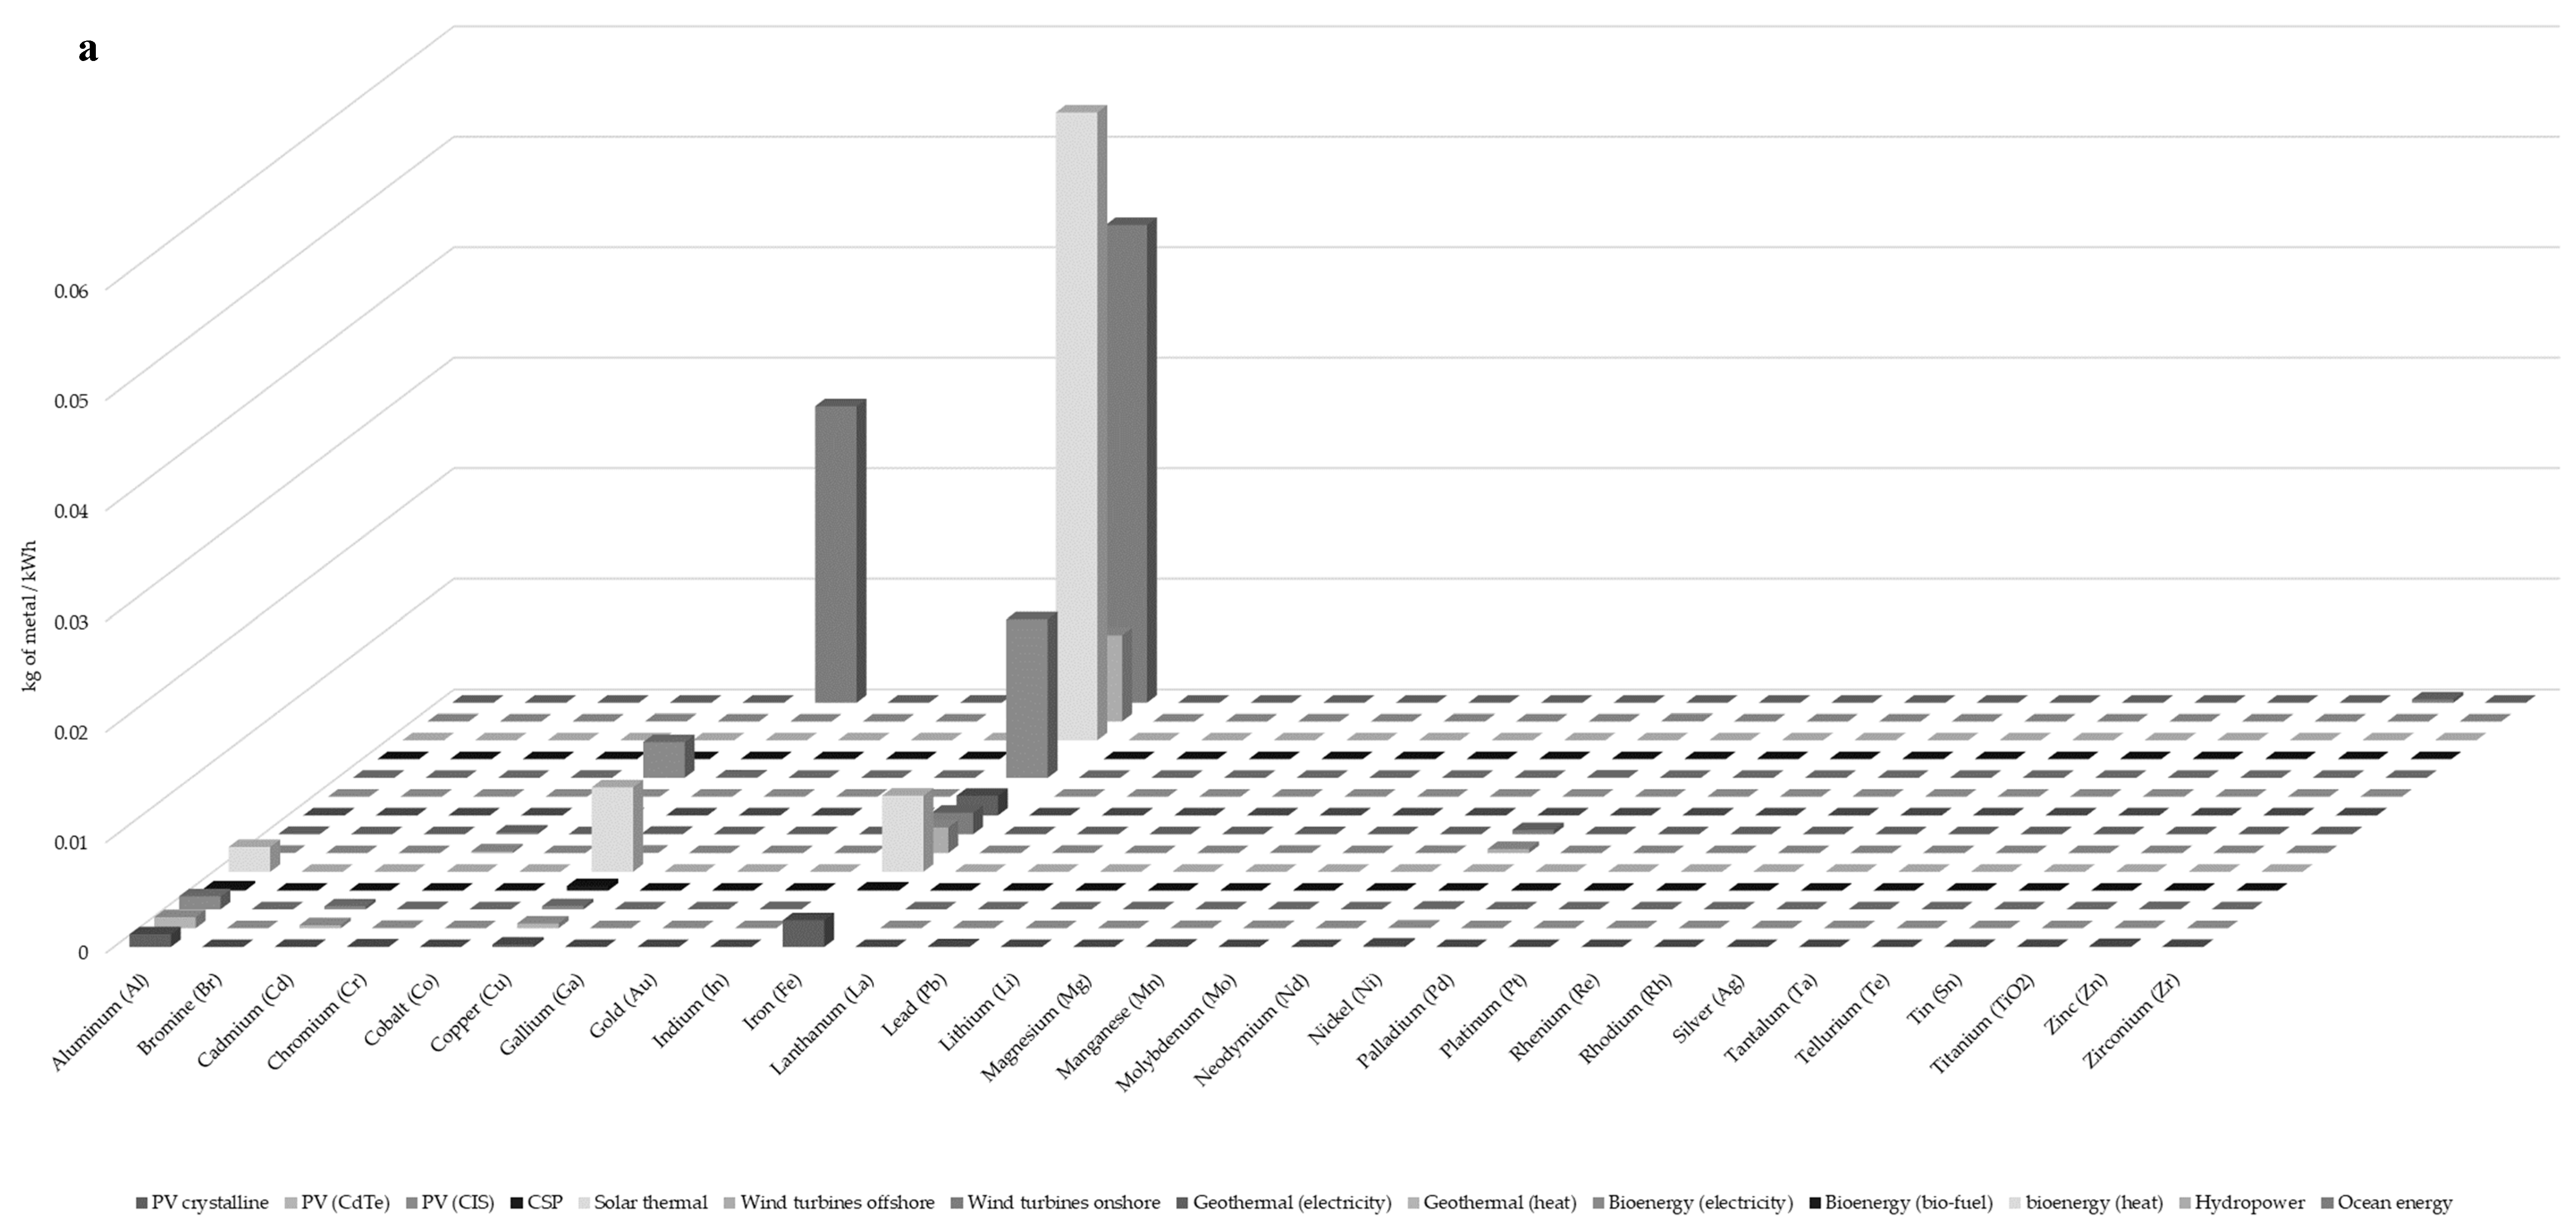
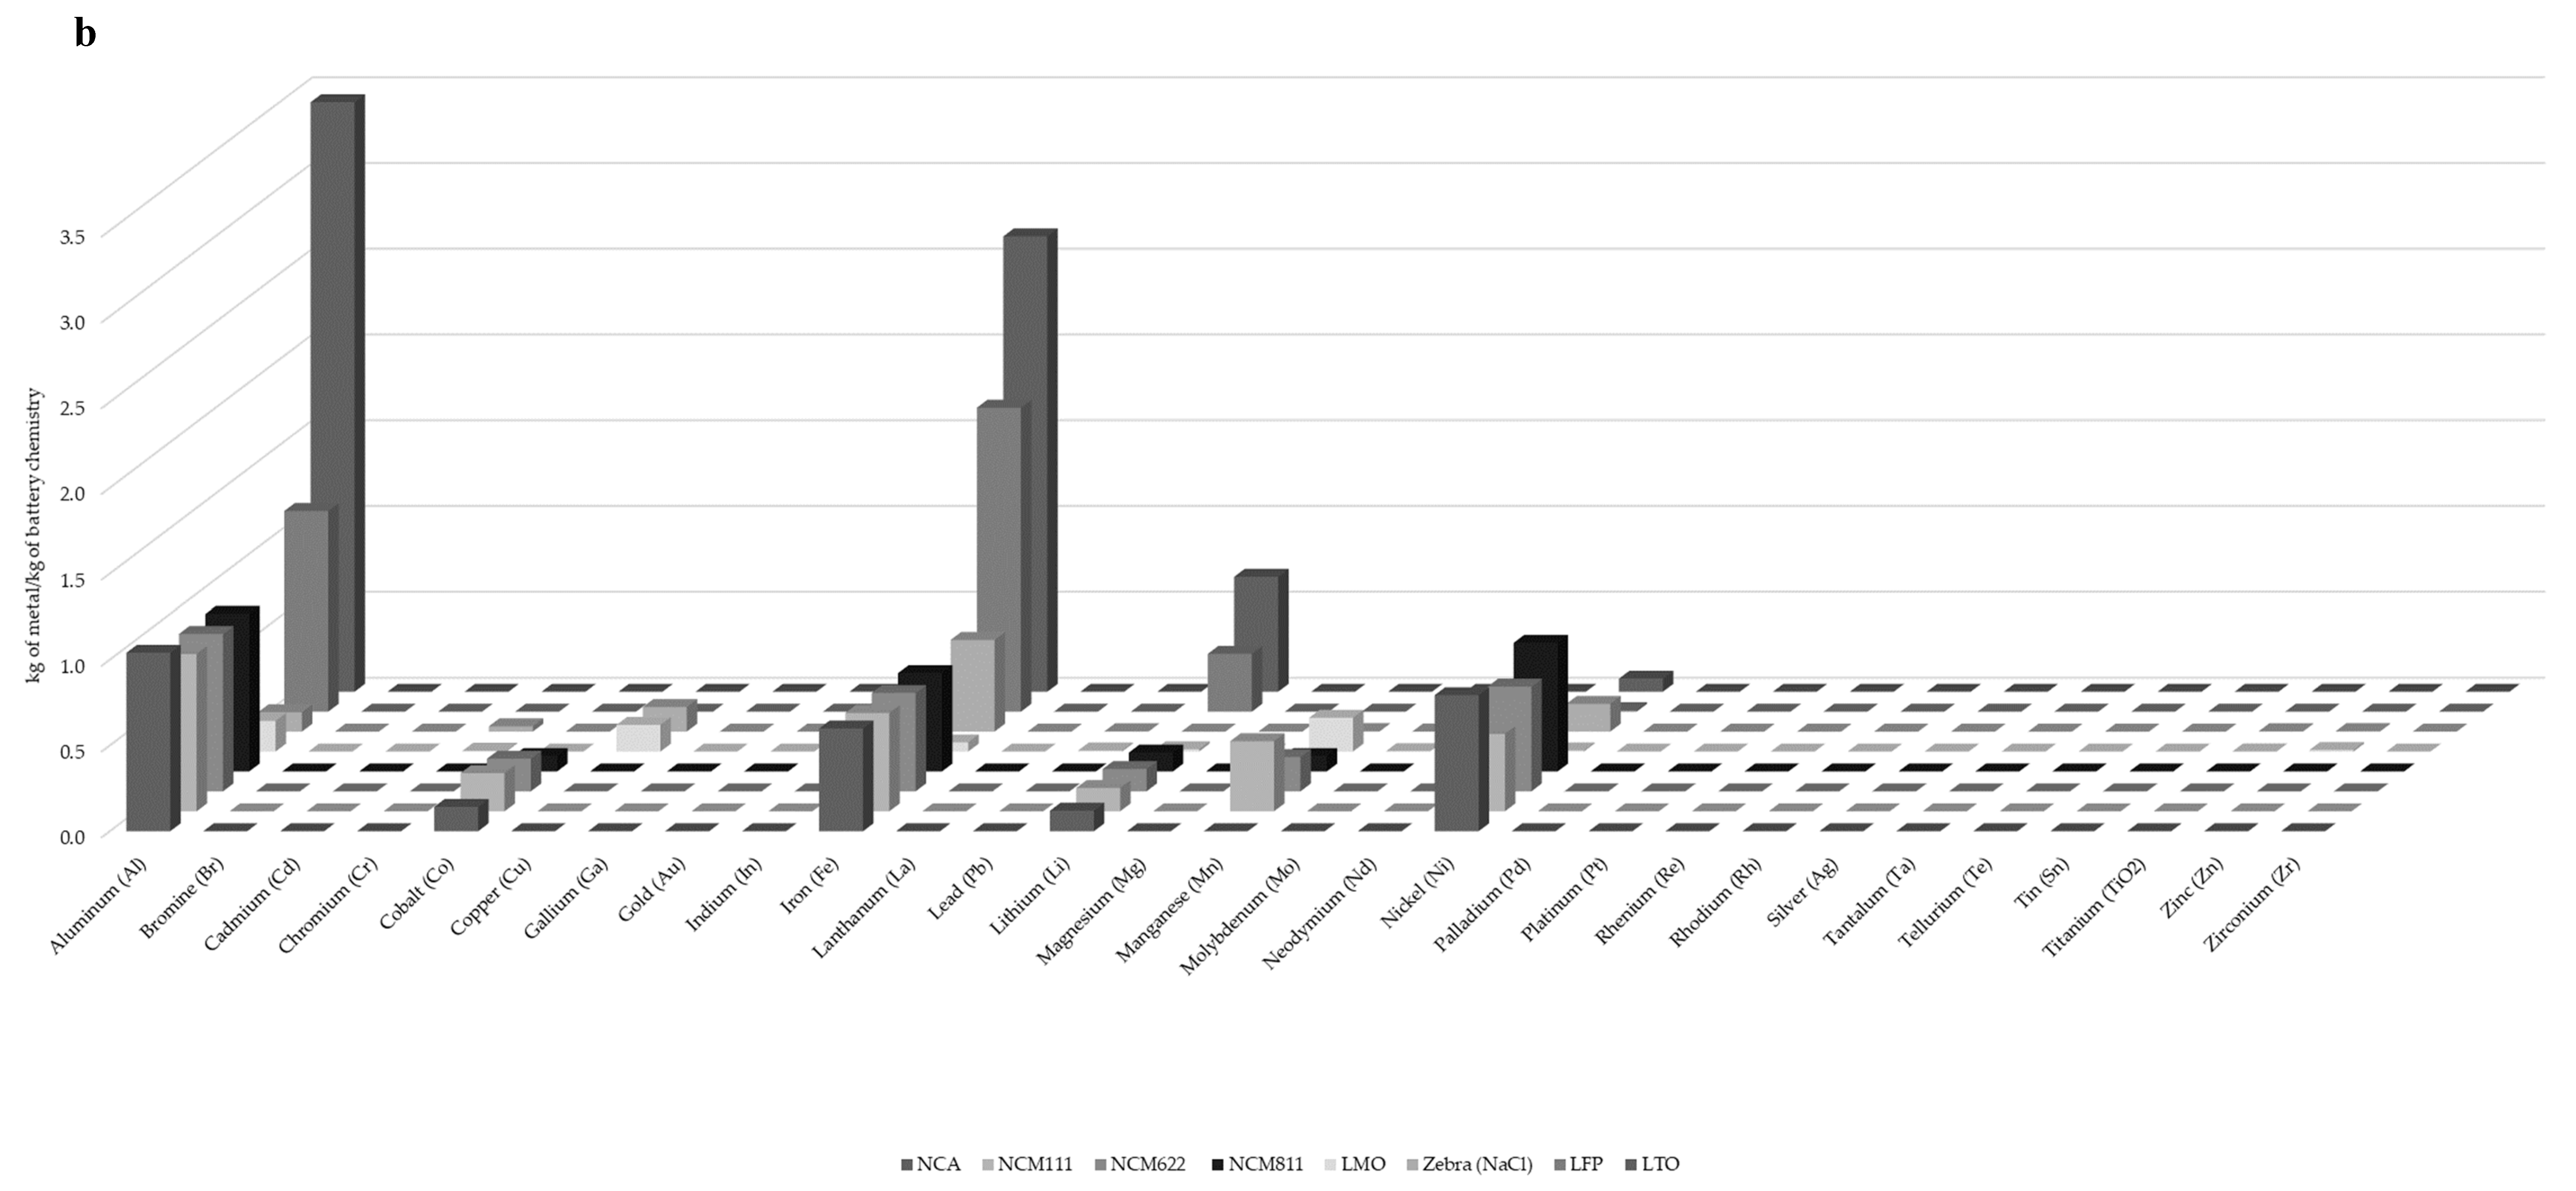
The metals embodied in each renewable energy technology were quantified based on a life cycle perspective. In life cycle inventory (LCI) or impact assessment (LCIA), products (goods and services) are modeled with respect to their functions and measured by a functional unit. In the case of RE technologies, the functional unit is 1 kWh, such that LCI data sets provide the life cycle metal requirements per kWh. Data sets were sourced from the ecoinvent LCI database version 3 [46] which inventories 29 metals found in RE technologies (as shown in Figure 3). The data sets are so called “cradle to gate”, meaning they account not only for the metals in the technology itself, but also those used for its manufacturing, installation, end of life, as well as its connection to the closest point of distribution (e.g., connection to the grid for wind turbines and PV panels) over the lifetime of the technology. Thus, we used intensities in kg of metal per functional unit and technology before scaling to the global energy system using the energy and technology scenarios above. For technologies that are not available in the ecoinvent database (e.g., emerging battery chemistries), we estimate their metal inventory based on literature references [48,53,56,57]. The metal intensity of each technology is summarized in Appendix B and details are available in supplementary data [58].

2.4. Metal Demand, Reserves and Resources

We model the energy system in 2050 and assume, for the sake of simplicity, a linear rate of deployment of RE technologies between 2017 and 2050. The model is not dynamic and targets the state of the energy system in 2050. To emphasize the growing demand for metals from RE technologies, we compare it with the aggregate demand from incumbent industries, which we assume to remain constant. In other words, we assume that high productivity gains for specialty metals in non-energy applications will offset part of the growth in demand. We also test the sensitivity of recycling rates, using four different recycling scenarios: (1) Current recycling rates for each metal remain unchanged for 2050 (conservative estimate) [59]. (2) A moderate 5% increase in recycling rates for each metal, between now and 2050, and (3) a more aggressive 50% increase is applied uniformly. (4) Specialty metals are recycled at the current rates of their parent metals, which are assumed to remain unchanged for 2050 (as in scenario 1), according to the wheel of metals by product [60,61]. A list of recycling rates for each metal and scenario is available in Appendix C.
The demand for metals from both the deployment of renewables and incumbent activities is then compared to the current reserves and resources reported by the US Geological Survey (USGS) [62]. The USGS defines resources as the “concentration of naturally occurring solid, liquid, or gaseous material in or on the Earth’s crust in such form and amount that economic extraction of a commodity from the concentration is currently or potentially feasible”. Reserves refer to “that part of an identified resource that meets specified minimum physical and chemical criteria related to current mining and production practices, including those for grade, quality, thickness, and depth”. Where USGS estimates are aggregated for rare earths and PGMs, we disaggregate by metal based on the literature [18]. The difference between reserve and resource estimates illustrate some of the technical and economic constraints in bringing metals to markets which may stimulate material or technology substitutions.
Finally, we compute the ratio of reserves, respectively resources, over total demand up to 2050 measured by the sum of the growing demand from renewable energy technologies and the current demand from incumbent industries. Recycling simply reduces total demand, as in open loop recycling rather than displacing the demand for primary sources from renewable energy itself. The results yield a depletion horizon for each of the 29 metals and five scenarios. The demands from energy and technology scenarios translate into ranges of depletion horizons per metal and provide a measure of uncertainty.

3. Results

The results show that some metals are sufficiently scarce to set limits to the deployment of a fully renewable energy system before 2050. In this section, we present the results for reserve and resource depletion separately for comparison purposes, with the same mix of storage technologies including the five battery chemistries covering the average battery requirements, as shown in Figure 2. The current recycling rates are used and we then illustrate more specifically the impacts of recycling and storage scenarios for the scarcest of the metals. The corresponding cumulative metal demands are listed in Appendix D and the details are available in the Supplementary data.

3.1. Depletion Horizons of Metal Reserves

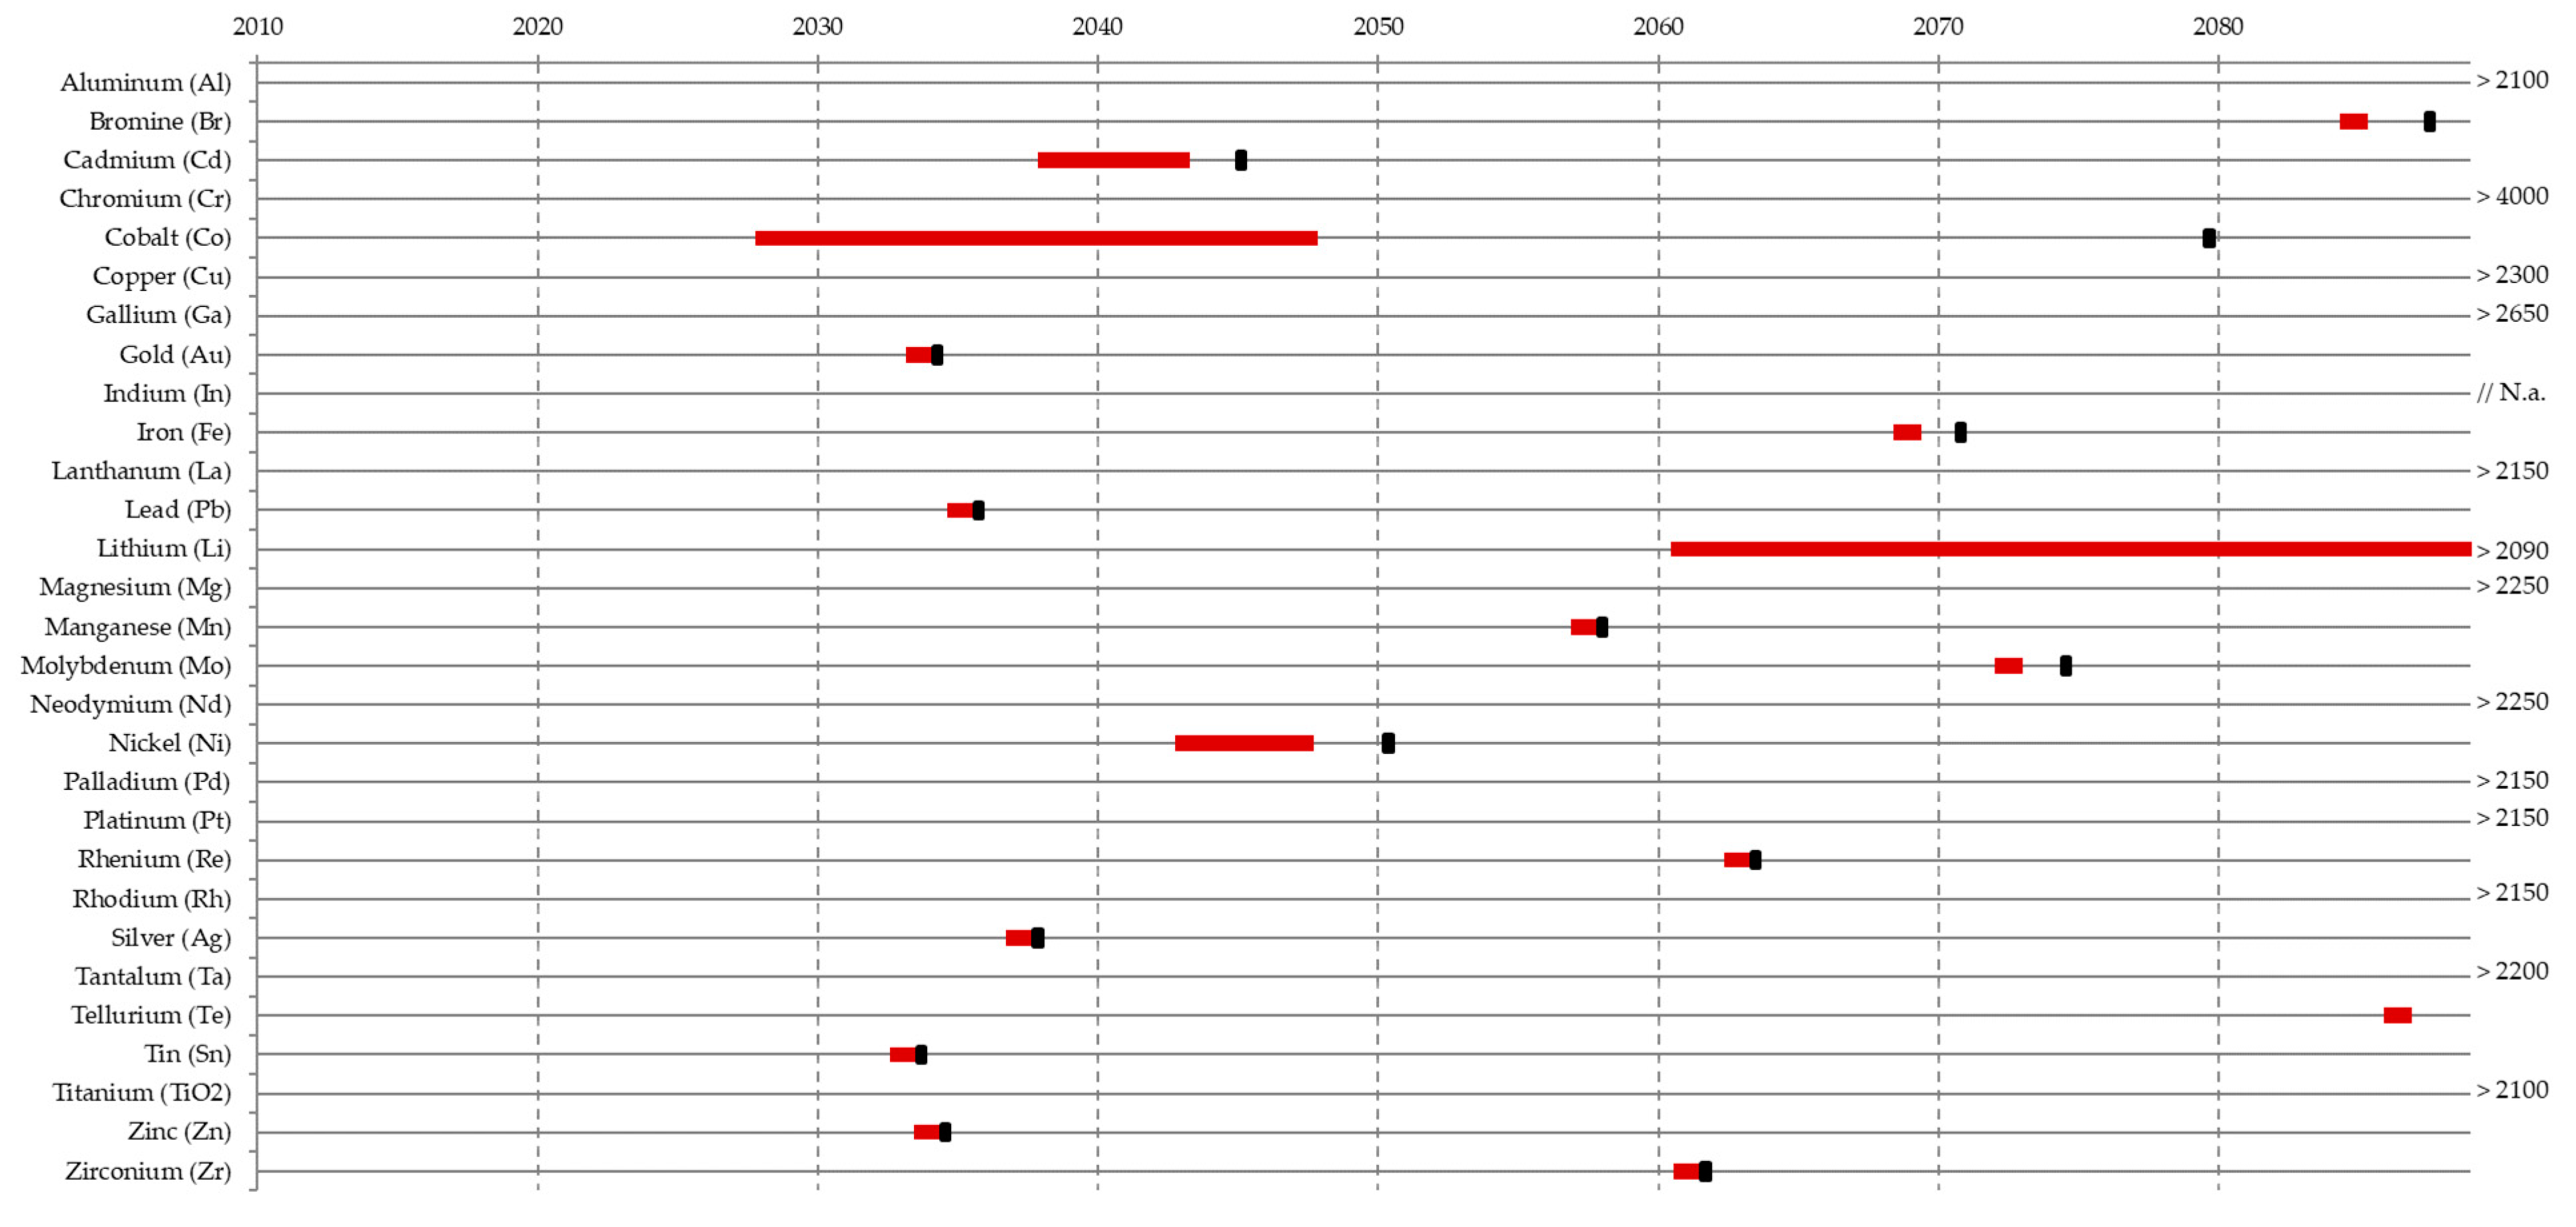
Figure 3 shows the ranges (in red) of depletion horizons for each metal across the five energy scenarios in Figure 1 if we were to deploy a fully renewable energy system by 2050. The black dots indicate the depletion years given the current demand alone, that is, without the deployment of a renewable energy system. For example, the ranges (in red) shift to the left of the depletion horizons for cadmium (Cd), cobalt (Co), lithium (Li) and Nickel (Ni) reserves, which indicates that renewable energy technologies will absorb a significant part of these metals in comparison with the demand from other, non-energy applications.
Figure 3 also shows that the reserves of eight metals (Cd, Co, Au, Pb, Ni, Ag, Sn, Zn) are likely to be depleted before a renewable energy system can be deployed on a large scale in 2050. This is irrespective of the energy or technology scenarios and the level of energy demand. The depletion ranges for Cd, Co and Ni are longer, meaning greater uncertainty. Lithium (Li) reserves also exhibit a long depletion range between 2060 and the end of the century, that depends on the energy and storage scenarios. It is important to note that for some of these scarce metals (Cd, Co, Li, Ni), the deployment of a renewable energy system moves the depletion horizons closer from that set by incumbent (non-energy) industries (red bars and black dots differ). Competition for these metals might thus become a reality in the coming decades between traditional and new energy industries.
Other metals fare better with a depletion horizon beyond 2100 and should not experience any foreseeable supply constraints. Unfortunately, reserve data is missing for indium (In) such that we cannot conclude at this stage. The cumulative metal demands underlying the results in Figure 3 (and Figure 4) are available in Appendix D.

3.2. Depletion Horizons of Metal Resources

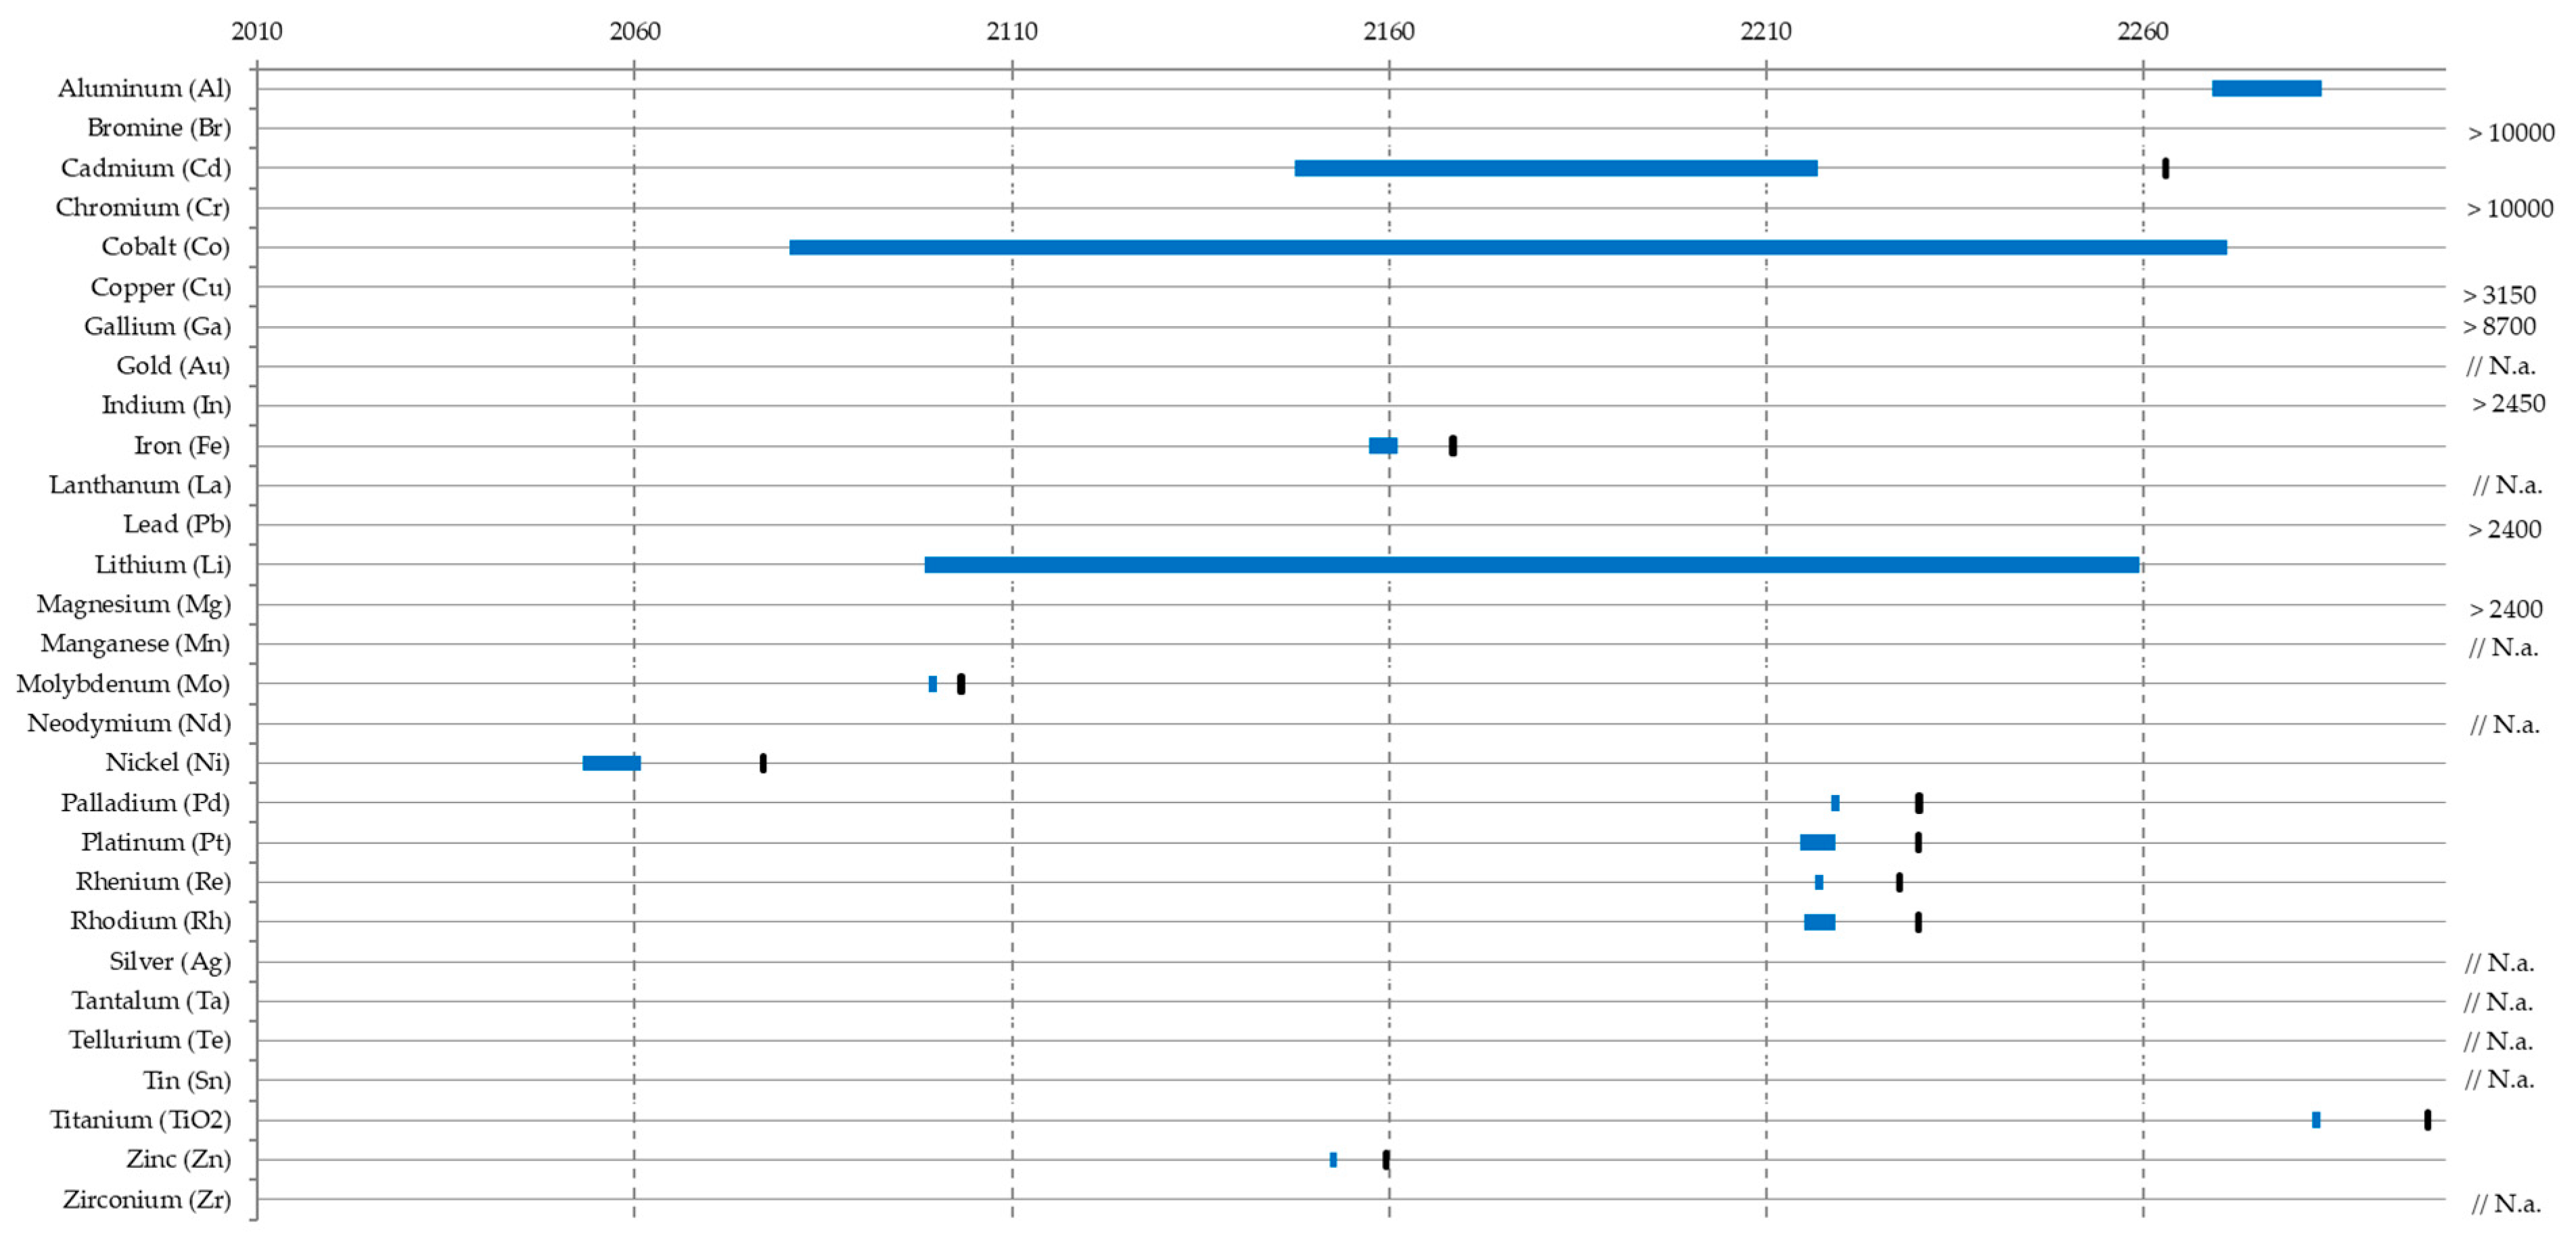
Resources are more abundant than reserves by definition and less subject to techno-economic changes. Hence, resources represent a more absolute measure of scarcity than reserves. The difference with reserves essentially shows the challenge for exploration and exploitation technologies to respond to changes in demand. Figure 4 shows the depletion horizons based on resources for the 29 metals. It shows that five of them (Cd, Co, Li, Mo and Ni) are scarce in resource terms. Moreover, it is the additional demand from the deployment of renewables that makes a significant difference for Cd, Co, Li and Ni. Cd, Co and Li also exhibit long depletion ranges across scenarios which means substitution in generation and storage technologies might alleviate such problems.
Another two metals (Pb and Zn) were shown to be scarce based on reserves in Figure 3, but are relatively abundant in terms of resources. Thus, short-term constraints on the availability of these metals is mostly due to a market imbalance and might be addressed with exploration and advanced extraction technologies to align production capacities with demand in the medium term. Unfortunately, data on resources is missing for nine metals (Au, La, Mn, Nd, Ag, Ta, Te, Sn and Zr), several of which were identified as scarce based on reserves.
Although some metals are scarce, most of the available resources shown in Figure 4 can last well beyond our foreseeable future. In addition, the extended ranges (in blue) for some scarce metals suggest that substitutes are likely to be found before resource constraints arise. Besides substitution, technology scenarios also have an impact, in particular for storage and recycling as explained below.

3.3. Storage Scenarios

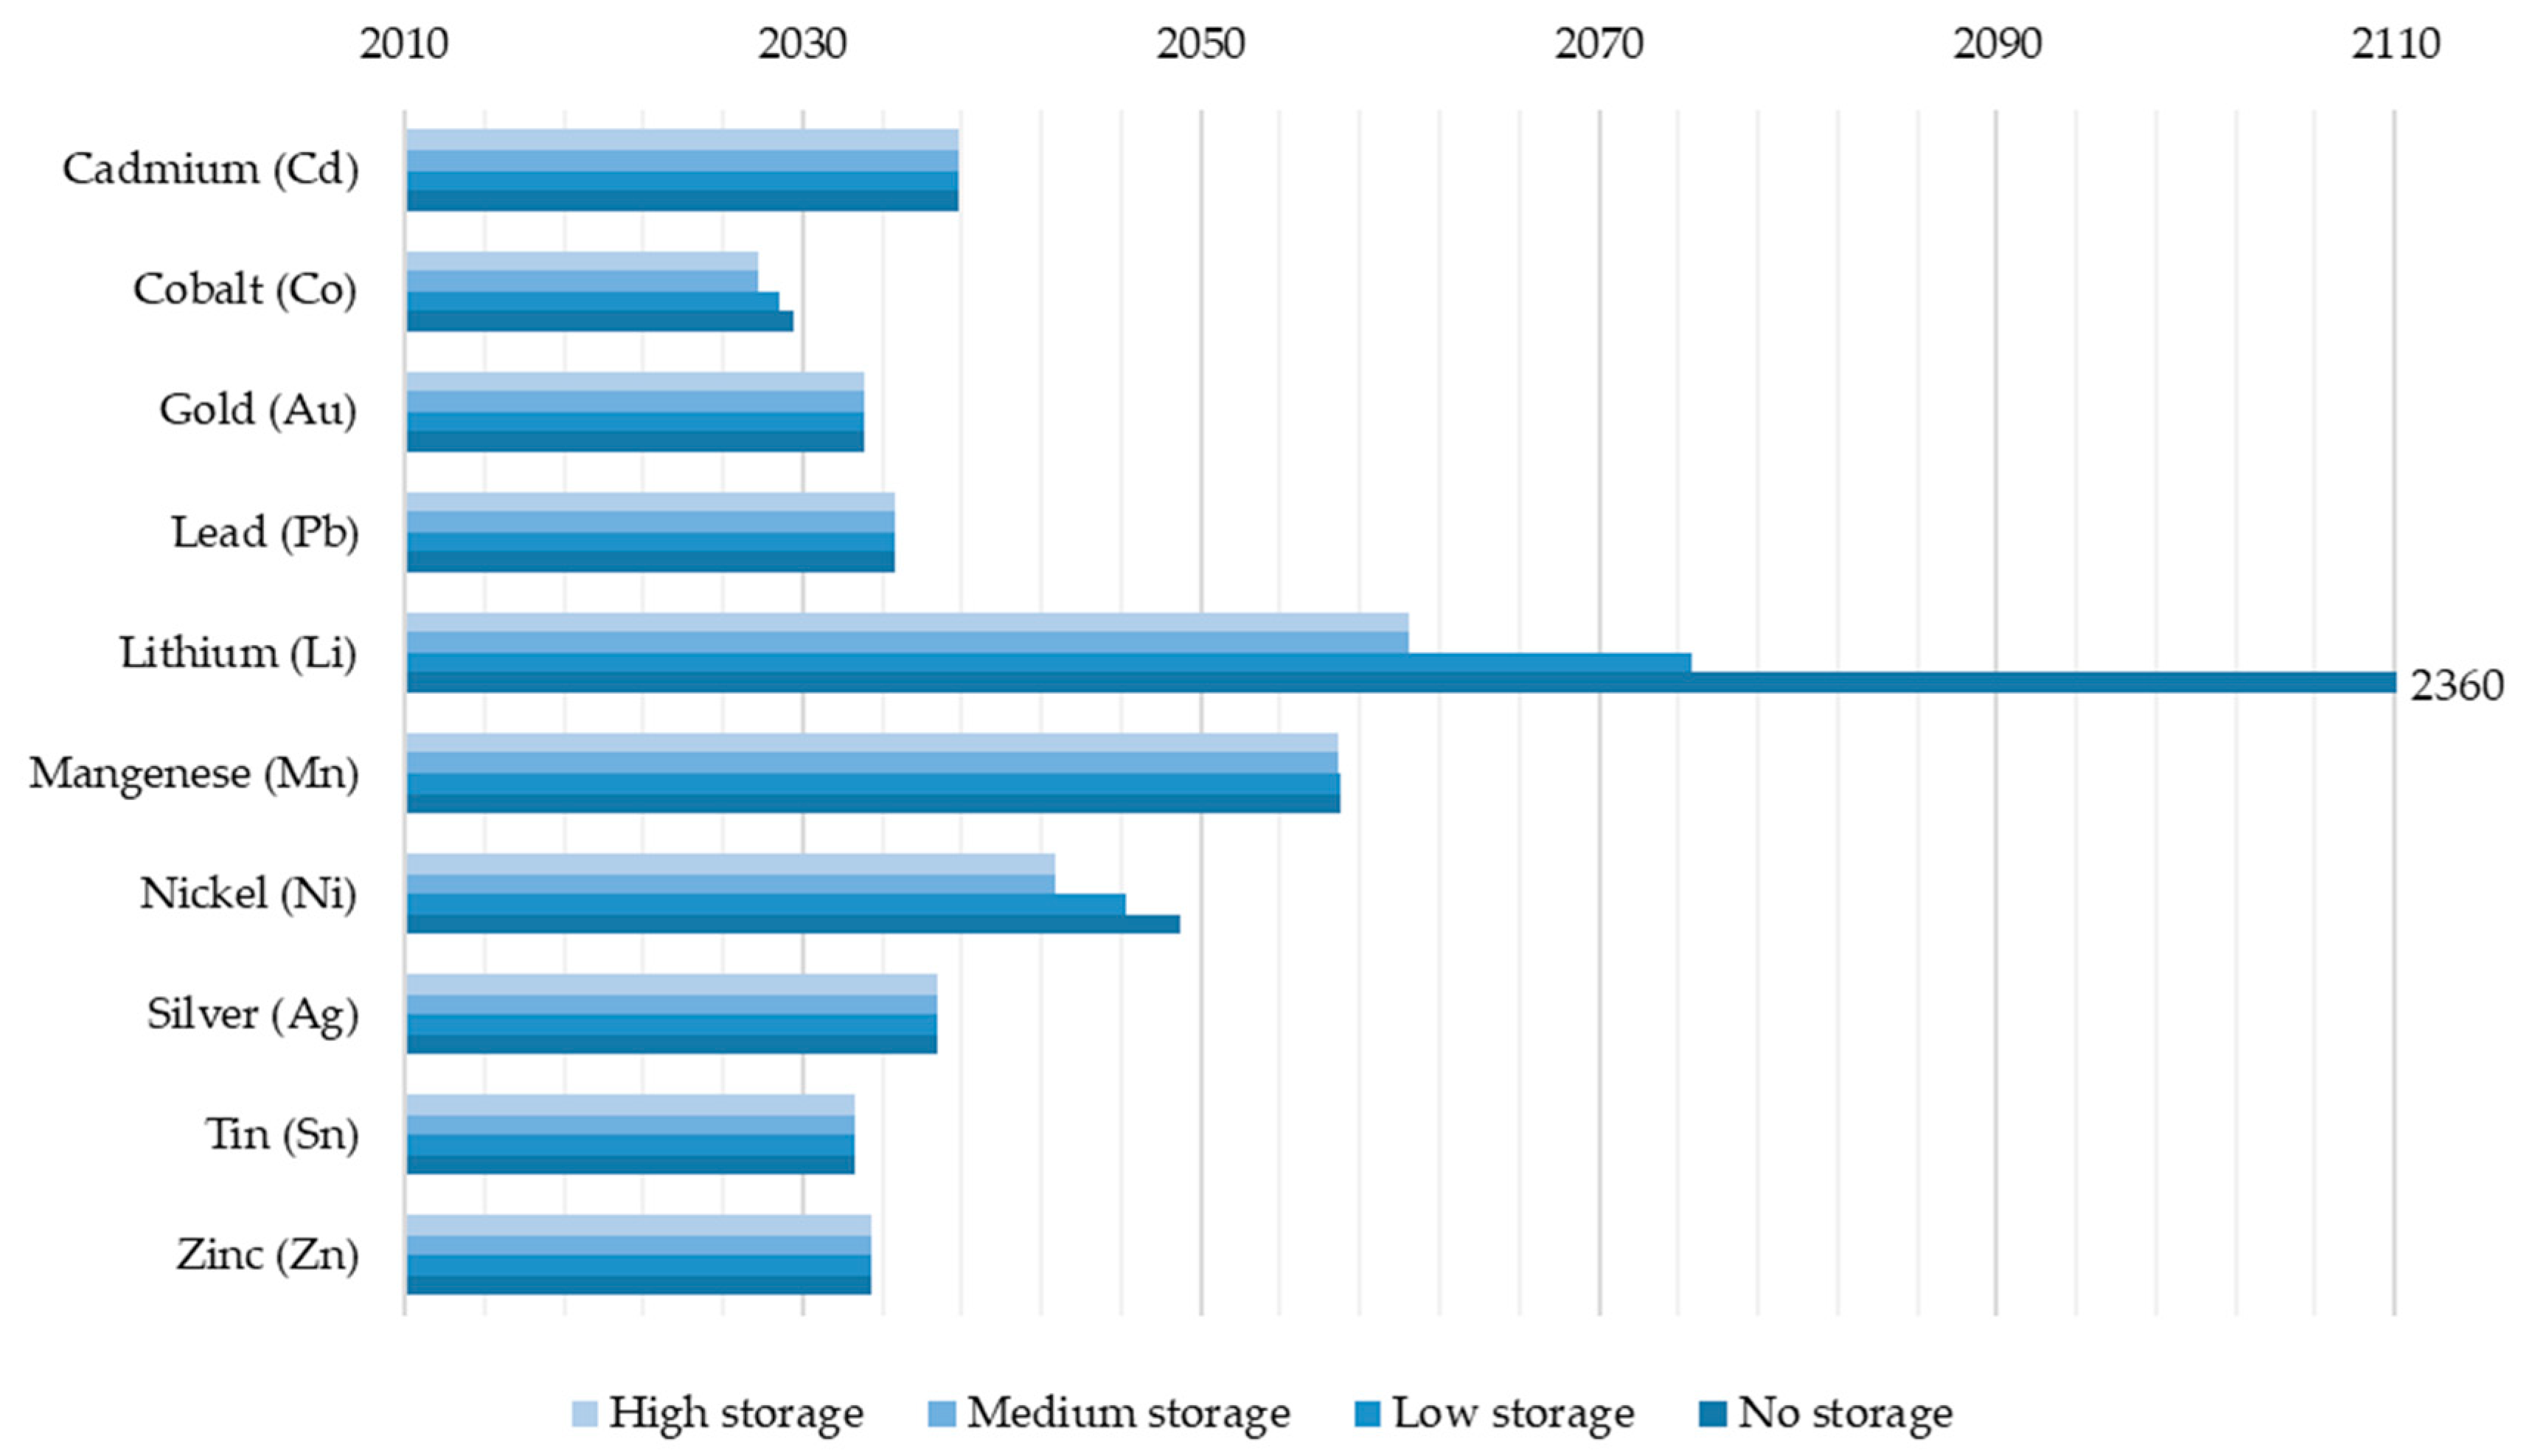
We assumed batteries to cover half of the intraday electricity storage requirements. Figure 5 shows how sensitive the metals, which reserves were identified as scarce, are to battery energy storage. In addition to the medium storage scenario accounted for in the results above, Figure 5 shows a high and low storage scenario, as well as the no battery energy storage option. The impacts of such storage scenarios proves to be negligible on the depletion horizon of most metals, with the exception of cobalt (Co), nickel (Ni), and most importantly lithium (Li). The depletion horizon of Li drops from 2360 without storage to between 2075 and 2060 depending on the storage scenario.
Thus, alternative centralized and decentralized storage technologies such as power-to-gas coupled with renewables, compressed air or flywheels, could defer potential constraints on metals for batteries. Demand response strategies might also lower the need for storage by aligning electricity demand with supply from intermittent renewables.

3.4. Recycling Scenarios

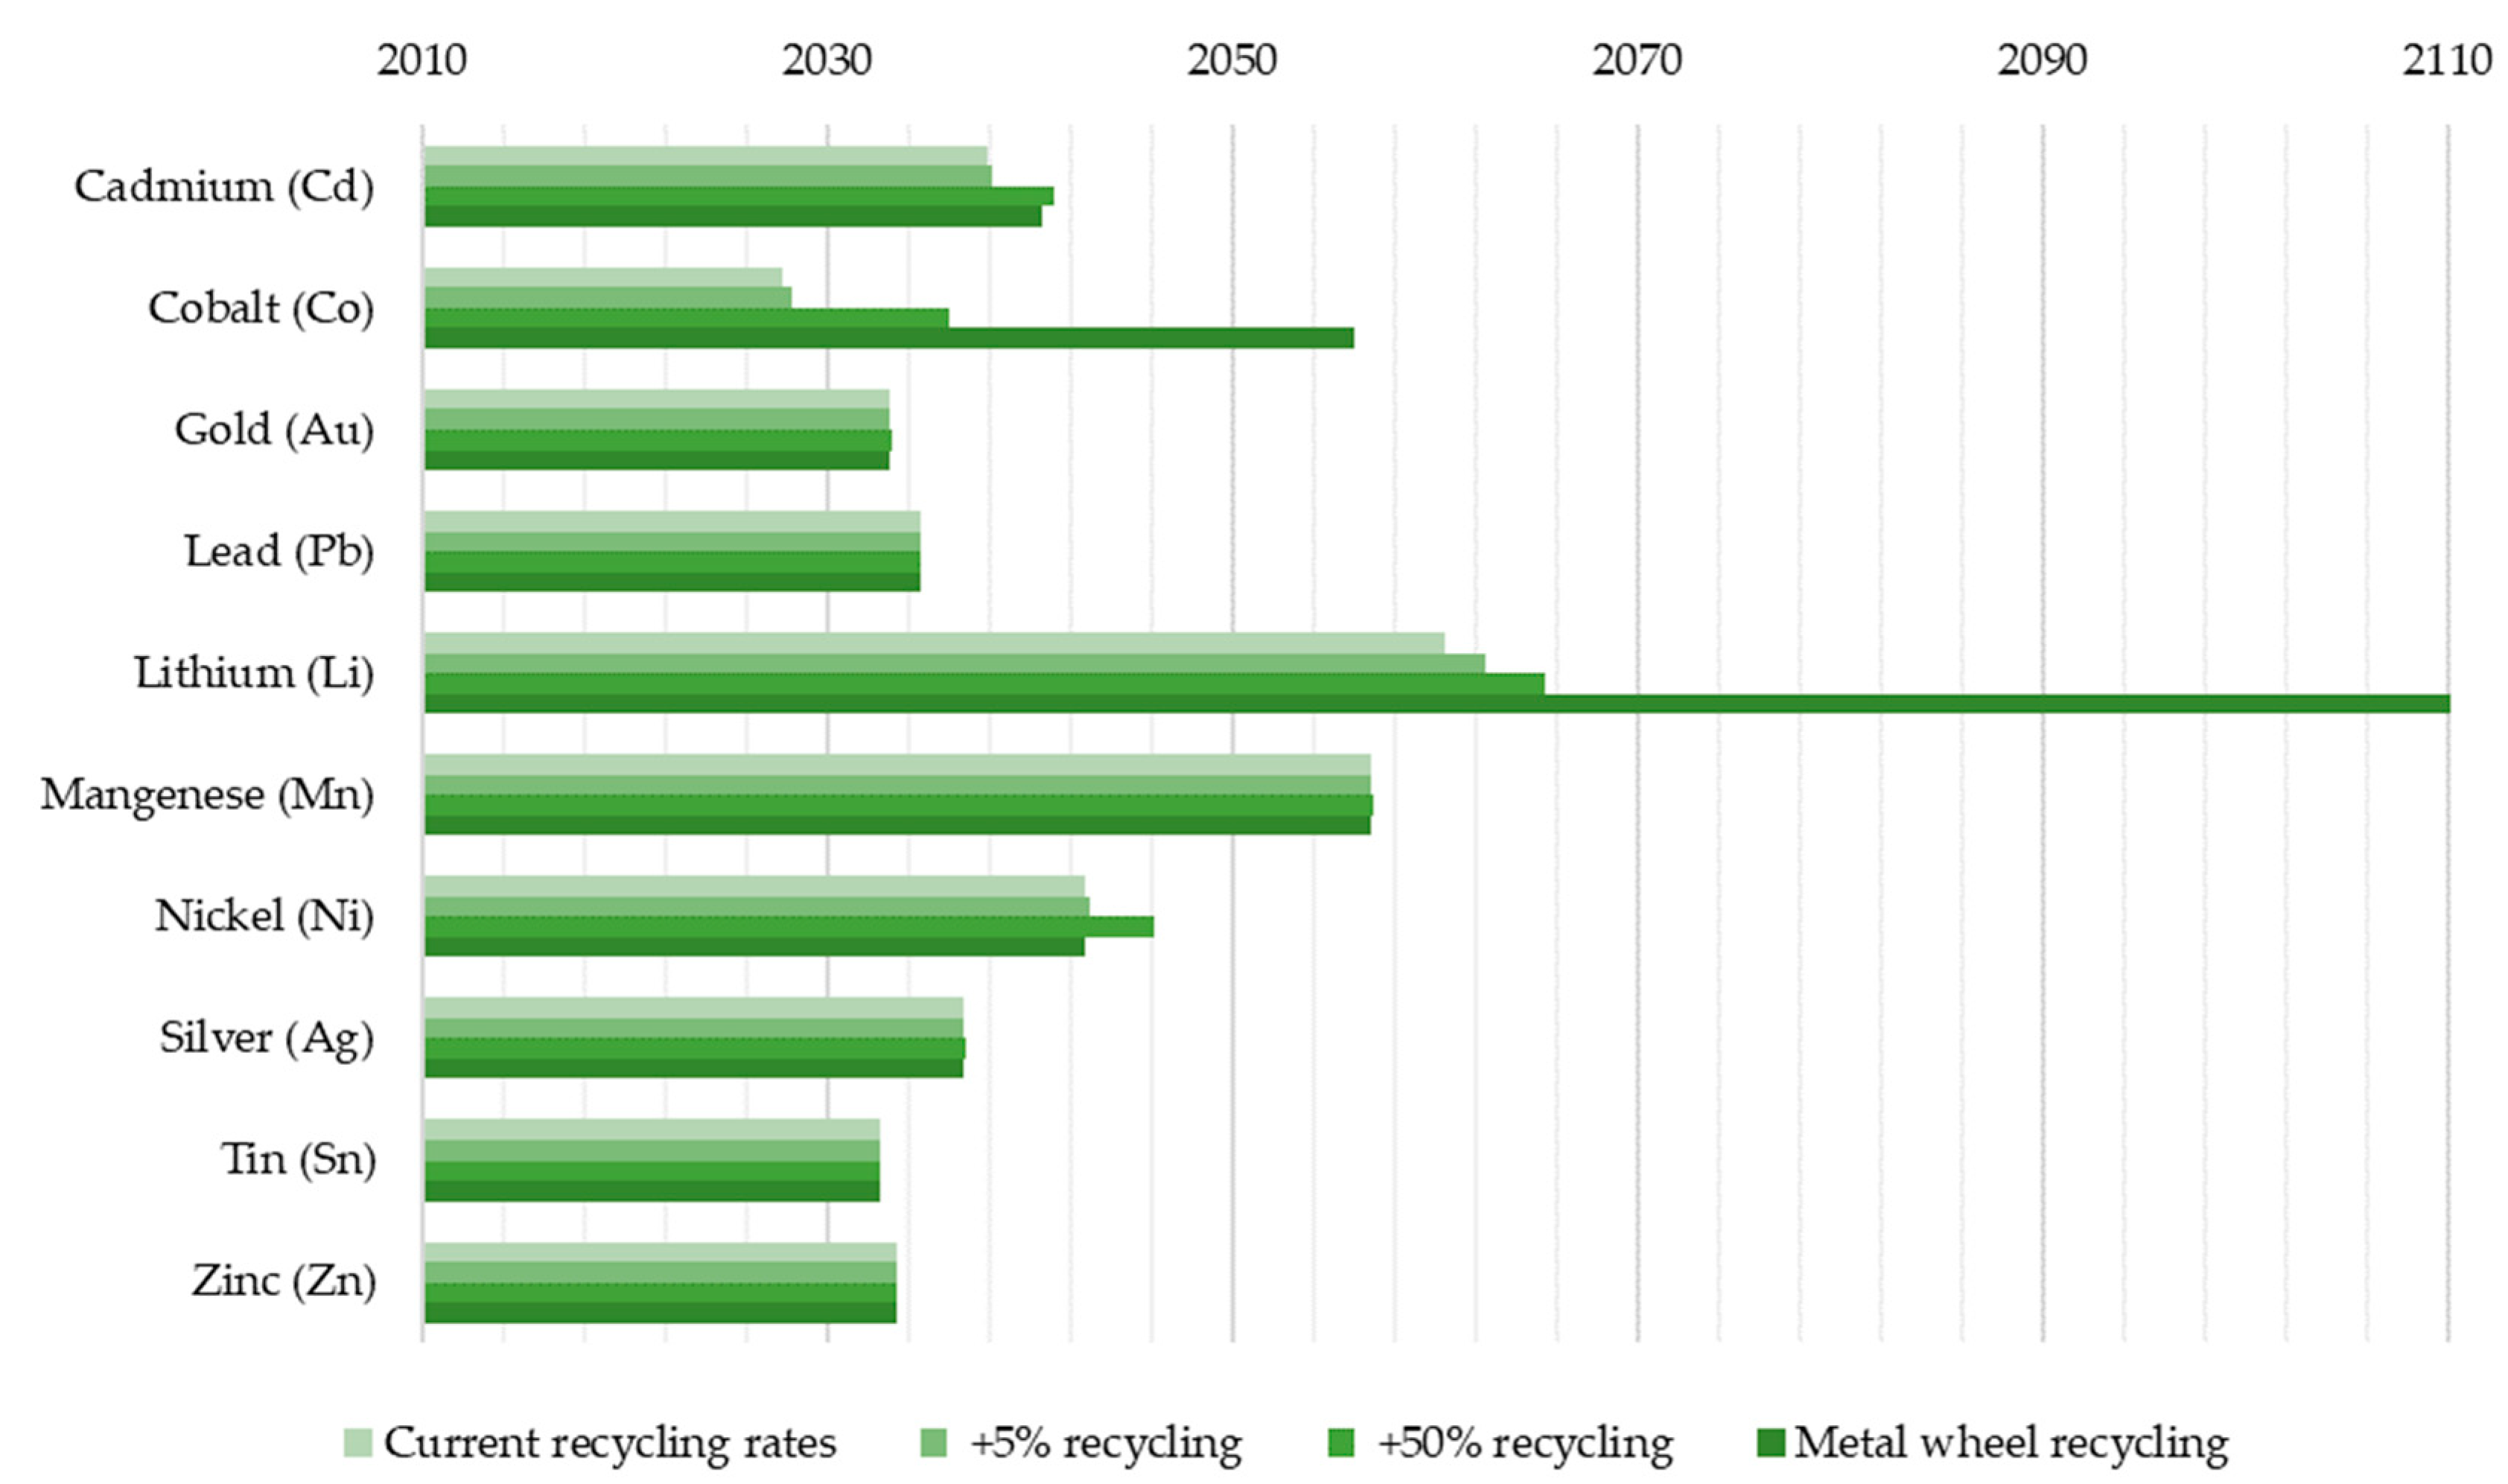
Similar to storage scenarios, changes in recycling rates have minimal impact on the depletion horizon of most metals. Figure 6 shows the impact of four distinct recycling scenarios: current recycling rates (which are used in the results above), a marginal 5% increment in recycling rates, a 50% increase in recycling rates and for specialty metals, a recycling rate comparable to that of their parent metals. For example, the global recycling rate of In currently stands at 1% but would increase to 50% in the case of parent metal Zn. For most specialty metals, the current recycling rates are extremely low, and even if they increased significantly, the stocks would not be sufficient to cover a significant share of the demand from recycling. Moreover, metals for which recycling rates are close to their maximum (e.g., Al, Fe, Cu, Au) are not only in high demand from incumbent industries, but they also have long residence times in use. The depletion horizon for iron (Fe), around 2070, might be surprising but stocks in use have already peaked in many OECD countries at 12 tons per capita [63]. At this stage, secondary steal becomes more economic than primary sources. Nevertheless, recycling scenarios make a difference for four key metals, Cd, Co, Li and Ni, as shown in Figure 6.

4. Discussion

In absolute terms, this analysis shows that although some metals are scarce, a fully renewable energy system is unlikely to deplete metal reserves and resources up to 2050. Metal productivity gains, as well as substitutions at the technology and metal levels, should become more viable technically and economically before the ore grades decline and the energy costs of extraction rise [39].
In this sense, our results are most relevant from a relative perspective, as they identify those metals that are likely to become scarce first, and thus, contribute to prioritizing R&D and industry efforts towards the substitutions of RE technologies or metals per se. Such alternatives can be at the expense of energy efficiency. For instance, asynchronous motors without permanent magnets in the rotors of wind turbines exist but are slightly less efficient than conventional motors. Similarly, replacing silver with copper as conductive elements in crystalline silicon solar cells would slightly reduce their conversion efficiency. Thus, the level of technological development and the global energy demand and technology scenarios determine whether future energy systems will be “high or low tech” and renewable energy scarce or abundant.
In the context of decarbonization to mitigate climate change, a fully renewable energy system could provide as much energy as we wanted, since its carbon intensity is significantly lower than the current fossil-fueled system. We show here that even if the energy system was fully renewable, supply constraints on several elements other than carbon would still compel us to reduce our energy demand. However, our analysis shows that shifting from a fossil-based to a RE-based system does not alleviate the problem of resource depletion, it merely shifts it from fuel to metal. The key difference between these two energy systems is that a RE-based system offers many alternative options when metal scarcity rises, such as substitution and recycling. In the list of priorities, we can start to reduce the cobalt intensity of energy technologies. Similar conclusions can be drawn from the results for cadmium and nickel. Equally important according to our results is the dependency of energy technologies on precious metals, in particular gold and silver. Stocks in use and recycling rates are high, but again, other uses are competing for them at a comparative advantage.
Intraday electricity storage with batteries has a significant impact on the usual suspects, cobalt, lithium and nickel. While storage itself compounds the impacts of renewable energy scenarios, alternatives to batteries exist. These alternatives would certainly not make batteries obsolete, but would lower their demand to a level which might be adequate with the availability of resources. Moreover, a large and well interconnected grid might reduce the problem of intermittency in sunny days followed by windy nights in different regions. Similarly, the minimal impact of recycling scenarios comes essentially from the fact that a global energy system has to be built over 30 to 40 years, not much longer than the typical lifetime of equipment. Therefore, a high recycling rate does not compensate for growth in demand for most metals, even iron which has one of the highest global recycling rates and stocks in use of all metals.
To our surprise, the results on depletion horizons do not change significantly when the global energy demand in 2050 varies from 120 EJ to 450 EJ of renewable energy (see Figure 1). The number of metals for which the range of uncertainty is large increases slightly from reserves to resources, which was expected, but remains small. This shows that the determining factor for depletion horizons is more how renewable energy sources are converted into useful energy, or the mix of RE technologies, rather than the energy scenarios themselves [64]. Our results may therefore prove particularly relevant in steering future applied research and development in line with material constraints over the medium and long term [65]. Concentrating our efforts towards material or technology substitutions is a priority since many alternatives which do not rely on scarce metals already exist.
Finally, our assessment focused exclusively on metals for supply-side technologies, neglecting metal requirements to manufacture demand-side technologies such as electric vehicles, fuel cells and energy efficiency measures. As part of the demand side, a more accurate assessment is also needed to account for the demand for specialty metals from non-energy industries. Moreover, what happens beyond 2050 in terms of maintenance of a fully renewable energy system is another important research question which remains open.

5. Conclusions

The objective of the research presented in this article is to perform a comprehensive assessment of metal supply constraints for a fully renewable energy system in 2050. Out of 29 necessary metals in the lifecycle of renewable energy technologies, the reserves of 8 metals might be depleted before then. However, the renewable energy industry would only mobilize a small additional share of the demand for specialty metals compared to the global demand from incumbent industries. The exceptions are Cd, Co, Li, and Ni, for which the depletion horizons vary across renewable energy scenarios. This is consistent with previous results [15,19]. However, the comparison between reserves and resources indicates where technical rather than geological bottlenecks might be alleviated through investments. In terms of resources, Cd, Co, Li and Ni also show the largest dependency on the demand of renewable energy systems.
We conclude that deploying an energy system based exclusively on renewables requires major changes to global energy demand and the development of appropriate technologies less reliant on specialty metals. While past research and development efforts have focused on improving the efficiency of energy conversion technologies (e.g., solar cells, wind turbines), which have generated a growing reliance on specialty metals, we might witness a side step to potentially less efficient technologies in the future in order to lower the risks of supply constraints. Whether future energy technologies will be high or low tech has great implications on resource depletion. Nevertheless, the fossil fuel equivalent of our remaining carbon budget would be wisely spent on the extraction of metals required for renewable energy technologies.

Author Contributions

Conceptualization, F.V. and V.M.; methodology, V.M.; validation, F.V. and P.C.D.R.; formal analysis, V.M., P.C.D.R.; data curation, P.C.D.R.; writing—original draft preparation, V.M.; writing—review and editing, F.V. and V.M.; visualization, P.C.D.R.; supervision, V.M. and F.V.

Funding

This research received no external funding. The APC was funded by EPFL’s Energy Center.

Acknowledgments

Vincent Moreau would like to thank members of the ESM foundation for fruitful discussions on the issues as well as Daniel Favrat for help with the literature review and concepts. We would also like to thank the three reviewers for their valuable comments.

Conflicts of Interest

The authors declare no conflict of interest.

Appendix A

The battery energy storage scenarios are reported below with a short description of each battery’s chemistry. The battery storage capacity for each scenario was increased by 25% to account for cycling losses in charging and discharging.
NCA—Lithium nickel cobalt aluminium—is a battery cell consisting of a graphite anode, LiNiCoAlO2 cathode and Lithium carbonate electrolyte. It has high energy density and good cycle life, but thermal stability is moderate [56].
NCM622—Lithium nickel manganese cobalt—is a battery cell consisting of a graphite anode, LiNi0.6Mn0.2Co0.2O2 cathode and Lithium carbonate electrolyte. NCM622 contains a higher nickel content than NCM111, which leads to higher energy density, decreased costs and lower thermal stability. Market diffusion is expected by 2020 [57].
NMC811—Lithium nickel manganese cobalt—is a battery cell consisting of graphite + silicon anode, LiNi0.8Mn0.1Co0.1O2 cathode and Lithium carbonate electrolyte. The presence of small quantities of silicon in the anode increase the energy intensity. This next generation technology is currently under R&D and is expected to diffuse by 2025 [57].
LFP—Lithium iron phosphate—is a battery cell consisting of a graphite anode, LiFePO4 cathode and Lithium carbonate electrolyte. It has high cycling life and safety parameters at low costs. However, its energy density is low [56].
Zebra NaNiCl—high temperature Sodium Nickel Chloride Battery—is a sodium metal halide battery designed to operate under high temperatures (>270 °C) and for long periods of discharge (≥6 h). LCI data was sourced from ecoinvent [46].
Table A1. Battery chemistries mixes.
2050MIX 1MIX 2MIX 3
NCA20%25%20%
NCM6220%5%0%
NCM81130%45%80%
Zebra (NaNiCl)50%10%0%
LFP0%15%0%

Appendix B

Figure A1. Metal intensities for RE technologies (a) and battery chemistries (b).
Resources 08 00029 g0a1aResources 08 00029 g0a1b

Appendix C

Table A2. Recycling scenarios.
Current+5%+50%Parent Metal
Aluminum (Al)50%53%76%50%
Bromine (Br)1%6%53%50%
Cadmium (Cd)10%15%57%50%
Chromium (Cr)50%53%76%50%
Cobalt (Co)50%53%76%94%
Copper (Cu)50%53%76%50%
Gallium (Ga)1%6%53%50%
Gold (Au)50%53%76%50%
Indium (In)1%6%53%50%
Iron (Fe)50%53%76%50%
Lanthanum (La)1%6%53%50%
Lead (Pb)50%53%76%50%
Lithium (Li)1%6%53%81%
Magnesium (Mg)25%29%64%25%
Manganese (Mn)50%53%76%50%
Molybdenum (Mo)25%29%64%25%
Neodymium (Nd)1%6%53%25%
Nickel (Ni)50%53%76%50%
Palladium (Pd)50%53%76%50%
Platinum (Pt)50%53%76%50%
Rhenium (Re)50%53%76%50%
Rhodium (Rh)50%53%76%50%
Silver (Ag)50%53%76%50%
Tantalum (Ta)1%6%53%50%
Tellurium (Te)1%6%53%50%
Tin (SN)1%6%53%50%
Titanium (TiO2)50%53%76%50%
Zinc (Zn)50%53%76%50%
Zirconium (Zr)1%6%53%25%

Appendix D

Table A3. Cumulative metal demand for the scenarios in Figure 3 and Figure 4.
MetalCumulative production [Mt]IPCC [Mt]WWF [Mt]IEA 2DS [Mt]IEA High Ren [Mt]IRENA REMAP [Mt]
Aluminum (Al)2.2 × 1031.7 × 1029.4 × 104.6 × 105.2 × 101.3 × 102
Bromine (Br)1.2 × 102.3 × 10−41.2 × 10−44.9 × 10−57.9 × 10−51.0 × 10−4
Cadmium (Cd)8.0 × 10−16.3 × 10−13.3 × 10−11.3 × 10−12.1 × 10−12.8 × 10−1
Chromium (Cr)3.3 × 10−14.52.01.21.82.7
Cobalt (Co)3.87.1 × 1012.1 × 1011.6 × 1011.5 × 1011.5 × 101
Copper (Cu)6.9 × 10−11.5 × 1025.7 × 1013.2 × 1011.8 × 1017.8 × 101
Gallium (Ga)1.7 × 10−25.8 × 10−33.1 × 10−31.2 × 10−32.0 × 10−32.6 × 10−3
Gold (Au)1.1 × 10−13.5 × 10−41.8 × 10−47.6 × 10−51.2 × 10−41.6 × 10−4
Indium (In)2.5 × 10−24.7 × 10−22.5 × 10−21.0 × 10−21.6 × 10−22.1 × 10−2
Iron (Fe)5.2 × 1041.2 × 1038.4 × 1021.5 × 1031.9 × 1029.0 × 102
Lanthanum (La)1.21.6 × 10−48.8 × 10−53.5 × 10−55.7 × 10−57.5 × 10−5
Lead (Pb)1.6 × 1021.05.5 × 10−12.6 × 10−13.9 × 10−15.1 × 10⁻¹
Lithium (Li)1.52.0 × 101.0 × 105.76.91.7 × 10
Magnesium (Mg)5.7 × 1021.5 × 10−28.3 × 10−33.4 × 10−35.4 × 10−37.1 × 10−3
Manganese (Mn)5.6 × 1025.62.91.62.04.6
Molybdenum (Mo)1.0 × 106.6 × 10−22.9 × 10−21.6 × 10−22.3 × 10−23.1 × 10−2
Neodymium (Nd)8.1 × 10−11.9 × 10−27.8 × 10−39.3 × 10−31.1 × 10−21.5 × 10−2
Nickel (Ni)7.3 × 108.5 × 104.5 × 102.4 × 103.0 × 107.2 × 10
Palladium (Pd)7.7 × 10−34.1 × 10−51.1 × 10−51.0 × 10−57.9 × 10−65.7 × 10−6
Platinum (Pt)7.1 × 10−31.9 × 10−45.3 × 10−55.1 × 10−53.5 × 10−52.3 × 10−5
Rhenium (Re)1.8 × 10−31.6 × 10−87.3 × 10−93.7 × 10−94.8 × 10−95.9 × 10−9
Rhodium (Rh)1.4 × 10−33.3 × 10−58.8 × 10−68.8 × 10−65.9 × 10−63.7 × 10−6
Silver (Ag)8.7 × 10−14.5 × 10−22.2 × 10−28.5 × 10−31.4 × 10−21.0 × 10−2
Tantalum (Ta)4.5 × 10−25.6 × 10−32.9 × 10−31.2 × 10−31.9 × 10−32.5 × 10−3
Tellurium (Te)1.4 × 10−21.4 × 10−47.7 × 10−53.1 × 10−55.0 × 10−56.5 × 10−5
Tin (Sn)1.0 × 103.3 × 10−21.7 × 10−27.3 × 10−31.1 × 10−21.4 × 10−2
Titanium (TiO2)2.4 × 1022.3 × 10−11.1 × 10−15.3 × 10−27.5 × 10−29.8 × 10−2
Zinc (Zn)4.6 × 1022.08.3 × 10−14.7 × 10−16.5 × 10−11.1
Zirconium (Zr)4.1 × 104.1 × 10−22.2 × 10−28.9 × 10−31.4 × 10−21.8 × 10−2

References

  1. Figueres, C.; Schellnhuber, H.J.; Whiteman, G.; Rockström, J.; Hobley, A.; Rahmstorf, S. Three years to safeguard our climate. Nat. News 2017, 546, 593. [Google Scholar] [CrossRef] [PubMed]
  2. Vidal, O. Mineral Resources and Energy: Future Stakes in Energy Transition, 1st ed.; Elsevier: Amsterdam, The Netherlands, 2017; ISBN 978-1-78548-267-0. [Google Scholar]
  3. Arrobas, D.L.P.; Hund, K.L.; Mccormick, M.S.; Ningthoujam, J.; Drexhage, J.R. The Growing Role of Minerals and Metals for a Low Carbon Future; The World Bank: Washington, DC, USA, 2017. [Google Scholar]
  4. Moss, R.; Willis, P.; Tercero, E.L.; Tzimas, E.; Arendorf, J.; Thompson, P.; Chapman, A.; Morley, N.; Sims, E.; Bryson, R. Critical Metals in the Path Towards the Decarbonisation of the EU Energy Sector: Assessing Rare Metals as Supply-chain Bottlenecks in Low-carbon Energy Technologies; Publications Office of the EU: Luxembourg, Luxembourg, 2013; ISBN 978-92-79-30390-6. [Google Scholar]
  5. Scholz, R.W.; Wellmer, F.-W. Approaching a dynamic view on the availability of mineral resources: What we may learn from the case of phosphorus? Glob. Environ. Chang. 2013, 23, 11–27. [Google Scholar] [CrossRef]
  6. Klee, R.J.; Graedel, T.E. ELEMENTAL CYCLES: A Status Report on Human or Natural Dominance. Annu. Rev. Environ. Resour. 2004, 29, 69–107. [Google Scholar] [CrossRef]
  7. Vidal, O.; Goffe, B.; Arndt, N. Metals for a low-carbon society. Nat. Geosci. 2013, 6, 894–896. [Google Scholar] [CrossRef]
  8. Reller, A.; Zepf, V.; Achzet, B. The Importance of Rare Metals for Emerging Technologies. In Factor X: Re-Source—Designing the Recycling Society; Angrick, M., Burger, A., Lehmann, H., Eds.; Springer: Dordrecht, The Netherlands, 2013; pp. 203–219. ISBN 978-94-007-5712-7. [Google Scholar]
  9. Grandell, L.; Lehtilä, A.; Kivinen, M.; Koljonen, T.; Kihlman, S.; Lauri, L.S. Role of critical metals in the future markets of clean energy technologies. Renew. Energy 2016, 95, 53–62. [Google Scholar] [CrossRef]
  10. Ohno, H.; Nuss, P.; Chen, W.-Q.; Graedel, T.E. Deriving the Metal and Alloy Networks of Modern Technology. Environ. Sci. Technol. 2016, 50, 4082–4090. [Google Scholar] [CrossRef] [PubMed]
  11. Elshkaki, A.; Graedel, T.E. Dynamic analysis of the global metals flows and stocks in electricity generation technologies. J. Clean. Prod. 2013, 59, 260–273. [Google Scholar] [CrossRef]
  12. Alonso, E.; Sherman, A.M.; Wallington, T.J.; Everson, M.P.; Field, F.R.; Roth, R.; Kirchain, R.E. Evaluating Rare Earth Element Availability: A Case with Revolutionary Demand from Clean Technologies. Environ. Sci. Technol. 2012, 46, 3406–3414. [Google Scholar] [CrossRef]
  13. Smil, V. Energy Transitions: History, Requirements, Prospects; Praeger: Santa Barbara, CA, USA, 2010. [Google Scholar]
  14. Peiró, L.T.; Méndez, G.V.; Ayres, R.U. Material Flow Analysis of Scarce Metals: Sources, Functions, End-Uses and Aspects for Future Supply. Environ. Sci. Technol. 2013, 47, 2939–2947. [Google Scholar] [CrossRef]
  15. Graedel, T.E. On the Future Availability of the Energy Metals. Annu. Rev. Mater. Res. 2011, 41, 323–335. [Google Scholar] [CrossRef]
  16. Lieberei, J.; Gheewala, S.H. Resource depletion assessment of renewable electricity generation technologies—Comparison of life cycle impact assessment methods with focus on mineral resources. Int. J. Life Cycle Assess. 2017, 22, 185–198. [Google Scholar] [CrossRef]
  17. Hoenderdaal, S.; Tercero Espinoza, L.; Marscheider-Weidemann, F.; Graus, W. Can a dysprosium shortage threaten green energy technologies? Energy 2013, 49, 344–355. [Google Scholar] [CrossRef]
  18. Valero, V.C.; Delgado, A.V. Thanatia: The Destiny of the Earth’s Mineral Resources: A Thermodynamic Cradle-to-cradle Assessment; World Scientific: Singpore, 2015; ISBN 981-4273-93-7. [Google Scholar]
  19. Kleijn, R.; van der Voet, E.; Kramer, G.J.; van Oers, L.; van der Giesen, C. Metal requirements of low-carbon power generation. Energy 2011, 36, 5640–5648. [Google Scholar] [CrossRef]
  20. Vidal, O.; Le Boulzec, H.; François, C. Modelling the material and energy costs of the transition to low-carbon energy. EPJ Web Conf. 2018, 189. [Google Scholar] [CrossRef]
  21. Vesborg, P.C.K.; Jaramillo, T.F. Addressing the terawatt challenge: Scalability in the supply of chemical elements for renewable energy. RSC Adv. 2012, 2, 7933–7947. [Google Scholar] [CrossRef]
  22. Andersson, B.A.; Azar, C.; Holmberg, J.; Karlsson, S. Material constraints for thin-film solar cells. Energy 1998, 23, 407–411. [Google Scholar] [CrossRef]
  23. Feltrin, A.; Freundlich, A. Material considerations for terawatt level deployment of photovoltaics. Renew. Energy 2008, 33, 180–185. [Google Scholar] [CrossRef]
  24. Fthenakis, V. Sustainability of photovoltaics: The case for thin-film solar cells. Renew. Sustain. Energy Rev. 2009, 13, 2746–2750. [Google Scholar] [CrossRef] [Green Version]
  25. Wadia, C.; Alivisatos, A.P.; Kammen, D.M. Materials Availability Expands the Opportunity for Large-Scale Photovoltaics Deployment. Environ. Sci. Technol. 2009, 43, 2072–2077. [Google Scholar] [CrossRef]
  26. Frenzel, M.; Tolosana-Delgado, R.; Gutzmer, J. Assessing the supply potential of high-tech metals—A general method. Resour. Policy 2015, 46, 45–58. [Google Scholar] [CrossRef]
  27. Nassar, N.T.; Graedel, T.E.; Harper, E.M. By-product metals are technologically essential but have problematic supply. Sci. Adv. 2015, 1, e1400180. [Google Scholar] [CrossRef] [PubMed]
  28. Frenzel, M.; Mikolajczak, C.; Reuter, M.A.; Gutzmer, J. Quantifying the relative availability of high-tech by-product metals—The cases of gallium, germanium and indium. Resour. Policy 2017, 52, 327–335. [Google Scholar] [CrossRef]
  29. Kavlak, G.; McNerney, J.; Jaffe, R.L.; Trancik, J.E. Metal production requirements for rapid photovoltaics deployment. Energy Environ. Sci. 2015, 8, 1651–1659. [Google Scholar] [CrossRef] [Green Version]
  30. Grandell, L.; Thorenz, A. Silver supply risk analysis for the solar sector. Renew. Energy 2014, 69, 157–165. [Google Scholar] [CrossRef]
  31. Harmsen, J.H.M.; Roes, A.L.; Patel, M.K. The impact of copper scarcity on the efficiency of 2050 global renewable energy scenarios. Energy 2013, 50, 62–73. [Google Scholar] [CrossRef]
  32. Elshkaki, A. An analysis of future platinum resources, emissions and waste streams using a system dynamic model of its intentional and non-intentional flows and stocks. Resour. Policy 2013, 38, 241–251. [Google Scholar] [CrossRef]
  33. Mudd, G.M.; Weng, Z.; Jowitt, S.M.; Turnbull, I.D.; Graedel, T.E. Quantifying the recoverable resources of by-product metals: The case of cobalt. Ore Geol. Rev. 2013, 55, 87–98. [Google Scholar] [CrossRef]
  34. Mao, J.; Graedel, T.E. Lead In-Use Stock. J. Ind. Ecol. 2009, 13, 112–126. [Google Scholar] [CrossRef]
  35. Habib, K.; Wenzel, H. Exploring rare earths supply constraints for the emerging clean energy technologies and the role of recycling. J. Clean. Prod. 2014, 84, 348–359. [Google Scholar] [CrossRef]
  36. Lund, H.; Mathiesen, B.V. Energy system analysis of 100% renewable energy systems—The case of Denmark in years 2030 and 2050. Energy 2009, 34, 524–531. [Google Scholar] [CrossRef]
  37. Kempton, W.; Tomić, J. Vehicle-to-grid power implementation: From stabilizing the grid to supporting large-scale renewable energy. J. Power Sources 2005, 144, 280–294. [Google Scholar] [CrossRef]
  38. Bradshaw, A.M.; Hamacher, T. Nonregenerative natural resources in a sustainable system of energy supply. ChemSusChem 2012, 5, 550–562. [Google Scholar] [CrossRef] [PubMed]
  39. Fizaine, F.; Court, V. Renewable electricity producing technologies and metal depletion: A sensitivity analysis using the EROI. Ecol. Econ. 2015, 110, 106–118. [Google Scholar] [CrossRef] [Green Version]
  40. Arvizu, D.; Bruckner, T.; Chum, H.; Edenhofer, O.; Estefen, S.; Faaij, A.; Fischedick, M.; Hansen, G.; Hiriart, G.; Hohmeyer, O.; et al. IPCC Special Report on Renewable Energy Sources and Climate Change Mitigation; Edenhofer, O., Pichs-Madruga, R., Sokona, Y., Seyboth, K., Matschoss, P., Kadner, S., Zwickel, T., Eickemeier, P., Hansen, G., Schlamer, S., et al., Eds.; Technical Report; Cambridge University Press: Cambridge, UK; New York, NY, USA, 2011. [Google Scholar]
  41. Ecofys. The Ecofys Energy Scenario; 100% Renewable Energy by 2050; WWF Ecofys OMA: Gland, Switzerland, 2011. [Google Scholar]
  42. IEA. Energy Technology Perspectives; International Energy Agency: Paris, France, 2016. [Google Scholar]
  43. IRENA. Global Energy Transformation—A Roadmap to 2050; International Renewable Energy Agency: Abu Dhabi, UAE, 2018. [Google Scholar]
  44. Fraunhofer ISE. Photovoltaics Report; Fraunhofer Institute for Solar Energy: Freiburg, Germany, 2018. [Google Scholar]
  45. Weckend, S.; Wade, A.; Heath, G. End-of-Life Management: Solar Photovoltaic Panels; IRENA: Abu Dhabi, UAE, 2016. [Google Scholar]
  46. Wernet, G.; Bauer, C.; Steubing, B.; Reinhard, J.; Moreno-Ruiz, E.; Weidema, B. The ecoinvent database version 3 (part I): Overview and methodology. Int. J. Life Cycle Assess. 2016, 21, 1218–1230. [Google Scholar] [CrossRef]
  47. Bauen, A.; Berndes, G.; Junginger, M.; Londo, M.; Vuille, F.; Ball, R.; Bole, T.; Chudziak, C.; Faaij, A.; Mozaffarian, H. Bioenergy: A Sustainable and Reliable Energy Source. A Review of Status and Prospects. Bioenergy Sustain. Reliab. Energy Source Rev. Status Prospects 2009. Available online: https://www.ieabioenergy.com/publications/main-report-bioenergy-a-sustainable-and-reliable-energy-source-a-review-of-status-and-prospects/ (accessed on 30 January 2019).
  48. Peters, J.; Weil, M. A Critical Assessment of the Resource Depletion Potential of Current and Future Lithium-Ion Batteries. Resources 2016, 5, 46. [Google Scholar] [CrossRef]
  49. Meylan, F.D.; Moreau, V.; Erkman, S. Material constraints related to storage of future European renewable electricity surpluses with CO2 methanation. Energy Policy 2016, 94, 366–376. [Google Scholar] [CrossRef]
  50. ENTSOE. Hourly RE Generation Data; European Network of Transmission System Operators for Electricity: Brussels, Belgium, 2018. [Google Scholar]
  51. US EIA. Hourly Load Data; US Energy Information Administration: Washington, DC, USA, 2018.
  52. Pleßmann, G.; Erdmann, M.; Hlusiak, M.; Breyer, C. Global Energy Storage Demand for a 100% Renewable Electricity Supply. Energy Procedia 2014, 46, 22–31. [Google Scholar] [CrossRef] [Green Version]
  53. Majeau-Bettez, G.; Hawkins, T.R.; Strømman, A.H. Life Cycle Environmental Assessment of Lithium-Ion and Nickel Metal Hydride Batteries for Plug-In Hybrid and Battery Electric Vehicles. Environ. Sci. Technol. 2011, 45, 4548–4554. [Google Scholar] [CrossRef]
  54. Hiremath, M.; Derendorf, K.; Vogt, T. Comparative Life Cycle Assessment of Battery Storage Systems for Stationary Applications. Environ. Sci. Technol. 2015, 49, 4825–4833. [Google Scholar] [CrossRef]
  55. Ram, M.; Bogdanov, D.; Aghahosseini, A.; Oyewo, A.S.; Gulag, A.; Child, M.; Fell, H.-J.; Breyer, C. Global Energy System Based on 100% Renewable Energy—Power Sector; Lappeenranta University of Technology and Energy Watch Group: Lapeeranta, Finland; Berlin, Germany, 2017. [Google Scholar]
  56. Weil, M.; Ziemann, S.; Peters, J. The Issue of Metal Resources in Li-Ion Batteries for Electric Vehicles. In Behaviour of Lithium-Ion Batteries in Electric Vehicles: Battery Health, Performance, Safety, and Cost; Pistoia, G., Liaw, B., Eds.; Springer International Publishing: Cham, Switzerland, 2018; pp. 59–74. ISBN 978-3-319-69950-9. [Google Scholar]
  57. IEA. Global EV Outlook 2018—Towards Cross-Modal Electrification; International Energy Agency: Paris, France, 2018. [Google Scholar]
  58. Moreau, V.; Dos Reis, P.C. Energy Metals SI Resources [Data Set]. Zenodo. Available online: http://doi.org/10.5281/zenodo.2553086 (accessed on 30 January 2019).
  59. Graedel, T.E.; Allwood, J.; Birat, J.-P.; Buchert, M.; Hagelüken, C.; Reck, B.K.; Sibley, S.F.; Sonnemann, G. What Do We Know About Metal Recycling Rates? J. Ind. Ecol. 2011, 15, 355–366. [Google Scholar] [CrossRef] [Green Version]
  60. Binnemans, K.; Jones, P.T.; Blanpain, B.; Van Gerven, T.; Yang, Y.; Walton, A.; Buchert, M. Recycling of rare earths: A critical review. J. Clean. Prod. 2013, 51, 1–22. [Google Scholar] [CrossRef]
  61. Reuter, M.; Hudson, C.; van Schaik, A.; Heiskanen, K.; Meskers, C.; Hagelüken, C. Metal Recycling Opportunities, Limits, Infrastructure. A Report of the Working Group on the Global Metal Flows to the International Resource Panel; UNEP: Nairobi, Kenya, 2013. [Google Scholar]
  62. USGS. Mineral Commodity Summaries; USGS: Reston, VA, USA, 2018.
  63. Allwood, J.; Cullen, J. Sustainable Materials with Both Eyes Open; UIT: Cambridge, UK, 2012. [Google Scholar]
  64. Månberger, A.; Stenqvist, B. Global metal flows in the renewable energy transition: Exploring the effects of substitutes, technological mix and development. Energy Policy 2018, 119, 226–241. [Google Scholar] [CrossRef]
  65. Zuser, A.; Rechberger, H. Considerations of resource availability in technology development strategies: The case study of photovoltaics. Resour. Conserv. Recycl. 2011, 56, 56–65. [Google Scholar] [CrossRef]
Figure 1. Five scenarios of global energy supply/demand in 2050 with high shares of renewables.
Resources 08 00029 g001
Figure 2. Storage requirements corresponding to energy scenarios and compared with 3 existing estimates.
Resources 08 00029 g002
Figure 3. Depletion horizons based on reserves with demand from the energy sector (in red) ranging across energy scenarios and demand without the energy sector (in black). N.a. means no data available.
Resources 08 00029 g003
Figure 4. Depletion horizons based on resources with demand from the energy sector (in blue) ranging across energy scenarios and demand without the energy sector (in black). N.a. means no data available.
Resources 08 00029 g004
Figure 5. Depletion horizons based on reserves per storage scenario.
Resources 08 00029 g005
Figure 6. Depletion horizons based on reserves for each of the four recycling scenarios.
Resources 08 00029 g006