The Relationship of Causal Factors Affecting the Future Equilibrium Change of Total Final Energy Consumption in Thailand’s Construction Sector under a Sustainable Development Goal: Enriching the SE-VARX Model


Abstract
1. Introduction
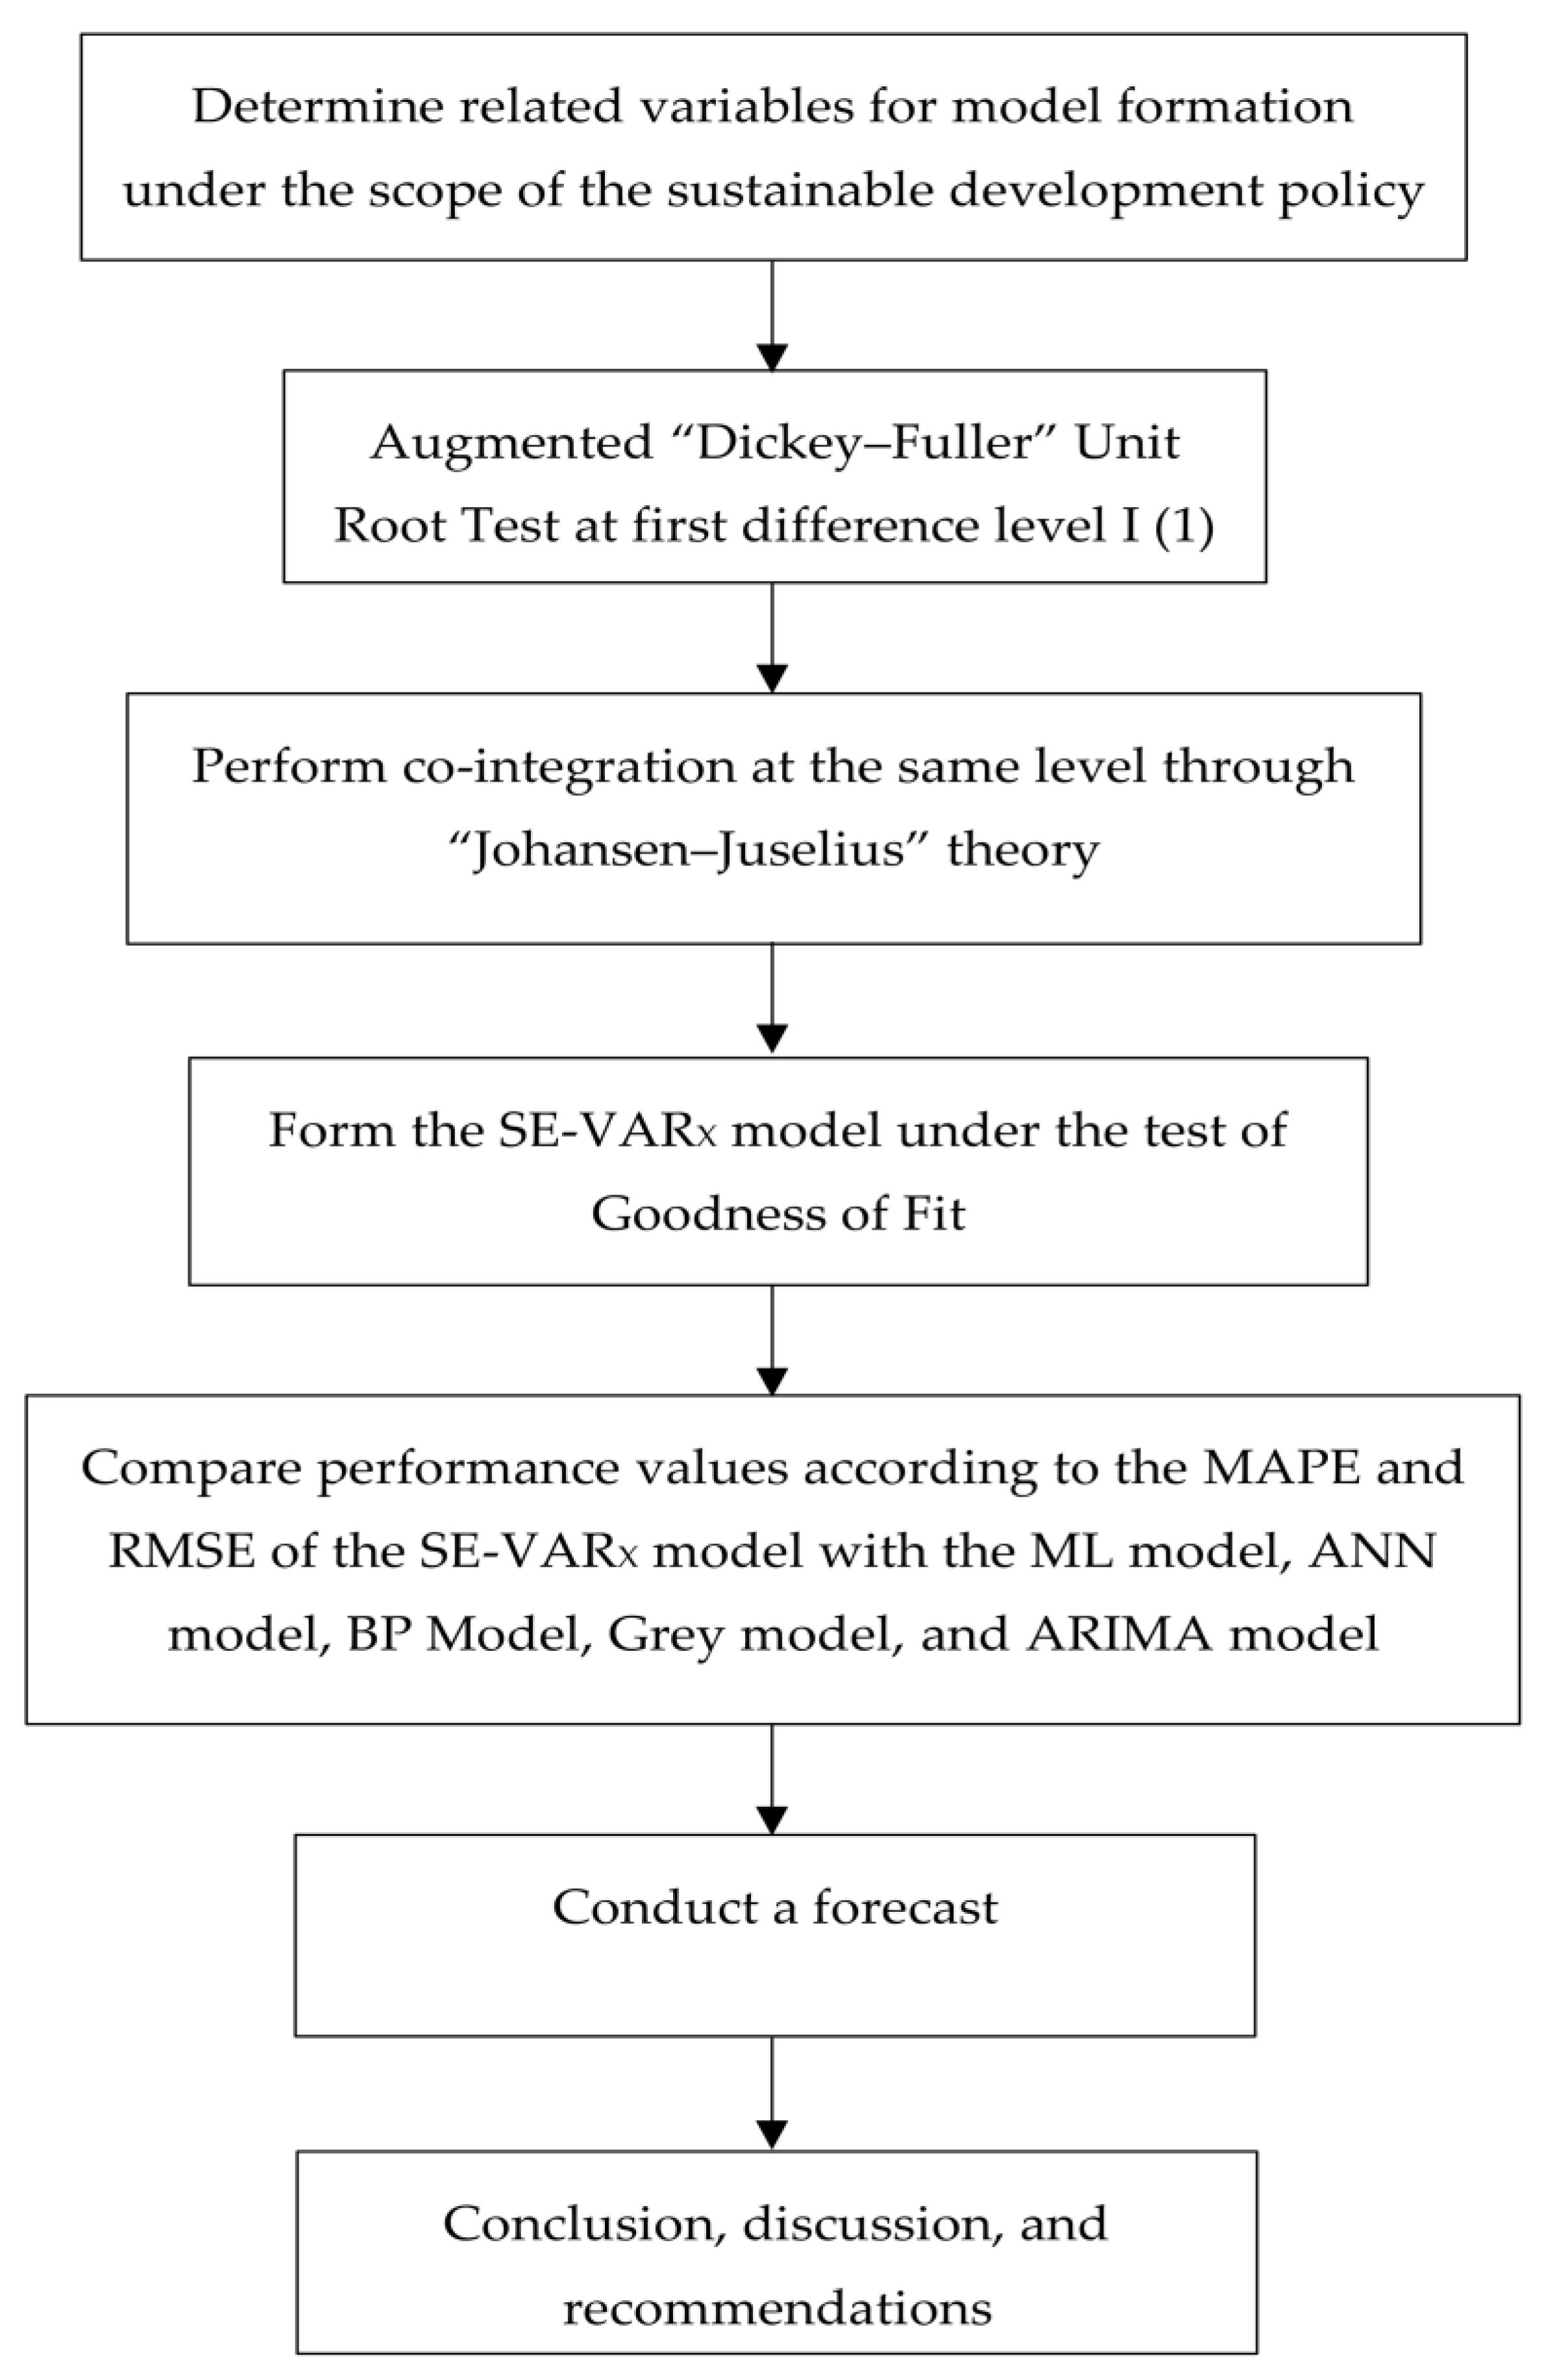
- Determine all variables for the SE-VARX model so as to analyze the influence of the relationship between causal factors affecting the equilibrium adjustment of the total final energy consumption based on the sustainable development policy for 10 years (2019–2028). This process applies Augmented Dickey–Fuller theory [50,51] along with the concept of walk drift and time trend at the first difference using data from 1990 to 2017.
- Construct the SE-VARX model to analyze the influence of the relationship in both the long term and short term.
- Testify the performance of the SE-VARX model based on the value of the Mean Absolute Percentage Error (RMSE) and Root Mean Square Error (RMSE) [54,55], and compare them with the same sort of values in Multiple Linear Regression model (ML model), Artificial Neural Network model (ANN model), Back Propagation neural network model (BP model), Grey model, and Autoregressive Integrated and Moving Average model (ARIMA model).
- Forecast the total final energy consumption by using the SE-VARX model for the years 2019–2028, totaling 10 years. The flowchart of the SE-VARX model is shown in Figure 1.
2. Materials and Methods
2.1. Stationary Features
2.2. Co-Integration Test
2.3. A Forecasting Model Using the SE-VARX Model
2.4. Measurement of the Forecasting Performance
3. Empirical Analysis
3.1. Screening of Influencing Factors for Model Input
3.2. Analysis of Co-Integration
3.3. Formation of Analysis Modeling with the SE-VARX Model
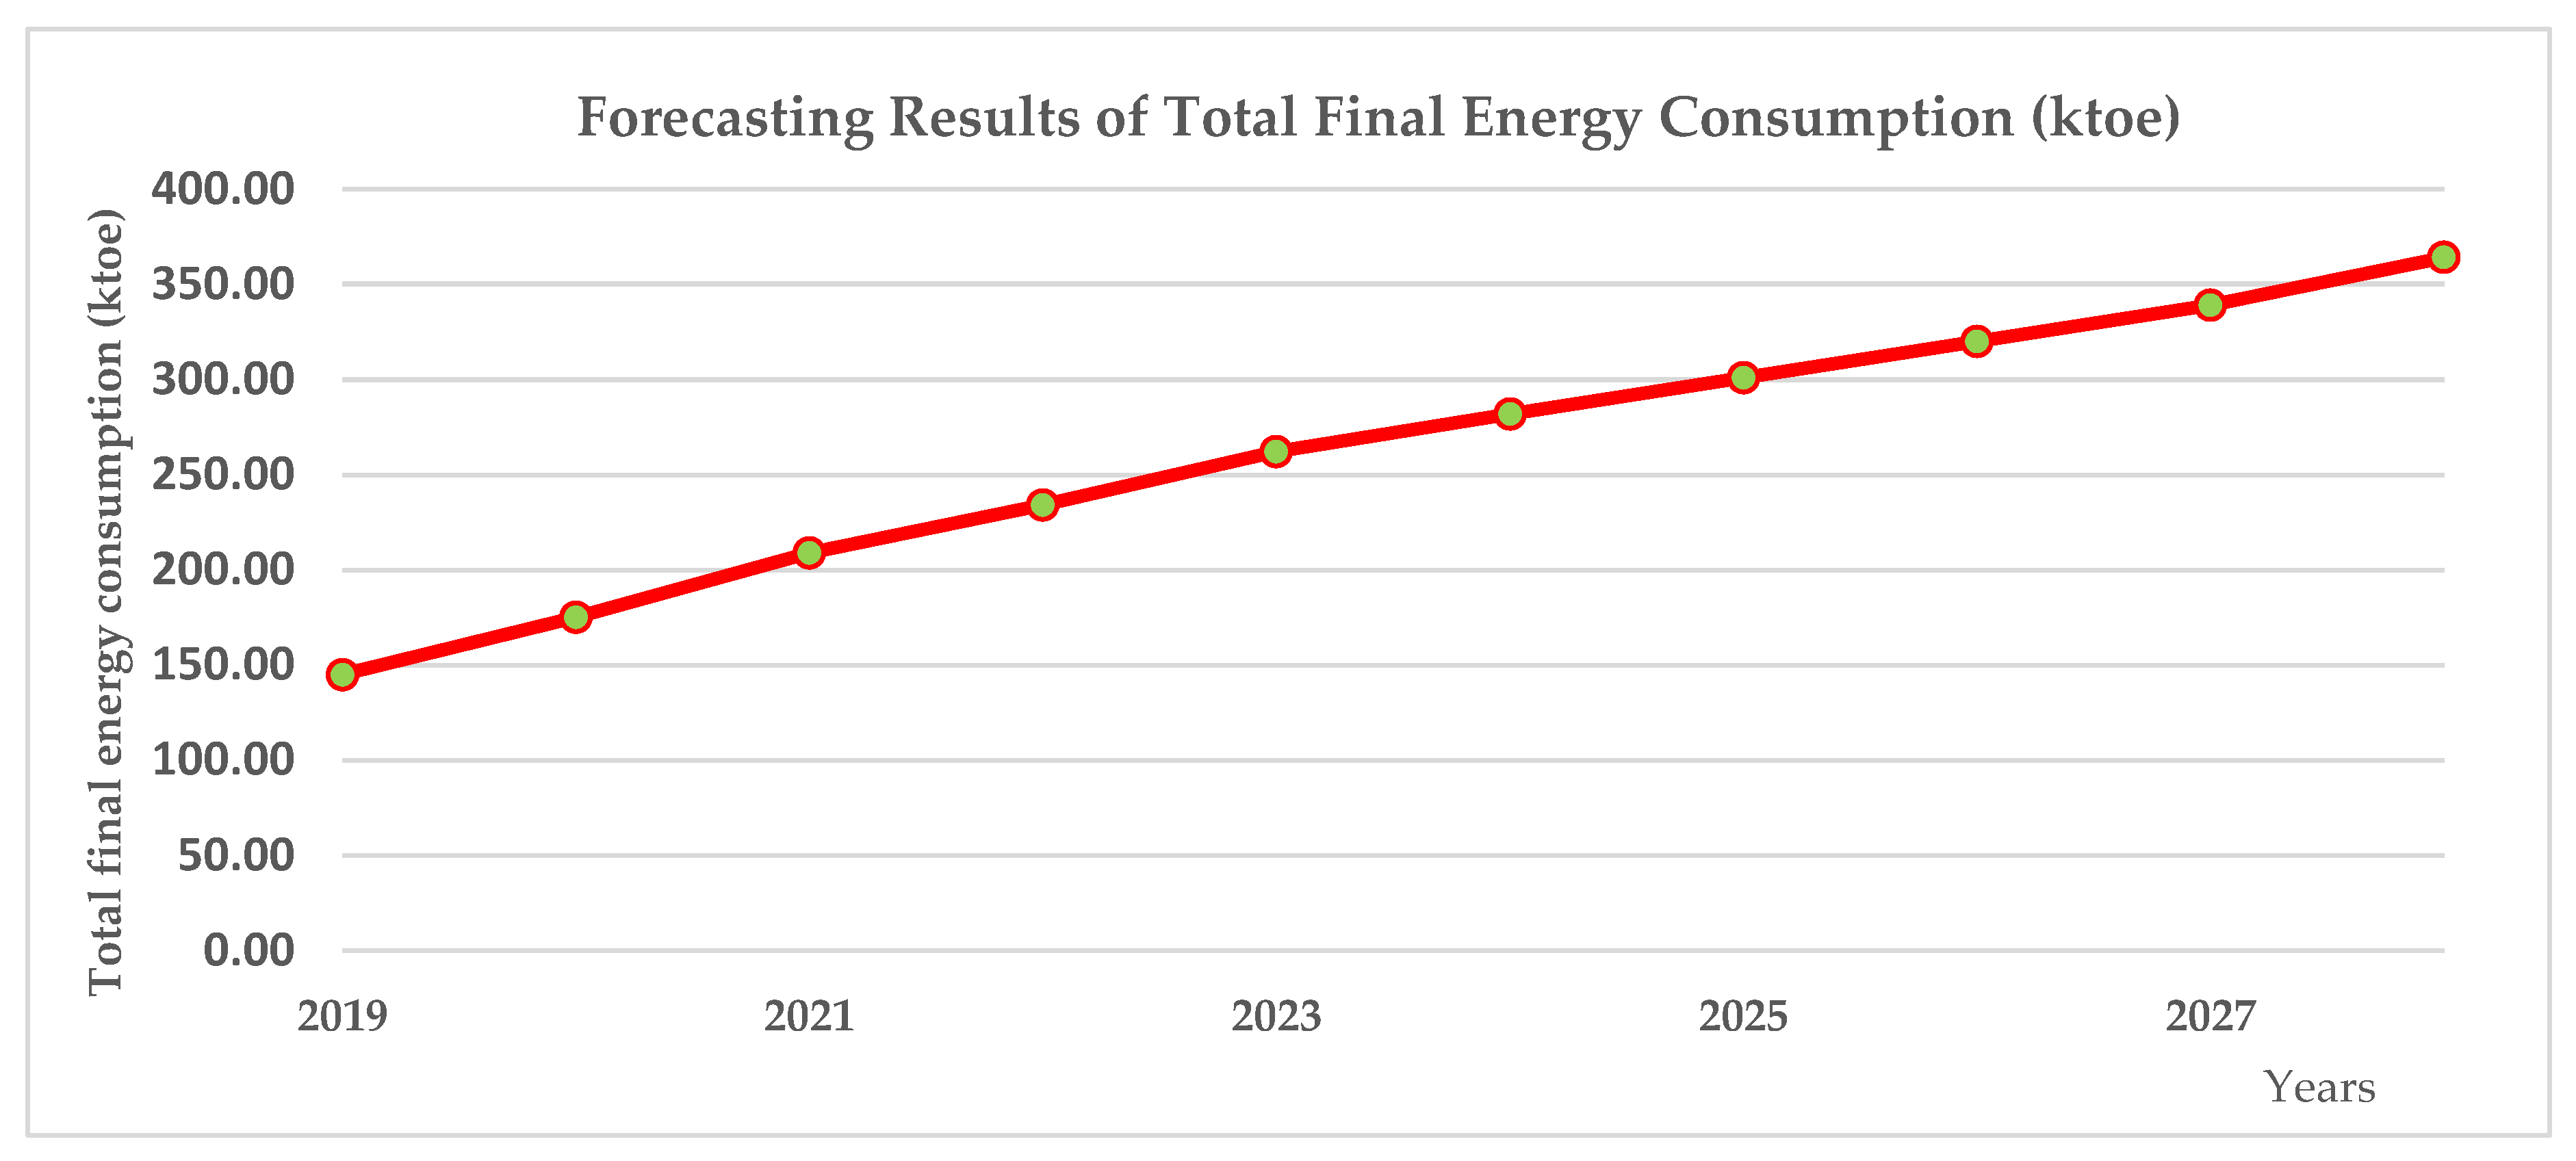
3.4. Total Final Energy Consumption Forecasting Based on the SE-VARX Model
4. Conclusions and Discussion
Author Contributions
Funding
Acknowledgments
Conflicts of Interest
References
- The World Bank: Energy Use (Kg of Oil Equivalent Per Capita) Home Page. Available online: https://data.worldbank.org/indicator/EG.USE.PCAP.KG.OE (accessed on 10 June 2018).
- Thailand Greenhouse Gas Management Organization (Public Organization). Available online: http://www.tgo.or.th/2015/thai/content.php?s1=7&s2=16&sub3=sub3 (accessed on 29 June 2018).
- Department of Alternative Energy Development and Efficiency. Available online: http://www.dede.go.th/ewtadmin/ewt/dede_web/ewt_news.php?nid=47140 (accessed on 29 June 2018).
- Office of the National Economic and Social Development Board (NESDB). Available online: http://www.nesdb.go.th/nesdb_en/more_news.php?cid=154&filename=index (accessed on 27 June 2018).
- National Statistic Office Ministry of Information and Communication Technology. Available online: http://web.nso.go.th/index.htm (accessed on 28 June 2018).
- Ashley, R.A.; Tsang, K.P. Credible granger-causality inference with modest sample lengths: A cross-sample validation approach. Econometrics 2014, 2, 72–91. [Google Scholar] [CrossRef]
- Yu, W.; Yang, F. Detection of causality between process variables based on industrial Alarm data using transfer entropy. Entropy 2015, 17, 5868–5887. [Google Scholar] [CrossRef]
- Ghafele, R.; Gibert, B. A Counterfactual impact analysis of fair use policy on copyright related industries in Singapore. Laws 2014, 3, 327–352. [Google Scholar] [CrossRef]
- Liu, Y.; Xu, J.; Luo, H. An integrated approach to modelling the economy-society-ecology system in urbanization process. Sustainability 2014, 6, 1946–1972. [Google Scholar] [CrossRef]
- Wang, Y.; Hayashi, Y.; Chen, J.; Li, Q. Changing urban form and transport CO2 emissions: An empirical analysis of Beijing, China. Sustainability 2014, 6, 4558–4579. [Google Scholar] [CrossRef]
- Bao, C.; He, D. The causal relationship between urbanization, economic growth and water use change in provincial China. Sustainability 2015, 7, 16076–16085. [Google Scholar] [CrossRef]
- Xia, C.; Li, Y.; Ye, Y.; Shi, Z. An integrated approach to explore the relationship among economic, construction land use, and ecology subsystems in Zhejiang province, China. Sustainability 2016, 8, 498. [Google Scholar] [CrossRef]
- Liu, Y.; Cai, E.; Jing, Y.; Gong, J.; Wang, Z. Analyzing the decoupling between rural-to-urban migrants and urban land expansion in Hubei province, China. Sustainability 2018, 10, 345. [Google Scholar] [CrossRef]
- Ameyaw, B.; Yao, L. Analyzing the impact of GDP on CO2 emissions and forecasting Africa’s total CO2 emissions with non-assumption driven bidirectional long short-term memory. Sustainability 2018, 10, 3110. [Google Scholar] [CrossRef]
- Zhixina, Z.; Xin, R. Causal relationships between energy consumption and economic growth. Energy Proc. 2011, 5, 2065–2071. [Google Scholar] [CrossRef]
- Du, S.; Zhu, L.; Liang, L.; Ma, F. Emission-dependent supply chain and environment-policy-making in the ‘cap-and-trade’ system. Energy Policy 2013, 57, 61–67. [Google Scholar] [CrossRef]
- Yildirim, E.; Sarac, S.-E.; Aslan, A. Energy consumption and economic growth in the USA: Evidence from renewable energy. Renew. Sustain. Energy Rev. 2016, 16, 6770–6774. [Google Scholar] [CrossRef]
- Madlener, R.; Sunak, Y. Impacts of urbanization on urban structures and energy demand: What can we learn for urban energy planning and urbanization management? Sustain. Cities Soc. 2011, 1, 45–53. [Google Scholar] [CrossRef]
- Al-mulali, U. Investigating the impact of nuclear energy consumption on GDP growth and CO2 emission: A panel data analysis. Prog. Nucl. Energy 2014, 73, 172–178. [Google Scholar] [CrossRef]
- Cutlip, L.; Fath, B.D. Relationship between carbon emissions and economic development: Case study of six countries. Environ. Dev. Sustain. 2012, 14, 433–453. [Google Scholar] [CrossRef]
- Bernstein, R.; Madlener, R. Short- and long-run electricity demand elasticities at the subsectoral level: A cointegration analysis for German manufacturing industries. Energy Econ. 2015, 48, 178–187. [Google Scholar] [CrossRef]
- Dagher, L.; Yacoubian, T. The causal relationship between energy consumption and economic growth in Lebanon. Energy Policy 2012, 50, 798–801. [Google Scholar] [CrossRef]
- Al-mulali, U.; Binti Che Sab, C.N. The impact of energy consumption and CO2 emission on the economic and financial development in 19 selected countries. Renew. Sustain. Energy Rev. 2012, 16, 4365–4369. [Google Scholar] [CrossRef]
- Chen, M.; Huang, Y.; Tang, Z.; Lu, D.; Liu, H.; Ma, L. The provincial pattern of the relationship between urbanization and economic development in China. J. Geogr. Sci. 2014, 24, 33–45. [Google Scholar] [CrossRef]
- Jiao, B.; Yang, F. The relationship between patterns of economic development and increasing carbon emissions in western China. J. Resour. Ecol. 2013, 4, 56–62. [Google Scholar]
- Liu, X.; Lathrop, R.G. Urban change detection based on an artificial neural network. Int. J. Remote Sens. 2002, 23, 2513–2518. [Google Scholar] [CrossRef]
- Williams, N.S.G.; Hahs, A.K.; Vesk, P.A. Urbanisation, plant traits and the composition of urban floras. Perspect. Plant Ecol. Evol. Syst. 2015, 17, 78–86. [Google Scholar] [CrossRef]
- Ye, J.; Chen, J.; Bai, H.; Yue, Y. Analyzing transfer commuting attitudes using a market segmentation approach. Sustainability 2018, 10, 2194. [Google Scholar] [CrossRef]
- Liu, Y.; Yang, Y. Empirical examination of users’ adoption of the sharing economy in China using an expanded technology acceptance model. Sustainability 2018, 10, 1262. [Google Scholar] [CrossRef]
- Shih, T.-Y. Determinants of enterprises radical innovation and performance: Insights into strategic orientation of cultural and creative enterprises. Sustainability 2018, 10, 1871. [Google Scholar] [CrossRef]
- Ng, T.C.; Ghobakhloo, M. What determines lean manufacturing implementation? A CB-SEM model. Economies 2018, 6, 9. [Google Scholar] [CrossRef]
- Grewal, R.; Cote, J.A.; Baumgartner, H. Multicollinearity and measurement error in structural equation implications for theory testing. Mark. Sci. 2004, 23, 519–529. [Google Scholar] [CrossRef]
- Habidin, N.F.; Mohd Zubir, A.F.; Mohd Fuzi, N.; Md Latip, N.A.; Md Latip, M. Sustainable manufacturing practices in Malaysian automotive industry: confirmatory factor analysis. J. Glob. Entrep. Resear. 2015, 5, 14. Available online: https://journal-jger.springeropen.com/articles/10.1186/s40497-015-0033-8 (accessed on 2 October 2018). [CrossRef]
- Jiao, L.; Shen, L.; Shuai, C.; He, B. A novel approach for assessing the performance of sustainable urbanization based on structural equation modeling: A China case study. Sustainability 2016, 8, 910. [Google Scholar] [CrossRef]
- Bandalos, D.L. Assessing sources of error in structural equation models: The effects of sample size, reliability, and model misspecification. Struct. Equ. Model.-Multidiscip. J. 1997, 4, 177–192. [Google Scholar] [CrossRef]
- Shen, L.; Shuai, C.; Jiao, L.; Tan, Y.; Song, X. A Global perspective on the sustainable performance of urbanization. Sustainability 2016, 8, 783. [Google Scholar] [CrossRef]
- Woo, W.T. Updating China’s international economic policy after 30 years of reform and opening: What position on regional and global economic architecture? J. Chin. Econ. Bus. Stud. 2009, 7, 139–166. [Google Scholar] [CrossRef]
- Liang, X.; Zhang, W.; Chen, L.; Deng, F. Sustainable urban development capacity measure—A case study in Jiangsu province, China. Sustainability 2016, 8, 270. [Google Scholar] [CrossRef]
- Meulemans, S.; Pribis, P.; Grajales, T.; Krivak, T. Gender differences in exercise dependence and eating disorders in young adults: A path analysis of a conceptual model. Nutrients 2014, 6, 4895–4905. [Google Scholar] [CrossRef] [PubMed]
- Han, Y.; Li, W.; Wei, S.; Zhang, T. Research on passenger’s travel mode choice behavior waiting at bus station based on SEM-logit integration model. Sustainability 2018, 10, 1996. [Google Scholar] [CrossRef]
- Cheng, X.; Cao, Y.; Huang, K.; Wang, Y. Modeling the satisfaction of bus traffic transfer service quality at a high-speed railway station. J. Adv. Transp. 2018, 12. [Google Scholar] [CrossRef]
- Wang, Y.; Yan, X.; Zhou, Y.; Xue, Q. Influencing mechanism of potential factors on passengers’ long-distance travel mode choices based on structural equation modeling. Sustainability 2017, 9, 1943. [Google Scholar] [CrossRef]
- Geng, J.; Long, R.; Chen, H.; Yue, T.; Li, W.; Li, Q. Exploring multiple motivations on urban residents’ travel mode choices: An empirical study from Jiangsu province in China. Sustainability 2017, 9, 136. [Google Scholar] [CrossRef]
- Dobrovolskienė, N.; Tvaronavičienė, M.; Tamošiūnienė, R. Tackling projects on sustainability: A Lithuanian case study. Entrep. Sustain. Issues 2017, 4, 477–488. [Google Scholar] [CrossRef]
- Prause, G.; Atari, S. On sustainable production networks for industry 4.0. Entrep. Sustain. Issues 2017, 4, 421–431. [Google Scholar] [CrossRef]
- Vegera, S.; Malei, A.; Sapeha, I.; Sushko, V. Information support of the circular economy: The objects of accounting at recycling technological cycle stages of industrial waste. Entrep. Sustain. Issues 2018, 6, 190–210. [Google Scholar] [CrossRef]
- Mishenin, Y.; Koblianska, I.; Medvid, V.; Maistrenko, Y. Sustainable regional development policy formation: Role of industrial ecology and logistics. Entrep. Sustain. Issues 2018, 6, 329–341. [Google Scholar] [CrossRef]
- Fomina, A.V.; Berduygina, O.N.; Shatsky, A. Industrial cooperation and its influence on sustainable economic growth. Entrep. Sustain. Issues 2018, 5, 467–479. [Google Scholar] [CrossRef]
- Oganisjana, K.; Svirina, A.; Surikova, S.; Grīnberga-Zālīte, G.; Kozlovskis, K. Engaging universities in social innovation research for understanding sustainability issues. Entrep. Sustain. Issues 2017, 5, 9–22. [Google Scholar] [CrossRef]
- Dickey, D.A.; Fuller, W.A. Likelihood ratio statistics for autoregressive time series with a unit root. Econometrica 1981, 49, 1057–1072. [Google Scholar] [CrossRef]
- MacKinnon, J. Critical Values for Cointegration Test. In Long-Run Economic Relationships; Engle, R., Granger, C., Eds.; Oxford University Press: Oxford, UK, 1991. [Google Scholar]
- Johansen, S.; Juselius, K. Maximum likelihood estimation and inference on cointegration with applications to the demand for money. Oxford Bull. Econ. Statist. 1990, 52, 169–210. [Google Scholar] [CrossRef]
- Johansen, S. Likelihood-Based Inference in Cointegrated Vector Autoregressive Models; Oxford University Press: New York, NY, USA, 1995. [Google Scholar]
- Harvey, A.C. Forecasting, Structural Time Series Models and the Kalman Filter; Cambridge University Press: Cambridge, UK, 1989. [Google Scholar]
- Enders, W. Applied Econometrics Time Series; Wiley Series in Probability and Statistics; University of Alabama: Tuscaloosa, AL, USA, 2010. [Google Scholar]


| Tau Test at First Difference I(1) | MacKinnon Critical Value | |||
|---|---|---|---|---|
| Variables | Value | 1% | 5% | 10% |
| −5.96 *** | −5.05 | −4.75 | −3.50 | |
| −5.84 *** | −5.05 | −4.75 | −3.50 | |
| −5.25 *** | −5.05 | −4.75 | −3.50 | |
| −5.77 *** | −5.05 | −4.75 | −3.50 | |
| −6.05 *** | −5.05 | −4.75 | −3.50 | |
| −5.39 *** | −5.05 | −4.75 | −3.50 | |
| −5.71 *** | −5.05 | −4.75 | −3.50 | |
| −5.44 *** | −5.05 | −4.75 | −3.50 | |
| −5.70 *** | −5.05 | −4.75 | −3.50 | |
| Variables | Hypothesized Number of CE(S) | Trace Statistic Test | Max-Eigen Statistic Test | MacKinnon Critical Value | |
|---|---|---|---|---|---|
| 1% | 5% | ||||
| , , , , , , , , | None *** | 225.11 | 132.70 | 15.05 | 12.50 |
| At Most 1 *** | 70.09 | 49.02 | 5.05 | 3.75 | |
| Dependent Variables | Direct Effect | |||||||||
|---|---|---|---|---|---|---|---|---|---|---|
| Short Term | Long Term | |||||||||
| - | 6.54 ** | 4.02 ** | 5.33 ** | 5.74 ** | 5.13 ** | 4.91 ** | 5.65 ** | 3.91 ** | −2.01 * | |
| 4.64 ** | - | 4.11 ** | 5.49 ** | 6.42 ** | 6.18 ** | 6.28 ** | 6.77 ** | 6.45 ** | −4.45 ** | |
| 2.17 * | 3.11 ** | - | 2.11 * | 3.69 ** | 2.19 * | 2.01 * | 2.92 * | 2.13 * | −3.07 * | |
| 4.07 ** | 5.61 ** | 2.15 * | - | 5.97 ** | 6.55 ** | 5.89 ** | 4.68 ** | 6.51 ** | −5.19 ** | |
| 3.99 ** | 4.94 ** | 2.04 * | 5.09 ** | - | 6.19 ** | 6.10 ** | 4.01 ** | 5.73 ** | −5.21 ** | |
| 3.19 ** | 2.04 * | 4.60 ** | 5.74 ** | 4.67 ** | - | 2.01 * | 2.19 * | 4.34 ** | −3.11 ** | |
| 4.17 ** | 2.19 * | 3.95 ** | 6.02 ** | 5.81 ** | 4.90 ** | - | 2.04 * | 3.97 ** | −5.22 ** | |
| 2.03 * | 2.24 * | 2.60 * | 5.94 ** | 2.91 * | 4.19 ** | 2.01 * | - | 2.23 * | −3.39 ** | |
| 4.95 ** | 2.21 * | 3.99 ** | 4.71 ** | 5.84 ** | 6.05 ** | 4.87 ** | 3.93 ** | - | −4.07 ** | |
| Forecasting Model | Mean Absolute Percentage Error (MAPE) (%) | Root Mean Square Error (RMSE) (%) |
|---|---|---|
| ML model | 19.16 | 17.52 |
| ANN model | 12.64 | 12.49 |
| BP model | 11.59 | 11.26 |
| Grey model | 5.37 | 4.41 |
| ARIMA Model | 3.22 | 3.04 |
| SE-VARX Model | 1.09 | 1.01 |
© 2018 by the authors. Licensee MDPI, Basel, Switzerland. This article is an open access article distributed under the terms and conditions of the Creative Commons Attribution (CC BY) license (http://creativecommons.org/licenses/by/4.0/).
Share and Cite
Sutthichaimethee, J.; Kubaha, K. The Relationship of Causal Factors Affecting the Future Equilibrium Change of Total Final Energy Consumption in Thailand’s Construction Sector under a Sustainable Development Goal: Enriching the SE-VARX Model. Resources 2019, 8, 1. https://doi.org/10.3390/resources8010001
Sutthichaimethee J, Kubaha K. The Relationship of Causal Factors Affecting the Future Equilibrium Change of Total Final Energy Consumption in Thailand’s Construction Sector under a Sustainable Development Goal: Enriching the SE-VARX Model. Resources. 2019; 8(1):1. https://doi.org/10.3390/resources8010001
Chicago/Turabian StyleSutthichaimethee, Jindamas, and Kuskana Kubaha. 2019. "The Relationship of Causal Factors Affecting the Future Equilibrium Change of Total Final Energy Consumption in Thailand’s Construction Sector under a Sustainable Development Goal: Enriching the SE-VARX Model" Resources 8, no. 1: 1. https://doi.org/10.3390/resources8010001
APA StyleSutthichaimethee, J., & Kubaha, K. (2019). The Relationship of Causal Factors Affecting the Future Equilibrium Change of Total Final Energy Consumption in Thailand’s Construction Sector under a Sustainable Development Goal: Enriching the SE-VARX Model. Resources, 8(1), 1. https://doi.org/10.3390/resources8010001