Article

Assessing the Impacts of Climate Change on Distribution of Major Non-Timber Forest Plants in Chitwan Annapurna Landscape, Nepal

1
International Centre for Integrated Mountain Development (ICIMOD), Khumaltar, Lalitpur, Kathmandu 44700, Nepal
2
Indian Institute of Remote Sensing (IIRS), 4 Kalidas Road, Dehradun 248001, Uttarakhand, India
*
Authors to whom correspondence should be addressed.
Resources 2018, 7(4), 66; https://doi.org/10.3390/resources7040066
Submission received: 18 September 2018 / Revised: 12 October 2018 / Accepted: 18 October 2018 / Published: 23 October 2018

Abstract

:
For many decades, non-timber forest products (NTFPs) have been an important livelihood commodity in Nepal as a traditional source of food, fiber, and medicines. However, the importance of NTFPs have been recognized only recently. NTFPs form more than 5% of Nepal’s national gross domestic product and are facing threat due to anthropogenic drivers and changing climate. Understanding of the current distribution and future dynamics of NTFPs is essential for effective conservation planning and management. In the maiden attempt, we used the Maxent model to understand the current and predict the future distribution by 2050 of 10 major NTFPs in Chitwan Annapurna Landscape, Nepal. The prediction accuracy of the models calculated based on the area under curve was high (>90%) and the prediction by 2050 highlights potential increase in distribution range of seven NTFPs and potential decrease in that of three NTFPs in the study area. The results from our study could play an important role in planning and management of these NTFPs considering their high economic and ecological significance and sensitivity to predicted climate change.

1. Introduction

1.1. Non-Timber Products in Nepal: Current Context

Non-Timber Forest Products (NTFPs) are biological materials other than timber, which are extracted from forests, trees outside forests, and other wooded lands that include products used as food, resins, fibers, and plant products used for medicinal, cosmetic, or cultural purposes [1] or traded as a commodity for cash income [2]. For many decades NTFPs have been an important livelihood commodity in Nepal as a traditional source of food, fiber, and medicines. However, the values of NTFPs have been recognized only recently [3,4]. One-third of rural people in Nepal collect and trade forest products, which in 2010 generated USD 7.66 million and benefitted 78,828 participants [5]. A total of 100 entrepreneurs handled 42 thousand tons of over 100 different NTFP items, equivalent to USD 26 million [6] and it is estimated that about 10,000 to 15,000 tons of plant products of more than 100 species are exported to India annually, i.e., 90% of total NTFP trade [7]. Harvest of NTFPs usually has lower impacts on the forest ecosystem than timber harvesting and it can provide an array of social and economic benefits [8]. The maintenance of a forest-like structure associated with NTFPs production is generally acknowledged as being positive, contributing to some of the classical forest environmental functions like carbon storage, nutrient cycling, erosion control, and hydrological regulation [9].

1.2. Impacts of Climate Change on Himalayan Flora

During the past decade, the rates of climatic warming in Himalaya have been reported to exceed over 1.2 °C, which has drastically impacted the forest ecosystems providing non-timber forest products in the region. Climate change impacts are becoming increasingly evident in the Himalayan region [10,11,12] which has profound implications for mountain communities [13], its biodiversity, ecosystem services [14], water resources [15], agricultural systems [16], and both regional and global climate processes. The rate of regional warming in parts of the Himalayas has exceeded rates of global warming [17], and it will have major implications for this vast mountainous region [18]. Nonetheless, impacts of regional climate change are poorly understood [19], sparsely monitored, and generally under-researched [12,20]. Zomer et al. [12] predicted large and substantial shifts in bioclimatic zones and ecoregions in Kailash Sacred Landscape situated in western Himalaya. Various studies have reported direct and indirect roles of climate change in degradation of forests in Nepal, such as forest destruction due to over increasing frequency of forest fires, expansion in distribution of invasive alien plants, reduced forest productivity, and reduction in produce from non-timber forest products [21,22].
The various habitat and corridor types stretch as narrow bands, and it is likely that climate-induced shifts in the biota will drastically alter species’ interactions, ecological processes, and species’ ranges in Nepal [23]. The effects of temperature and precipitation change on phenological parameters of vegetation systems in 13 different ecoregions within the Himalayan plateau is strongly correlated [22]. Alteration in species’ distributions and range limits predicted or recorded in this region beget the question of how species’ interactions may change within shifting ecotones, whether new interactions will emerge, and how these changes will affect existing species [24,25]. The results of one study [26] infer increased competition and vulnerability of endemic, alpine species as lower elevation species’ ranges move northward.

1.3. Modelling the Impacts of Climate Change

Various techniques have been developed for understanding and modelling the ecological niche of plant species [27]. Predictive modelling of species distribution represents an important tool in biogeography, ecology, and biodiversity studies [28,29]. Species distribution models (SDMs) identify regions of suitable habitat, and, as such, predict the potential distribution range of species [30,31]. SDMs attempt to predict the species’ geographic ranges from occurrence (presence only or presence/absence) records and site-specific environmental data [32,33,34]. Species distribution models (SDMs) dealing with presence only data were proven to be advantageous over the methods considering presence and absence data [35,36]. The maximum entropy method is a general-purpose machine learning method with a simple and precise mathematical formulation. Maxent is a bioclimatic model, which deals with presence only data and has a number of aspects that makes it well-suited for species distribution modeling [36]. Phillips et al. [36] used Maxent model to predict the distribution of Microryzomys minutus and Bradypus variegatus in Andes mountains, whereas [37] predicted the distribution of threatened and endangered tree species, Canacomyrica monticola in New Caledonia using Maxent model. Most of the SDM-based studies focusing on plants have predicted the potential distribution of herbs and shrubs, however only a few studies have focused on trees [38] which are an important source not only for timber and fuelwood [39,40,41] but also for non-timber forest products.
Due to a scarcity of environmental and historical bioclimatic data, absence of systematic monitoring, and political sensitivities within the Himalayan region, there is a lack of knowledge for developing scientifically-based adaptation strategies, which are crucial to mitigate the potentially severe impacts of climate change. Hence, an ever-improving estimation response of plant species to regional climatic change is essential to provide for informed decision making, risk and vulnerability mapping, the delineation and development of climate change adaptation and mitigation strategies, and effective biodiversity and conservation management [12]. An improved understanding of the impacts of climate change on forest ecosystems is essential for effective conservation within the context of rapidly changing biophysical conditions.
In the present study, we assess the dynamics in distribution of 10 major non-timber forest product plants in Chitwan Annapurna Landscape (CHAL) Nepal, under current and predicted climatic conditions. The species were selected based on their economic and medicinal importance, ecological significance, and dominance as a top canopy species in the forest ecosystems in CHAL (Table 1).

2. Materials and Methods
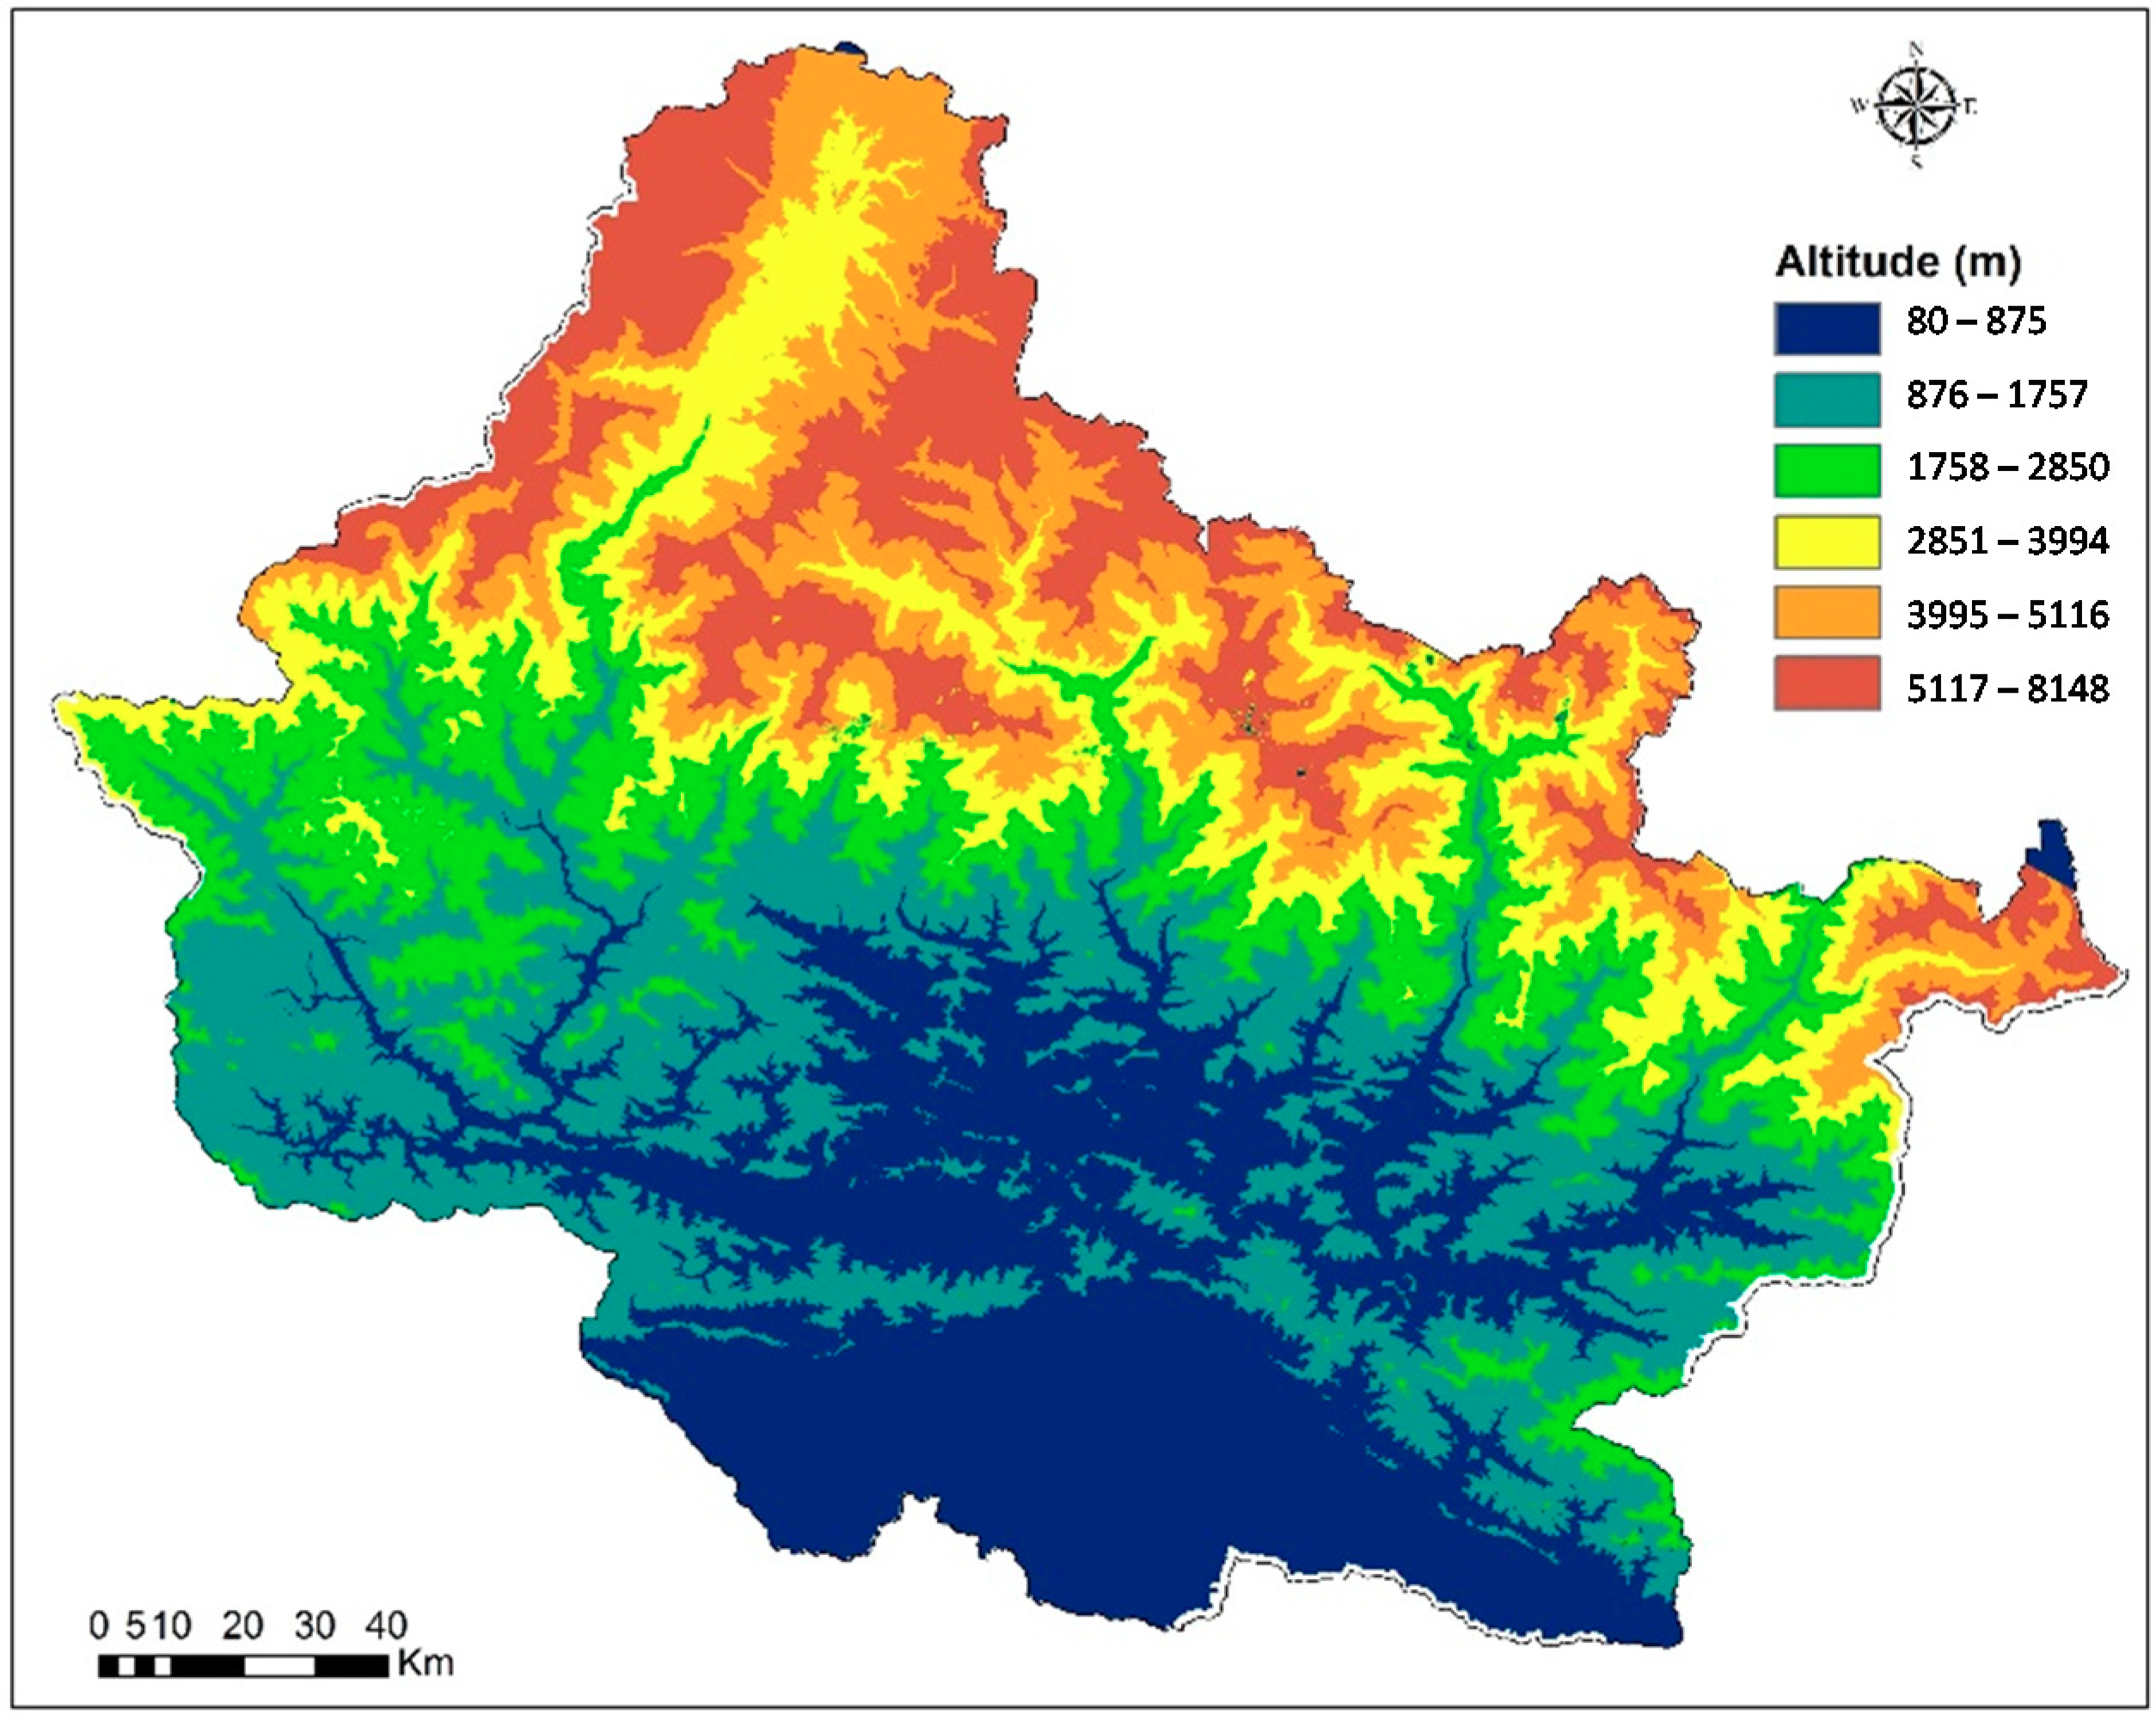
2.1. Study Area

This study was conducted in Chitwan Annapurna Landscape (CHAL) (Figure 1) located between 27.16 to 29.3 N latitudes and 82.7 to 85.7 E longitudes in Central Nepal. The landscape covers an area of 32,057 km2, with an altitudinal gradient of 200 m to 8091 m that accommodates diverse ecosystems. Divided into the Terai, midhills, and high mountains, the climate ranges considerably from subtropical in the lowlands to alpine in the high mountains and cold and dry in the Trans-Himalayan region. The entire region is sensitive to changes in climate, which makes it a suitable study area to undertake studies on understanding impacts of climate change [42]. More than 35 percent of the region is forested, ranging from mixed deciduous hardwood in the Siwaliks, through broad-leaved evergreen forests, mixed broad-leaved forests, coniferous forests to alpine scrub and meadows in the high mountains. The landscape includes a wide floral and faunal diversity, harboring several economically valuable tree species, tropical grasslands, and riverine forests. Maximum diversity and distribution of NTFPs occurs in the sub-tropical zone, followed by the temperate zone, the tropical zone, the sub-alpine zone, and the alpine zone, respectively, in CHAL [43]. Sub-alpine and alpine meadows support one of the world’s most diverse alpine floral ecosystem inhabiting the endangered snow leopard [42]. Administratively, the landscape includes all or part of 19 districts and is drained by six major perennial rivers and their tributaries in the broader Gandaki River System.

2.2. Data

2.2.1. Data on Distribution of NTFPs

We selected 10 major non-timber forest product plant species based on their economic importance, ecological significance, and dominance in the forests: (1) Alnus nepalensis D. Don (Local Name: Utis); (2) Diploknema butyracea (Roxb.) H.J. Lam (Local Name: Chiuri); (3) Castanopsis tribuloides (Sm.) A. DC (Local Name: Katus); (4) Myrica esculenta Buch.-Ham. Ex D. Don (Local Name: Kaphal); (5) Persea odoratissima Ness. (Local Name: Kaulo); (6) Pinus patula Schiede & Deppe (Local Name: Patte Salla); (7) Pinus roxburghii Sarg. (Local Name: Khote Salla); (8) Rhododendron arboreum Sm. (Local Name: Gurans); (9) Shorea robusta Gaertn. f. (Local Name: Sal); and (10) Taxus wallichiana Zucc. (Local Name: Loth Salla). The data on the habit, habitat, distribution, economic importance, and ecological significance for these 10 species was acquired from District Forest Operational Management Plan (DFMOP), MAPs-Net website, and field sampling points.

2.2.2. Bioclimatic Data

We used 19 bioclimatic variables for the current time period and future time periods as per RCP 4.5 for year 2050 provided by worldclim.org, which are widely used for species distribution modelling studies [44]. We selected the year 2050 as the prediction year because the responses of climate change would be clearly evident by that time [45]. Nineteen bioclimatic variables were obtained from WorldClim dataset [46] (http://www.worldclim.org/bioclim.htm). Elevation (digital elevation model; DEM) data were obtained from the USGS website (http://www.usgs.gov.in/#/Find_Data/Products_and_Data_Available/SRT); 1 km spatial resolution. All ancillary layers were resampled to 1 km spatial resolution to match with the spatial resolution of bioclim data.

2.2.3. Modelling Approach & Validation

We used Maxent model [36] to analyze the distribution of 10 NTFP species individually based on a total of 653 distribution points (Table 1) under present and future climate change scenarios for the year 2050. We simulated the distribution of NTFPs in the free version of Maxent software, version 3.3.3k (http://www.cs.princeton.edu/~schapire/maxent/), which generates an estimate of the probability of species presence that varies from 0 to 1, i.e., from the lowest to the highest probability. The receiver operating curve (ROC) describes the relationship between the proportion of correctly predicted observed presences, i.e., sensitivity and the proportion of incorrectly predicted observed absences, i.e., 1-specificity. A precise prediction model generates a ROC that follows the left axis and top of the plot, whereas a model with predictions worse than a random model will generate a ROC that follows the 1:1 line.
It is always recommended to validate model predictions prior to any interpretation, extrapolation, or projection [47]. Ideally, an independent dataset should be used for testing the model performance, so we divided the 653 distribution points into 70:30 proportion for training (457) and testing (196), respectively. We followed the jackknife (also called ‘leave one-out’) procedure and the results were obtained in the form of three graphs, viz. (i) regularized training gain, (ii) testing gain, and (iii) area under curve, indicating the significance of the environmental variables together and as individual cases. The graphs for omission and predicted area and sensitivity versus 1-specificity were obtained to analyse the predicted fractional area to judge the performance of the model against the random prediction. The specificity graph shows omission on training samples (blue line), omission on test samples (cyan line), predicted omission (black line), and fraction of predicted background (red). The graph for fractional predicted area (FPA), i.e., 1-specificity shows the performance under training data (red line), test data (blue line), and random prediction (black line) [38]. We used this method for assessing the model prediction accuracy for all the model predictions.

3. Results & Discussion

3.1. Prediction Accuracy of Species Distribution Models

Overall prediction accuracy of the model used for analyzing the current and predicted distribution individually for the 10 NTFPs with training data ranged between 0.80 and 0.91 prediction accuracy of test data ranged between 0.75 and 0.93, which makes the predictions usable for further analysis.
For the current time period, the minimum training data value is 0.815 for Persea odoratissima (Nees) Kosterm and maximum is 0.91 for Pinus patula Schiede & Deppe (Table 2). Similarly, minimum test data value for the present period is 0.632 for Taxus wallichiana (Zucc.) Pilger and maximum is 0.93 for Persea odoratissima (Nees) Kosterm. For the current time period, average training data and test data are 0.86 and 0.73, respectively. Likewise, for the year 2050, the minimum value of training data is 0.828 for Castanopsis tribuloides (Sm.) A. DC whereas the maximum value is 0.897 for Alnus nepalensis D. Don. The minimum value of test data for the year 2050 is 0.536 for Pinus patula Schiede & Deppe and maximum value is 0.988 for Persea odoratissima (Nees) Kosterm. Average training data and test data are 0.862 and 0.746, respectively, for the future time period.
From the jackknife analysis, three variables for each time period out of a total of 22 bioclimatic physiographic variables used as predictor variables showed a significant influence in predicting the distribution of the 10 target NTFP species (Table 2) viz., (i) Mean Temperature of Driest Quarter, Min Temperature of Coldest Month, (ii) Temperature Seasonality (standard deviation *100), Temperature Annual Range (BIO5-BIO6), and (iii) Max Temperature of Warmest Month for present time period and for year 2050, (i) Precipitation of Warmest Quarter, Annual Precipitation, (ii) Precipitation of Warmest Quarter, Annual Precipitation, and (iii) Temperature Seasonality (standard deviation *100).

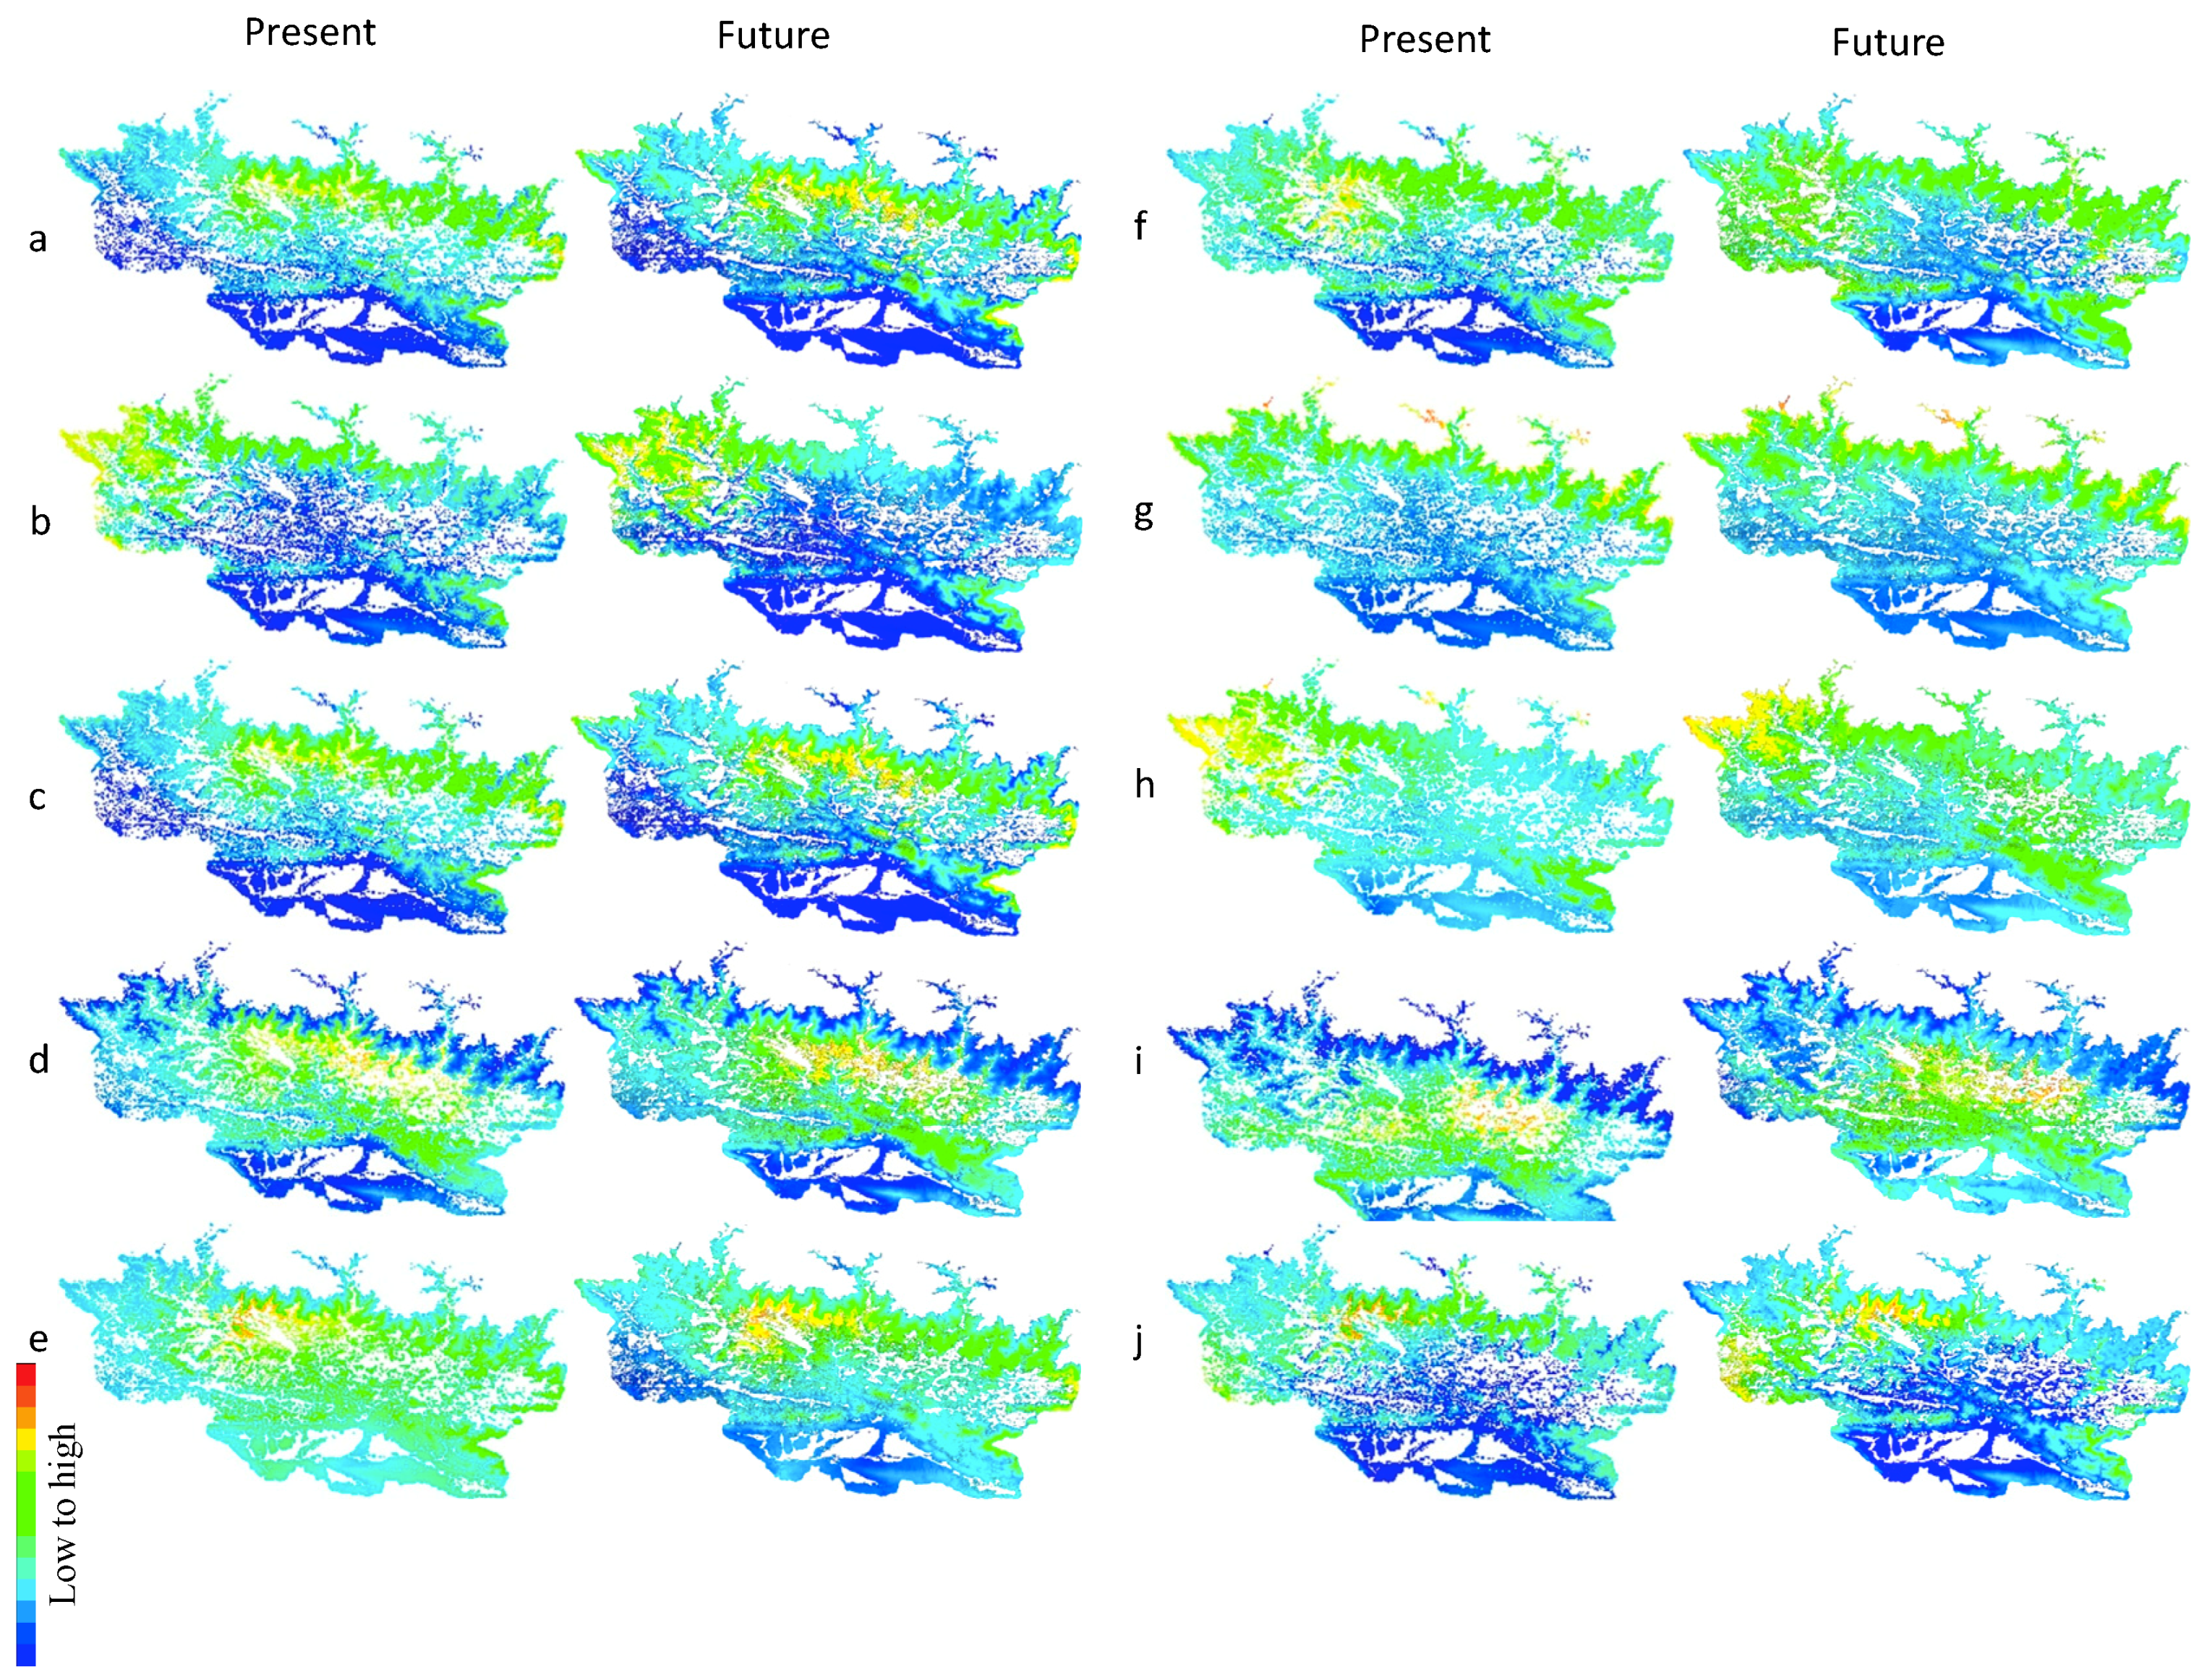
3.2. Current Distribution of NTFPs

Under current climatic conditions, the overall distribution of these species is spread throughout the central, northern, and north-western parts of the landscape. A. nepalensis is distributed in the west and north-west area of the region. S. robusta and C. tribuloides are concentrated in the central area of region. P. patula is distributed throughout the north and P. roxburghii is occurs mostly in the western areas of the landscape. T. wallichiana is restricted to a few patches in the mid-western part of the region. D. butyracea and M. esculenta are limited to the northern and north-eastern parts. Likewise, P. odoratissima and R. arboreum are distributed in northern and north-west locations.

3.3. Range Expansion and Reduction by 2050

Projected changes suggest that the ten NTFP species will be adversely impacted, even under a moderate climate scenario. According to projected future climate conditions for 2050 under RCP 4.5, the distribution of the various species is likely to shift east and north-east in CHAL, with both range expansion and range reduction depending on the species (Figure 2). A significant range expansion of A. nepalensis is predicted in the north and west. Likewise, the distribution of C. tribuloides is predicted to expand with a more favorable climate in the central and northern parts of the region. P. roxburghii is likely to concentrate towards the north with significant expansion in central east area. The distribution of S. robusta is predicted to increase on the central area of the region where as T. wallichiana is predicted to expand significantly in the western area of the region and minor expansion will occur in eastern part of the region. The D. butyracea is predicted to be reduced and limited to the northern parts of the region. M. esculenta is predicted to undergo range reduction and will be focused only in the central and northern parts of the region. P. odoratissima is predicted to experience drastic range reduction, becoming restricted to only a small patch in the north-western part of the region.

3.4. Implications for Management of Non-Timber Forest Products

Most of the NTFPs from the study are expected to undergo range expansion; however, considering current trends of extraction of these plants, it will be crucial to have effective planning and management for ensuring sustainability of these resources. Rasul et al. [48] concluded that there is a need for policies to optimize potential of NTFPs to support social, economic, and environmental wellbeing. There is a need to develop an efficient management approaches and to focus on effective implementation. Furthermore, understanding spatial distribution patterns, seasons of availability, and regeneration status of NTFPs are important to develop and enforce conservation regulations [49]. A major issue in inventory of NTFPs is the lack of data on their distribution that makes it more difficult to understand linkages with different vegetation types, and various socio-ecological conditions. This needs to be addressed, considering that it has a crucial role in monitoring, conservation, and management of NTFPs. Our results provide crucial insights on the current and future distribution of 10 major NTFPs from Nepal, which could prove to be advantageous in the conservation of these species.

4. Conclusions

NTFPs are important provisioning services people obtain from forest ecosystems [50] and are a major source of medicines, fiber, construction materials, and supplementary food [51,52]. Biological resources obtained from forests, mostly NTFPs, may contribute about 20–25% of income to rural people in developing countries [52]. Based on this study, we conclude that under existing climatic conditions, distribution of the species studied is confined from central to west to north and north-east parts of the landscape. Prediction accuracy of the species distribution models in the current as well as future time period depends on factors including spatial resolution, size of the study area, model of choice, and quality of datasets. Results of predictions shows that NTFPs will be impacted even under a moderate climate scenario with both range expansion and range reduction. Out of ten species, three species viz. D. butyracea, M. esculenta, and P. odoratissima are predicted to undergo range reduction and will be concentrated in northern, central to northern, and north-west parts of the region, respectively. The remaining seven species viz. A. nepalensis, C. tribuloides, P. roxburghii, S. robusta, T. wallichiana, P. patula, and R. arboretum, are predicted to expand in range with remarkable shifts towards the north, west, and central regions of the landscape.
Species distribution modeling represents an important area of inquiry that deserves the attention of the scientific community. A better understanding on how species will respond to climate change is essential for assessing vulnerability while identifying suitable adaptation options. Nepal represents the land cover diversity in the Hindu Kush Himalayas region. The Intergovernmental Panel on Climate Change (2007) has acknowledged the Hindu Kush Himalayas region as a data deficit area [53].
A better understanding of how species will respond to ongoing climate change is crucial for assessing vulnerability and guiding adaptation efforts. Climate change and dependence of communities on forests for their daily livelihoods has put tremendous pressure on the flora of Nepal which compelled us to conduct the present study, the results of which might be crucial while identifying suitable adaptation options in Central Nepal. Collection and maintenance of biodiversity databases and management of herb plants for poverty reduction are two major activities of adaptation to climate change for the forest sector in Nepal suggested by Ref. [54]. Sustainable management of herb species supports biodiversity conservation and increases income in local communities. Sharma et al. [55] have identified clear gaps in research on proven biodiversity conservation techniques, or climate adaptation techniques, targeted for this region. The results of this study have implications for conservation of major non-timber forest products in Central Nepal, which are expected to undergo shifts under predicted climate change. Given the large dependence of local communities on these and other NTFPs for livelihoods, there is an urgent need for identification and implementation of suitable climate change adaptation strategies. This type of study provides useful insights on impacts of climate change on NTFPs, which needs to be upscaled for Nepal, considering the role of NTFPs in the livelihoods of people.

Author Contributions

For research articles with several authors, a short paragraph specifying their individual contributions must be provided. The following statements should be used “Conceptualization, V.C. and R.S.; Methodology, V.C., R.S., and M.M.; Software, V.C. and R.S.; Validation, V.C., R.S., and M.M.; Formal Analysis, V.C., R.S., and M.M.; Investigation, V.C. and R.S.; Resources, V.C. and R.S.; Data Curation, V.C. and R.S.; Writing—Original Draft Preparation, V.C., R.S., and M.M.; Writing—Review & Editing, V.C., R.S.; Supervision, V.C.; Project Administration, V.C. and M.M.

Funding

This research was funded by NASA-USAID funded SERVIR program and “The APC was funded by Core funds of ICIMOD.

Acknowledgments

The authors would like to acknowledge the NASA-USAID funded SERVIR Program at ICIMOD for providing the funding to conduct this research and the funding provided by Core Funds of ICIMOD for the APC. The authors would like acknowledge the comments from the two anonymous reviewers, which helped improve the quality of the earlier version of the manuscript.

Conflicts of Interest

The authors declare no conflict of interest.

References

  1. Lanly, J.-P. Tropical Forest Resources; FAO, Roma (Italia) United Nations Environment Programme: Nairobi, Kenia, 1982; ISBN 9251011877. [Google Scholar]
  2. Dangi, R.B. Impact of NTFP Harvesting in Forest Conservation. Initiation 2008, 2, 165–171. [Google Scholar] [CrossRef]
  3. Ojha, H.R. Current Policy Issues in NTFP Development in Nepal; Asia Network Small-Scale Bio-Resources: Kathmandu, Nepal, 2000. [Google Scholar]
  4. Banjade, M.R.; Paudel, N.S. Economic Potential of Non-timber Forest Products in Nepal: Myth or Reality? J. For. Livelihood 2008, 7, 36–48. [Google Scholar]
  5. Agrawal, A.; Cashore, B.; Hardin, R.; Shepherd, G.; Benson, C.; Miller, D. Economic Contributions of Forests. United Nations Forum on Forests, Background Paper No.1, Tenth Session, 8–19 April, 2013, 1–127. Available online: http://www.un.org/esa/forests/pdf/session_documents/unff10/EcoContrForests.pdf (accessed on 22 August 2018).
  6. Subedi, B.P. Utilization of non-timber forest products: Issues and strategies for environmental conservation and economic development. In Theme Paper Presented at the Workshop on the Utilisation of NTFPs for Environmental Conservation and Economic Development in Nepal; Asia Network for Small Scale Agricultural Bioresources: Kathmandu, Nepal, 1997; 11p. [Google Scholar]
  7. Edwards, D.M. Non-timber Forest Products from Nepal: Aspect of the Trade in Medicinal and Aromatic Plants; FORESC Monograph no. 1/96; Forest Research and Survey Centre, Ministry of Forest and Soil Conservation: Kathmandu, Nepal, 1996; 134p.
  8. Forest Stewardship Council, Standards for Non-Timber Forest Products. 2002. FSC Web Page. Available online: http://www.fscstandards.org/regions/pacific/non_forest.html (accessed on 22 August 2018).
  9. Myers, N. Tropical forests: Much more than stocks of wood. J. Trop. Ecol. 1988, 4, 209–221. [Google Scholar] [CrossRef]
  10. Ramesh, K.V.; Goswami, P. Reduction in temporal and spatial extent of the Indian summer monsoon. Geophys. Res. Lett. 2007, 34, 1–6. [Google Scholar] [CrossRef]
  11. Shrestha, D.; Singh, P.; Nakamura, K. Spatiotemporal variation of rainfall over the central Himalayan region revealed by TRMM Precipitation Radar. J. Geophys. Res. Atmos. 2012, 117, 1–14. [Google Scholar] [CrossRef]
  12. Zomer, R.J.; Trabucco, A.; Metzger, M.J.; Wang, M.; Oli, K.P.; Xu, J. Projected climate change impacts on spatial distribution of bioclimatic zones and ecoregions within the Kailash Sacred Landscape of China, India, Nepal. Clim. Chang. 2014, 125, 445–460. [Google Scholar] [CrossRef]
  13. Ebi, K.L.; Woodruff, R.; von Hildebrand, A.; Corvalan, C. Climate Change-related Health Impacts in the Hindu Kush-Himalayas. Ecohealth 2007, 4, 264–270. [Google Scholar] [CrossRef]
  14. Beniston, M. Climatic Change in Mountain Regions: A Review of Possible Impacts. In Climate Variability and Change in High Elevation Regions: Past, Present & Future; Diaz, H.F., Ed.; Springer: Dordrecht, The Netherlands, 2003; pp. 5–31. ISBN 978-94-015-1252-7. [Google Scholar]
  15. Immerzeel, W.W.; van Beek, L.P.H.; Bierkens, M.F.P. Climate Change Will Affect the Asian Water Towers. Science 2010, 328, 1382–1385. [Google Scholar] [CrossRef] [PubMed]
  16. Maikhuri, R.K.; Rao, K.S.; Semwal, R.L. Changing scenario of Himalayan agro- ecosystem: Loss of agro-biodiversity an indicator of environment change in Central Himalaya, India. Environmentalist 2001, 21, 23–39. [Google Scholar] [CrossRef]
  17. Chaudhary, P.; Bawa, K.S. Local perceptions of climate change validated by scientific evidence in the Himalayas. Biol. Lett. 2011. [Google Scholar] [CrossRef] [PubMed]
  18. Xu, J.; Lebel, L.; Sturgeon, J. Functional links between biodiversity, livelihoods, and culture in a hani swidden landscape in southwest china. Ecol. Soc. 2009, 14. [Google Scholar] [CrossRef]
  19. Xu, J.; Shrestha, A.; Vaidya, R.; Eriksson, M.; Hewitt, K. The Melting Himalayas: Regional Challenges and Local Impacts of Climate Change on Mountain Ecosystems and Livelihoods; International Centre for Integrated Mountain Development (ICIMOD): Kathmandu, Nepal, 2007. [Google Scholar]
  20. Schild, A. ICIMOD’s Position on Climate Change and Mountain Systems. Mt. Res. Dev. 2008, 28, 328–331. [Google Scholar] [CrossRef]
  21. Telwala, Y.; Brook, B.W.; Manish, K.; Pandit, M.K. Climate-induced elevational range shifts and increase in plant species richness in a Himalayan biodiversity epicentre. PLoS ONE 2013, 8, e57103. [Google Scholar] [CrossRef] [PubMed]
  22. Shrestha, U.B.; Gautam, S.; Bawa, K.S. Widespread climate change in the Himalayas and associated changes in local ecosystems. PLoS ONE 2012, 7, e36741. [Google Scholar] [CrossRef] [PubMed] [Green Version]
  23. Scheffers, B.R.; De Meester, L.; Bridge, T.C.L.; Hoffmann, A.A.; Pandolfi, J.M.; Corlett, R.T.; Butchart, S.H.M.; Pearce-Kelly, P.; Kovacs, K.M.; Dudgeon, D. The broad footprint of climate change from genes to biomes to people. Science 2016, 354, aaf7671. [Google Scholar] [CrossRef] [PubMed]
  24. Jankowski, J.E.; Robinson, S.K.; Levey, D.J. Squeezed at the top: Interspecific aggression may constrain elevational ranges in tropical birds. Ecology 2010, 91, 1877–1884. [Google Scholar] [CrossRef] [PubMed] [Green Version]
  25. Jankowski, J.E.; Londoño, G.A.; Robinson, S.K.; Chappell, M.A. Exploring the role of physiology and biotic interactions in determining elevational ranges of tropical animals. Ecography 2013, 36, 1–12. [Google Scholar] [CrossRef]
  26. Salick, J.; Ghimire, S.K.; Fang, Z.; Dema, S.; Konchar, K.M. Himalayan alpine vegetation, climate change and mitigation. J. Ethnobiol. 2014, 34, 276–293. [Google Scholar] [CrossRef]
  27. Guisan, A.; Thuiller, W. Predicting Species Distribution: Offering More than Simple Habitat Models. Ecol. Lett. 2005, 8, 993–1009. [Google Scholar] [CrossRef]
  28. Raven, P.H. Predicting Species Occurrences: Issues of Accuracy and Scale; Scott, J.M., Heglund, P.J., Morrison, M.L., Haufler, J.B., Raphael, M.G., Wall, W.A., Samson, F., Eds.; Island Press: Washington, DC, USA, 2002; ISBN 1-55963-787-0. [Google Scholar]
  29. Fleishman, E.; Nally, R.M.; Fay, J.P.; Murphy, D.D. Modeling and predicting species occurrence using broad-scale environmental variables: An example with butterflies of the Great Basin. Conserv. Biol. 2001, 15, 1674–1685. [Google Scholar] [CrossRef]
  30. Nakazato, T.; Warren, D.L.; Moyle, L.C. Ecological and geographic modes of species divergence in wild tomatoes. Am. J. Bot. 2010, 97, 680–693. [Google Scholar] [CrossRef] [PubMed] [Green Version]
  31. Peterson, A.T. Predicting SPECIES’Geographic Distributions Based on Ecological Niche Modeling. Condor 2001, 103, 599–605. [Google Scholar] [CrossRef]
  32. Wintle, B.A.; Bardos, D.C. Modeling species–habitat relationships with spatially autocorrelated observation data. Ecol. Appl. 2006, 16, 1945–1958. [Google Scholar] [CrossRef]
  33. Burgman, M.A.; Lindenmayer, D.B.; Elith, J. Managing Landscapes for Conservation under Uncertainty. Ecology 2005, 86, 2007–2017. [Google Scholar] [CrossRef]
  34. Guisan, A.; Zimmermann, N.E. Predictive habitat distribution models in ecology. Ecol. Modell. 2000, 135, 147–186. [Google Scholar] [CrossRef]
  35. Kadmon, R.; Farber, O.; Danin, A. Effect of roadside bias on the accuracy of predictive maps produced by bioclimatic models. Ecol. Appl. 2004, 14, 401–413. [Google Scholar] [CrossRef]
  36. Phillips, S.J.; Anderson, R.P.; Schapire, R.E. Maximum entropy modeling of species geographic distributions. Ecol. Modell. 2006, 190, 231–259. [Google Scholar] [CrossRef]
  37. Kumar, S.; Stohlgren, T.J.; Chong, G.W. Spatial heterogeneity influences native and nonnative plant species richness. Ecology 2006, 87, 3186–3199. [Google Scholar] [CrossRef]
  38. Chitale, V.S.; Behera, M.D. Can the distribution of sal (Shorea robusta Gaertn. f.) shift in the northeastern direction in India due to changing climate? Curr. Sci. 2012, 102, 1126–1135. [Google Scholar]
  39. Gopalakrishnan, R.; Jayaraman, M.; Swarnim, S.; Chaturvedi, R.K.; Bala, G.; Ravindranath, N.H. Impact of climate change at species level: A case study of teak in India. Mitig. Adapt. Strateg. Glob. Chang. 2011, 16, 199–209. [Google Scholar] [CrossRef]
  40. Littell, J.S.; Peterson, D.L. A method for estimating vulnerability of Douglas-fir growth to climate change in the northwestern US. For. Chron. 2005, 81, 369–374. [Google Scholar] [CrossRef]
  41. McNulty, S.G.; Vose, J.M.; Swank, W.T. Potential climate change effects on loblolly pine forest productivity and drainage across the southern United States. In Ambio; Springer: Berlin, Germany, 1996; Volume 25, pp. 449–453. [Google Scholar]
  42. Gautam, A.P.; Thapa, B.R.; Pandit, B.H.; Dhungana, B.M.; Tiwari, K.R.; Neupane, M.P.; Balla, M.K.; Joshi, M.R.; Sharma, U.R. Chitwan-Annapurna Landscape: A Rapid Assessment; WWF Nepal: Kathmandu, Nepal, 2013. [Google Scholar]
  43. Silwal, R.; Maharjan, S.; Shrestha, B.; Chitale, V.; Murthy, M. An Innovative Approach for Understanding the Patterns in Distribution and Extraction of Non-Timber Forest Products in Chitwan Annapurna Landscape, Nepal. Indian For. 2018, 144, 243–251. [Google Scholar]
  44. Pearson, R.G. Species’ distribution modeling for conservation educators and practitioners. Synth. Am. Museum Nat. Hist. 2007, 50, 56–89. [Google Scholar]
  45. Parry, M.; Parry, M.L.; Canziani, O.; Palutikof, J.; Van der Linden, P.; Hanson, C. Climate Change 2007-Impacts, Adaptation and Vulnerability: Working Group II Contribution to the Fourth Assessment Report of the IPCC; Cambridge University Press: Cambridge, UK, 2007; Volume 4, ISBN 0521880106. [Google Scholar]
  46. Hijmans, R.J.; Cameron, S.E.; Parra, J.L.; Jones, P.G.; Jarvis, A. Very high resolution interpolated climate surfaces for global land areas. Int. J. Climatol. 2005, 25, 1965–1978. [Google Scholar] [CrossRef] [Green Version]
  47. Oreskes, N.; Shrader-Frechette, K.; Belitz, K. Verification, validation, and confirmation of numerical models in the earth sciences. Science 1994, 263, 641–646. [Google Scholar] [CrossRef] [PubMed]
  48. Rasul, G.; Karki, M.; Sah, R.P. The role of non-timber forest products in poverty reduction in India: Prospects and problems. Dev. Pract. 2008, 18, 779–788. [Google Scholar] [CrossRef]
  49. Schaafsma, M.; Morse-Jones, S.; Posen, P.; Swetnam, R.D.; Balmford, A.; Bateman, I.J.; Burgess, N.D.; Chamshama, S.A.O.; Fisher, B.; Green, R.E.; et al. Towards transferable functions for extraction of Non-timber Forest Products: A case study on charcoal production in Tanzania. Ecol. Econ. 2012, 80, 48–62. [Google Scholar] [CrossRef]
  50. Arico, S.; Bridgewater, P.; El-beltagy, A.; Harms, E.; Program, S.; Hepworth, R.; Leitner, K.; Oteng-yeboah, A.; Ramos, M.A.; Watson, R.T. Millennium Ecosystem Assessment, Ecosystems and Human Well-Being: Synthesis; World Resources Institute: Washington, DC, USA, 2005. [Google Scholar]
  51. Shackleton, C.; Sheona, S. The importance of non-timber forest products in rural livelihood security and as safety nets: A review of evidence from South Africa. S. Afr. J. Sci. 2004, 100, 658–664. [Google Scholar]
  52. Vedeld, P.; Angelsen, A.; Bojö, J.; Sjaastad, E.; Kobugabe Berg, G. Forest environmental incomes and the rural poor. For. Policy Econ. 2007, 9, 869–879. [Google Scholar] [CrossRef]
  53. Sudhakar Reddy, C.; Vazeed Pasha, S.; Satish, K.V.; Saranya, K.R.L.; Jha, C.S.; Krishna Murthy, Y.V.N. Quantifying nationwide land cover and historical changes in forests of Nepal (1930–2014): Implications on forest fragmentation. Biodivers. Conserv. 2018, 27, 91–107. [Google Scholar] [CrossRef]
  54. REDD-Forestry and Climate Change Cell. Role of Forest on Climate Change Adaptation; REDD-Forestry and Climate Change Cell, Ministry of Forests and Soil Conservation, Government of Nepal: Kathmandu, Nepal, 2011; 49p.
  55. Sharma, E.; Chettri, N.; Tse-Ring, K.; Shrestha, A.B.; Jing, F.; Mool, P.; Eriksson, M. Climate Change Impacts and Vulnerability in the Eastern Himalayas; International Centre for Integrated Mountain Development: Kathmandu, Nepal, 2009. [Google Scholar]
Figure 1. Map of the study site.
Resources 07 00066 g001
Figure 2. Distribution map of a. Diploknema butyracea, b. Rhododendron arboretum, c. Myrica esculenta, d. Castanopsis tribuloides, e. Persea odoratissima, f. Taxus wallichiana, g. Pinus patula, h. Pinus roxburghii, i. Shorea robusta, j. Alnus nepalensis.
Resources 07 00066 g002
Table 1. Characteristic details of studied NTFPs & number of field sample points used for modelling.
Sl. No.Name of the SpeciesNepali NameBroad Vegetation ClassAltitudinal Range (m)UsagePlant Part UsedSample Points
1Alnus nepalensis D. Don UtisSubtropical broadleaved forest900 to 2000Fuelwood, mulching, fodderStem, leaves55
2Castanopsis tribuloides (Sm.) A. DCKatusSubtropical broadleaved forest650 to 2100 Timber, FuelwoodStem, fruits45
3Diploknema butyracea (Roxb.) H.J. LamChiuriSubtropical broadleaved forest400 to 1800 Medicine, FoodLeaves, fruits, bark47
4Myrica esculenta Buch.-Ham. Ex D. DonKaphalTemperate broadleaved forests1200 to 2100 MedicineFruit39
5Persea odoratissima Ness.KaulaSub-tropical to Temperate forests500 to 2200 FodderLeaves, fruits42
6Pinus patula Schiede & DeppePatte SallaSubtropical coniferous forests1650 to 3000 Timber, FuelwoodStem, branches124
7Pinus roxburghii Sarg.Khote SallaSubtropical coniferous forests900 to 2200 Timber, FuelwoodStem, branches65
8Rhododendron arboreum Sm.LaliguransMontane broadleaved forests2500 to 3300 Fuelwood, MedicineStem, flowers45
9Shorea robusta Gaertn. f.SalSubtropical broadleaved forest500 to 1000 Timber, FuelwoodStem, bark102
10Taxus wallichiana Zucc.Loth SallaTemperate & subalpine forest2800 to 3600 MedicineBark89
Table 2. The prediction accuracy of training and test datasets and most significant climate variable influencing the present and future distribution of the NTFPs.
Sl. No.Scientific NamePresent Time PeriodFuture Time Period (RCP 4.5, 2050)
Most Significant Climate Variable TrainingTestMost Significant Climate VariableTrainingTest
1Alnus nepalensis D. DonMean Temperature of Driest Quarter0.9010.788Temperature Seasonality (standard deviation *100)0.8970.789
2Castanopsis tribuloides (Sm.) A. DCMax Temperature of Warmest Month0.8290.795Max Temperature of Warmest Month0.8280.797
3Diploknema butvracea RoxbMean Diurnal Range (Mean of monthly (max temp − min temp))0.8620.677Precipitation of Warmest Quarter, Annual Precipitation0.8820.663
4Myrica esculenta Buch.-Ham. Ex D. DonMean Diurnal Range (Mean of monthly (max temp − min temp))0.8620.677Precipitation of Warmest Quarter, Annual Precipitation0.8820.663
5Persea odoratissima (Nees) KostermTemperature Seasonality (standard deviation *100), Temperature Annual Range (BIO5-BIO6)0.8150.930Temperature Seasonality (standard deviation *100) 0.8380.988
6Pinus patula Schiede & DeppePrecipitation of Driest Quarter, Precipitation of Coldest Quarter0.9100.633Precipitation of Driest Quarter0.8310.536
7Pinus roxburghii Sarg.Mean Temperature of Driest Quarter, Min Temperature of Coldest Month0.8450.724Mean Temperature of Driest Quarter0.8380.763
8Rhododendron arboretum Sm.Max Temperature of Warmest Month0.8720.787Mean Temperature of Coldest Quarter, Min Temperature of Coldest Month0.8920.807
9Shorea robusta Gaertn f.Mean Temperature of Driest Quarter, Min Temperature of Coldest Month0.8600.745Annual Mean Temperature0.8370.849
10Taxus wallichiana (Zucc.) PilgerTemperature Seasonality (standard deviation *100), Temperature Annual Range (BIO5-BIO6)0.8900.632Temperature Annual Range (BIO5-BIO6)0.8950.613

