Article

Ecological Footprint Accounting for Countries: Updates and Results of the National Footprint Accounts, 2012–2018

1
Global Footprint Network, 426 17th Street, Suite 700, Oakland, CA 94612, USA
2
Global Footprint Network, 18 Avenue Louis-Casai, 1219 Geneva, Switzerland
3
UC Davis Center for Water-Energy Efficiency, University of California, Davis, 215 Sage St., Suite #200, Davis, CA 95616, USA
4
Institut National des Sciences Appliquées de Rouen, 685 Avenue de l’Université, 76800 Saint-Étienne-du-Rouvray, France
5
School of International and Public Affairs, Columbia University, 420 West 118th Street, New York, NY 10027, USA
*
Author to whom correspondence should be addressed.
Resources 2018, 7(3), 58; https://doi.org/10.3390/resources7030058
Submission received: 18 July 2018 / Revised: 9 September 2018 / Accepted: 12 September 2018 / Published: 17 September 2018
(This article belongs to the Special Issue Ecological Footprint Assessment for Resources Management)

Abstract

:
Ecological Footprint accounting quantifies the supply and demand of Earth’s biocapacity. The National Footprint Accounts (NFA) are the most widely used Ecological Footprint (EF) dataset, and provide results for most countries and the world from 1961 to 2014, based primarily on publicly available UN datasets. Here, we review the evolution of the NFA, describe and quantify the effects of improvements that have been implemented into the accounts since the 2012 edition, and review the latest global trends. Comparing results over six editions of NFAs, we find that time-series trends in world results remain stable, and that the world Ecological Footprint for the latest common year (2008) has increased six percent after four major accounting improvements and more than thirty minor improvements. The latest results from the NFA 2018 Edition for the year 2014 indicate that humanity’s Ecological Footprint is 1.7 Earths, and that global ecological overshoot continues to grow. While improved management practices and increased agricultural yields have assisted in a steady increase of Earth’s biocapacity since 1961, humanity’s Ecological Footprint continues to increase at a faster pace than global biocapacity, particularly in Asia, where the total and per capita Ecological Footprint are increasing faster than all other regions.

1. Introduction

In the past 30 years, the science of sustainability has emerged as a prominent field to address the challenges that arise from human–nature interactions [1,2,3,4,5]. At its core, the science of sustainability is a “solution-oriented discipline that studies the complex relationship between nature and humankind”, which implies a “holistic approach, able to capitalize and integrate sectoral knowledge as well as a variety of epistemic and normative stances and methodologies towards the definition of solutions” [2].
Agenda 21 (Chapter 40) of the 1992 United Nations Conference on Environment and Development in Rio [6] called for improved quality and availability of sustainability data for decision making. The need for relevant and reliable data to measure sustainability launched the development of hundreds of indicators with the intent of driving policy and assessing progress toward sustainability [4].
The Ecological Footprint is an account-based system of indicators whose underlying context is the recognition that Earth has a finite amount of biological production that supports all life on it [7,8]. A widely recognized measure of sustainability, the Ecological Footprint provides an integrated, multiscale approach to tracking the use and overuse of natural resources, and the consequent impacts on ecosystems [9] and biodiversity [10].
Ultimately an accounting methodology, the Ecological Footprint sums all human activities that require a bioproductive area, and therefore does not “dictate how societies should develop” [11]. Framing the Ecological Footprint as an accounting system rather than a normative indicator of progress allows the metric to be applied across broad contexts, which is a key element of sustainability-assessment frameworks [12]. This makes the Ecological Footprint relevant across a wide range of sectors and sociopolitical entities, each with their own unique cultures, natural systems, and methodological approaches to sustainability solutions.
The most widely used application of Ecological Footprint accounting is the National Footprint Accounts (NFA), initiated by Wackernagel et al. [13]. NFAs provide annual accounts of biocapacity and the Ecological Footprint for the world and all countries. Since 2003, Global Footprint Network has served as the steward of the NFA and the underlying calculation methodology for the Ecological Footprint of countries [14,15], and has continuously implemented advances in science and accounting methodology into each iteration or “edition” of the NFA [16,17]. To ensure consistent results, each edition provides updated results for the entire available timeline from 1961 to the current NFA data year.
Here, we describe major methodological and data improvements to the National Footprint Accounts since the last published update [16], and quantify the effect of these improvements on the resulting Ecological Footprint and biocapacity of all countries and the world as a whole. We also present the most recent national and global Ecological Footprint results, generated by the 2018 edition of the National Footprint Accounts [18].

2. Materials and Methods

2.1. Accounting Framework

Ecological Footprint accounting is driven by a simple, measurable question: How much of the biosphere’s (or any region’s) regenerative capacity does human activity (“activities” can refer to the entire consumption metabolism of humanity, the consumption of a given population (such as a city), a production process, or something as small and discreet as producing 1 kilogram of durum wheat spaghetti) demand [15,19]? Or more specifically: How much of the planet’s (or a region’s) regenerative capacity does a defined activity require from nature? To answer these questions, the Ecological Footprint integrates core principles of sustainability and accounting and applies them to the context of human activity on Earth. The sustainability principles, taken from Daly [20], are: (1) renewable resources must not be consumed faster than they are regenerated; and (2) waste must not be created faster than it is assimilated by natural systems. The accounting principles of additivity and equivalence are used to measure and map human dependence on biocapacity.
Additivity: Given that human life competes for biologically productive surfaces, these surface areas can be summed. The Ecological Footprint adds up all human demands on nature that compete for biologically productive space [21], such as providing natural resources, accommodating urban infrastructure, or absorbing excess carbon from burning fossil fuels. The Ecological Footprint then becomes comparable to the available biologically productive space, or biocapacity.
Equivalence: Biologically productive areas vary in their ability to produce biological flows (i.e., biological resources and services used by people). Therefore, areas are scaled proportionally to their biological productivity. As such, the unit of measurement for Ecological Footprint accounting, the global hectare (gha), represents a rate of biological regeneration equal to that of a world-average biologically productive hectare [16,21]. This regenerative productivity can be used for resource production, waste sequestration, or physical occupation, which are mutually exclusive (e.g., urban infrastructure can occupy productive areas).
Using these principles, Ecological Footprint accounting tracks the supply (biocapacity) and demand (Ecological Footprint) of renewable resources and ecosystem services. The expression of biological flows as global hectares allows for direct comparisons between them, making it possible to quantify human demand on the biosphere. Furthermore, the relationship between the Ecological Footprint and biocapacity of a given geographic area can be used as a reference point to determine if the minimum conditions for sustainability, that is, Daly’s core principles [20], are met within the associated socioeconomic system. The Ecological Footprint approach and its evolution can be traced in a number of publications [15,16,19,22,23,24,25,26,27,28,29].

2.2. Basic Equations

The underlying calculations of the Ecological Footprint (EF) apply the core principles described earlier to derive the amount of mutually exclusive bioproductive area on the planet appropriated by human activities. Human-harvest or waste-production flow is quantified in mass per time and translated into global hectares through the following equation:
E F p r o d u c t i o n = P Y w EQF
where:
-
P is the production (or harvest) in tons per year,
-
Yw is the world average yield in tons per hectare, per year, and
-
EQF is the equivalence factor.
For each land-use type, the EQF is the ratio of a given land type’s average global productivity divided by the average global productivity of the entire planet’s productive surfaces. EQF makes it possible to compare the land used for a given product category with the average global bioproductive surface area, which may be of higher or lower average productivity [29].
For each country, the Ecological Footprint of production (EFp) of a single footprint category is calculated by summing all products of that footprint category (such as rice, wheat, corn for cropland). The total EFp of a country is the sum of the Ecological Footprint of all product categories combined.
The Ecological Footprint of consumption for a country is estimated by calculating the Ecological Footprint of all that is produced within a country, then adding the Ecological Footprint embodied in imports and subtracting the Ecological Footprint embodied in exports:
E F c o n s u m p t i o n   =   E F P + E F I E F E
where:
-
EFP is the is the Ecological Footprint of production,
-
EFI is the Ecological Footprint of imports, and
-
EFE is the Ecological Footprint of exports.
Similarly, biocapacity can be measured in global hectares at any scale, from a single farm to the entire planet. The following formula details how biocapacity is calculated at the national level for each biocapacity land-use category:
b i o c a p a c i t y =   A n Y n Y w E Q F
where:
-
An is the area in country “n” for this land-use category in hectares, and
-
Yn is the national average yield for this land-use category in tons per hectare and year.
Detailed equations and their application for each of the six Ecological Footprint subcomponents (cropland, grazing land, fishing grounds, forest for forest products, built-up land, and carbon footprint) and five biocapacity components (cropland, grazing land, fishing grounds, forests, and built-up land) are described in detail in earlier publications [9,10,14,16,18,30,31,32,33,34,35].

2.3. Review of NFA Production and Updates

2.3.1. NFA Production Process

NFAs calculate the Ecological Footprint and biocapacity of all countries and the world from 1961 to the latest data year, generally 4 years before the publication year based on the availability of input data from the UN Food and Agriculture Organization (FAO) and other key sources. Global Footprint Network has published 13 NFA editions since the first one in 2004. Each edition recalculates the Ecological Footprint and biocapacity values over the entire timeline to ensure incorporation of the latest input data and to apply methodological updates consistently to the entire dataset.
Each country-year result is calculated using up to 15,000 data points from multiple datasets, so a rigorous quality-assurance (QA) process is followed to validate the calculations. During NFA production, there are multiple QA stages following the download and upload of datasets, testing and integration of improvements, and assignment of quality scores. Each input dataset is downloaded and uploaded annually to ensure incorporation of the most current information, then reviewed extensively to detect any changes to raw data or data structure. At each stage, calculated results that incorporate new data are compared to a control or baseline dataset to ensure changes have been implemented without error. Similarly, accounting-methodology improvements are incorporated one by one, and new results are compared to ensure all changes have been completed as intended.
After all new data and accounting updates have been implemented and rigorously checked, the finalized National Footprint Accounts are reviewed by researchers at Global Footprint Network country by country as a final QA step, but also to assign quality scores based on the reliability of the results (www.footprintnetwork.org/data-quality-scores). Over time, a given country’s quality score can improve if, for instance, data improvements within the UN statistical system are applied to historical datasets. The final results and quality scores are made available online in an Excel-based public data package and on an open-data website (data.footprintnetwork.org).

2.3.2. Previous NFA Updates

In 2005, Global Footprint Network established the National Accounts Committee (www.footprintnetwork.org/resources/reviews) to oversee major improvements to the National Footprint Accounts. The National Accounts Committee (NAC) is comprised of experts across various disciplines and includes ten members, one of whom is a researcher with the Global Footprint Network. The approval process begins with a review of each suggested methodological improvement. After clarification and discussion, proposed changes to the NFAs that are agreed upon unanimously by the committee are implemented in subsequent editions of the accounts.
The NAC and affiliates have also collaborated in developing a more systematic research agenda for the accounts. This process led to a publication in 2009 by Kitzes et al. [24]. Suggestions from this effort have largely guided the conceptual direction of the National Footprint Accounts, various of which have been documented and peer-reviewed [16,36,37,38,39,40,41]. Major methodological improvements between the 2010 and 2011 NFA editions were implemented based on these suggestions, including: (1) introducing the ‘constant global hectares’ metric to account for changing values of a global hectare over time; (2) updating ocean CO2 uptake values to account for changes in the amount of carbon dioxide in the atmosphere over time; and (3) a new data-cleaning algorithm to reduce inconsistencies in the source data of commodity trade [16].
Since the 2012 edition of the National Footprint Accounts, we have improved the accuracy of key constants (research agenda item 2.3 in Kitzes et al. [24]), equivalence factors (research agenda item 2.11), and carbon-footprint calculation (research agenda item 2.13). Previous NFA improvements also addressed several of these research priorities [16]. Lastly, we are continually working on strengthening and detailing the documentation of the accounting methodology to explain the rationale and methods that underpin major changes and improvements (research agenda item 2.5) [24].
The research-guidelines paper of Kitzes et al. [24] also described an input–output based framework for the NFA. Although the NFA framework is still an accounting system directly tracking material flows, the idea gave rise to the current application of an environmentally extended multiregional input–output (EE-MRIO) model, which complements the NFA by breaking down each country’s Ecological Footprint results by economic sectors and final-demand categories [27,37,38,42,43].

2.4. Updates and Improvements to the NFA, 2012–2018

For ease of reference, we have grouped changes to the National Footprint Accounts into the following categories: accounting updates, factor recalculations, and input data changes.
Accounting updates involve revisions to underlying calculations, and may represent, for example, those activities or land uses that are or are not accounted for within the NFA, or how specific Footprint categories are allocated. Because accounting changes could (potentially) have relatively greater scientific significance than other improvements, major changes must be approved by the National Accounts Committee. No major accounting change has been made in the last two NFA editions (2017, 2018). In total, eleven minor accounting changes have been made since the 2012 NFA edition. These had minor effects on Ecological Footprint and/or biocapacity results, and therefore are not described here.
Factor recalculations are a specific kind of accounting-methodology change that involves updates to the constants employed by key Ecological Footprint accounting formulae. They include, for instance, the recalculation of factors such as EQF, average forest-carbon sequestration [39], and marginal crop yield. These factors are recalculated to incorporate improvements in data and to maintain consistency with any changes to Ecological Footprint accounting. In total, four factor recalculations have been made since the 2012 NFA edition.
Changes to input data occur annually because of changes within data sources (See Borucke et al. [16] for a detailed overview of the different data sources used in National Footprint Accounts.) themselves, which are updated with each edition. For example, a single-crop product, such as “pumpkins for fodder”, may change in name (e.g., to “mixed grasses and legumes”) or in production weight for the entire 1961–2014 timeline for a country. This type of data change is not uncommon as reporting guidelines for national statistics offices to provide data to the FAO may change over time. In other cases, data recategorization may cause the methodology to change. For example, the International Energy Agency (IEA) updated “CO2 emissions from fuel combustion” to adhere to the Intergovernmental Panel on Climate Change (IPCC) 2006 carbon-inventory guidelines, where it previously followed 1996 IPCC guidelines [44]. This impacted carbon-footprint calculations for most countries. In total, six raw data updates have been made since the 2012 edition of the National Footprint Accounts. In some cases, we incorporated input datasets with improved data resolutions. The 2015 edition, for instance, applied regional (as an improvement from world average) Footprint intensity of electricity to calculate the Footprint of traded electricity. In total, five data-refinement improvements have been made since the 2012 edition of the NFA.
The following sections describe the major improvements implemented since 2012.

2.4.1. Average Forest-Carbon Sequestration

In the 2016 NFA edition, we improved the accuracy of carbon Footprint calculation by incorporating an updated Average Forest-Carbon Sequestration (AFCS) value, which measures the “net carbon-sequestration capacity of forest ecosystems” [39]. The carbon Footprint component is based on the capacity of forests to absorb anthropogenic carbon dioxide emissions that are not sequestered by oceans. Mancini et al. [39] updated the AFCS value, a key parameter in the calculation of the carbon Footprint. The AFCS value now distinguishes the carbon-sequestration rates of three different forest types (primary, secondary, and plantations), and includes carbon emissions due to forest fires, soils, and harvested wood products [39]. Overall, this study calculated an AFCS value range of 0.73 ± 0.37 t C ha−1 year−1 for world average forests. This updated value is now used to calculate carbon Footprint and Ecological Footprint values.

2.4.2. Allocation of “Other CO2” Emissions to Countries

In the 2015 NFA edition, we improved carbon Footprint calculations of countries by allocating “Other CO2” emissions to all countries. These emissions are quantified on a production basis by the International Energy Agency and thus were only assigned to “World” Ecological Footprint calculations in previous NFA editions. These “other” CO2 emissions included fugitive emissions (IEA category “CO2FUG”), and emissions from industrial processes (IEA category “CO2IND”). The “other” CO2 emissions were allocated to the Ecological Footprints of consumption (EFC) of each country based on their carbon EFC as a share of global carbon EFC.

2.4.3. Marginal Crop-Yield Factors

In the 2015 edition of the National Footprint Accounts, we introduced a change to correct yield factors for spatially underrepresented crops. Yield factors normalize the productivity of a single land type to average global productivity [29]. For cropland, this is calculated by dividing the national average yield of all crop products (weighted by area) by the average global yield of all crop products (for the same crop and area). Yield factors account for the different growing conditions of widely grown crops [33]. However, some crops (such as millet, sorghum, and fonio), are globally under-represented, and are generally grown in areas with challenging agricultural conditions, that is, arid regions with poor soils. For these types of crops, average global yield values did not represent the range of cropland productivity found globally, but rather areas with poor growing conditions. This led to yield factor values that overestimated the Ecological Footprint of these crops and the biocapacity of cropland where these marginal crops are grown.
The improved yield calculation applied a nutrition-based weighting to adjust the production of each cereal crop prior to the calculation of yield factors. The resulting calculation for all cereal crops (including barley, fonio, millet, oats, rye, sorghum, triticale, and wheat) then compared each nutrition-adjusted crop to the average global yield of all cereals. This aggregation allowed for a more meaningful comparison of “marginal crops” to the world yield of all cereals, as it reduced the bias towards overestimation of the Ecological Footprint and biocapacity associated with these crops.

2.4.4. Footprint of Fishing Grounds

In the 2015 NFA edition, the fishing grounds Footprint calculation was modified to reduce the calculation’s reliance on the assigned trophic level of traded fish commodities, which was leading to extreme Footprint values for fish commodities in some countries. Previously, the embodied Footprint of unspecified or aggregated fish commodities (for example, “traded fish fillet” is fish, but the species is unknown and thus we cannot assign it a trophic level) was estimated based on assumptions about the type of fish species it contained. The updated methodology assumes that exported fish products have the same Footprint intensity as the total basket of fish harvested in and imported to that country; in other words, we assume that each country exports fish species in the same proportion as they are harvested and imported by that country. Imports of fish are similarly assumed to have the same Footprint intensity as average global harvest; in other words, a country imports fish species in the same proportion as they are harvested in the world.

2.4.5. Other Updates

Several additional minor methodology improvements were implemented in recent NFA editions, primarily in response to the availability of new data sources and error fixes. For example, the data source for feed commodities was updated in the NFA 2015 edition. In addition, the fish species list was updated in the NFA 2015 edition to fix errors around the double counting of several fish species. The EQF calculation was updated in the 2016 edition to maintain consistency with NFA accounting of new countries and country border changes, inland water areas, and hydroelectric dam areas. Details about these methodology improvements and other minor changes can be found in our guidebook [31].

3. Results

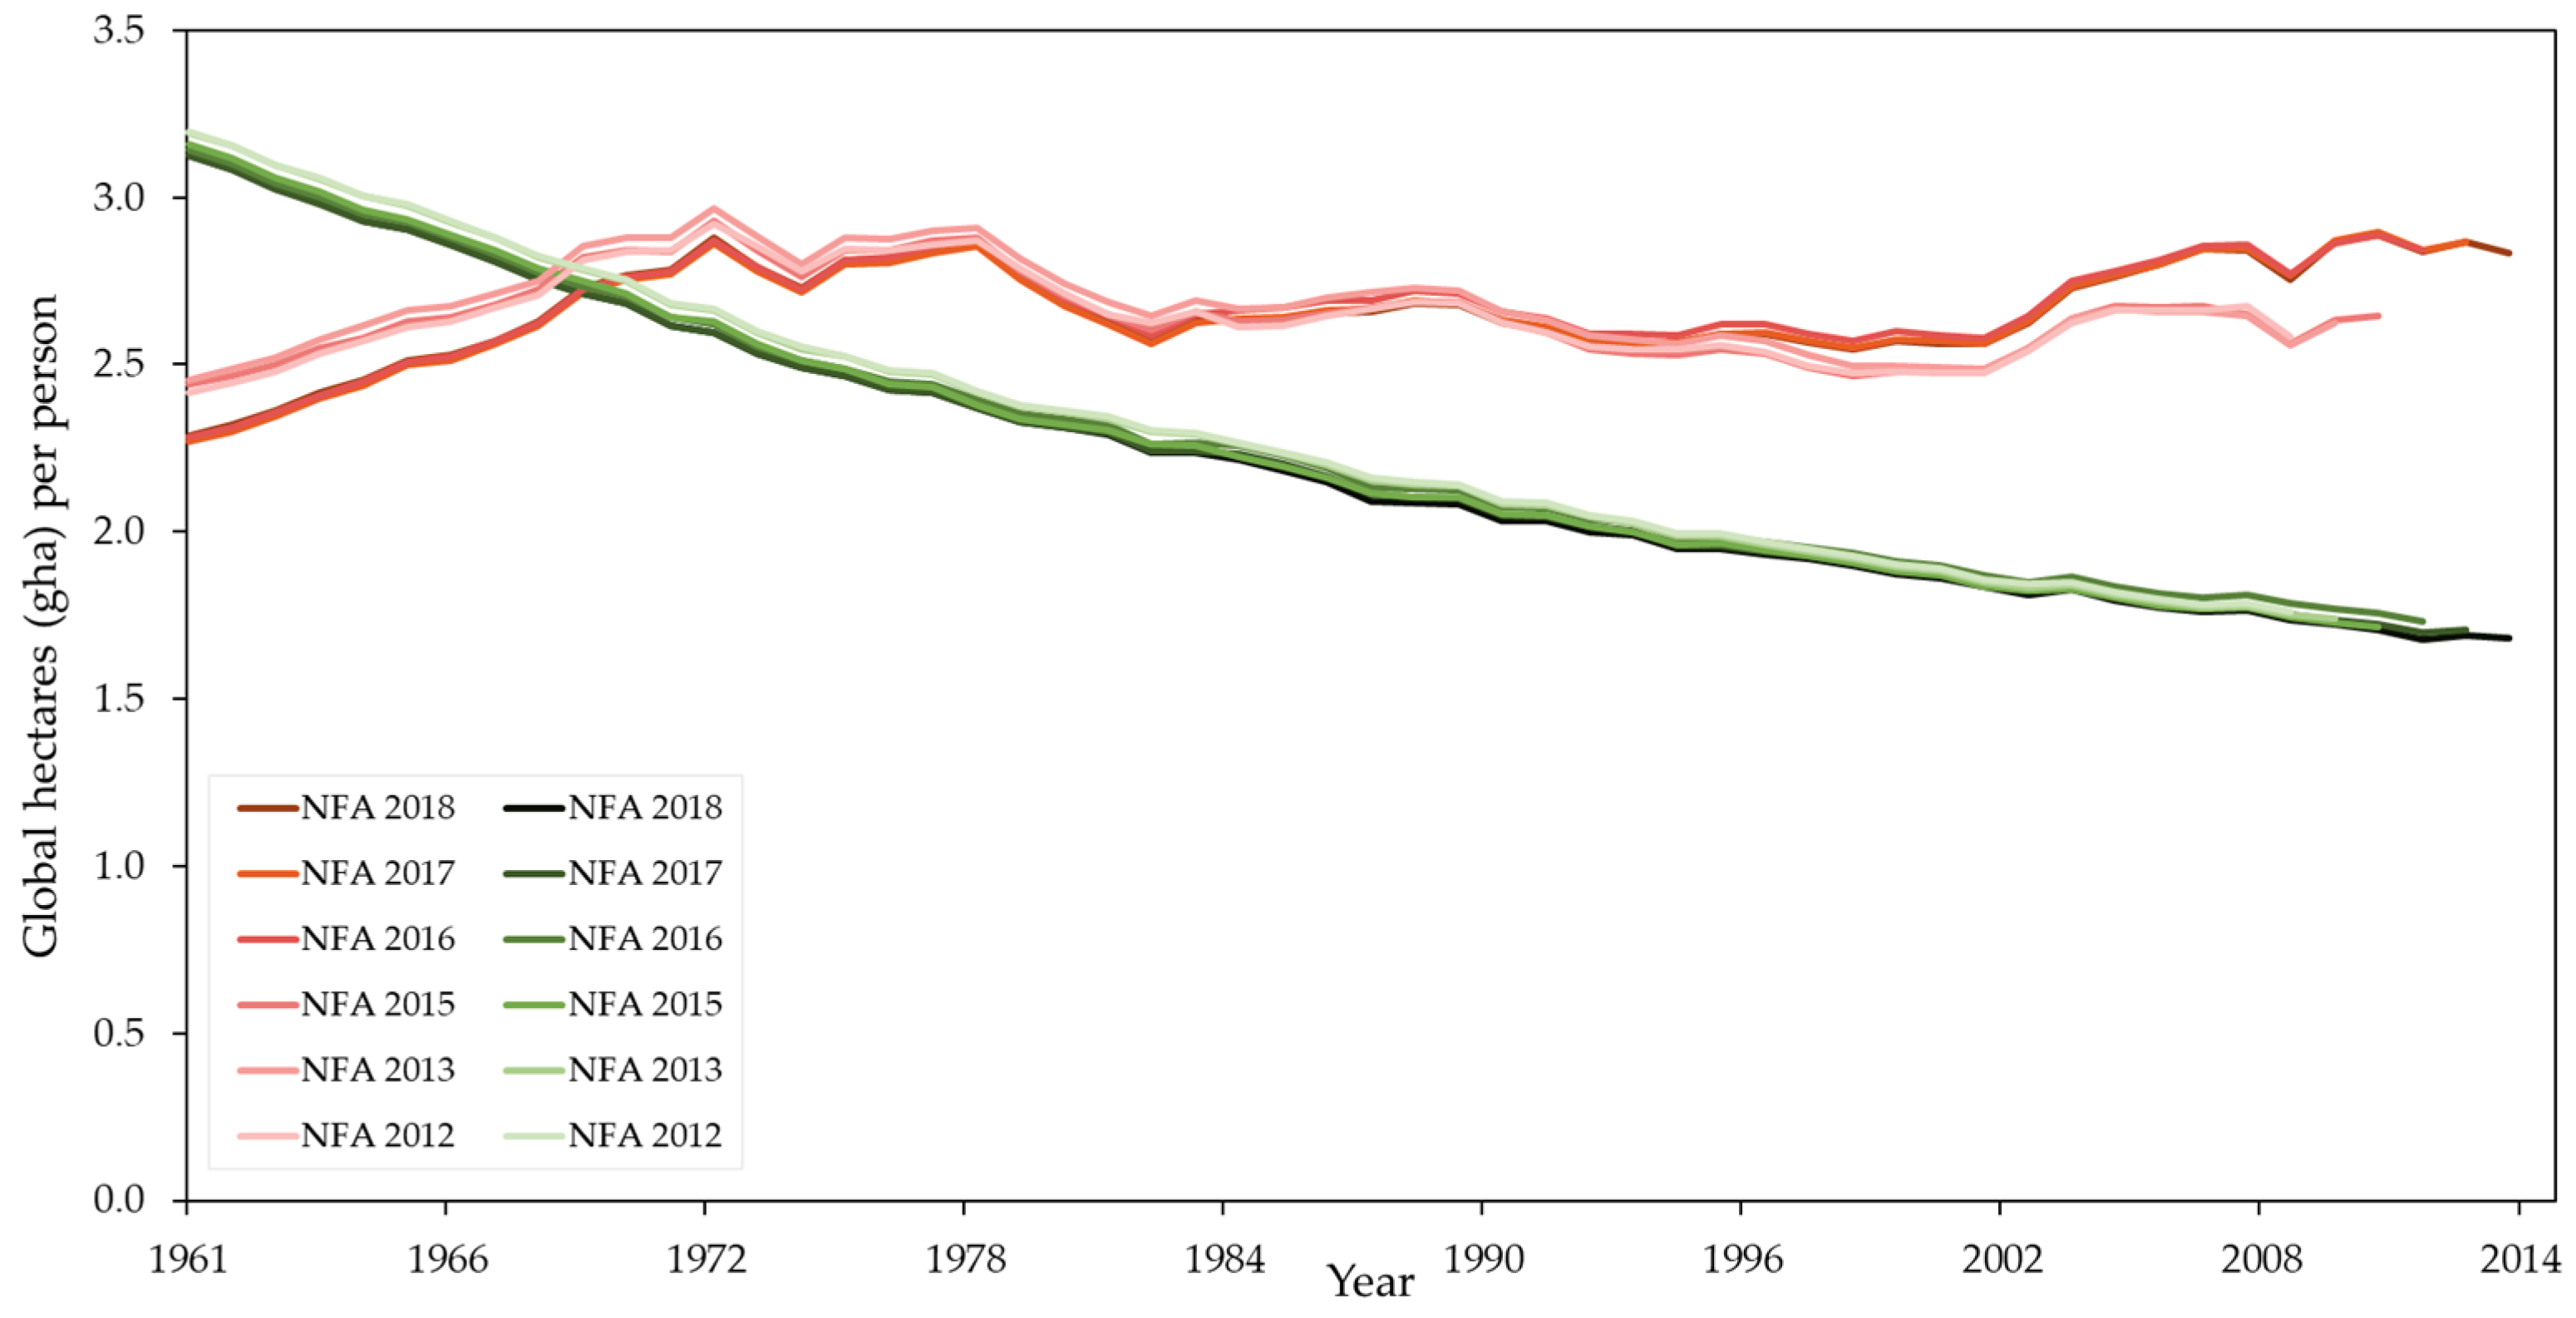
3.1. Accounting Improvements, NFA Editions 2012–2018

National and global Ecological Footprint accounting methodology used in the National Footprint Accounts has undergone four major updates in the past six editions, and over thirty minor changes. The incorporation of both major and minor improvements into the National Footprint Accounts between the 2012 and 2018 editions has resulted in relatively small changes to global results. As expected, advancements in the quality of source data and refinements to calculation methodology have resulted in differing values for Ecological Footprint and biocapacity from one edition to the next. However, a comparison of world calculations of biocapacity and Ecological Footprint in global hectares per person for each of the six editions published between 2012 and 2018 reveals relatively consistent timeline results (Figure 1).
We can additionally compare changes to the world Ecological Footprint per person in more detail by examining total and individual component results across editions for a single year (Table 1). Upon examining results from the latest shared data year across all six editions (2008), we see that the world Ecological Footprint has increased by 6 percent in the past six editions. Again, using data year 2008 as a reference, the total Ecological Footprint increased by 0.17 gha per person between the 2012 and 2018 editions. On average, this represents a 1.8 percent change per edition, with the largest increase occurring between 2015 and 2016. Overwhelmingly, this 2015–2016 increase can be attributed to the corresponding increase in the carbon component of the Ecological Footprint in the 2016 edition, the result of improved carbon accounting (see description of Average Forest-Carbon Sequestration above).
A similar comparison across editions of the world’s biocapacity per person indicates even greater stability in year-to-year results. Looking again at the data year 2008, total biocapacity decreased by 0.02 gha per person between the 2012 and 2018 NFA editions, representing an average absolute change of slightly more than 1 percent over the six editions. At the Footprint-component level, we see the largest changes occurring in cropland and forests with a 0.03 gha decrease and 0.02 gha increase per person, respectively.
To better understand these differences, it is helpful to quantify the impact of the major improvements discussed in the previous section. The impact of the accounting improvements range from a 2.9 percent decrease in the world’s Ecological Footprint due to updates to the fish-species list, to a 13 percent global increase in Ecological Footprint due to the implementation of new carbon calculations (Table 2). Improvements to marginal crop-yield factors, EQF calculations, “Other CO2” allocation, and feed commodities all resulted in less significant increases to the world Ecological Footprint (0.4%, 1.0%, 2.0%, and 2.0%, respectively).
To further investigate the effects of various accounting improvements on NFA results, we can look at the timeline of a single country to compare changes across NFA editions. As an example, we chose to look at the Ecological Footprint and biocapacity timelines of Germany (Figure 2). At the country level, the implementation of the updated Average Forest-Carbon Sequestration factor in the 2016 NFA edition resulted in a large increase in Germany’s total Ecological Footprint over the entire timeline. This increase is more pronounced in Germany than in global results, with an increase from 4.4 gha per person in the 2015 NFA edition to 5.4 gha per person in the 2016 edition (using data year 2008). The timelines for the editions before and after the 2016 edition indicate changes, but none as dramatic as the changes brought about by the improvement to carbon calculations. On the biocapacity side, similar to the world timelines, Germany’s timeline shows comparable results from edition to edition.

3.2. National Footprint Accounts, 2018 Edition

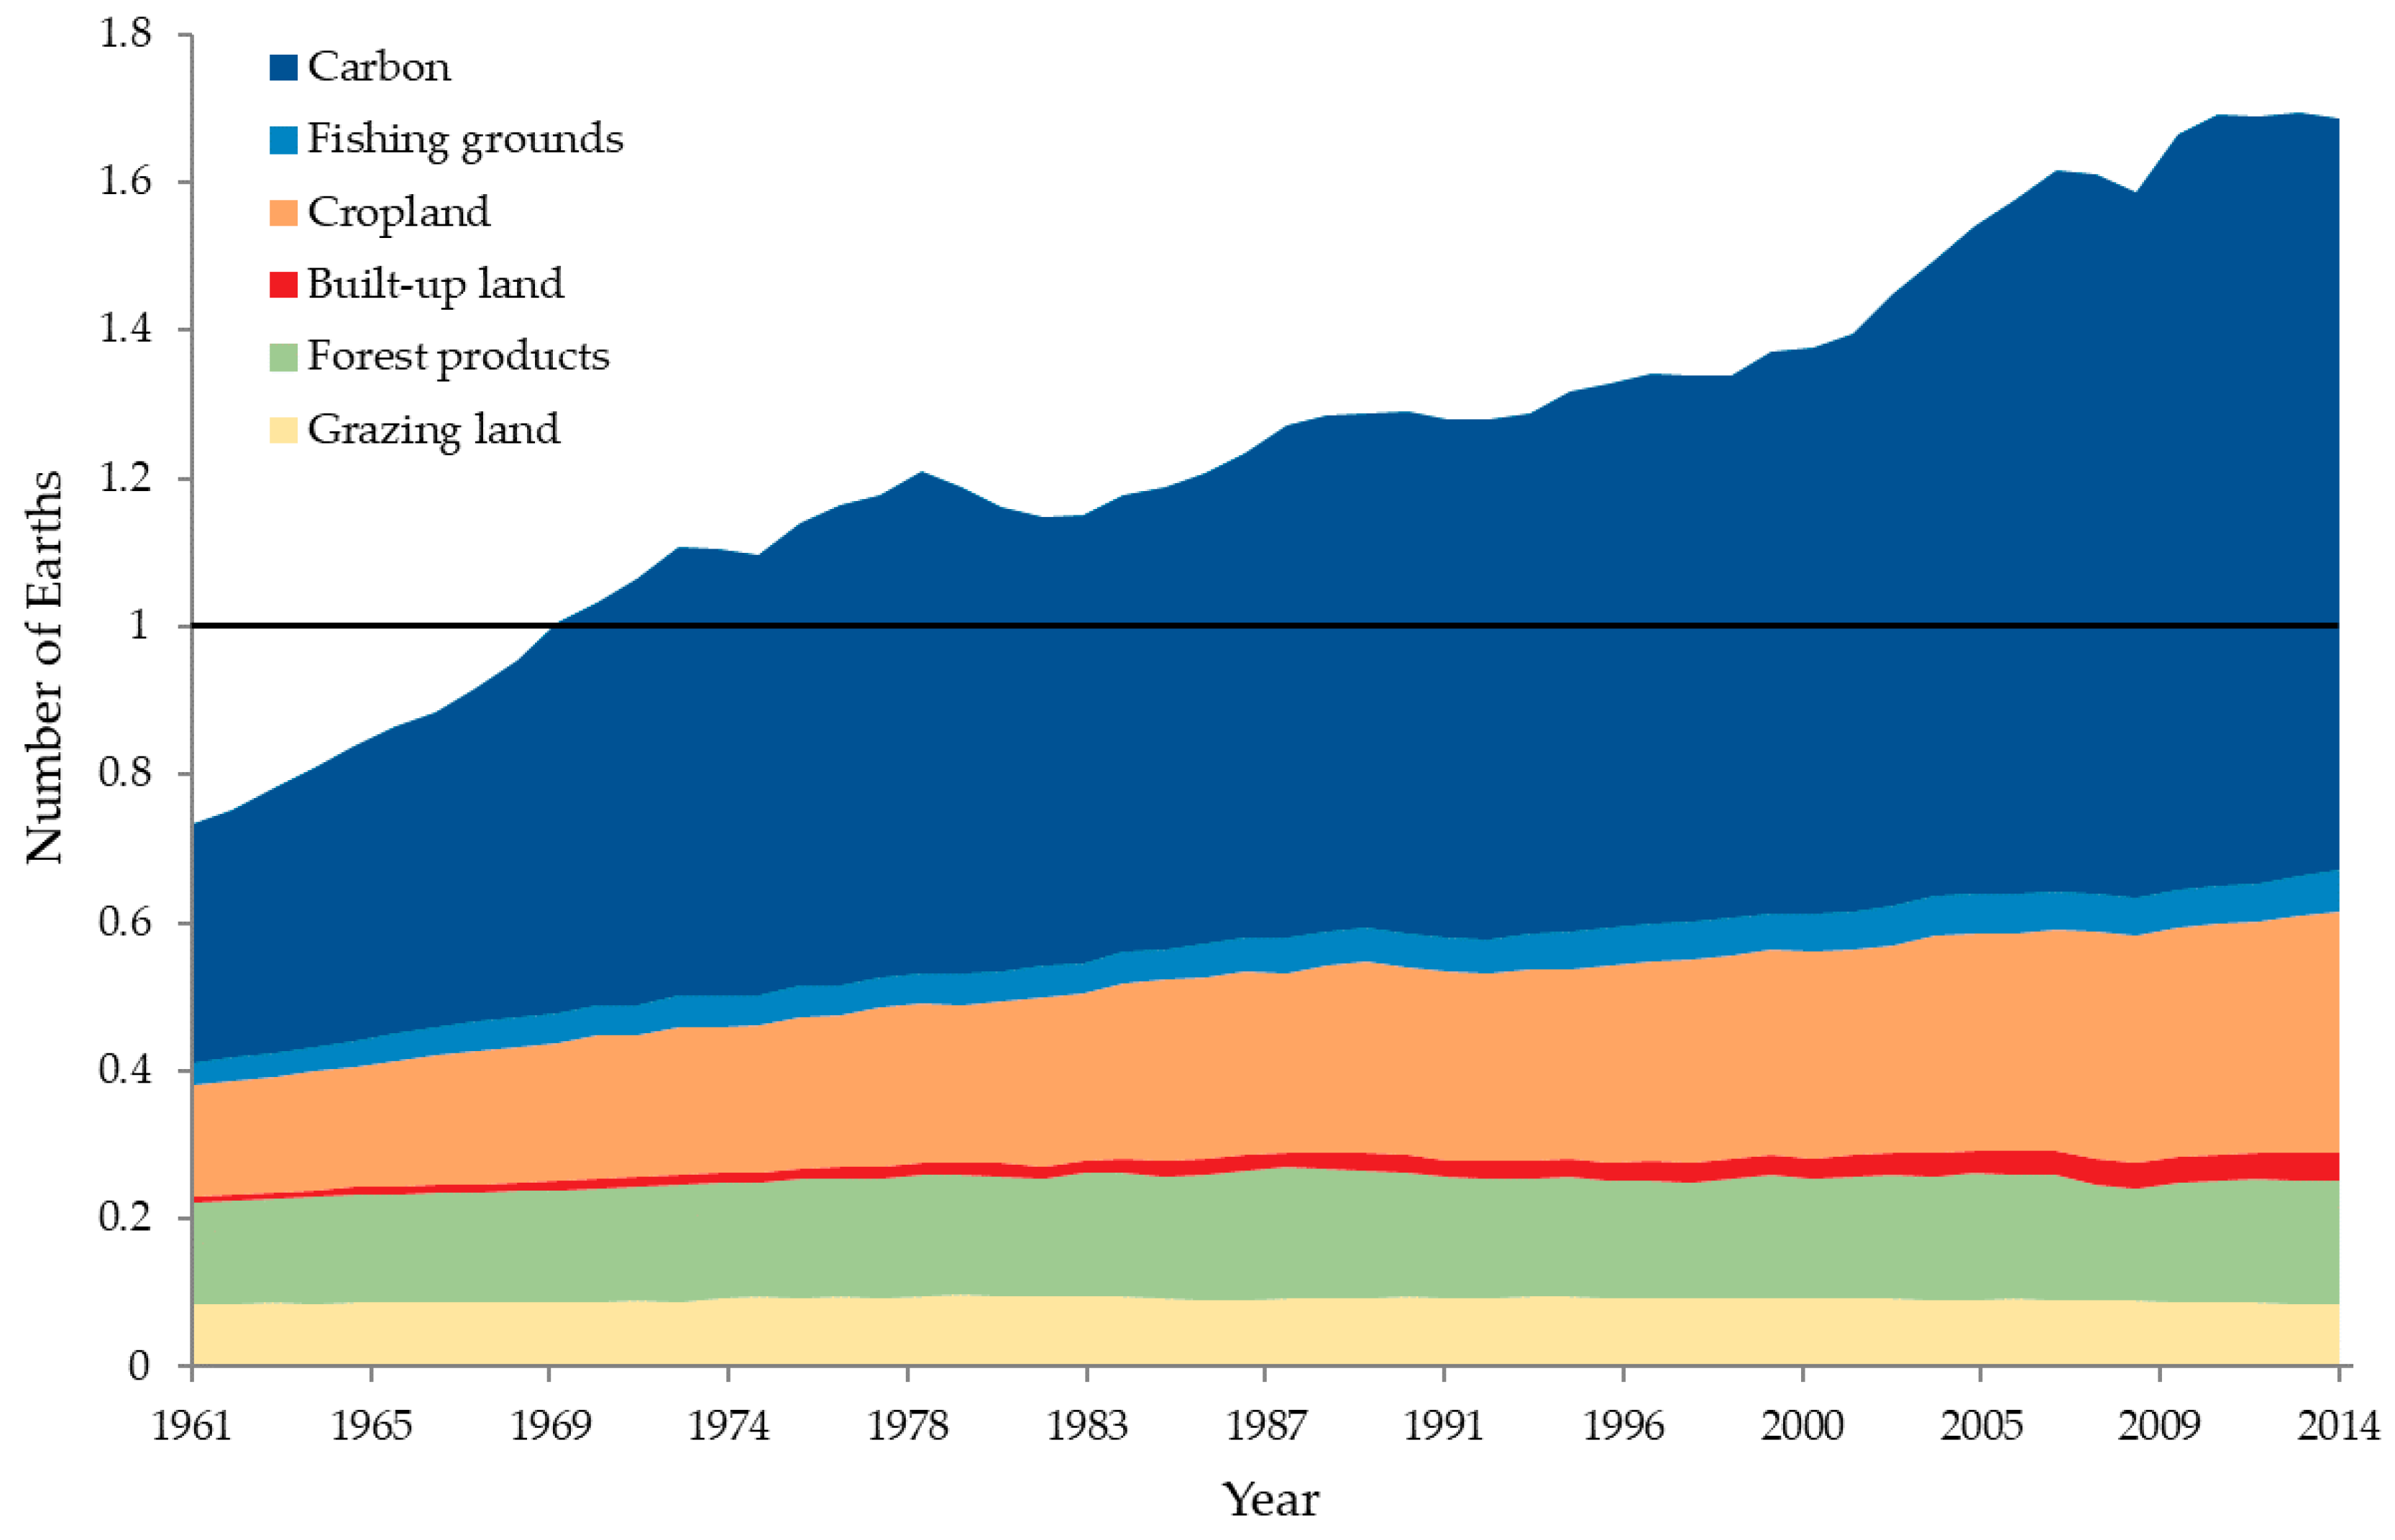
3.2.1. Global Trends

Humanity’s total Ecological Footprint has been increasing steadily at an average of 2.1 percent per year (SD = 1.9) since 1961, nearly tripling from 7.0 billion gha in 1961 to 20.6 billion gha in 2014. The increase in Ecological Footprint has been outpacing biocapacity increases, which have increased at an average of 0.5 percent per year (SD = 0.7), from 9.6 billion gha in 1961 to 12.2 billion gha in 2014. Together, these results indicate that Earth’s ecological overshoot began in the 1970s; further, ecological overshoot continues to grow at an average rate of 2.0 percent (SD = 2.3) per year. In 2014, humanity’s Ecological Footprint was 69.6 percent greater than Earth’s biocapacity [18].
During the same period, per capita Ecological Footprint increased by 24 percent (2.29 to 2.84 gha per person), while per capita biocapacity decreased by 46 percent (3.13 to 1.68 gha per person) [18]. The increase in total biocapacity and decrease in per capita biocapacity are indicative of a growing global population. More recently, the world Ecological Footprint per person decreased by 1.1 percent between 2010 and 2014, while biocapacity per person decreased by 2.4 percent over the same time period. In other words, although our individual share of the world’s biocapacity is decreasing, we are also reducing our individual demand on nature.
The carbon Footprint is the fastest growing Footprint component; in 2014, it comprised 60 percent of the world’s total Ecological Footprint. This is a significant increase from the carbon Footprint in 1961, which contributed to 44 percent of the world’s Ecological Footprint, or 150 years ago, when it was less than one percent of what it is today [45]. Cropland footprint was the next largest contributor to the world’s Ecological Footprint in 2014, at 19.4 percent, followed by forest-product (9.8 percent), grazing-land (5.1 percent), fishing-ground (3.3 percent), and built-up-land (2.3 percent) Footprint types [18] (Figure 3).
Across individual countries, results show that most countries run a biocapacity deficit, where they have larger Ecological Footprints than biocapacity (Figure 4). Countries that continue to have biocapacity reserves (where the biocapacity within a country’s borders is greater than the Ecological Footprint of that country) tend to be located in forested regions, such as the tropics and boreal latitudes.

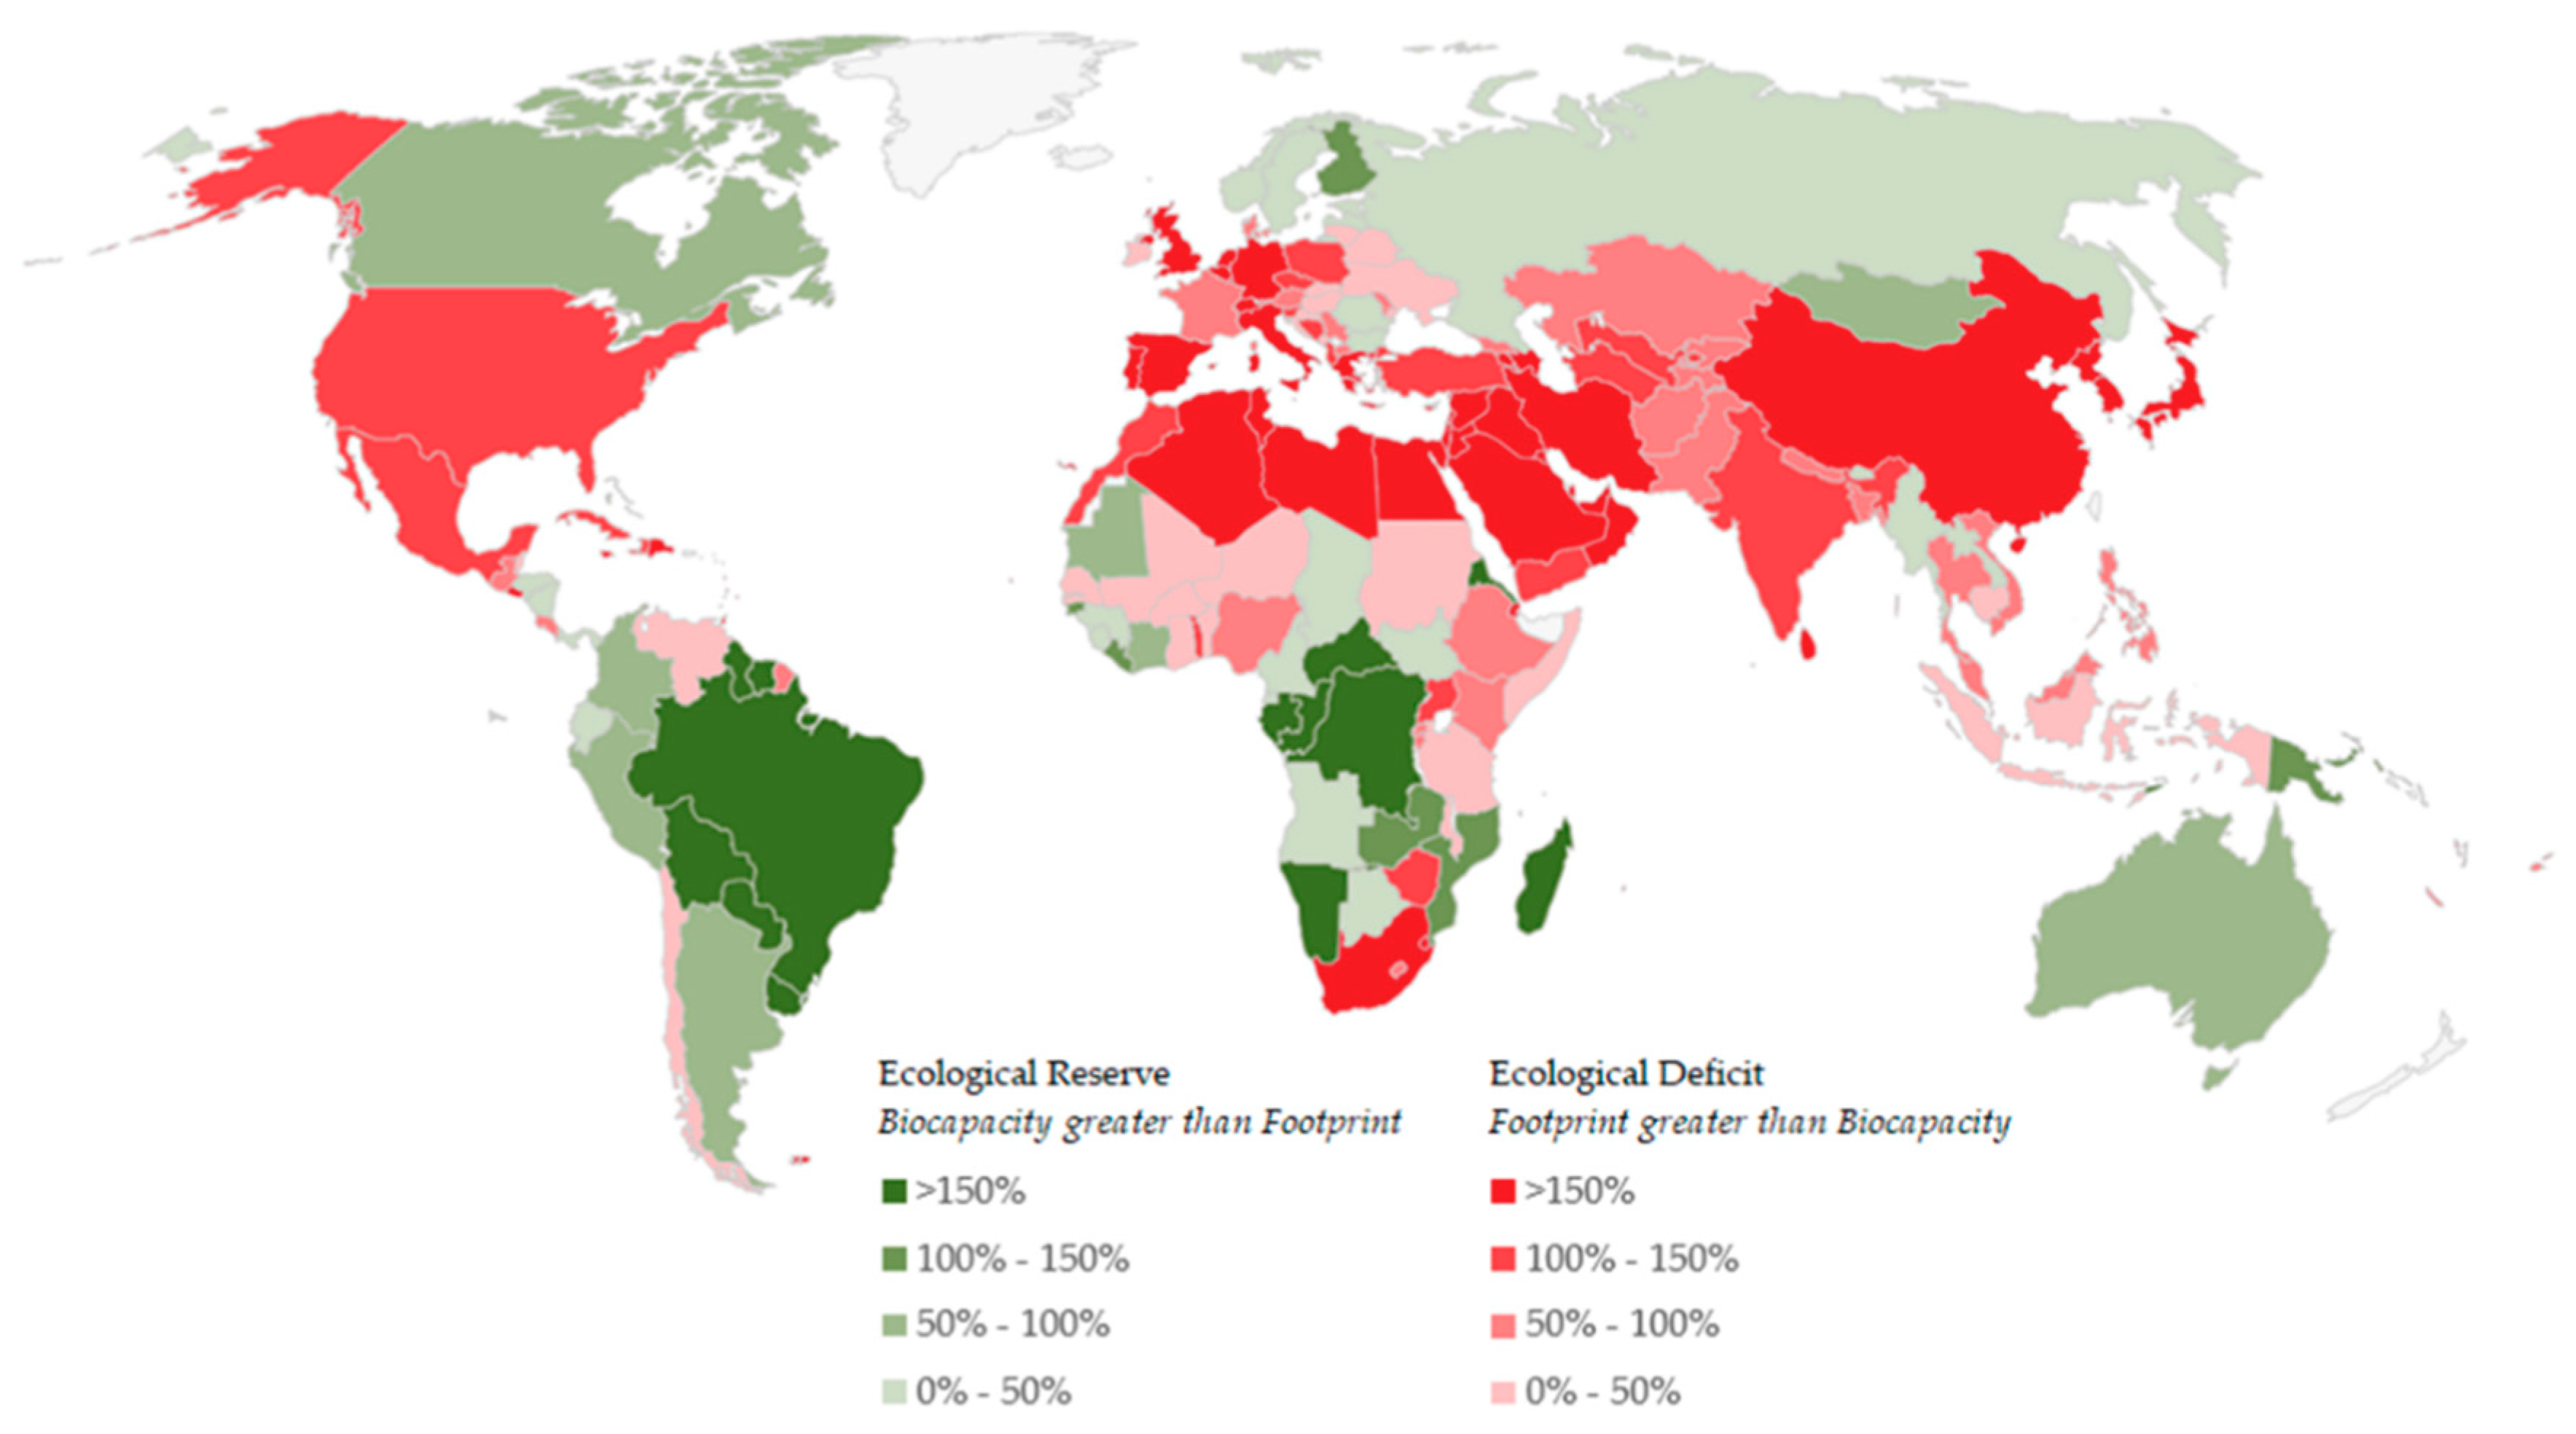
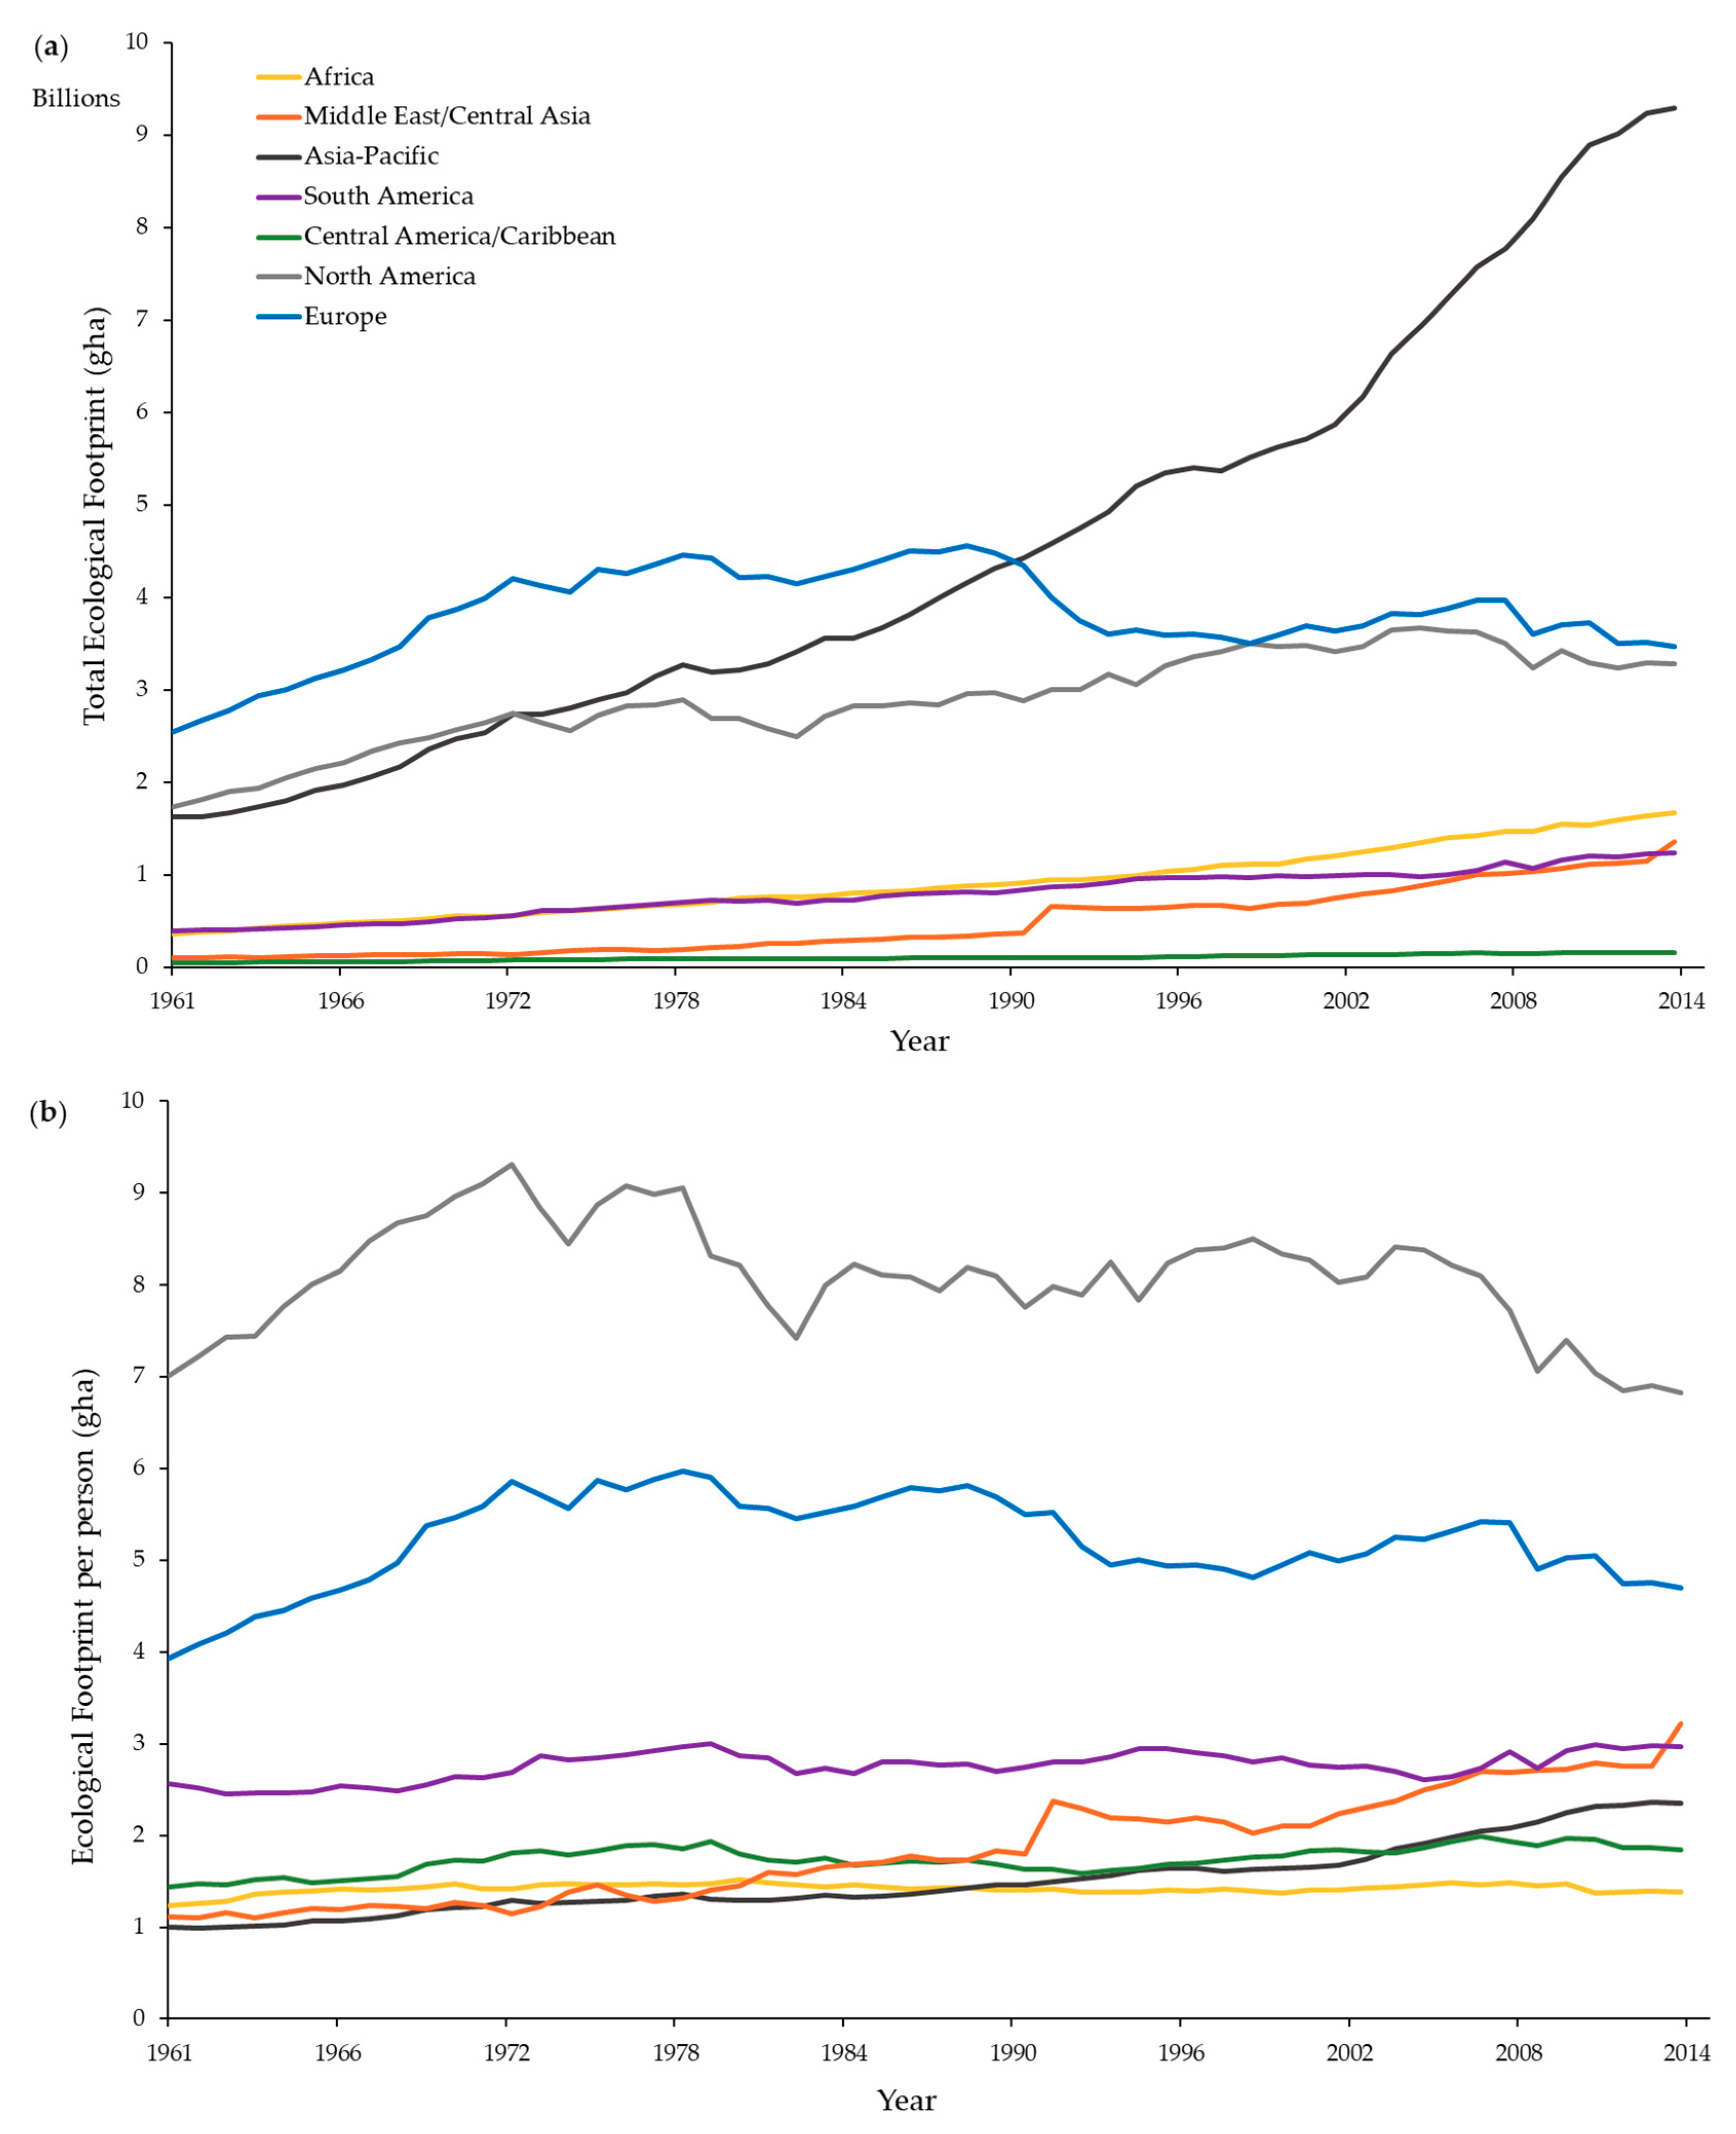
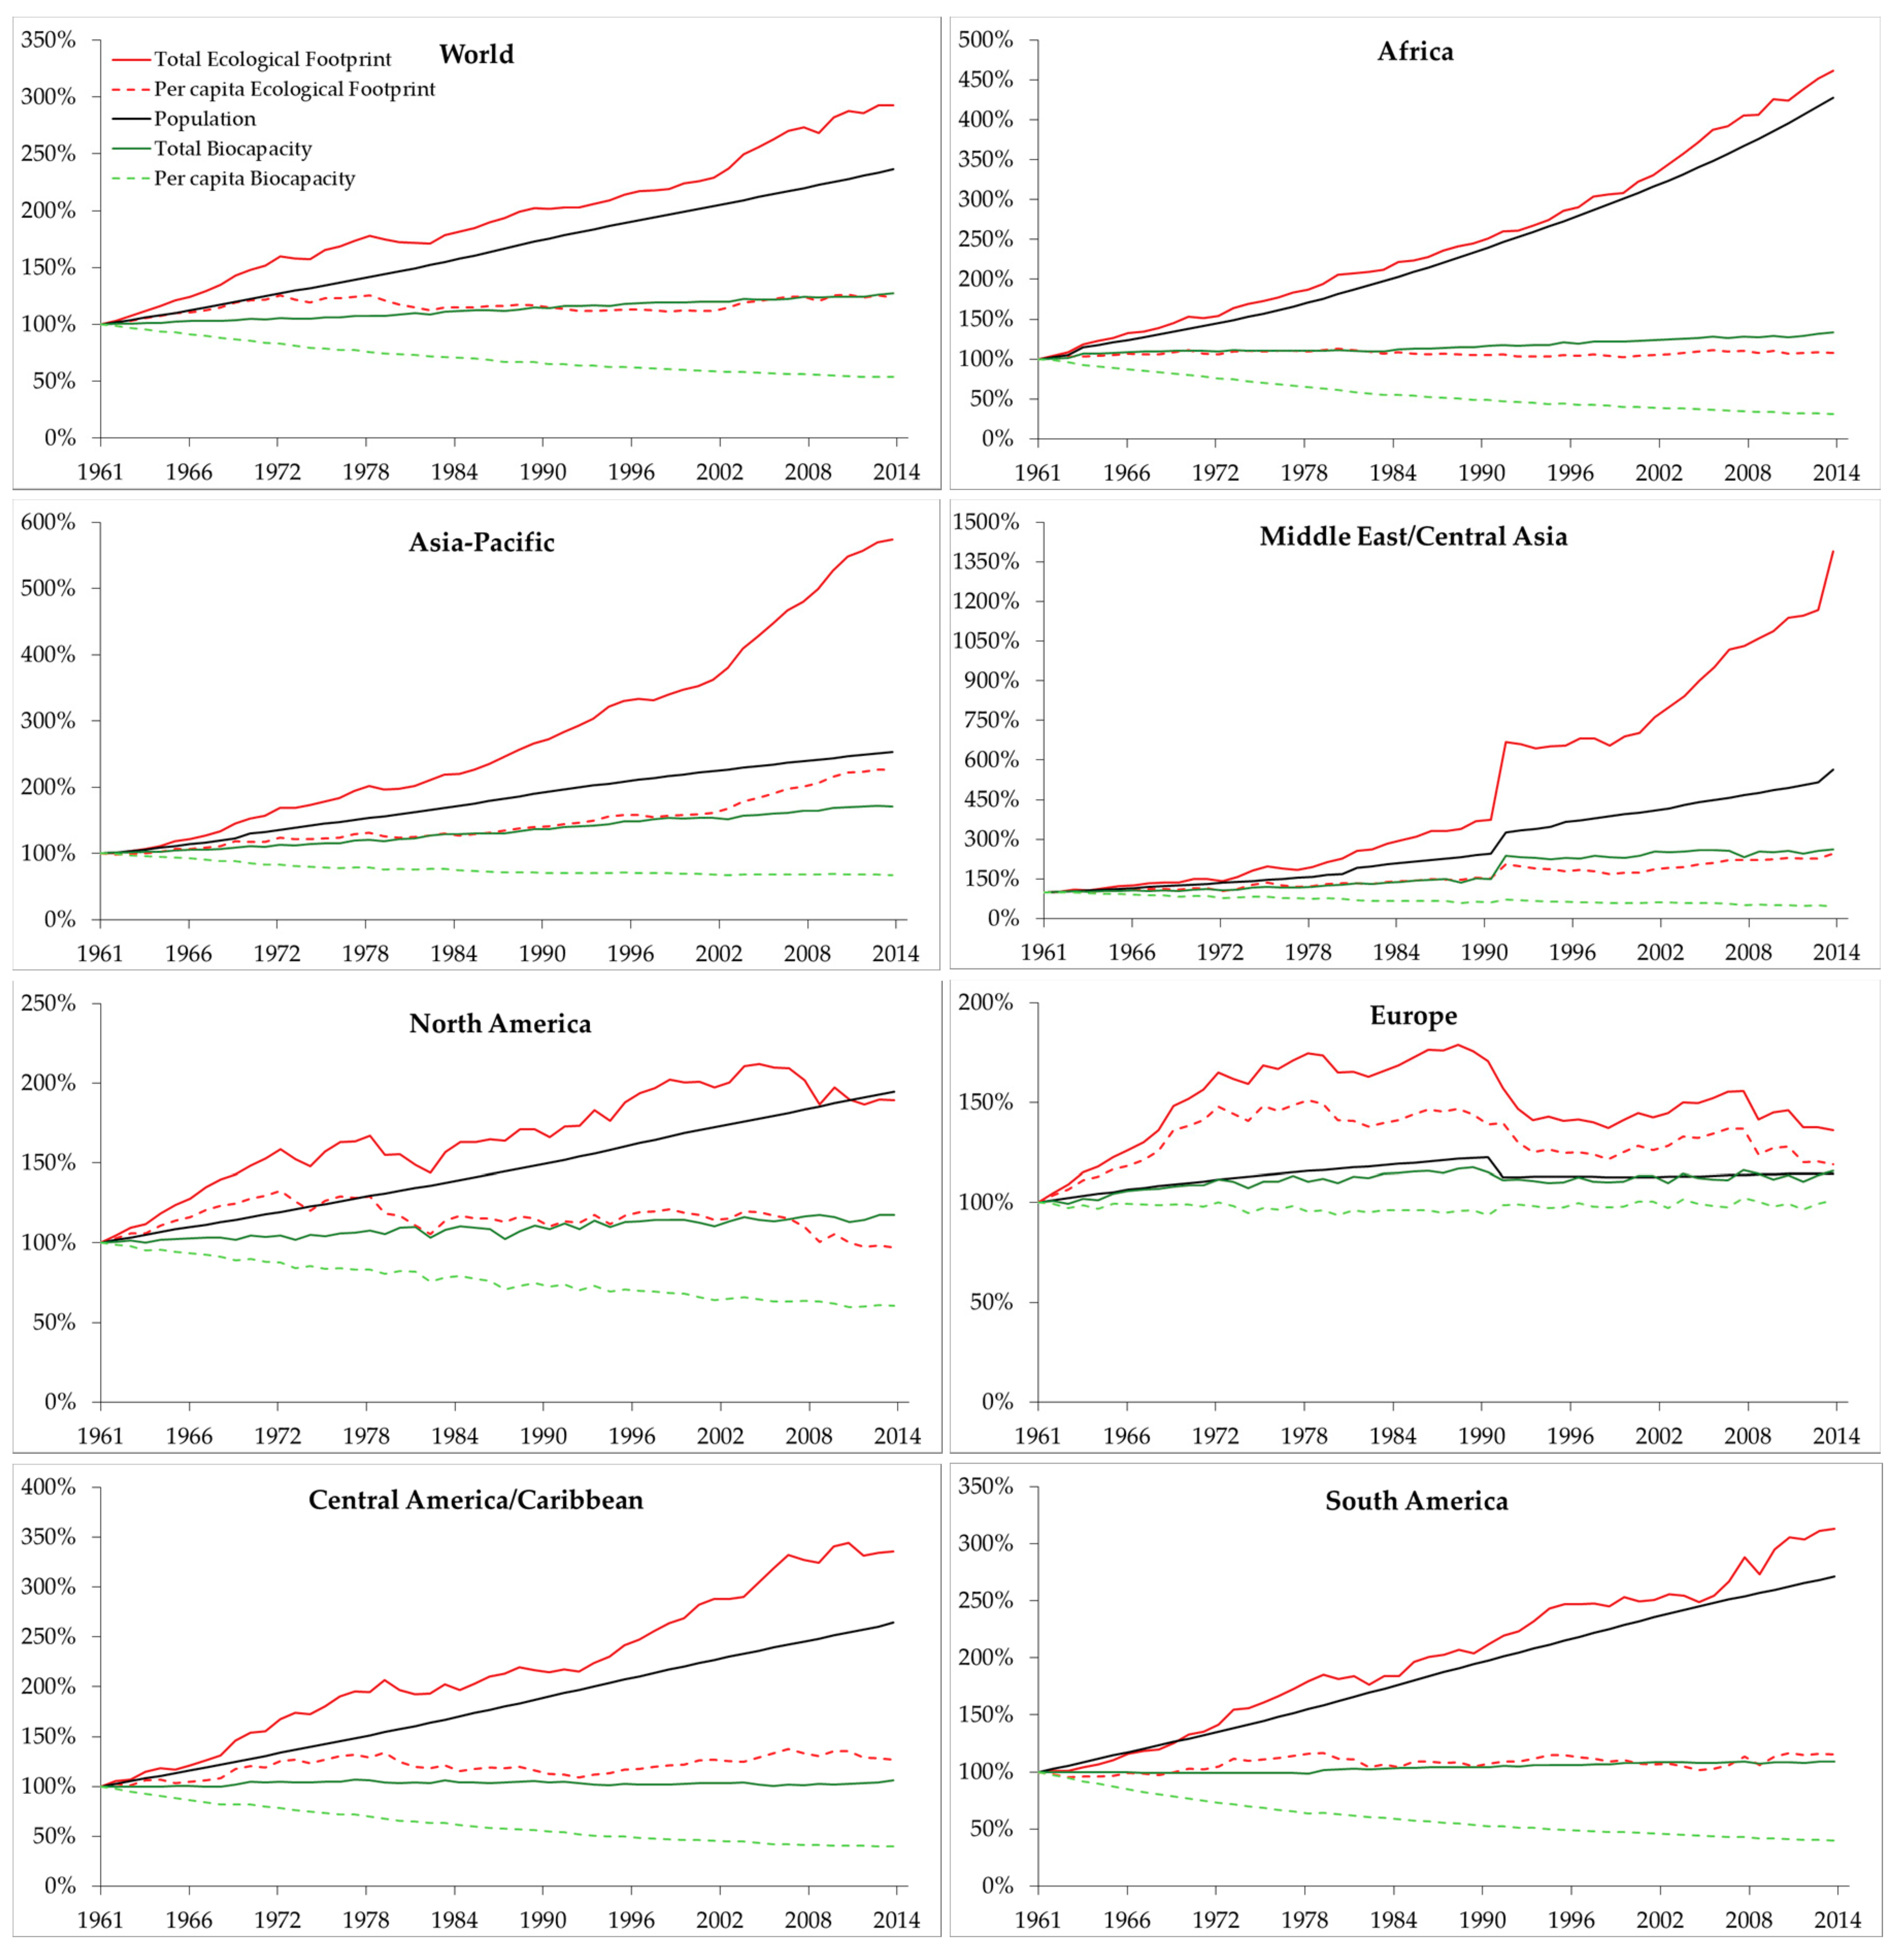
3.2.2. Regional Trends

Breaking down global results by region reveals significant geographic differences in total and per capita Ecological Footprint trends (Figure 5). Perhaps the most striking trend is the rapid increase in Asia’s total Ecological Footprint since the 1980s, which is primarily driven by China [46]. The Ecological Footprint per person in the Asia-Pacific region, although increasing, remains low and has stabilized in recent years. The total Ecological Footprints of Africa and the Middle East/Central Asia region are also increasing, with the per capita Middle East/Central Asia Ecological Footprint rising more rapidly than other regions. Africa’s per capita Ecological Footprint has remained stable and low across the timeline. Differences in total and per capita Ecological Footprint trends in Asia-Pacific and Africa (i.e., increasing total Ecological Footprint with a stable per capita Ecological Footprint), are indicative of significant human population growth in these regions.
North America has an Ecological Footprint per person that is much higher than other world regions, with Europe showing similar, though lower, trends. The total and per capita Ecological Footprint trends of both North America and Europe seem to be stabilizing and decreasing since the 1990s, with clear decreases coinciding with the 2008 global economic crisis.
The total Ecological Footprints of South America and the Central America/Caribbean region have been slightly increasing since 1961, with an apparent dip in South America following the 2008 economic crisis. The Ecological Footprint per person of both regions has fluctuated slightly across the timeline, though levels have remained relatively stable.
While the underlying drivers of growth in the global Ecological Footprint are complex, it is possible to explain the total Ecological Footprint as the product of two factors: human population and per capita consumption. On a global level, per capita consumption has stayed relatively stable since the mid-1970s, changing on average by 0.5 percent per year, for a total increase of 24 percent from 1961 to 2014. Conversely, global population has increased by an average of 2.6 percent per year, for a total increase of 136 percent from 1961 to 2014. This indicates that global population is a larger driver of global EFc (increasing 193 percent since 1961), than individual consumption patterns (i.e., affluence) (Figure 6).
On a regional level, population and affluence dynamics play different roles in driving the overall Footprint increase (Figure 6). The rapid increase in total EFc experienced by the Asia-Pacific and Middle East/Central Asia regions, for instance, is the result of increases in both variables: population increased by 154 percent and 465 percent from 1961 to 2014 in the Asia-Pacific and Middle East/Central Asia, respectively, and per capita Footprint increased by 126 percent and 146 percent. This led to a six-fold and fourteen-fold increase in the total Ecological Footprint of the Asia-Pacific and Middle East/Central Asia regions, respectively. However, it is important to note that the dissolution of the Soviet Union increased the population of the Middle East/Central Asia region in the early 1990s as countries from the former USSR were recategorized from Europe to the Middle East/Central Asia region. Conversely, Europe as a region decreased in population following the dissolution of the USSR.
Europe has seen minor increases in both population (15 percent) and per capita Footprint (19 percent) from 1961 to 2014. EFc trends in Europe tend to follow wider socioeconomic trends: both total and per capita Ecological Footprint increased in the years following WWII, and decreased following the 1973 oil crisis and 2008 financial crisis.
All other regions are characterized by relatively minor increases in per capita Ecological Footprint (8 percent in Africa, 16 percent in South America, and 27 percent in Central America/Caribbean), or even a decrease (by 3 percent in North America) from 1961 to 2014, counterbalanced by major increases in population: 327 percent in Africa, 171 percent in South America, 165 percent in Central America/Caribbean, and 95 percent in North America, indicating the significance of population as a driver of EFc in these regions.

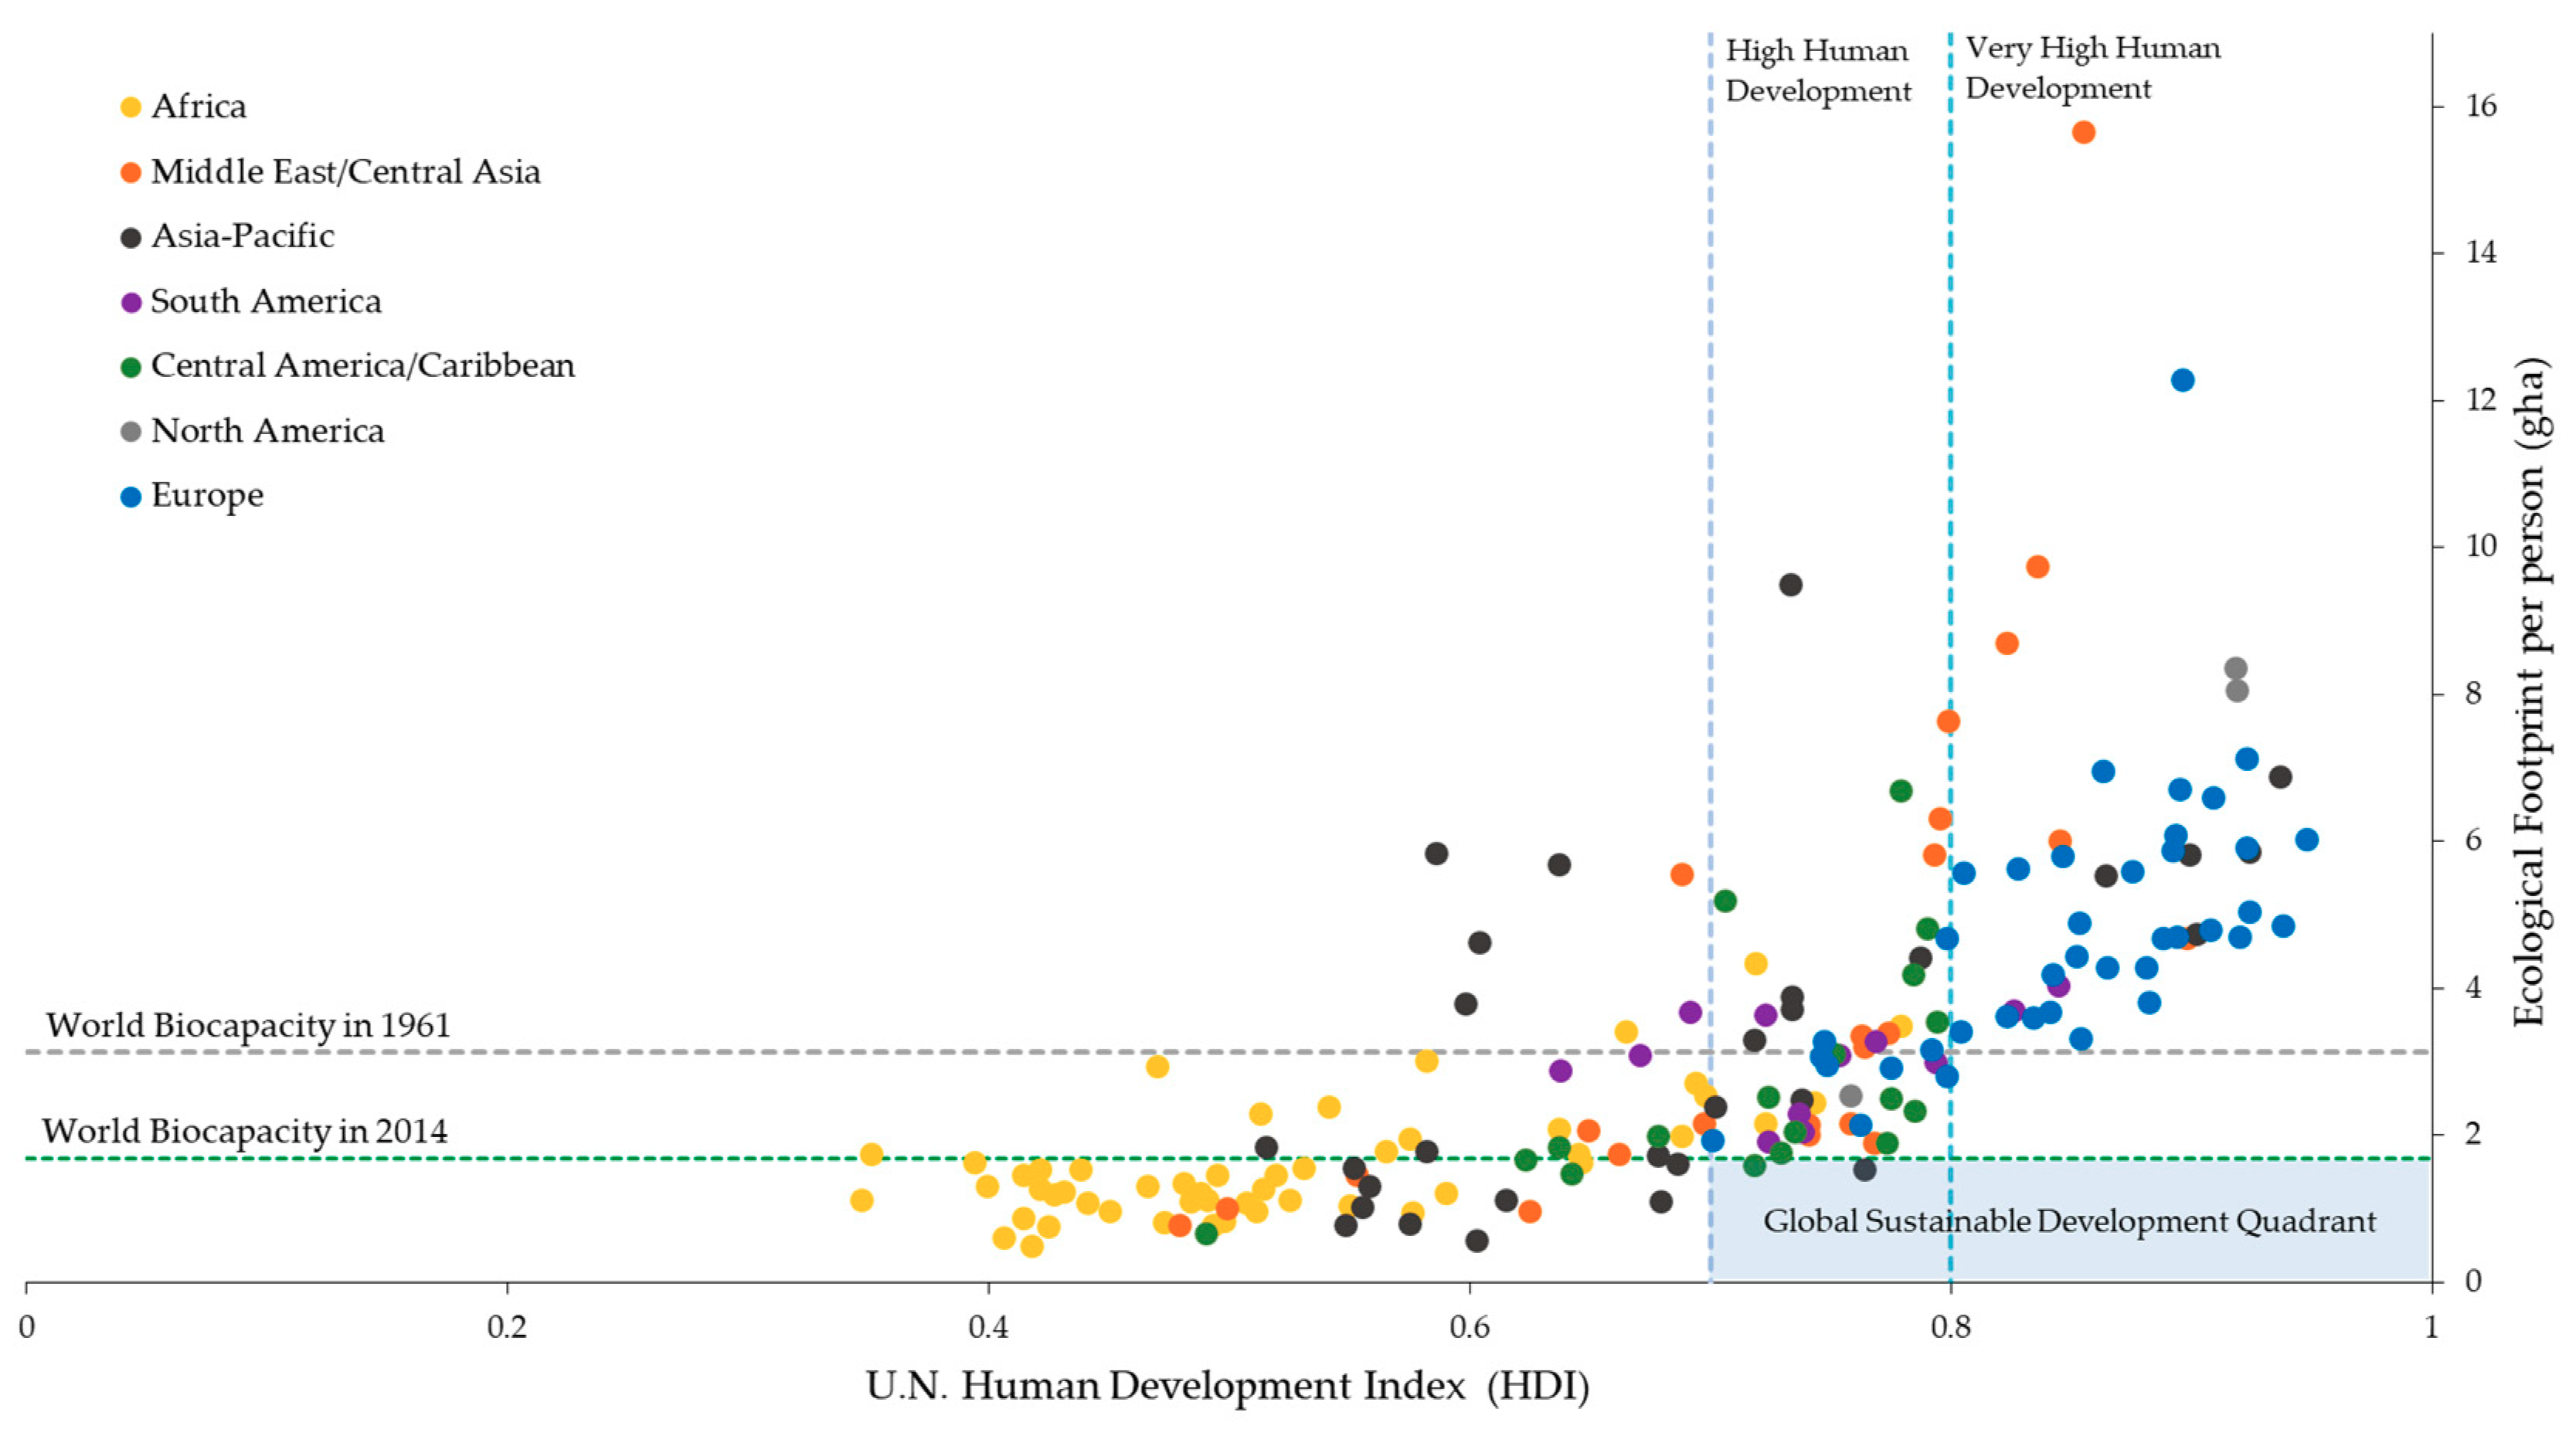
3.2.3. Sustainable Development Trends

National progress towards sustainable development can be assessed by comparing the NFA results to the United Nations’ Human Development Index (HDI), which aggregates education, longevity, and income into a single metric [47] (Figure 7).
The United Nations Development Program (UNDP) defines an HDI score of 0.7 as the threshold for high development [47]. The biocapacity available on the planet is calculated as 1.7 gha per person. Combining these two thresholds gives clear minimum conditions for globally sustainable human development. Countries in the light-blue section of the lower right-hand box (Figure 7) exhibit high levels of development with globally replicable resource demand. As of 2014, only two countries fit these criteria: Sri Lanka and the Dominican Republic. On average, the world is moving closer to the Global Sustainable Development Quadrant: HDI has increased consistently since the metric was developed in 1990, from 0.55 in 1990 to 0.69 in 2014 (weighted by the population of each country) [47]. In addition, the world’s Ecological Footprint per person decreased from slightly from 2013 to 2014. However, the current world Ecological Footprint of 2.8 gha per person remains far above the 1.7 gha of biocapacity available to each person [18].

4. Discussion

4.1. Ecological Footprint Accounting Improvements

The accounting changes documented here have produced more reliable and robust National Footprint Accounts due to improved data quality, updated data sources, and more precise calculation factors. Some improvements, such as the Average Forest-Carbon Sequestration factor, significantly changed country-specific accounts (e.g., Germany). However, the Ecological Footprint of the world has remained largely unchanged, indicating relatively mature results at the global level. Indeed, global variability across the past six editions has been minimal, and global Ecological Footprint and biocapacity trends have remained stable. This is partially a reflection of the fact that global results are both relatively stable and that the EF of production and EF of consumption are equal for the world; therefore, trade does not need to be accounted. At the country level, improvements have had a stronger effect at improving the accounting of EF embodied in trade, in which we have traditionally seen more variability and extreme statistical outliers in country timelines. These improvements come both from improved input data and from improvements to EF accounting. Additionally, the process of identifying areas of improvement generally results in targeting datasets or subsets of countries, where data reporting is poor, or where underlying assumptions do not apply equally due to more extreme conditions, as is the case of marginal crops accounting improvement.
Many of the suggestions from the research agenda published by Kitzes et al. [24] have been incorporated into the National Footprint Accounts. Greater stability in global results compared to country-level results as we have presented here may suggest that future improvements will be more refined and nuanced, but this is not necessarily the case. There remains a large scope for improving the accounting Ecological Footprint at the country level and for the world. NFAs are produced primarily from publicly available datasets with global coverage and standardization to maintain comparability across country results. As a result, there is a lag between the development of technological and other types of improvements in data collection and their maturity to the extent they can be globally repeatable and available. We have identified existing data gaps in specific Footprint components and expect improved global datasets to reflect marked improvements in recent years, and will be publishing the updated research agenda as part of an upcoming academic collaboration described below. Such improvements would increase the accuracy, resolution, and timeliness of the results, and allow for more improved assessments of short-term trends.

4.2. Ecological Footprint and Biocapacity Trends

Ecological overshoot has continued to grow since the 1970s at an average rate of 2 percent per year. Humanity is now demanding 1.7 planets to sustain our demand on Earth’s natural resources. While global biocapacity has also increased, primarily due to increased agricultural yields, the Ecological Footprint of the world continues to outpace biocapacity. Global ecological-overshoot trends are indicative of the loss and degradation of natural capital, and the accumulation of waste in our atmosphere. The physical manifestations of ecological overshoot include biodiversity loss, climate change, deforestation, fisheries depletion, and soil degradation. Recent studies of planetary overuse corroborate these results [11,48,49,50,51,52,53].
In the NFA methodology, Ecological Footprint accounts typically underestimate human demand on the earth’s resources because not all aspects of consumption can be captured. In addition, biocapacity results should be interpreted as an account of annual regenerative capacity under current conditions—not an indication of future capacity. With this interpretation, it is understood that current resource yields may be impacted by the loss or degradation of natural capital, leading to reduced yields in the future. For instance, the overuse of groundwater may lead to future soil erosion, warmer and drier climates, or depleted fish stocks. As such, the results presented here by the NFAs may underestimate the actual biocapacity deficit of countries, or overestimate their biocapacity reserves.
Since 2010, individual Ecological Footprints have decreased by 1.1 percent. During that same time period, per capita biocapacity has decreased by 2.4 percent. This indicates that, while our share of the world’s biocapacity is decreasing, we are also reducing our individual demand on nature. This positive news is tempered by the fact that human population is expected to be 9.8 billion by 2050 [54]. Indeed, regional trends reveal that total Ecological Footprint growth trends in Africa and the Asia-Pacific region are largely driven by population. So while we may be demanding less as individuals, together our demand on nature has increased the world’s Ecological Footprint by 3.7 percent since 2010. In addition to human-population growth, the Ecological Footprint has been studied in conjunction with other socioeconomic indicators, including GDP [55,56], commodity prices [57], globalization [58], policy shocks [59], and various other sociopolitical factors (e.g., Reference [60]). These studies link the Ecological Footprint to wider economic and social changes.
The carbon footprint, which accounts for 60 percent of the global Ecological Footprint, is the fastest-growing component. The next largest footprint component is cropland, which accounts for 19 percent of the total global Ecological Footprint. Analyzing the Ecological Footprint by footprint type reveals an easy target for achieving significant reductions in the world’s Ecological Footprint: transitioning to clean energy. It also highlights the important role forests play in biocapacity reserves to assimilate the accumulated waste in our atmosphere. Reforming unsustainable agricultural and food-consumption practices would also greatly contribute to global Ecological Footprint reductions.

4.3. Relevance of National Footprint Accounts to Global Sustainability

The Ecological Footprint quantifies the gap between human demand on and the regeneration of natural resources. It is a comprehensive sustainability metric that aims to capture all aspects of human consumption that derive from mutually exclusive bioproductive areas. While “sustainability” is a broad concept with many definitions and connotations [2], it is clear that sustainability goals cannot be achieved if natural capital is continuously eroded. Sustainability progress can be measured and assessed using Ecological Footprint accounts, which define the minimal conditions for living within the regenerative capacity of the planet’s ecosystems. Keeping humanity’s Ecological Footprint within the biocapacity of the planet is the foundational minimum threshold for enabling human activities to persist rather than decline. However, reducing the human footprint to one planet remains insufficient, since other species must also compete for the planet’s biocapacity. E.O. Wilson, in his recent book Half Earth, argues that half of the planet should be left for wild species to “to stave off the mass extinction of species, including our own” [61].
While human demand can exceed regeneration for some time, surpassing it leads inevitably to unsustainable depletion of nature’s stock and reductions in available material inputs. In other words, such depletion can only be maintained temporarily. The question that then emerges is, how long can overshoot persist? This is a significant question that the Ecological Footprint cannot address with precision. The Ecological Footprint does not evaluate the level of degradation, nor does it evaluate the long-term implications of resource use on ecosystem productivity. It is not a full assessment of sustainability and is most useful when complemented with other relevant measures.
Ecological Footprint accounting becomes a metric for “unsustainability” if the basic condition for sustainability is not met, that is, if human demand does not stay within the planet’s available biocapacity. By measuring this bottom-line condition for sustainability, Ecological Footprint accounts provide a foundation upon which many other sustainable-development metrics and strategies can be built. For example, combining the Ecological Footprint with the Human Development Index reveals the extent to which countries are moving towards, or away from, global sustainable development. This analysis can inform the progress of the Sustainable Development Goals, and can test to what extent efforts to achieve them are producing the intended outcomes [62].

4.4. Applications of National Footprint Accounts

The applications of the NFA are extensive. No recent comprehensive reviews of Ecological Footprint applications exist, but the NFA and Ecological Footprint concept have been used extensively within the scientific community. A rough approximation of publications in the last five years yields 1120 and 17,200 results for the terms “National Footprint Accounts,” and “Ecological Footprint”, respectively [63,64]. Outside of academia, applications can be generally separated into two categories: direct applications of NFA results, and indirect applications, where NFA results are used to support Ecological Footprint calculations (e.g., of products, activities, individuals, organizations, cities, or other subnational entities) or other derivative applications (e.g., Environmentally-Extended Multiregion Input–Output (MRIO) and Consumption Land-Use Matrix (CLUM) analyses). Both direct and indirect products of the NFA are used for global campaigns, such as “Earth Overshoot Day”, which had a tracked “reach” of over 3 billion in 2018 [65], and the Ecological Footprint calculator (www.footprintcalculator.org), which has been visited over 12 million times since 2007. The use of NFA data in education and awareness building among students and civil society is widespread [66].
Direct applications: Several national governments have integrated results from the NFA into existing sustainable development-monitoring frameworks as a high-level indicator to set targets and to guide sustainability and development policy (See: www.footprintnetwork.org/our-work/countries) [56,67], including Wales, Switzerland, Slovenia, Japan, the United Arab Emirates [68], Ecuador, and Montenegro [69]. The Ecological Footprint of countries has also been independently assessed by researchers across the world (see Wackernagel et al. [67] for a comprehensive review).
NFA results have been used by international organizations to highlight the importance of natural resources as a basis for wellbeing [70,71]. The Ecological Footprint has been adopted as a headline indicator by the Biodiversity Indicators Partnership to monitor the progress of the Aichi Biodiversity Target 4 [72], and is used as a core indicator by the Intergovernmental Science-Policy Platform on Biodiversity and Ecosystem Services (IPBES) to monitor anthropogenic drivers of biodiversity loss and ecosystem functioning in regional and global assessments [73]. NFA results are also frequently used by the national offices of the World Wildlife Fund for Nature (WWF) for communication and policy work (e.g., References [74,75,76,77,78]).
In the finance sector, NFA results have been used to quantify environmental risk for sovereign-credit analysis, including transition risk, food-price shock, local environmental-degradation risk, and trade dependency [79,80,81].
Indirect applications: The most common indirect usage of the NFA results include applying national yield factors, equivalence factors, and/or national results to derive subnational Ecological Footprint and biocapacity calculations [82,83].
Environmentally extended MRIO models offer various ways to analyze and present results in an economic framework. Household expenditure datasets [84] allow NFA results to be further categorized in terms of final demand consumption categories (food, housing, transportation, goods, and services) in a CLUM, which serves as the basis for top–down individual and subnational Ecological Footprint analyses. Over 100 cities and regions have measured their Ecological Footprint (See: www.footprintnetwork.org/our-work/cities), including cities like Calgary, Vancouver, and six cities in Portugal.

4.5. Looking Forward: The Future of National Footprint Accounts

A larger academic effort is now underway between Global Footprint Network and York University to build a global academic community. This collaboration is intended to make the accounts even more robust, transparent, and accessible by (1) developing a more comprehensive research agenda, (2) encouraging broader academic participation, and (3) maintaining public access to NFA data and results. Updates on this new collaboration are available at footprint.info.yorku.ca.
Given the massive and growing global ecological overshoot, the time for robust Ecological Footprint accounting, particularly at the national level, has never been more relevant. Whether humanity has the wisdom to take advantage of such information to build more robust economies is yet another question. The hope is that this broader academic collaboration will also help apply Ecological Footprint analytics towards making a brighter future for all.

Author Contributions

Conceptualization, D.L., L.H. and A.G.; data curation, M.E., E.N., M.S.M., J.M., F.-Z.M., and S.H.; formal analysis, D.L., L.H., A.M., M.E. and E.N.; methodology, D.L. and A.G.; project administration, D.L.; supervision, D.L.; writing—original draft, D.L., L.H., A.M. and M.W.; writing—review and editing, D.L., L.H., A.M. and M.W.

Funding

This research was funded by MAVA, Fondation pour la Nature, grant number 17082.

Acknowledgments

We would like to thank the MAVA foundation for their generous support of the National Footprint Accounts. We would also like to acknowledge the members of the National Accounts Committee who provided direct feedback for improvements described here. These include Marco Bagliani, Kevin Lewis, Richard McLellan, Tuomas Mattila, William Rees, Anke Schaffartzik, David Vaĉkar, and Yoshihiko Wada. Finally, we would like to extend our gratitude to all advisors, researchers, and technical-support staff who have contributed to the production and improvement of the National Footprint Accounts during this period: Michael Borucke, Derek Eaton, Steve Goldfinger, Elias Lazarus, David Zimmerman, Golnar Zokai; we also express our greatest appreciation for the dedication and hard work of our volunteers and assistants: Sabrina Amaro, Arthur Cen, Alex Church, Lea Cohen, Hye Soo Cho, Mahsa Fatemi, Lia Ferguson, Jeanette Hardiman, Calvin Kuang, Shehnaz Mannan, Sara Melziade, Jingning Mei, Alex Moon, Chiron Mukherjee, Tenzin Norbu, Trang Nguyen, Louisa Pitney, Jessica Robbins, Guole Shi, Zhiyu Tang, Dengyao Xu, Rong Xu, Sol Ah Yoo.

Conflicts of Interest

The authors declare no conflict of interest.

References

  1. World Commission on Environment and Development. Our Common Future; World Commission on Environment and Development: Oxford, UK, 1987. [Google Scholar]
  2. Sala, S.; Farioli, F.; Zamagni, A. Progress in sustainability science: Lessons learnt from current methodologies for sustainability assessment: Part 1. Int. J. Life Cycle Assess. 2013, 18, 1653–1672. [Google Scholar] [CrossRef]
  3. McMichael, A.J.; Butler, C.D.; Folke, C. New Visions for Addressing Sustainability. Science 2003, 302, 1919–1920. [Google Scholar] [CrossRef] [PubMed]
  4. Pulselli, F.M.; Moreno Pires, S.; Galli, A. The Need for an Integrated Assessment Framework to Account for Humanity’s Pressure on the Earth System. In The Safe Operating Space Treaty: A New Approach to Managing Our Use of the Earth System; Magalhães, P., Steffen, W., Bosselmann, K., Aragão, A., Soromenho-Marques, V., Eds.; Cambridge Scholars Publishing: Cambridge, UK, 2016; pp. 213–245. [Google Scholar]
  5. Costanza, R.; McGlade, J.; Lovins, H.; Kubiszewski, I. An Overarching Goal for the UN Sustainable Development Goals. Solutions 2014, 5, 13–16. [Google Scholar]
  6. United Nations Agenda. Chapter 40: Information for Decision-Making; United Nations Agenda: Rio de Janerio, Brazil, 1992; pp. 346–351. [Google Scholar]
  7. Wackernagel, M.; Galli, A.; Hanscom, L.; Lin, D.; Mailhes, L.; Drummond, T. Chapter 16: Ecological Footprint Accounts: Principles. In Routledge Handbook of Sustainability Indictors; Bell, S., Morse, S., Eds.; Routledge International Handbooks; Routledge: Abingdon, UK, 2018; pp. 244–264. [Google Scholar]
  8. Wackernagel, M.; Galli, A.; Hanscom, L.; Lin, D.; Mailhes, L.; Drummond, T. Chapter 33: Ecological Footprint Accounts: Criticisms and Applications. In Routledge Handbook of Sustainability Indictors; Bell, S., Morse, S., Eds.; Routledge International Handbooks; Routledge: Abingdon, UK, 2018; pp. 521–539. [Google Scholar]
  9. Mancini, M.S.; Galli, A.; Coscieme, L.; Niccolucci, V.; Lin, D.; Pulselli, F.M.; Bastianoni, S.; Marchettini, N. Exploring ecosystem services assessment through Ecological Footprint accounting. Ecosyst. Serv. 2018, 30, 228–235. [Google Scholar] [CrossRef]
  10. Galli, A.; Wackernagel, M.; Iha, K.; Lazarus, E. Ecological Footprint: Implications for biodiversity. Biol. Conserv. 2014, 173, 121–132. [Google Scholar] [CrossRef]
  11. Steffen, W.; Richardson, K.; Rockström, J.; Cornell, S.E.; Fetzer, I.; Bennett, E.M.; Biggs, R.; Carpenter, S.R.; de Vries, W.; de Wit, C.A.; et al. Planetary boundaries: Guiding human development on a changing planet. Science 2015, 347, 1259855. [Google Scholar] [CrossRef] [PubMed]
  12. Sala, S.; Ciuffo, B.; Nijkamp, P. A systemic framework for sustainability assessment. Ecol. Econ. 2015, 119, 314–325. [Google Scholar] [CrossRef]
  13. Wackernagel, M.; Onisto, L.; Linares, A.C.; Falfan, I.S.L.; Garcia, J.M.; Guerrero, A.I.S.; Guerrero, M.G.S. Ecological footprints of nations: How much nature do they use? How much nature do they have? In Commissioned by the Earth Council for the Rio+5 Forum; UNEP: Toronto, ON, Canada, 1997. [Google Scholar]
  14. Wackernagel, M.; Onisto, L.; Bello, P.; Linares, A.C.; Falfán, I.S.L.; Garcıa, J.M.; Guerrero, A.I.S.; Guerrero, M.G.S. National natural capital accounting with the ecological footprint concept. Ecol. Econ. 1999, 29, 375–390. [Google Scholar] [CrossRef]
  15. Wackernagel, M.; Rees, W. Our Ecological Footprint: Reducing Human Impact on the Earth; New Society Publishers: Gabriola Island, BC, Canada, 1996; ISBN 978-0-86571-312-3. [Google Scholar]
  16. Borucke, M.; Moore, D.; Cranston, G.; Gracey, K.; Iha, K.; Larson, J.; Lazarus, E.; Morales, J.C.; Wackernagel, M.; Galli, A. Accounting for demand and supply of the biosphere’s regenerative capacity: The National Footprint Accounts’ underlying methodology and framework. Ecol. Indic. 2013, 24, 518–533. [Google Scholar] [CrossRef]
  17. Lazarus, E.; Zokai, G.; Borucke, M.; Panda, D.; Iha, K.; Morales, J.C.; Wackernagel, M.; Galli, A.; Gupta, N. Working Guidebook to the National Footprint Accounts, 2014th ed.; Global Footprint Network: Oakland, CA, USA, 2014. [Google Scholar]
  18. Global Footprint Network. National Footprint Accounts, 2018th ed.; Global Footprint Network: Oakland, CA, USA, 2018. [Google Scholar]
  19. Wackernagel, M.; Schulz, N.B.; Deumling, D.; Linares, A.C.; Jenkins, M.; Kapos, V.; Monfreda, C.; Loh, J.; Myers, N.; Norgaard, R. Tracking the ecological overshoot of the human economy. Proc. Natl. Acad. Sci. USA 2002, 99, 9266–9271. [Google Scholar] [CrossRef] [PubMed] [Green Version]
  20. Daly, H.E. Toward some operational principles of sustainable development. Ecol. Econ. 1990, 2, 1–6. [Google Scholar] [CrossRef]
  21. Galli, A. On the rationale and policy usefulness of Ecological Footprint Accounting: The case of Morocco. Environ. Sci. Policy 2015, 48, 210–224. [Google Scholar] [CrossRef]
  22. Wackernagel, M. Land Use: Measuring a Community’s Appropriated Carrying Capacity as an Indicator for Sustainability and Using Appropriated Carrying Capacity as an Indicator, Measuring the Sustainability of a Community; Report I and II to the UBC Task Force on Healthy and Sustainable Communities; The University of British Columbia: Vancouver, BC, Canada, 1991. [Google Scholar]
  23. Wackernagel, M. Ecological Footprint and Appropriated Carrying Capacity: A Tool for Planning Toward Sustainability. Ph.D. Thesis, School of Community and Regional Planning, University of British Columbia, Vancouver, BC, Canada, 1994. [Google Scholar]
  24. Kitzes, J.; Galli, A.; Bagliani, M.; Barrett, J.; Dige, G.; Ede, S.; Erb, K.; Giljum, S.; Haberl, H.; Hails, C.; et al. A research agenda for improving national Ecological Footprint accounts. Ecol. Econ. 2009, 68, 1991–2007. [Google Scholar] [CrossRef] [Green Version]
  25. Jóhannesson, S.; Heinonen, J.; Davidsdottir, B. Increasing the Accuracy of Marine Footprint Calculations. Environ. Res. Lett. 2018, in press. [Google Scholar]
  26. Talberth, J.; Wolowicz, K.; Venetoulis, J.; Gelobter, M.; Boyle, P.; Mott, B. The Ecological Fishprint of Nations: Measuring Humanity’s Impact on Marine Ecosystems; Redefining Progress: Oakland, CA, USA, 2006; pp. 1–12. [Google Scholar]
  27. Wiedmann, T.; Lenzen, M. On the conversion between local and global hectares in Ecological Footprint analysis. Ecol. Econ. 2007, 60, 673–677. [Google Scholar] [CrossRef]
  28. Galli, A.; Giampietro, M.; Goldfinger, S.; Lazarus, E.; Lin, D.; Saltelli, A.; Wackernagel, M.; Müller, F. Questioning the Ecological Footprint. Ecol. Indic. 2016, 69, 224–232. [Google Scholar] [CrossRef]
  29. Galli, A.; Kitzes, J.; Wermer, P.; Wackernagel, M.; Niccolucci, V.; Tiezzi, E. An Exploration of the Mathematics behind the Ecological Footprint. Int. J. Ecodyn. 2007, 2, 250–257. [Google Scholar] [CrossRef]
  30. Lin, D.; Galli, A.; Borucke, M.; Lazarus, E.; Grunewald, N.; Martindill, J.; Zimmerman, D.; Mancini, S.; Iha, K.; Wackernagel, M. Tracking supply and demand of biocapacity through ecological footprint accounting. Sustain. Assess. Renew. Prod. Methods Case Stud. 2016, 179–200. [Google Scholar] [CrossRef]
  31. Lin, D.; Hanscom, L.; Martindill, J.; Borucke, M.; Cohen, L.; Galli, A.; Lazarus, E.; Zokai, G.; Iha, K.; Wackernagel, M. Working Guidebook to the National Footprint Accounts, Version 1.2; Global Footprint Network: Oakland, CA, USA, 2018. [Google Scholar]
  32. Monfreda, C.; Wackernagel, M.; Deumling, D. Establishing national natural capital accounts based on detailed Ecological Footprint and biological capacity assessments. Land Use Policy 2004, 21, 231–246. [Google Scholar] [CrossRef]
  33. Wackernagel, M.; Monfreda, C.; Schulz, N.B.; Erb, K.-H.; Haberl, H.; Krausmann, F. Calculating national and global ecological footprint time series: Resolving conceptual challenges. Land Use Policy 2004, 21, 271–278. [Google Scholar] [CrossRef]
  34. Wackernagel, M.; Monfreda, C.; Moran, D.; Wermer, P.; Goldfinger, S.; Deumling, D.; Murray, M. National Footprint and Biocapacity Accounts 2005: The Underlying Calculation Method; Global Footprint Network: Oakland, CA, USA, 2005; p. 33. [Google Scholar]
  35. Wackernagel, M.; Lewan, L.; Hansson, C.B. Evaluating the Use of Natural Capital with the Ecological Footprint: Applications in Sweden and Subregions. Ambio 1999, 28, 604–612. [Google Scholar]
  36. Kitzes, J.; Galli, A.; Wackernagel, M.; Goldfinger, S.; Bastianoni, S. A ‘Constant Global Hectare’ Method for Representing Ecological Footprint Time Trends. Available online: http://www.brass.cf.ac.uk/uploads/fullpapers/Kitzes_M66.pdf (accessed on 6 June 2018).
  37. Turner, K.; Lenzen, M.; Wiedmann, T.; Barrett, J. Examining the global environmental impact of regional consumption activities, Part 1: A technical note on combining input-output and ecological footprint analysis. Ecol. Econ. 2007, 62, 37–44. [Google Scholar] [CrossRef]
  38. Lin, D.; Iha, K.; Neill, E.; Hanscom, L.; Evans, M.; Murthy, A.; Martindill, J.; Wackernagel, M. Quantifying the Ecological Footprint of countries by individual consumption category: The Consumption Land Use Matrix (CLUM). 2018; in press. [Google Scholar]
  39. Mancini, M.S.; Galli, A.; Niccolucci, V.; Lin, D.; Bastianoni, S.; Wackernagel, M.; Marchettini, N. Ecological Footprint: Refining the carbon Footprint calculation. Ecol. Indic. 2016, 61, 390–403. [Google Scholar] [CrossRef]
  40. Mancini, M.S.; Galli, A.; Niccolucci, V.; Lin, D.; Hanscom, L.; Wackernagel, M.; Bastianoni, S.; Marchettini, N. Stocks and flows of natural capital: Implications for Ecological Footprint. Ecol. Indic. 2017, 77, 123–128. [Google Scholar] [CrossRef]
  41. Mancini, M.; Evans, M.; Iha, K.; Danelutti, C.; Galli, A.; Mancini, M.S.; Evans, M.; Iha, K.; Danelutti, C.; Galli, A. Assessing the Ecological Footprint of Ecotourism Packages: A Methodological Proposition. Resources 2018, 7, 38. [Google Scholar] [CrossRef]
  42. Weinzettel, J.; Steen-Olsen, K.; Hertwich, E.G.; Borucke, M.; Galli, A. Ecological footprint of nations: Comparison of process analysis, and standard and hybrid multiregional input–output analysis. Ecol. Econ. 2014, 101, 115–126. [Google Scholar] [CrossRef]
  43. Galli, A.; Iha, K.; Halle, M.; El Bilali, H.; Grunewald, N.; Eaton, D.; Capone, R.; Debs, P.; Bottalico, F. Mediterranean countries’ food consumption and sourcing patterns: An Ecological Footprint viewpoint. Sci. Total Environ. 2017, 578, 383–391. [Google Scholar] [CrossRef] [PubMed]
  44. International Energy Agency World. CO2 Emissions from Fuel Combustion; Database Documentation; Organization for Economic: Paris, France, 2015. [Google Scholar]
  45. Ritchie, H.; Roser, M. Energy Production & Changing Energy Sources; Our World in Data; Island Press: Washington, DC, USA, 2018. [Google Scholar]
  46. Galli, A.; Kitzes, J.; Niccolucci, V.; Wackernagel, M.; Wada, Y.; Marchettini, N. Assessing the global environmental consequences of economic growth through the Ecological Footprint: A focus on China and India. Ecol. Indic. 2012, 17, 99–107. [Google Scholar] [CrossRef]
  47. United Nations Development Programme. 2016 Human Development Report; United Nations Development Programme: New York, NY, USA, 2016. [Google Scholar]
  48. Wilting, H.C.; Schipper, A.M.; Bakkenes, M.; Meijer, J.R.; Huijbregts, M.A.J. Quantifying Biodiversity Losses Due to Human Consumption: A Global-Scale Footprint Analysis. Environ. Sci. Technol. 2017, 51, 3298–3306. [Google Scholar] [CrossRef] [PubMed]
  49. Food and Agriculture Organization of the United Nations (FAO). The State of World Fisheries and Aquaculture; Food and Agriculture Organization of the United Nations: Rome, Italy, 2014; pp. 3–93. [Google Scholar]
  50. Verones, F.; Moran, D.; Stadler, K.; Kanemoto, K.; Wood, R. Resource footprints and their ecosystem consequences. Sci. Rep. 2017, 7, 40743. [Google Scholar] [CrossRef] [PubMed] [Green Version]
  51. Venter, O.; Sanderson, E.W.; Magrach, A.; Allan, J.R.; Beher, J.; Jones, K.R.; Possingham, H.P.; Laurance, W.F.; Wood, P.; Fekete, B.M.; et al. Sixteen years of change in the global terrestrial human footprint and implications for biodiversity conservation. Nat. Commun. 2016, 7, 1–11. [Google Scholar] [CrossRef] [PubMed]
  52. Butchart, S.H.M.; Walpole, M.; Collen, B.; van Strien, A.; Scharlemann, J.P.W.; Almond, R.E.A.; Baillie, J.E.M.; Bomhard, B.; Brown, C.; Bruno, J.; et al. Global Biodiversity: Indicators of Recent Declines. Science 2010, 1187512. [Google Scholar] [CrossRef] [PubMed]
  53. D’Odorico, P.; Frankel Davis, K.; Rosa, L.; Carr, J.A.; Chiarelli, D.; Dell’Angelo, J.; Gephart, J.; MacDonald, G.K.; Seekell, D.A.; Suwels, S.; et al. Environmental Policy Analysis The Global Food-Energy-Water Nexus. Rev. Geophys. 2018, 56. [Google Scholar] [CrossRef]
  54. United Nations, Department of Economic and Social Affairs, Population Division. World Population Prospects: The 2017 Revision, Key Findings and Advance Tables; United Nations, Department of Economic and Social Affairs, Population Division: New York, NY, USA, 2017. [Google Scholar]
  55. Niccolucci, V.; Pulselli, F.M.; Tiezzi, E. Strengthening the threshold hypothesis: Economic and biophysical limits to growth. Ecol. Econ. 2007, 60, 667–672. [Google Scholar] [CrossRef]
  56. Bastianoni, S.; Niccolucci, V.; Neri, E.; Cranston, G.; Galli, A.; Wackernagel, M. Sustainable Development: Ecological Footprint in Accounting. Encycl. Environ. Manag. 2013, 2467–2481. [Google Scholar] [CrossRef]
  57. Galli, A.; Halle, M.; Grunewald, N. Physical limits to resource access and utilisation and their economic implications in Mediterranean economies. Environ. Sci. Policy 2015, 51, 125–136. [Google Scholar] [CrossRef]
  58. Rudolph, A.; Figge, L. Determinants of Ecological Footprints: What is the role of globalization? Ecol. Indic. 2017, 81, 348–361. [Google Scholar] [CrossRef]
  59. Ulucak, R.; Lin, D. Persistence of policy shocks to Ecological Footprint of the USA. Ecol. Indic. 2017, 80, 337–343. [Google Scholar] [CrossRef]
  60. Charfeddine, L.; Mrabet, Z. The impact of economic development and social-political factors on ecological footprint: A panel data analysis for 15 MENA countries. Renew. Sustain. Energy Rev. 2017, 76, 138–154. [Google Scholar] [CrossRef]
  61. Wilson, E.O. Half-Earth: Our Planet’s Fight for Life; Liveright Publishing Corporation: New York, NY, USA, 2016; ISBN 978-1-63149-082-8. [Google Scholar]
  62. Wackernagel, M.; Hanscom, L.; Lin, D. Making the Sustainable Development Goals Consistent with Sustainability. Front. Energy Res. 2017, 5. [Google Scholar] [CrossRef] [Green Version]
  63. Search Results of “National Footprint Accounts” in Google Scholar. Available online: https://scholar.google.com/scholar?hl=en&as_sdt=1%2C5&as_ylo=2013&q=%22National+Footprint+Accounts%22 (accessed on 7 September 2018).
  64. Search Results of “Ecological Footprint” in Google Scholar. Available online: http://scholar.google.com/scholar?hl=en&as_sdt=1%2C5&as_ylo=2013&q=Ecological+footprint (accessed on 7 September 2018).
  65. Meltwater. Available online: www.meltwater.com (accessed on 28 August 2018).
  66. Collins, A.; Galli, A.; Patrizi, N.; Pulselli, F.M. Learning and teaching sustainability: The contribution of Ecological Footprint calculators. J. Clean. Prod. 2018, 174, 1000–1010. [Google Scholar] [CrossRef]
  67. Wackernagel, M.; Galli, A.; Borucke, M.; Lazarus, E.; Mattoon, S. Ecological footprint accounting. In Globalisation, Economic Transition and the Environment: Forging a Path to Sustainable Development; Lawn, P., Ed.; Edward Elgar Publishing: Cheltenham, UK, 2013; ISBN 978-1-78195-141-5. [Google Scholar]
  68. Abdullatif, L.; Alam, T. UAE Ecological Footprint Initiative; WWF-EWS: Abu Dhabi, UAE, 2011. [Google Scholar]
  69. Galli, A.; Đurović, G.; Hanscom, L.; Knežević, J. Think globally, act locally: Implementing the sustainable development goals in Montenegro. Environ. Sci. Policy 2018, 84, 159–169. [Google Scholar] [CrossRef]
  70. United Nations Development Programme. National Human Development Report, Montenegro: Resource Efficiency and Sustainable Human Development; United Nations Development Programme: Podgorica, Montenegro, 2014. [Google Scholar]
  71. Global Footprint Network; United Nations Development Programme. Resource Constraints and Economic Performance in Eastern Europe and Central Asia; Report to UNDP Bratislava; United Nations Development Programme: Bratislava, Slovakia, 2011. [Google Scholar]
  72. United Nations. Conference of Parties to the Convention on Biological Diversity Indicators for the Strategic Plan for Biodiversity 2011–2020 and the Aichi Biodiversity Targets. In Proceedings of the Thirteenth Meeting, Cancun, Mexico, 2–17 December 2016; p. 24. [Google Scholar]
  73. Intergovernmental Science-Policy Platform on Biodiversity and Ecosystem Services (IPBES) Core indicators. Available online: https://www.ipbes.net/core-indicators (accessed on 8 September 2018).
  74. WWF France; Global Footprint Network. L’Autre Deficit de la France; WWF France: Le Pré St Gervais, France, 2018; p. 28. [Google Scholar]
  75. Boev, P.; Burenko, D.; Shvarts, E.; Diep, A.; Hanscom, L.; Iha, K.; Kelly, R.; Martindill, J.; Wackernagel, M.; Zokai, G. Ecological Footprint of the Russian Regions; WWF Russia: Moscow, Russia, 2016; p. 112. [Google Scholar]
  76. WWF. Living Planet Report 2016: Risk and Resilience in a New Era; WWF International: Gland, Switzerland, 2016. [Google Scholar]
  77. WWF Korea; Global Footprint Network. Korea Ecological Footprint Report 2016: Measuring Korea’s Impact on Nature; WWF Korea: Seoul, Korea, 2016; p. 28. [Google Scholar]
  78. Gaodi, X.; Shuyan, C.; Qisen, Y.; Lin, X.; Zhiyong, F.; Ying, G.; Lin, D.; Kelly, R.; Liqiang, G.; Humphrey, S. Living Planet Report, China 2015: Development, Species and Ecological Civilization; WWF China: Beijing, China, 2015; p. 82. [Google Scholar]
  79. United Nations Environment Programme Finance Initiative; Global Footprint Network. A New Angle on Sovereign Credit Risk, E-RISC: Environmental Risk Integration in Sovereign Credit Analysis; UNEP: Toronto, ON, Canada, 2012; p. 40. [Google Scholar]
  80. United Nations Environment Programme Finance Initiative; Global Footprint Network. ERISC PHASE II: How Food Prices Link Environmental Constraints to Sovereign Credit Risk; UNEP: Toronto, ON, Canada, 2016; p. 28. [Google Scholar]
  81. Burns, S.; Alexeyev, J.; Kelly, R.; Lin, D. Carbon Disclosure and Climate Risk in Sovereign Bonds; Global Footprint Network: Oakland, CA, USA, 2016. [Google Scholar]
  82. Baabou, W.; Grunewald, N.; Ouellet-Plamondon, C.; Gressot, M.; Galli, A. The Ecological Footprint of Mediterranean cities: Awareness creation and policy implications. Environ. Sci. Policy 2017, 69, 94–104. [Google Scholar] [CrossRef]
  83. Isman, M.; Archambault, M.; Racette, P.; Konga, C.N.; Llaque, R.M.; Lin, D.; Iha, K.; Ouellet-Plamondon, C.M. Ecological Footprint assessment for targeting climate change mitigation in cities: A case study of 15 Canadian cities according to census metropolitan areas. J. Clean. Prod. 2018, 174, 1032–1043. [Google Scholar] [CrossRef]
  84. OECD Stat National Accounts: 5. Final Consumption Expenditure of Households. Available online: https://stats.oecd.org/Index.aspx?DataSetCode=SNA_TABLE5 (accessed on 8 September 2018).
Figure 1. World Ecological Footprint (red) and biocapacity (green) per person from 1961 to 2014, for the NFA 2012, 2013, 2015, 2016, 2017, and 2018 editions.
Resources 07 00058 g001
Figure 2. Germany’s Ecological Footprint (red) and biocapacity (green) per person from 1961 to 2014, for NFA 2012, 2013, 2015, 2016, 2017, and 2018 editions.
Resources 07 00058 g002
Figure 3. Ecological Footprint of the world by Footprint type from 1961 to 2014, from the 2018 NFA edition. Ecological Footprint values are represented by ‘Number of Earths’, a metric that divides the Ecological Footprint by the global biocapacity available to each person in the world in 2014. A horizontal line is drawn at 1 Earth to illustrate global trends in ecological overshoot.
Resources 07 00058 g003
Figure 4. Map of countries with biocapacity deficits (red) and reserves (green) in 2014 [18].
Resources 07 00058 g004
Figure 5. (a) Total and (b) per capita Ecological Footprint trends in billions of global hectares (gha) from 1961 to 2014 by world region.
Resources 07 00058 g005
Figure 6. Percent variance from 1961 to 2014 of total Ecological Footprint (solid red), per capita Ecological Footprint (dashed red), total biocapacity (solid green), per capita biocapacity (dashed green), and population (black) for regions and the world. Variance is measured with respect to 1961, where 1961 equals 100%.
Resources 07 00058 g006
Figure 7. Ecological Footprint in relation to the Human Development Index (HDI) [47] of all countries, grouped by region. The shaded blue box represents the Global Sustainable Development Quadrant, the area where countries have both high levels of human development and globally sustainable resource demands.
Resources 07 00058 g007
Table 1. Changes in Ecological Footprint values and biocapacity values of the total and individual Footprint components from the National Footprint Accounts (NFA) 2012 to 2018 editions, using data year 2008 as a reference.
(a) Ecological Footprint, gha (per capita)
EditionYearCroplandGrazing LandForestsFishing GroundsBuilt-Up LandCarbonTotal
NFA 201220080.5970.2300.2640.1040.0681.4142.676
NFA 201320080.5730.2300.2660.0980.0631.4162.646
NFA 201520080.5690.2160.2750.0860.0701.4352.650
NFA 201620080.5820.1680.2790.0900.0641.6742.857
NFA 201720080.5540.1680.2790.0900.0611.6952.847
NFA 201820080.5420.1580.2790.0900.0601.7152.844
Change from NFA 2012–20182008−0.056−0.0710.015−0.014−0.0080.3010.167
(b) Biocapacity, gha (per capita)
EditionYearCroplandGrazing LandForestsFishing GroundsBuilt-Up LandTotal
NFA 201220080.5760.2300.7560.1570.0681.787
NFA 201320080.5730.2300.7560.1570.0631.780
NFA 201520080.5690.2160.7660.1540.0701.773
NFA 201620080.5820.2280.7770.1620.0641.813
NFA 201720080.5540.2270.7760.1620.0611.780
NFA 201820080.5420.2270.7760.1620.0601.767
Change from NFA 2012–20182008−0.034−0.0020.0200.004−0.008−0.020
Table 2. The impact of each major accounting improvement on the Ecological Footprint of countries. The first column is the average percent change in Ecological Footprint of all countries for each improvement, and the latter two columns indicate the maximum and minimum percent change across all countries.
ImprovementAverage (%)Maximum (%)Minimum (%)
Average forest-carbon sequestration13.128.90.3
“Other CO2” allocation to countries2.09.30.0
Feed commodities2.034.20.0
Equivalence factors 1.01.30.0
Marginal crop-yield factors0.423.6–6.5
Footprint of fishing grounds0.14.4−0.4
Fish list–2.910.5–32.6

