Article

The Impact of Pay-As-You-Throw Schemes on Municipal Solid Waste Management: The Exemplar Case of the County of Aschaffenburg, Germany

by
Juergen Morlok
1,
Harald Schoenberger
2,3,
David Styles
2,4,
Jose-Luis Galvez-Martos
2,5,* and
Barbara Zeschmar-Lahl
6
1
County of Aschaffenburg, Aschaffenburg D-63739, Germany
2
E3 Environmental Consultants Ltd, Aberdeen AB118DY, UK
3
Institut für Siedlungswasserbau, Wasserguete- und Abfallwirtschaft, Universitaet Stuttgart, Stuttgart D-70569, Germany
4
School of Environment, Natural Resources and Geography, Bangor University, Bangor, LL572UW, UK
5
School of Engineering, University of Aberdeen, King’s College, Old Aberdeen, Aberdeen AB243UE, UK
6
BZL Kommunikation und Projektsteuerung GmbH, Oyten D-28876, Germany
*
Author to whom correspondence should be addressed.
Resources 2017, 6(1), 8; https://doi.org/10.3390/resources6010008
Submission received: 2 November 2016 / Revised: 19 January 2017 / Accepted: 23 January 2017 / Published: 8 February 2017

Abstract

:
The “pay-as-you-throw” (PAYT) scheme is an economic instrument for waste management that applies the “polluter pays” principle by charging the inhabitants of municipalities according to the amount of residual, organic, and bulky waste they send for third-party waste management. When combined with well-developed infrastructure to collect the different waste fractions (residual waste, paper and cardboard, plastics, bio waste, green cuttings, and many recyclables) as well as with a good level of citizens’ awareness, its performance has frequently been linked to an increase in the collection rates of recyclables. However, the establishment and operation of PAYT systems can require significant resource inputs from municipalities. In this paper, PAYT is analysed through a case study from the German County of Aschaffenburg, covering nearly 20 years of implementation across 32 municipalities with 173,000 inhabitants. Key performance indicators include temporal trends in the county’s recyclables collection rate, waste treatment fees for residents, and municipal waste management costs, benchmarked against German municipalities not implementing PAYT. We conclude that PAYT could make an important contribution towards material reuse and recycling objectives for the new circular economy.

1. Introduction

1.1. Fundamentals of Pay-As-You-Throw

Waste management policies include a range of complementary measures such as regulatory, economic, educational, and informative instruments [1,2]. The aim of an economic instrument is to persuade waste producers to divert waste from landfill or incineration towards material recovery, in order to optimise the use of resources while contributing to the costs of the waste management service. Economic instruments are implemented through national or regional waste policies, such as waste disposal taxes (landfill tax, incineration tax, product levies, etc.), waste pricing (unit based, differential rates, variable rates, pay as you throw, etc.), deposit refund schemes, extended producer responsibility, tradable permits, recycling subsidies, value-added tax (VAT) exemptions for repair and recycling activities, etc. Most of these measures fall outside the scope of local governments.
However, in the context of municipal solid waste management, the “Pay-As-You-Throw” (PAYT) approach (also known as unit pricing [3] and differential and variable rate or variable fee charge systems [1,2]) is an economic instrument that applies the “polluter pays” principle at the municipal level by charging inhabitants according to the amount of waste they send for third party management [4]. Technical implementation of the PAYT approach is based on the following three pillars: identification of the waste generator, measurement of the amount of waste sent for treatment, and unit pricing, e.g., per kg and/or per emptying. The experience gained so far reveals that the waste fee should not only depend on the amount of waste generated, but should be comprised of both a basic and a variable (service-based) fee [5]. On the one hand, this reflects the cost structure of waste disposal, which consists of fixed and variable costs [6], and, on the other hand, the inclusion of a fixed (basic) fee helps to avoid illegal disposal practices which can increase if fees are only levied on collected waste quantities [7,8]. Figure 1 shows the conventional structure of a waste fee, wherein single component fees refer to charges based only on weight.
The PAYT approach means that a substantial part of the overall fee is allocated according to the amount of waste collected in order to motivate waste prevention and recovery. Against this background, the PAYT approach can be implemented in different ways [7] depending on the waste accounting method:
-
Per user identifier:
Volume-based accounting
Weight-based accounting
-
Per bin identifier (individually or collectively assigned bins)
Volume-based accounting (identification system)
Weight-based accounting
-
Pre-paid systems
Pre-paid sack
Tag, sticker, or token
The most common forms of PAYT schemes are volume-based schemes (choice of container size); sack-based schemes (number of sacks set out for collection); weight-based schemes (the weight of the waste collected in a given container); and frequency-based schemes (the frequency with which a container is set out for collection) [9]. This last approach can be combined with volume- and weight-based schemes. Common volume-based schemes, in which citizens pay for a specific size of container, may result in payments not corresponding with weight because containers are often only partially filled upon collection. The pre-paid sack system is commonly considered to be a volume-based system, although sacks are usually filled so that the volume and weight of a sack is relatively constant in relation to the fee paid per sack.

1.2. The County of Aschaffenburg

The County of Aschaffenburg consists of 32 municipalities and has about 173,000 inhabitants and a population density of 247 inhabitants per km2. Until the early 1990s, untreated waste was landfilled. As the landfill neared its capacity limit, a new site was sought. However, public acceptance of a new landfill was very low, resulting in protests. As a consequence, the county was forced to develop new options to divert waste from landfill, and introduced the separate collection of plastic waste in 1990, the incineration of residual waste in a neighbouring county, the separate collection of wood waste in 1994, increased fees to reduce commercial waste, a reduced collection frequency for bulky waste (to twice per year), and separate bio waste collection in 1994/1995 with a trial in the municipality of Stockstadt [10]. Thus, the county switched from waste disposal by landfilling to waste management with the target of preventing and recycling waste. Following initial trials during 1994 to 1996 in the municipality of Stockstadt, the county rolled out a PAYT system in 1997. This system has been working ever since, and today, the County of Aschaffenburg has one of the highest recorded rates of recyclables collection (86%) and one of the lowest recorded rates of residual waste generation (55 kg per capita per year (kg·cap−1·yr−1)). The success of the PAYT system in the County of Aschaffenburg is replicated in other Germany counties (e.g., the County of Landsberg am Lech, the County of Schweinfurt, the County of Calw, the County of Heidenheim, and about 75% of the municipalities in the County of Wetterau), in Italy [11,12,13], and in Belgium [14]. However, its early adoption and the availability of a long data time series on waste management performance makes the County of Aschaffenburg an excellent PAYT case study and benchmark, as described in this paper.

1.3. PAYT as a Best Environmental Management Practice

A best environmental management practice, BEMP, is defined by the European Commission Regulation EC No. 1221/2009 on Eco-Audit and Management Schemes (EMAS) [15], article 2 point 14, as the “most effective way to implement the environmental management system by organisations in a relevant sector and that can result in best environmental performance under given economic and technical conditions”. A BEMP should minimise the environmental impact of organisational operations in a technically feasible and economically viable manner that is widely applicable across relevant organisations. In this context, a benchmark of excellence is defined as the performance of frontrunners implementing best practice, whereas key performance indicators are used to report the performance of BEMPs and to quantify benchmarks of excellence. In the case of PAYT schemes, two key performance indicators are proposed.
-
Collection rate of recyclable materials (%). This indicator is frequently reported as “recycling rate”, but, given the amount of rejects from existing sorting and recycling plants, the term recyclables collection rate is preferred to avoid its misinterpretation. PAYT schemes are designed to increase the amount of recovered recyclable materials from municipal solid waste, so their implementation should increase values for this indicator.
-
Residual waste (kg·cap−1·yr−1). This is the amount of waste that the system user disposes in the residual waste bin. For practical recording reasons, this definition excludes the amount of waste rejected in recycling or sorting plants from the separately collected recyclable waste fraction(s) or illegally disposed waste.
During the elaboration of a background report for the European Commission on best environmental management practices for the waste management sector in Europe [16], we concluded that, under certain conditions, PAYT is a BEMP and that the performance of the system in Aschaffenburg represented a benchmark of excellence. Specifically, we concluded that BEMP is a PAYT system comprised of a weight-based door-to-door collection of residual, organic, and bulky waste. The successful implementation of an efficient PAYT system requires well-developed infrastructure to collect different fractions of recyclable waste in a convenient manner for citizens, either in individual bins outside their homes or in conveniently located centralized or mobile collection points. Materials that must be catered for include paper/cardboard/board, organic waste, packaging waste, glass containers, ferrous metals, non-ferrous metals, end-of-life electrical and electronic equipment, refrigerators and other white goods, waste plastic, pure waste polystyrene, waste wood, green cuttings, non-commercial construction and demolition waste, waste tyres, exhausted printer cartridges, waste vegetable fat, waste textiles and shoes, cork, CDs/DVDs, etc. Awareness raising is also a key element for effective PAYT implementation; informed citizens understand and support the scheme. All the practices necessary to assure successful implementation of PAYT are described in the background report on best environmental management practices for the waste management sector prepared for the European Commission [16].
Past studies have shown that pre-paid sack schemes achieve good performance [1], but that volume-based systems using varying bin sizes achieve comparatively poor performance in terms of waste prevention and recycling [1,9]. The highest recycling rates and lowest residual waste quantities are achieved with weight-based systems when they are accompanied by well-developed infrastructure and supported by waste-aware citizens. This is the case in Aschaffenburg, which we now report in more detail as a best practice case study.

1.4. Aim

While PAYT is well known and has been implemented in many municipalities around Europe during the last ten years, there is a lack of detailed case studies published in the literature. To address this gap, we describe the 20-year implementation of PAYT in the County of Aschaffenburg, providing full disclosure on the initial aims, operational details, environmental performance, and economic aspects. The primary intention of this paper is to demonstrate successful implementation of PAYT as a best practice under specific conditions of applicability, acknowledging that PAYT is not always the most appropriate option depending on pre-existing infrastructure and public awareness.

2. Implementation of the System

The County of Aschaffenburg implements a weight-based collection of residual waste, bio waste, and bulky waste, as well as the separate collection of paper from all households. In nearly all of its 32 municipalities the County operates collection centres (also known as “container parks” or “civic amenity sites”) to separately collect recyclable waste fractions such as glass and metals, and the County composts green cuttings. In addition, woody fractions are sent to biomass-fired power plants, residual waste is incinerated according to Best Available Technique (BAT) standards, bio waste is anaerobically digested, and subsidies are provided to households for home composting and for using re-usable nappies, and to households with incontinent persons.
The motivation for introducing a weight-based charging system for residual and bio waste collection centered on fairness (user and polluter pays principles) for domestic users (commercial and industrial enterprises were excluded), the need to introduce new bins with wheels to facilitate manual handling as per Directive 90/269/EEC [17], the introduction of centralized billing by the county in 1994 (previously carried out by municipalities), high incineration costs, limited composting capacity for bio waste, and ecological considerations.
Initiation of the Aschaffenburg PAYT system required considerable effort to acquire and process data for billing, accounting, and system optimisation purposes. The data collection and processing scheme employed is illustrated in Figure 2. All bins and containers need to be coded and collection trucks are equipped with a reading device and a weighing device. Data are transferred to a central facility via telemetry in real time, where processing, accounting, and the billing of end users occurs. Aschaffenburg also uses the collected data to measure the economic efficiency of the system and to optimise the logistics of the system.
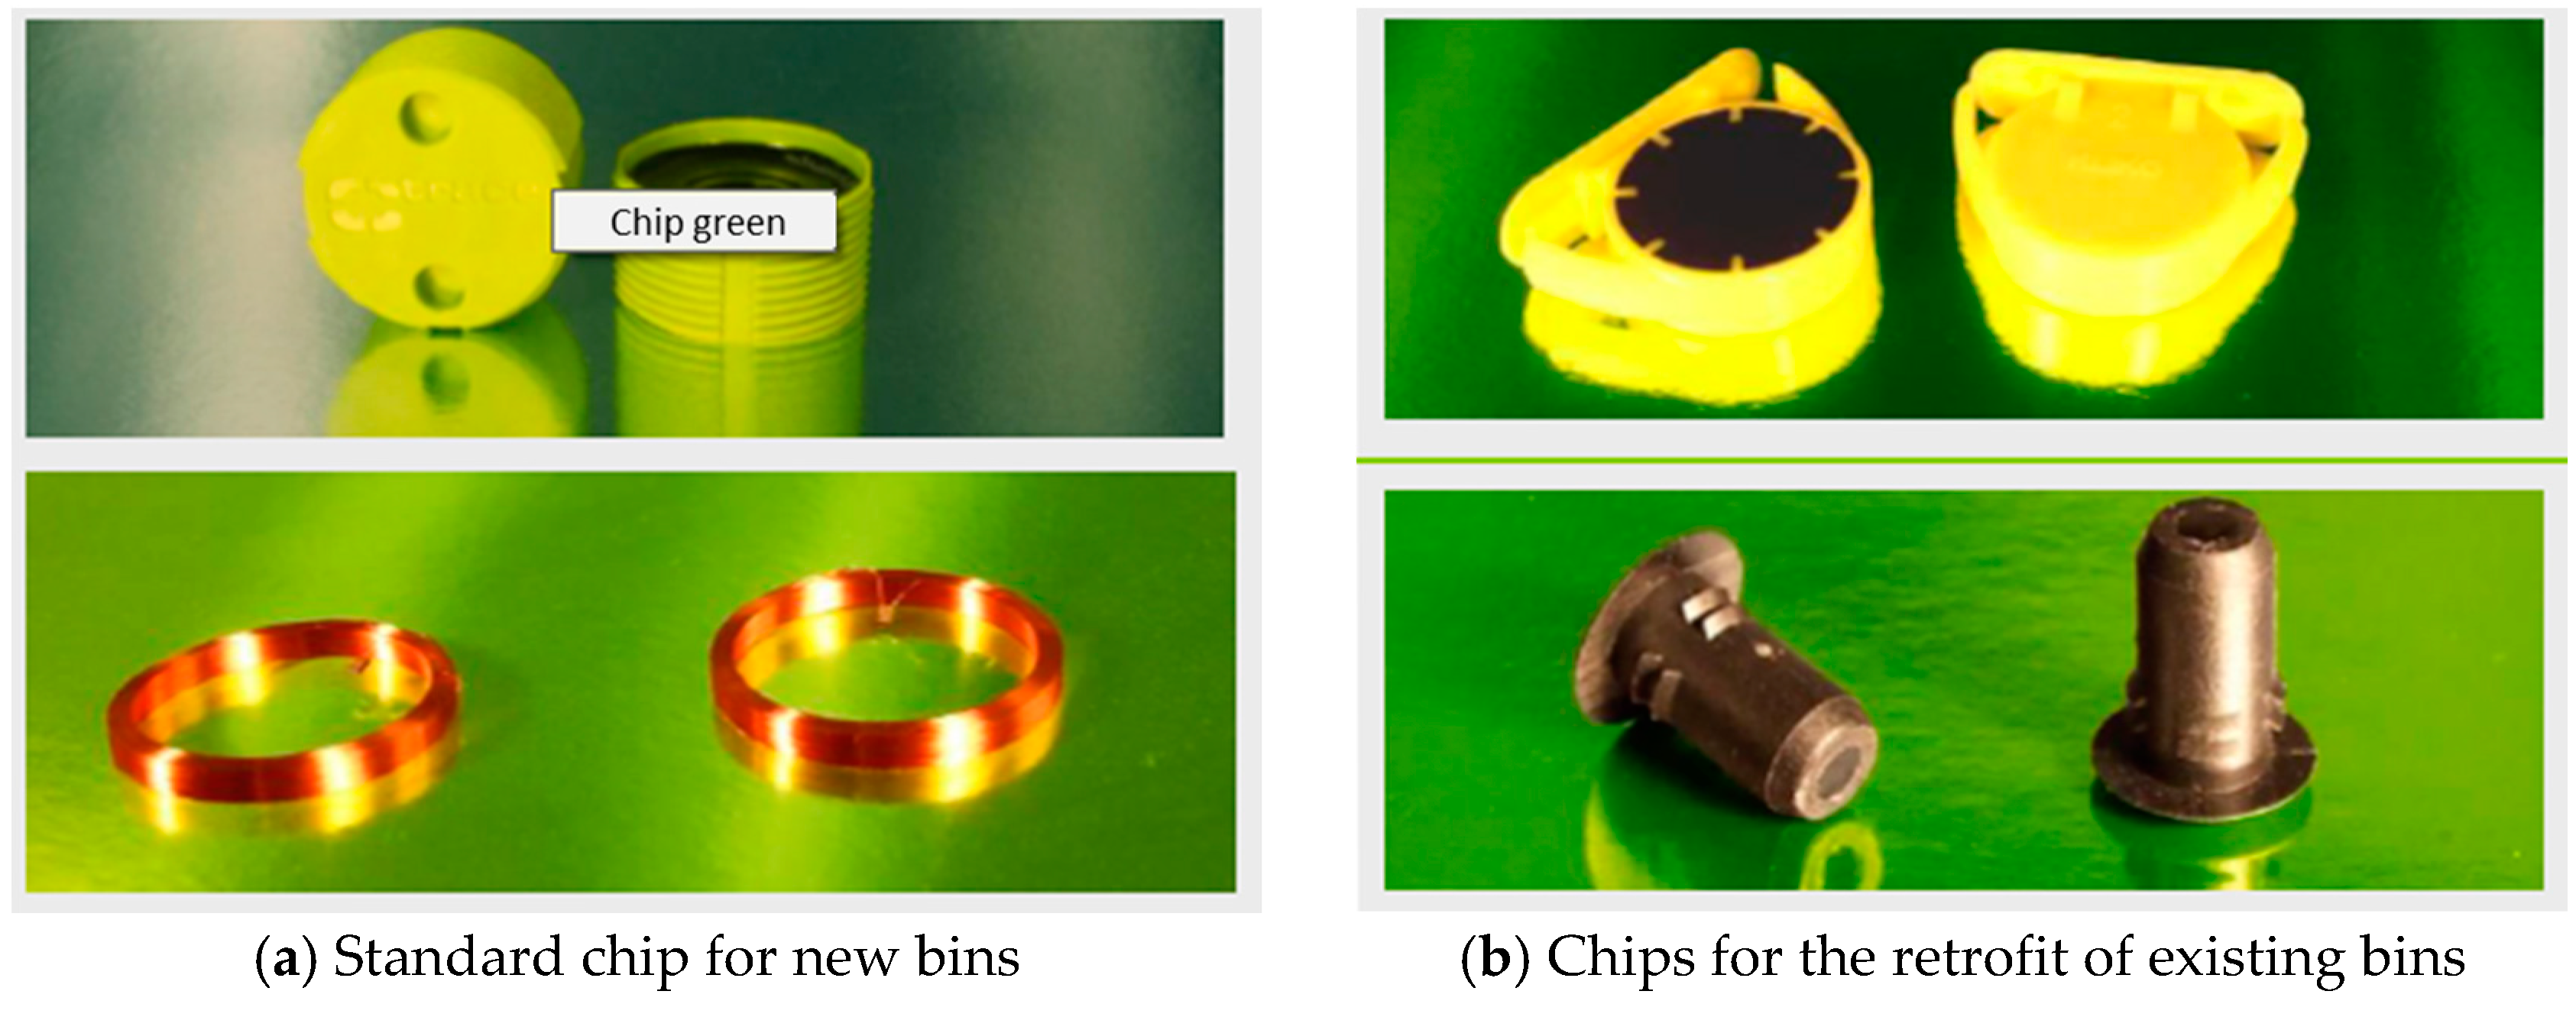
All waste bins are equipped with a chip that can be read by a transponder, whereas the bar code reader (see Figure 3) is only for the delivery and return of the bins. An example of a bar code is given in Figure 3 and examples of the chips are shown in Figure 4. For densely populated areas and high-rise buildings, access to container systems is restricted to assigned users. The owner or operator of high-rise buildings can opt for 1100 L containers for the whole community or for individual bins for each household in the building. The choice would always depend on the available space for individual containers. The experience in Aschaffenburg is that high-rise buildings with individual bins produce significantly less waste compared to buildings with large shared bins. In the case of shared bins, locks for bins are an optional service offered by the County and are intended to avoid misuse of bins by unauthorized users.
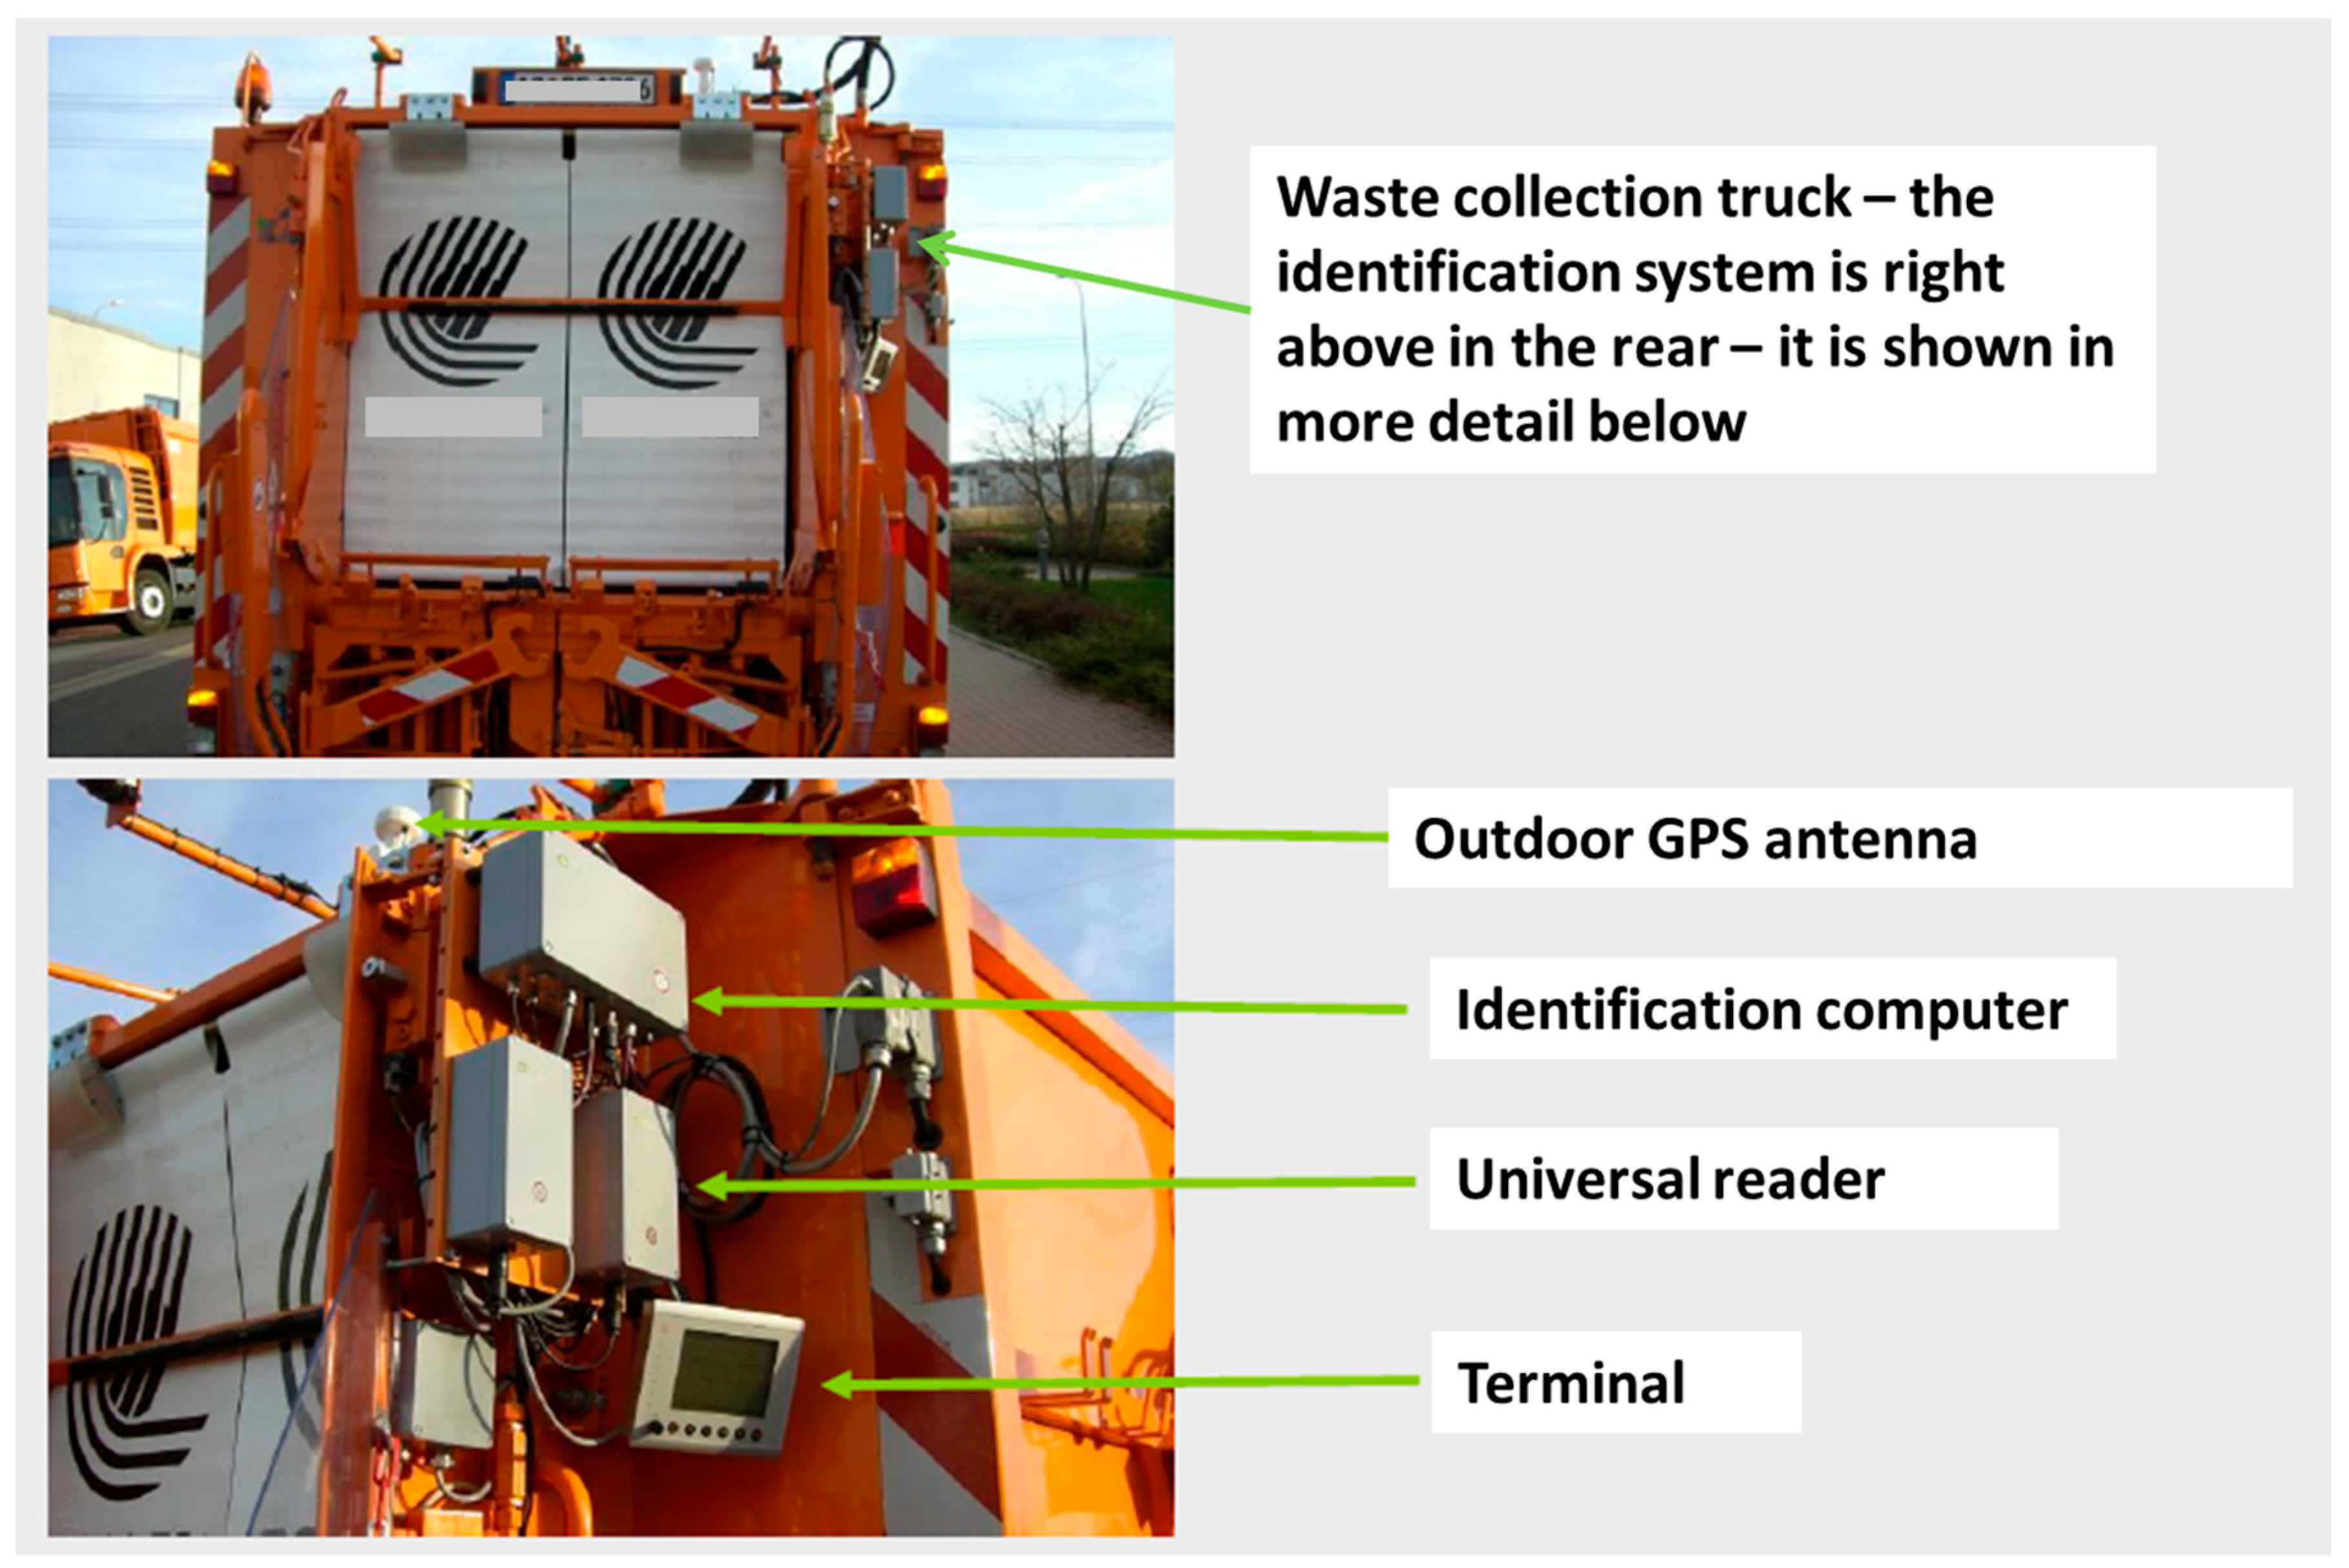
Figure 5 shows a waste collection truck that is equipped with a waste identification system and a weighing system, requiring frequent maintenance and calibration owing to vibrations during operation of the truck. Experience shows that increased maintenance costs are compensated by the increased rates of collection for recyclable fractions.
The benefits arising from the implementation of a weight-based PAYT system are dependent on the existence of well-developed infrastructure to separately collect and process the multitude of separated waste fractions, including residual waste, paper/cardboard, glass, plastics, and bio waste, collected directly from citizens’ homes, and on the provision of convenient collection centres to receive various other fractions (e.g., green cuttings, demolition waste, bulky waste, etc.). Also, socioeconomic factors and environmental awareness appear to be important for PAYT success within a specific locality. PAYT may increase the risk of illegal dumping, although this did not occur in Aschaffenburg [19].

3. Results

3.1. Environmental Performance

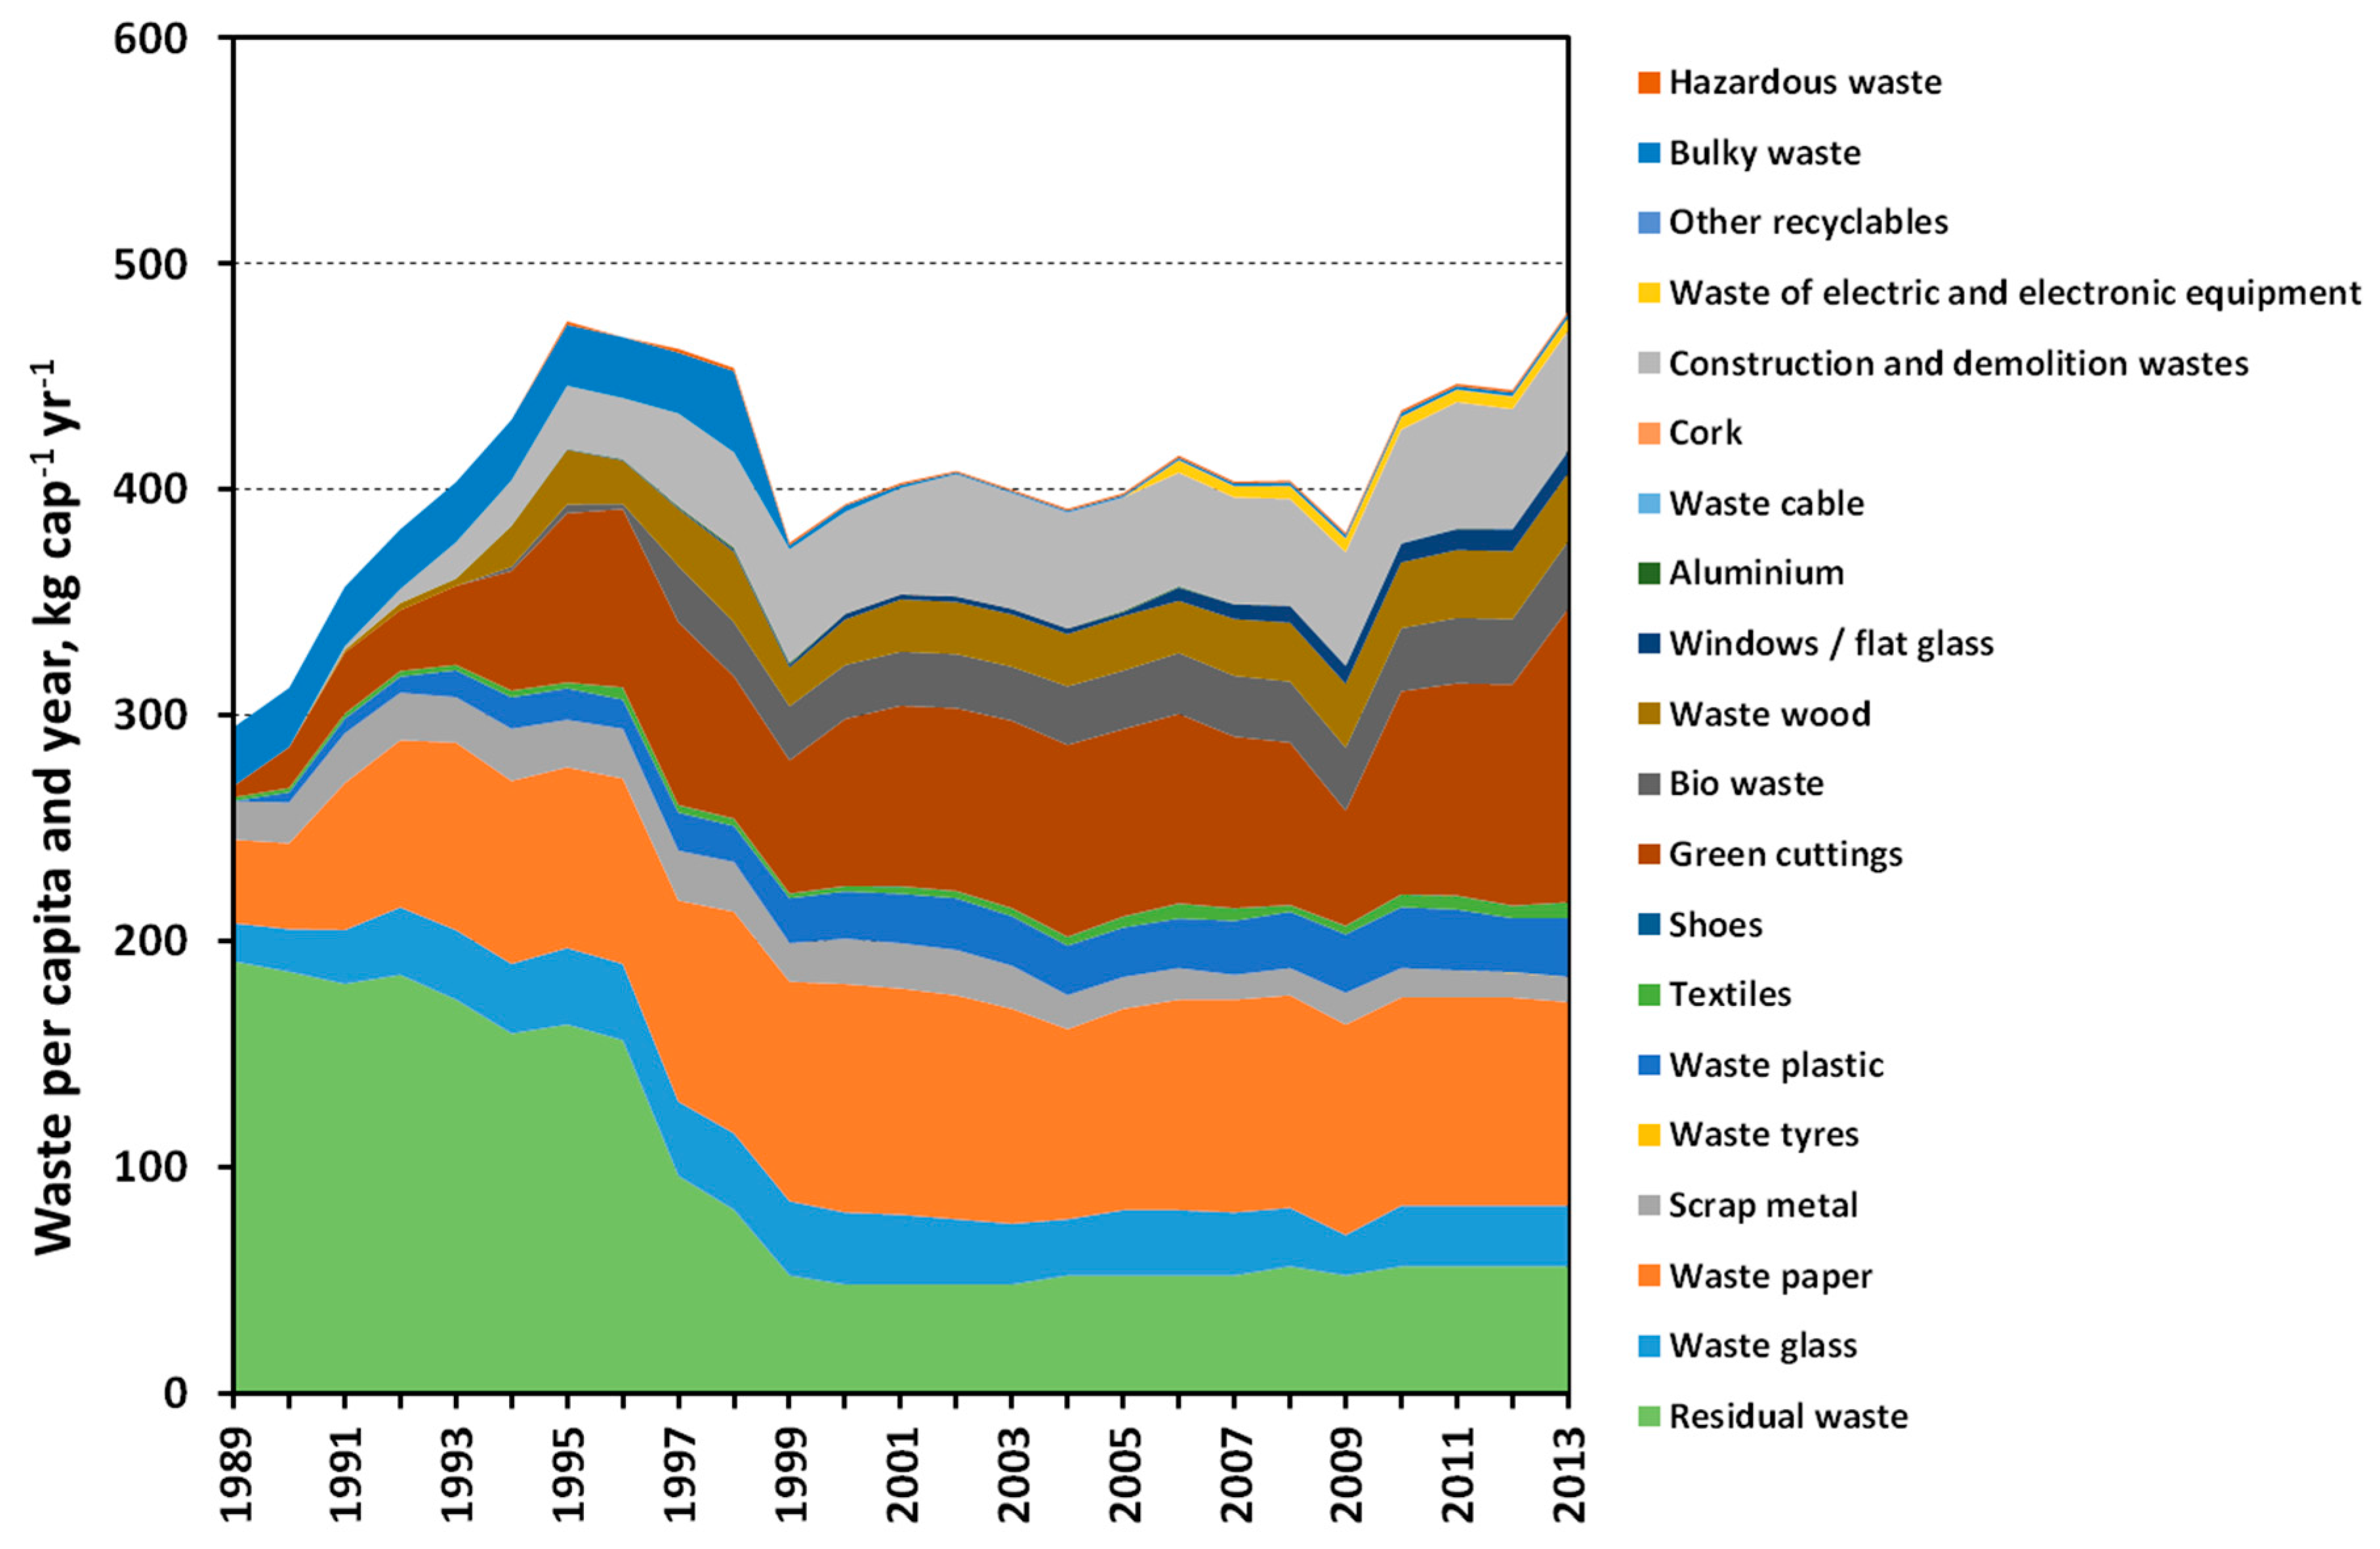
Figure 6 clearly illustrates the drastic change in waste management performance within the county. The introduction of a weight-based PAYT system across Aschaffenburg in 1997 was followed by a significant increase in the collection of recyclable waste and a large decrease in residual waste disposal (Figure 6). The county achieved an overall collection rate for recyclables of up to 86% [19], which is a significant improvement on the average performance of PAYT systems, with typical recycling rates of around 70% [7]. The 86% recycling rate in Aschaffenburg is considered to be a benchmark of excellence for the waste management sector. The main differentiating factors in this specific case are:
-
the use of a weighing system
-
provision of an extensive infrastructure for the collection of recyclable waste streams (see Table 1)
-
a high level of environmental awareness and active support from the citizens
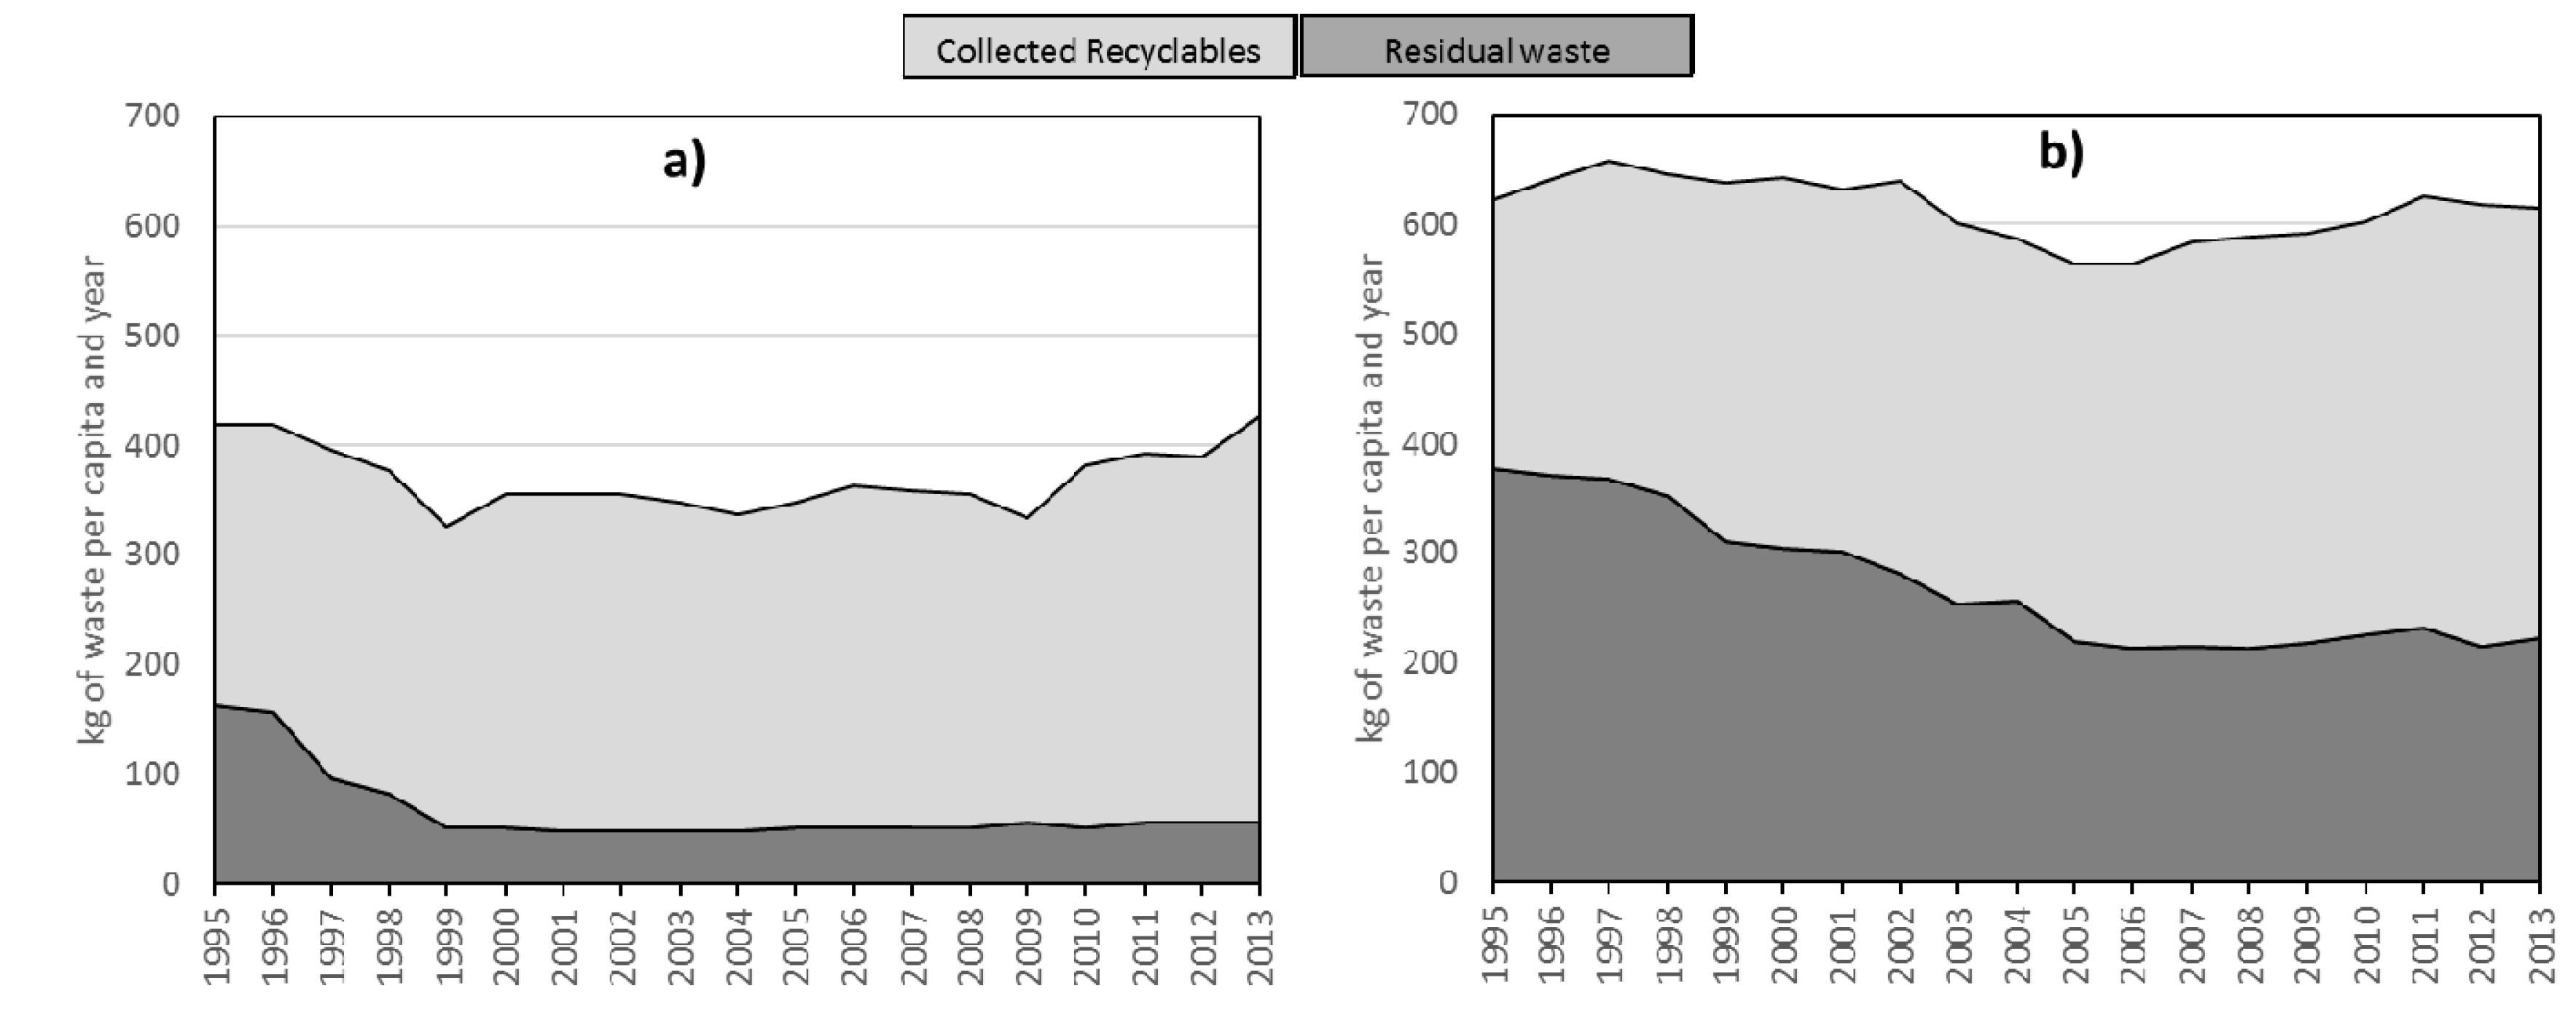
Figure 7 visualises the change in quantities of residual waste and total waste (disposed plus separately collected recyclable waste) on a per capita basis from 1995 to 2013 for the County of Aschaffenburg and for Germany overall. In 2013, the amount of residual waste arising in Aschaffenburg was 55 kg per capita per year, compared with 165 kg in 1995 and 220 kg·cap−1·yr−1 for Germany overall (down from 380 kg in 1995). The timing and magnitude of the decrease in residual waste in Aschaffenburg strongly suggest that the implementation of PAYT was a major driving force. However, the influences of other mechanisms implemented at local level, such as awareness raising and the development of better infrastructure for waste sorting and recycling, will also have been significant and were not an inherent component of PAYT per se. In any case, the stabilisation of residual waste quantities at a low level confirms the enduring effect of PAYT and associated infrastructure, given that initial awareness raising activities following PAYT implementation were not sustained. It is important to remark that, as with many other best practices in waste management, it is not possible to isolate the impact of a single technique from accompanying measures implemented simultaneously. Nonetheless, the specific case of Aschaffenburg is striking in the magnitude and immediacy of the impact following PAYT implementation, making it an outstanding exemplar of (probable) PAYT performance. Comparison with the German average performance over the same period indicates that wider socioeconomic conditions and societal awareness of waste management may have made a small contribution to reduced residual waste quantities in County Aschaffenburg.
The total waste generated and the residual waste quantities were considerably smaller for Aschaffenburg than for Germany overall in 1995, before PAYT had been introduced. In order to estimate the “PAYT effect” in terms of residual waste avoidance, we considered the period 1995 to 2000, during which PAYT was rolled out across Aschaffenburg—covering the large reduction (71%) in residual waste generation (Figure 7). Over the same period, German average residual waste quantity declined by 19%. We assumed that residual waste generation in Aschaffenburg would have declined by an equivalent percentage under a counterfactual “business as usual (BAU)” scenario, against which the actual 1995 to 2000 reduction was benchmarked to estimate the additional PAYT effect (Table 2). Using this approach, we estimate that PAYT reduced residual waste by 84 kg·cap−1·yr−1 and significantly increased the separation (recycling) of paper and cardboard, mixed plastics, food waste, and construction materials (Table 2). Small reductions in the quantities of separated aluminium, glass, steel and iron, woody waste, textiles, and hazardous waste may reflect the reduced generation of these fractions (waste prevention), given that total waste generation declined from 475 to 387 kg·cap−1·yr−1 during the same period. In fact, the decrease in the residual waste fraction is 50 kg·cap−1·yr−1 greater than the sum of increased waste separation over the period (Table 2), implying that a significant proportion of residual waste reduction was attributable to waste prevention.
In order to estimate the greenhouse gas (GHG) savings associated with PAYT implementation, we conservatively reflected on only the following effects, using the quantities presented in the last column of Table 2; the reduction in residual waste incineration and the increased recycling rates of paper and cardboard, mixed plastics, food waste, and construction materials. We did not consider any waste prevention effect beyond this, in part owing to the difficulty of defining appropriate quantities and counterfactual fates of individual fractions (e.g., what happens to bulky wastes, green wastes, and woody residues not collected as waste?). Owing to lack of early data on commercial waste, we could not accurately represent any change in this waste stream. The composition of residual waste was based on residual waste composition recorded by the German waste management organisation Abfallzweckverband (AZV) Suedniedersachsen [23]. The AZV processes the residual and bulky wastes of the Counties of Goettingen, Northeim, and Osterode am Harz, and of the City of Goettingen, with about 490,000 inhabitants in total.
Net GHG savings from additional recycling were calculated by multiplying the additional quantities of each material recycled by (i) the respective emission factors for recycling (burdens) and (ii) the respective GHG emissions for avoided raw material production (credits) [24]. It was assumed that food waste recycling occurred via anaerobic digestion, which does not derive an avoided food production credit, but does derive an energy credit, calculated based on a net electricity output of 0.21 MJ/kg food waste [25,26] and a German electricity GHG intensity of 0.65 kg CO2e per kWh [23]. Net GHG savings from avoided waste incineration were calculated by multiplying the entire quantity incinerated by an incineration emission factor [24] and subtracting an energy credit to represent the substitution of grid electricity generation with electricity generated from the waste incineration plant, assuming a lower heating value (LHV) of 10 MJ/kg for municipal solid waste at 65% dry matter, 30% net energy conversion efficiency, and a German electricity GHG intensity of 0.65 kg CO2e per kWh [24]. GHG emissions arising from the extraction of the raw materials needed to replace incinerated materials were calculated by multiplying specific residual waste fractions [19] by embodied carbon factors [24]. To avoid double counting with additional recycling credits, and to reflect the apparent waste prevention component of residual waste reduction, these calculations were only made for the change in residual waste not already accounted for by the increase in separated fractions (Table 2). Figure 8 presents the resulting GHG savings, expressed per capita per year. Considering the aforementioned factors, we conservatively estimate that PAYT implementation reduced GHG emissions by 91 kg·CO2e·cap−1·yr−1. At the municipality level (173,000 inhabitants), this translates into a GHG saving of 15,716 tonnes CO2e per year.

3.2. Economic Implications

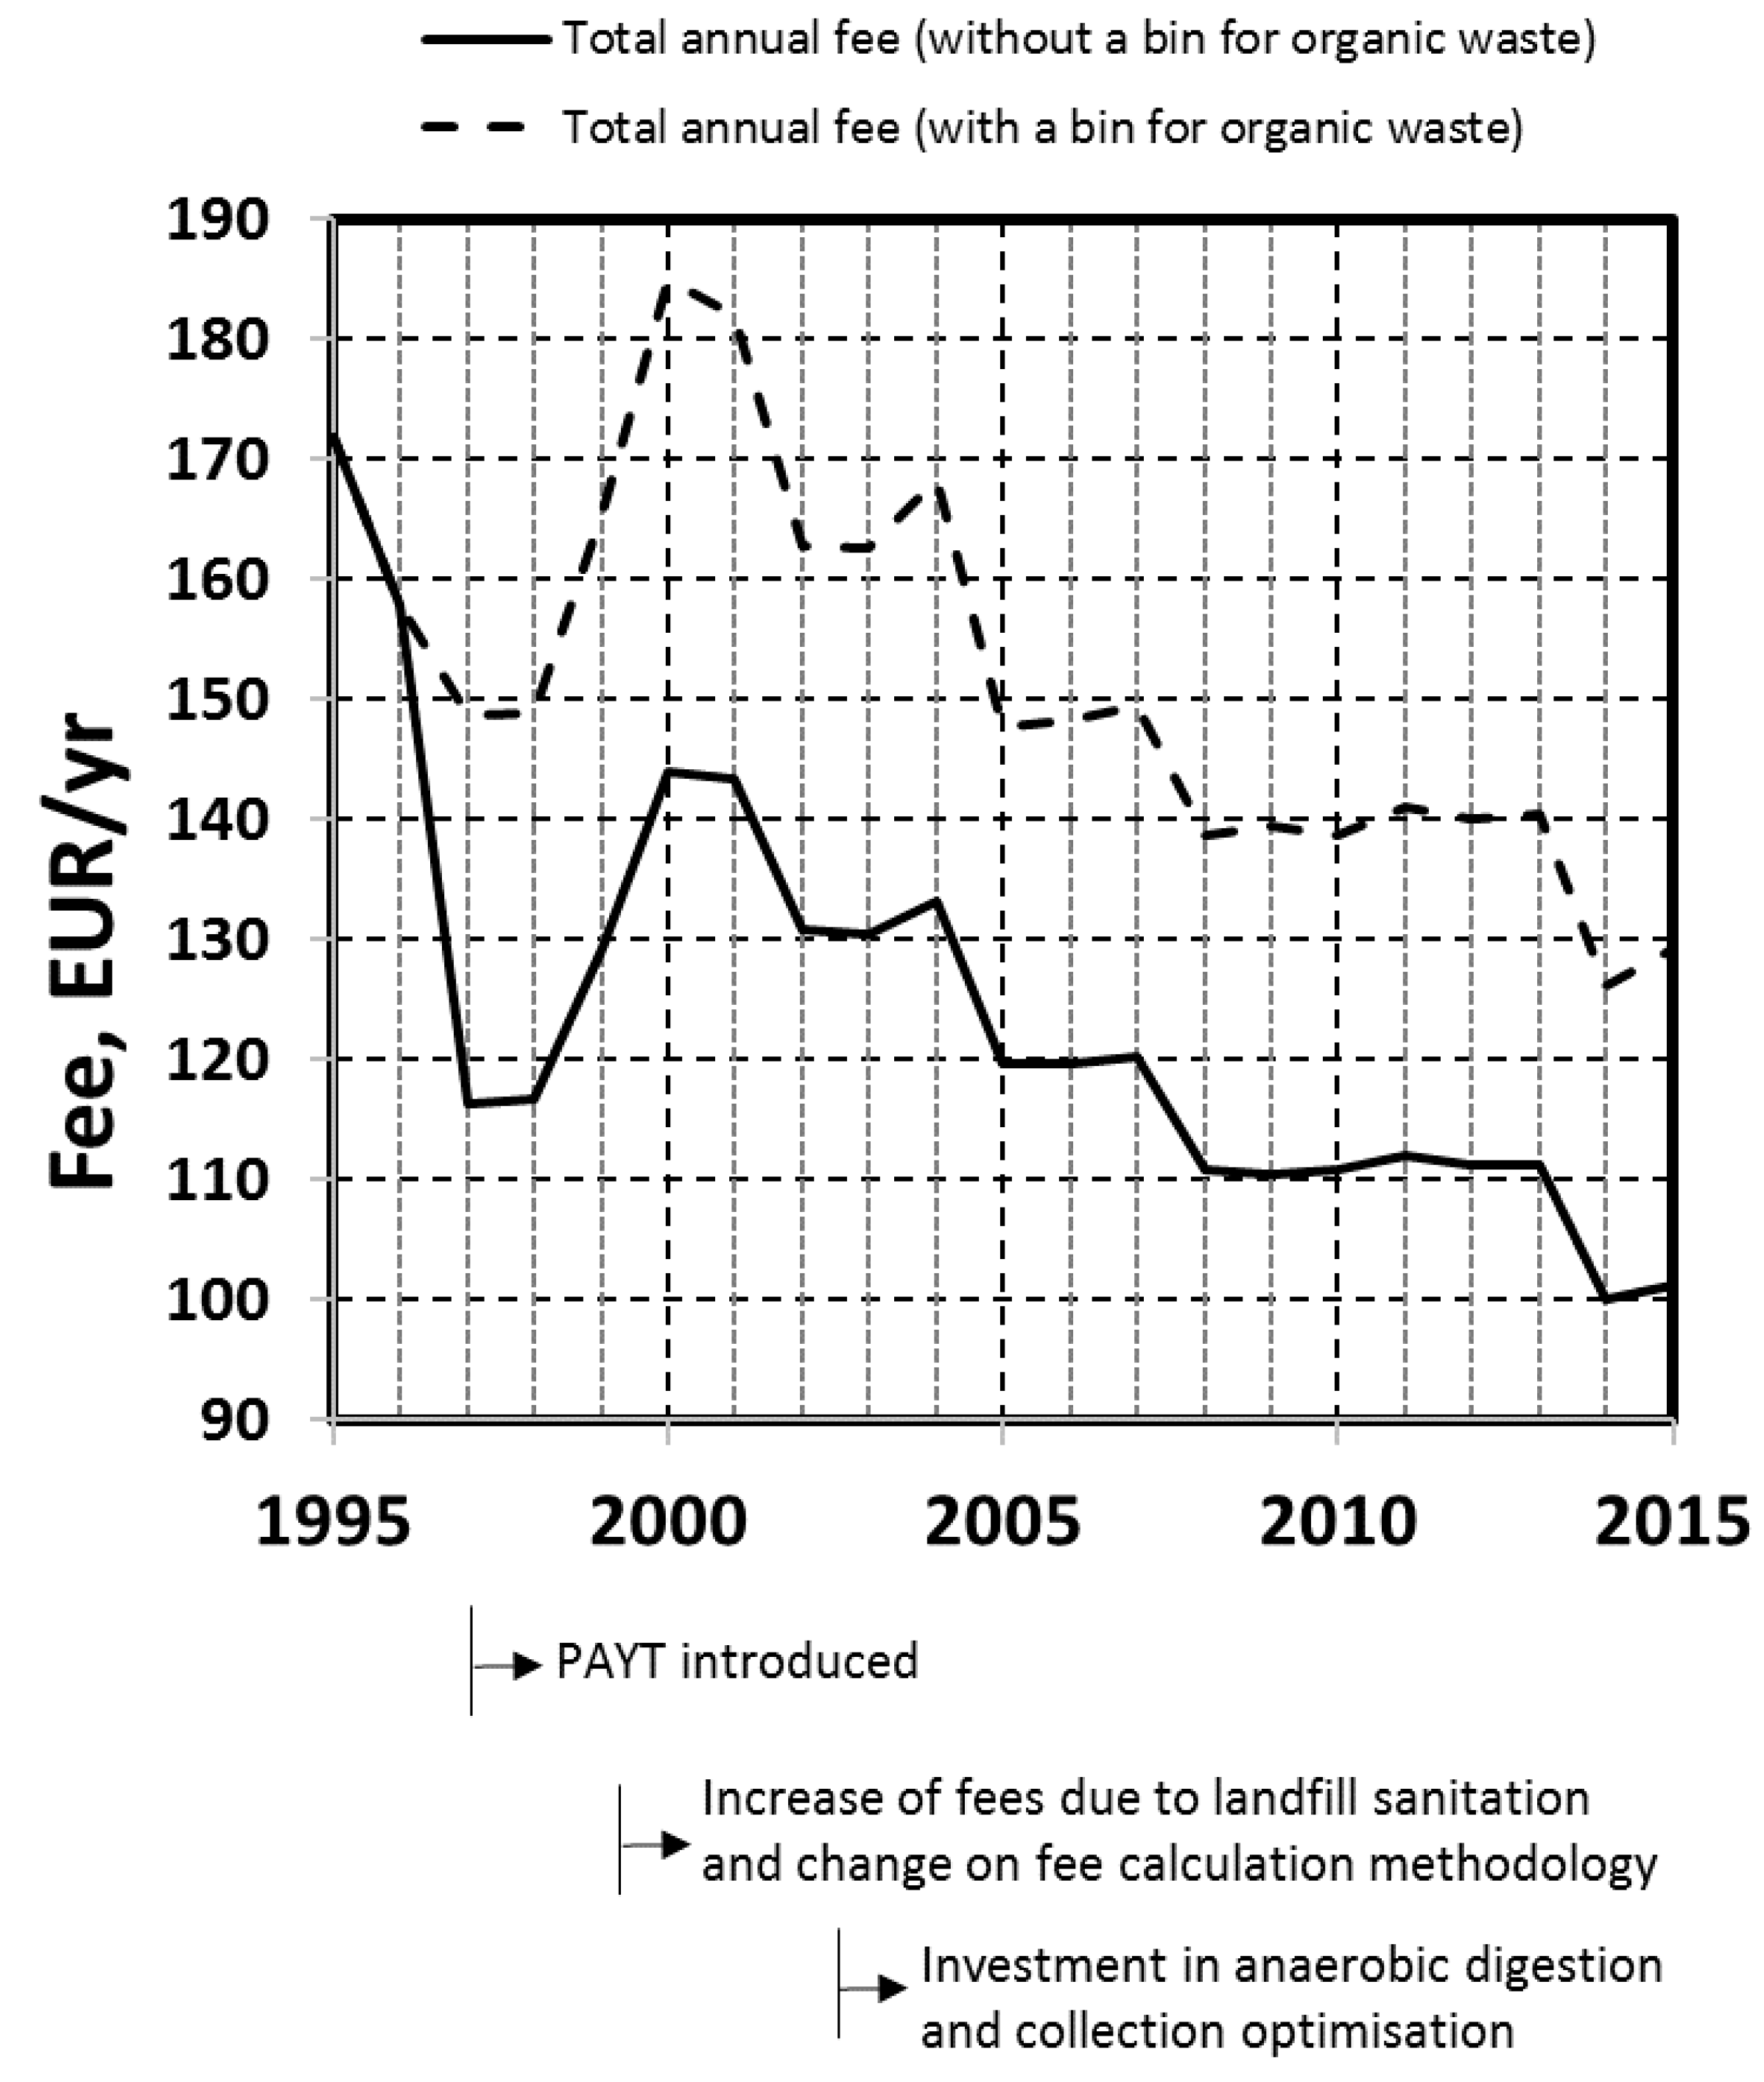
Waste fees before and after introducing the weight-based system in Aschaffenburg are publicly available [20,27]. In 2013, the waste management fee in Aschaffenburg was lower than the fee before 1997 (Figure 9)—despite the additional activities and equipment associated with PAYT implementation (including the separate collection of the different fractions, the erection of facilities to recycle or to recover waste streams, weighing equipment, etc.). This fee reduction proves that weight-based PAYT is not necessarily a more expensive waste management option than others, contrary to some studies [28]. However, waste management costs vary greatly from one municipality to another and over time, based on a multitude of factors. The sharp decrease in residual waste sent for incineration between 1994 and 1997 reduced the disposal cost by 46% (Figure 9), though incineration costs were particularly high at that time (EUR 232 t−1 in 1997, compared with EUR 103.60 t−1 in 2014). In 1999, the waste management fee had to be increased by 10%, as the management costs until that time had not considered the whole county. In 2000, there was another increase of 10% to pay for sanitation measures on the legacy landfill. But from 2002 to 2013, the fee significantly decreased by about 23%, even though the county further invested in the anaerobic digestion of bio waste, collection centres, weighed collection of green cuttings, and other measures. In 2015, the waste fee again decreased by 10%.
The fee in the County of Aschaffenburg consists of the basic fee, the collection fee (to empty the bins), and the weight fee. Between 1997 and 2012, the average fee breakdown changed as shown in Table 3.
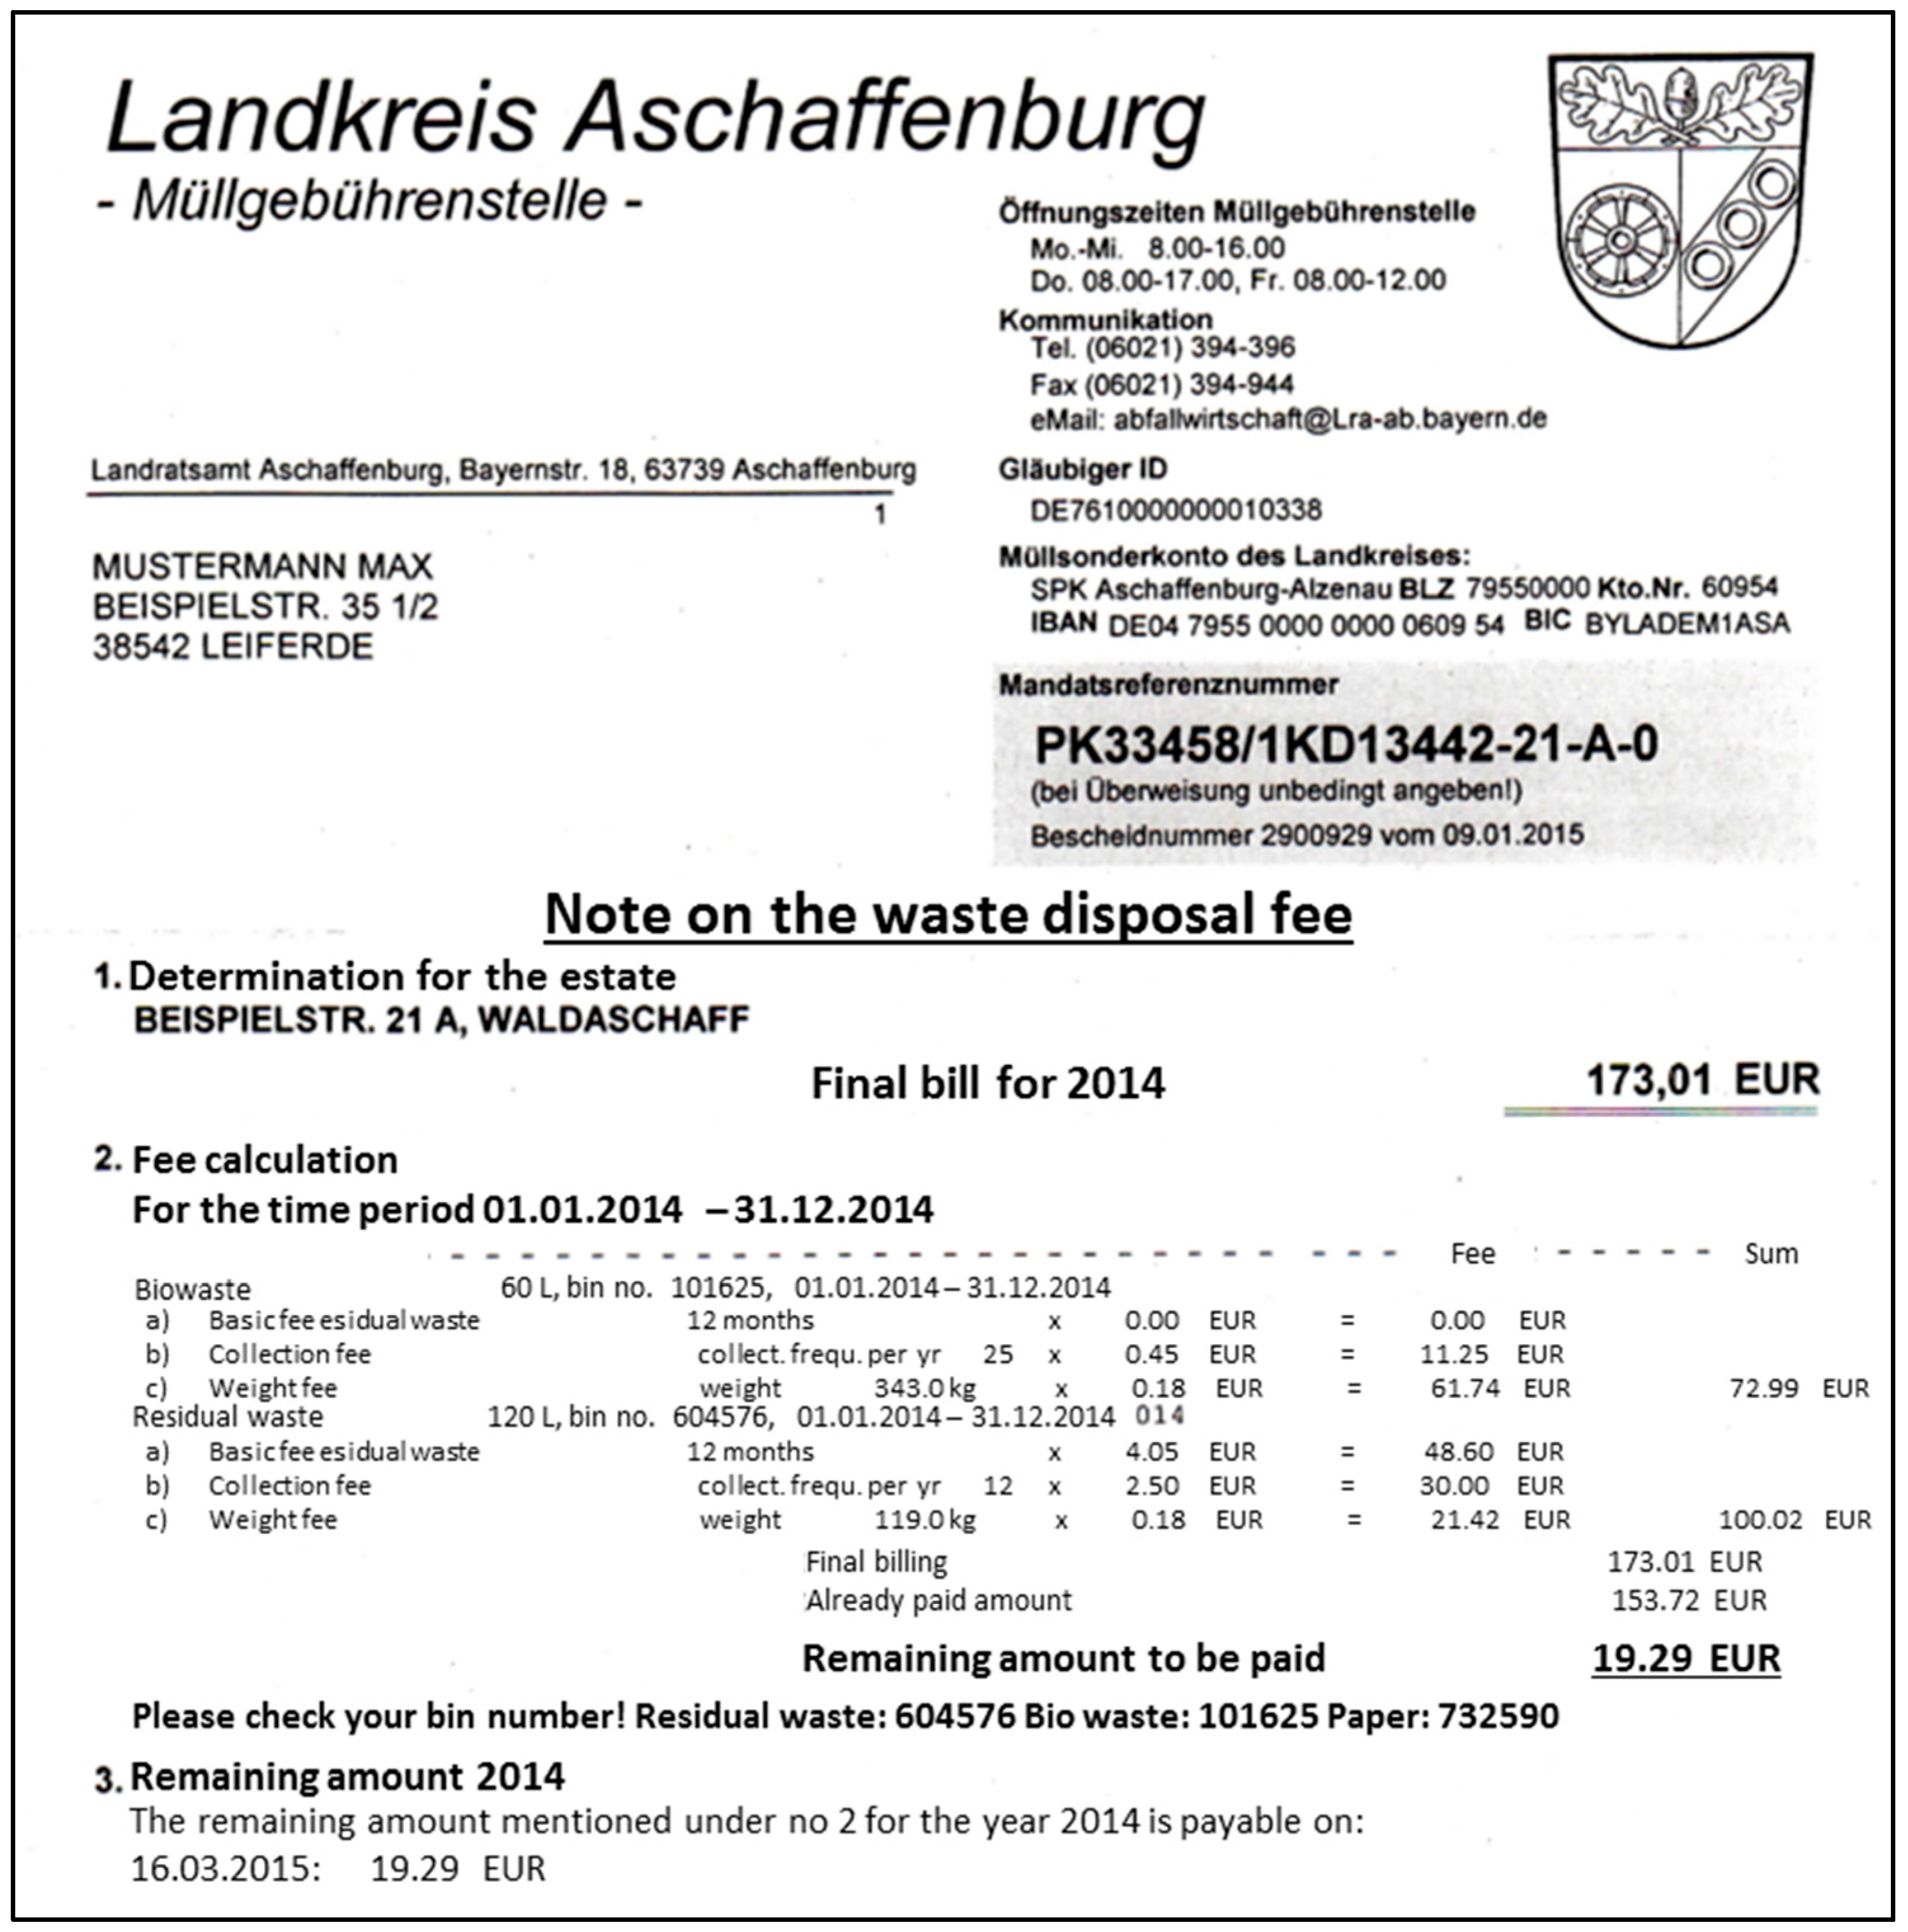
The percentage for the weight component decreased, but it still appears sufficient to motivate waste prevention/recycling. Figure 10 shows an example of the annual bill for a household in Aschaffenburg, indicating the basic fee, the service charge to collect the waste (collection fee) at a given frequency, and the weight fee, separated for residual waste and bio waste (at a basic fee of zero to encourage its separation).
When comparing waste management costs across municipalities or cities, it is best to compare so-called “unrecovered costs”, representing the difference between total costs and total revenues. These are the costs that usually have to be passed on to citizens in the form of annual waste fees. In the evaluation of total costs, the following costs are usually considered:
  • costs for collecting the different waste fractions (e.g., residual waste, bio waste, and paper)
  • costs for the treatment/disposal of residual waste (e.g., incineration) and the recycling/energy recovery of waste fractions, distinguishing between municipality-owned and third-party plants
  • costs for the operation, closure, and management of legacy landfills (leachate treatment, landscaping, etc.)
  • costs for staff and administration related to waste management
  • miscellaneous costs
In addition, the total costs can include the costs for services provided:
  • by private waste management companies on behalf of the municipality
  • by the municipality itself
  • by municipalities providing services for another municipality
In the evaluation of revenues from recycling/recovery activities, the following income streams can be considered:
  • selling electricity or/and heat from the incineration of refuse derived fuels, residual waste, and biogas from the anaerobic digestion of bio waste or from landfills
  • selling biogas from anaerobic digestion
  • selling separately collected or separated paper/cardboard
  • selling separately collected packaging
  • selling separately collected or separated scrap metal
  • selling compost
  • fees charged to businesses for waste collection and disposal
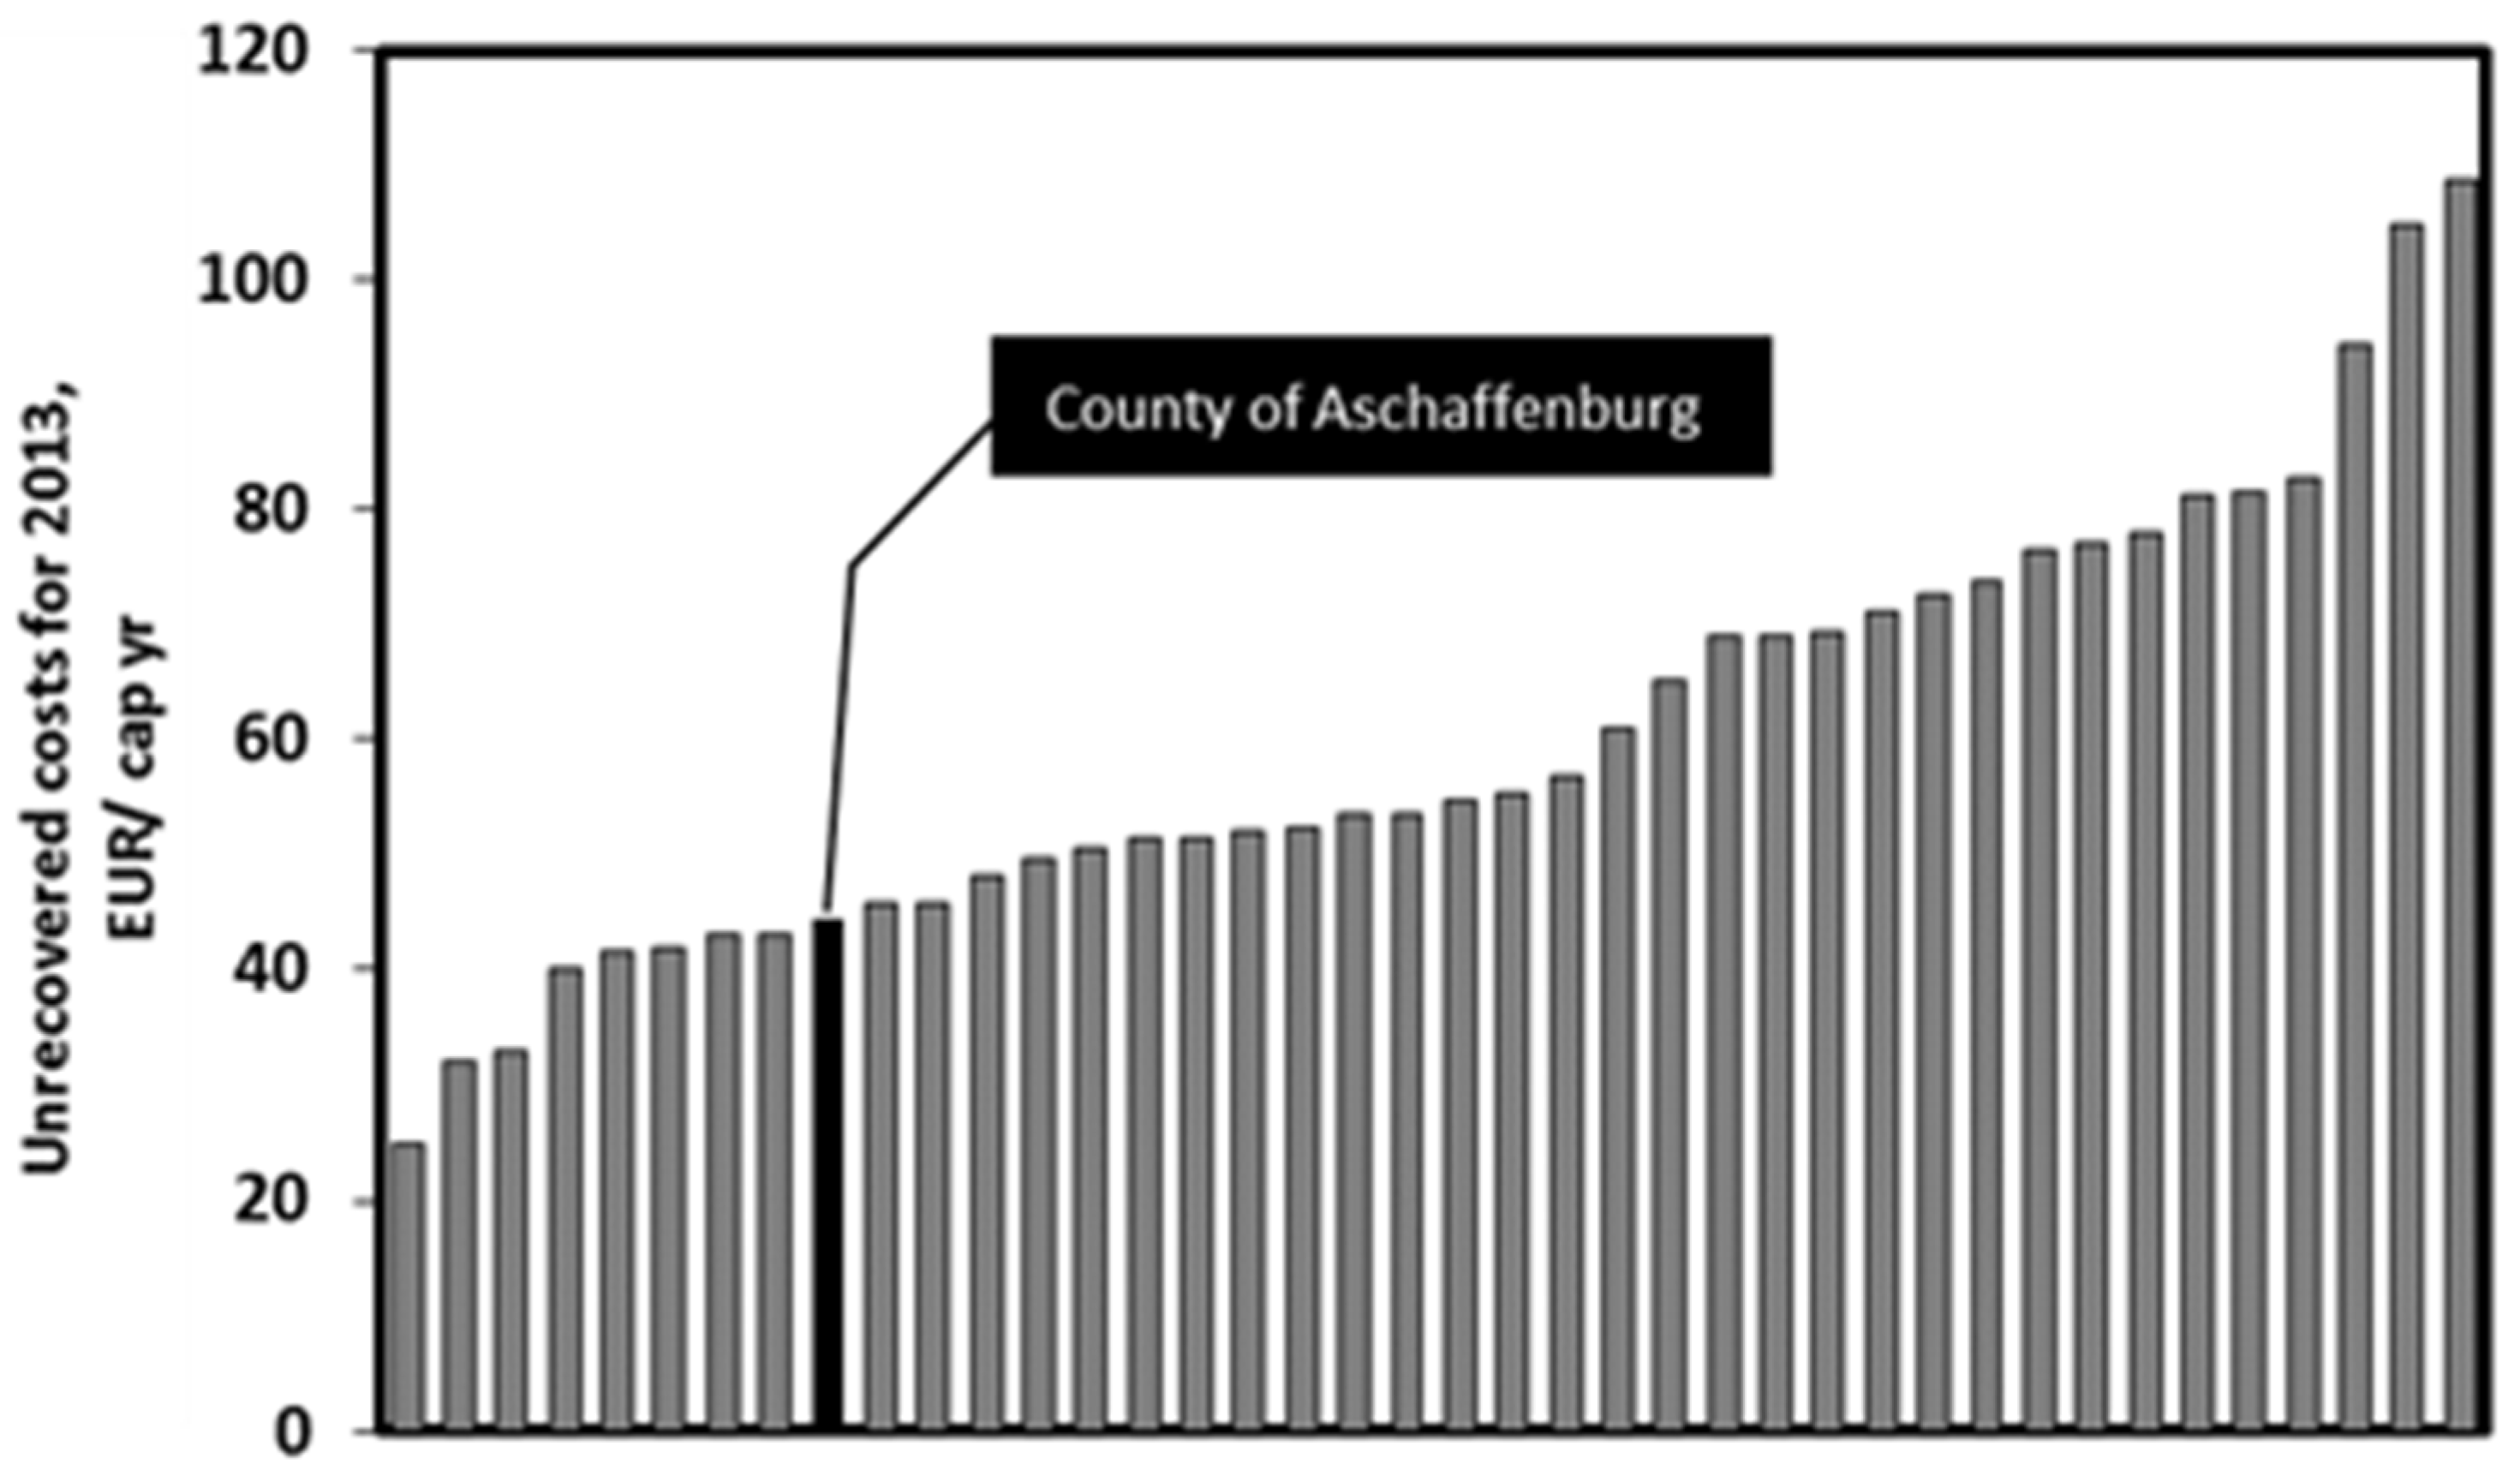
After the considerable efforts and measures implemented by the County of Aschaffenburg, the unrecovered costs are kept relatively low, compared with other counties and cities, at 44.5 EUR·cap−1·yr−1 in 2013 (Figure 11) [29]. Thus, high environmental performance is not necessarily associated with high unrecovered costs.

4. Discussion

The implementation of PAYT in the County of Aschaffenburg is representative of a best environmental management practice, as the weight-based system produced particularly high collection rates of recyclable materials. Improving the efficiency of recyclables separation and collection is a priority for member states of the European Union to comply with overarching targets to recycle 65% of municipal waste and 75% of packaging waste by 2030, according to new objectives in the proposed directive on waste [30]. The implementation of PAYT schemes, along with the development of appropriate infrastructure, awareness raising, and other Circular Economy policies, would help to achieve such demanding objectives. Other types of waste collection have so far failed to achieve the same levels of landfill diversion and waste recycling. For instance, the amount of residual waste produced in Germany per capita per year has been very stable for the last ten years. The widespread adoption of proven approaches such as PAYT is urgently required to further improve the efficiency of waste management [16].
It is acknowledged within Circular Economy policies that local waste management organisations are crucial to the realisation of ambitious waste recovery objectives. Some recent examples of PAYT implementation in Italy have been reported to have achieved high recycling rates and low residual waste quantities. In the Treviso region, a residual waste quantity of only 55 kg·cap−1·yr−1 was reported for 2015 [11,12], and, in the municipality of Trento, a residual waste quantity of 102 kg·cap−1·yr−1 was achieved [13]. In Flanders, Belgium, pre-paid sacks were used in a simplified weight-based PAYT system, significantly increasing the recycling rate to 71% and reducing the residual waste quantity to 149 kg·cap−1·yr−1 [14]. Pre-paid sack systems show a significant decrease in the quantity of residual waste, but the achievable figures are lower compared to optimum weight-based systems, such as that implemented in Aschaffenburg; i.e., 53.5% in Switzerland, 46% in the County of Schweinfurt (Germany), 44% in Ghent and Destelbergen (Belgium), and 38% in Torelles de Llobregat (Spain) [1]. The applicability of PAYT is likely to be affected by geographical considerations. For instance, in a country with a hot climate, the collection frequency for bio waste has to be higher for hygiene reasons, which may be associated with higher collection costs. However, in that case, if a high degree of bio waste separation is achieved, the collection frequency for residual waste would be lower, compensating partially for the increase of costs.
Under certain circumstances, the legislative framework is not compatible with the development of PAYT schemes. This particular case arises in the United Kingdom, where a debate continues about the applicability of PAYT at local level [31]. A well-studied alternative to PAYT in the UK that avoids legal barriers is the implementation of recycling incentive schemes. They consist of payments or rewards given to users to encourage people to recycle more, typically consisting of vouchers paid to individuals or communities, or waste management fee refunds paid back to individuals. The behavioural aspect is important here; while PAYT addresses a whole range of citizens with different awareness levels, recycling incentive schemes have the most impact on users with a high level of awareness, who act responsively and increase their recyclables collection rate accordingly [9]. For instance, Bracknell Forest increased the amount of recyclables collected by 91 kg·cap−1·yr−1 with a new incentive scheme that is popular among citizens and has improved public perceptions and acceptance of recycling. Other exemplary approaches have been demonstrated in The Netherlands, where recycling incentive schemes have reduced residual waste by 37% [16]. The experience gained with recycling incentive schemes shows that they can be considered a BEMP, due to their performance and costs, but cannot be benchmarked against PAYT due to their different scope and applicability.
Finally, in the example of the County of Aschaffenburg, it is remarkable that, despite the very low quantities of residual waste achieved, the implementation of PAYT did not appear to have a significant effect on the long-term total amount of waste generated and managed by the county. This has been recorded previously for other examples of PAYT. In other words, significant waste prevention cannot be achieved through PAYT implementation, but requires other policies developed at the national or regional level (e.g., product policies, waste prevention plans, and tax regulations [32]) and more targeted actions at the local level, such as awareness raising campaigns, reuse initiatives, second hand markets, repair cafes, etc.

Acknowledgments

The Joint Research Centre of the European Commission is acknowledged for the funding received through contract 154367 2014 A08 DE.

Author Contributions

J. Morlok is responsible for municipal waste management in the County of Aschaffenburg and has provided the data shown in the paper and provided feedback on the text. H. Schoenberger, D. Styles, and J.L. Galvez-Martos have drafted the text and performed the analysis of the received data and the literature review. B. Zeschmar-Lahl has coordinated and led the work, contributed to the text, provided feedback, and proof-read the article before submission.

Conflicts of Interest

The authors declare no conflict of interest.

References

  1. Impacts on Unit-Based Waste Collection Charges. Available online: http://www1.oecd.org/officialdocuments/publicdisplaydocumentpdf/?cote=ENV/EPOC/WGWPR(2005)10/FINAL&docLanguage=En (accessed on 5 September 2016).
  2. Van Beukering, P.J.H.; Bartelings, H.; Linderhof, V.G.M.; Oosterhuis, F.H. Effectiveness of unit-based pricing of waste in the Netherlands: Applying a general equilibrium model. Waste Manag. 2009, 29, 2892–2901. [Google Scholar] [CrossRef] [PubMed]
  3. Dijkgraaf, E.; Gradus, R.H.J.M. Cost savings in unit-based pricing of household waste: The case of the Netherlands. Resour. Energy Econ. 2004, 26, 353–371. [Google Scholar] [CrossRef]
  4. Handbook on the Implementation of Pay-As-You-Throw as a Tool for Urban Management; Bilitewski, B.; Werner, P.; Reichenbach, J. (Eds.) Institute of Waste Management and Contaminated Site Treatment of Dresden University of Technology: Pirna, Germany, 2004.
  5. Bilitewski, B. From traditional to modern fee systems. Waste Manag. 2008, 28, 2760–2766. [Google Scholar] [CrossRef] [PubMed]
  6. Bilitewski, B.; Haerdtle, G.; Marek, K. Waste Management; Springer: Berlin, Germany, 1997; p. 650. [Google Scholar]
  7. Reichenbach, J. Status and prospects of pay-as-you-throw in Europe—A review of pilot research and implementation studies. Waste Manag. 2008, 28, 2809–2814. [Google Scholar] [CrossRef] [PubMed]
  8. Puig-Ventosa, I. Charging systems and PAYT experiences for waste management in Spain. Waste Manag. 2008, 28, 2767–2771. [Google Scholar] [CrossRef] [PubMed]
  9. Watkins, E.; Mitsios, A.; Mudgal, S.; Neubauer, A.; Reisinger, H.; Troeltzsch, J.; van Acoleyen, M. Use of Economic Instruments and Waste Management Performances. Available online: http://ec.europa.eu/environment/waste/pdf/final_report_10042012.pdf (accessed on 5 September 2016).
  10. County of Aschaffenburg. Proposal of the Waste Fee Dated 09.08.1995, submitted to the Council of the County (In German). 1995. Available online: http://www.landkreis-aschaffenburg.de (accessed on 5 September 2016).
  11. Conto, P. Contarina Spa. Verso l’obiettivo dei 10 kg/ab All’anno di Rifiuti Residui nel Trevigiano. 2015. Available online: http://www.forumrifiuti.it/files/forumrifiuti/docs/conto.pdf (accessed on 15 November 2015).
  12. Contarina Spa. Integrated Waste Management. 2015. Available online: http://www.contarina.it/files/en/ppt.pdf (accessed on 5 December 2015).
  13. Fedrizzi, S. Progetto di Riduzione dei Rifiuti nel Comune di Trento—Strategie di Prevenzione dei Rifiuti. 2015. Available online: http://blank.ecomondo.com/upload_ist/AllegatiProgrammaEventi/Fedrizzi_2508495.pdf (accessed on 5 December 2015).
  14. Regions for Recycling (R4R). Good Practice Flanders PAYT. 2014. Available online: http://www.regions4recycling.eu/upload/public/Good-Practices/GP_OVAM_PAYT.pdf (accessed on 5 December 2015).
  15. European Union. Regulation (EC) No 1221/2009 of the European Parliament and of the Council of 25 November 2009 on the Voluntary Participation by Organisations in a Community Eco-Management and Audit Scheme (EMAS), Repealing Regulation (EC) No 761/2001 and Commission Decisions 2001/681/EC and 2006/193/EC; Regulation 1221/2009; European Commission: Brussels, Belgium, 2009; pp. 1–45. [Google Scholar]
  16. Zeschmar-Lahl, B.; Schoenberger, H.; Styles, D.; Galvez-Martos, J.L. Background Report on Best Environmental Management Practice in the Waste Management Sector. Report for the European Commission’s Joint Research Centre, Seville, 2016. Available online: http://www.bzl-gmbh.de/de/sites/default/files/WasteManagementBackgroundReport.pdf (accessed on 5 September 2016).
  17. European Union. Council Directive (90/269/EEC) of 29 May 1990 on the minimum health and safety requirements for the manual handling of loads where there is a risk particularly of back injury to workers, (Fourth individual Directive within the meaning of article 16 (1) of Directive 89/391/EEC); European Commission: Brussels, Belgium, 1990; pp. 9–15. [Google Scholar]
  18. C-trace; Bielefeld, Germany. Personal Communication, 2014.
  19. County of Aschaffenburg. Erfahrungen bei der Einfuehrung Eines Identsystems mit Verwiegung (Experiences with the Introduction of an Identification System with Weighing). (In German)2013. Available online: http://www.landkreis-aschaffenburg.de/__tools/dl_tmp/www.landkreis-aschaffenburg.de/PG2C92G3784316G22FB/Informationen_zum_Wiegesystem.pdf (accessed on 5 September 2016).
  20. County of Aschaffenburg, Abfallwirtschaftsbericht 2013 (Waste Management Report 2013). (In German)Available online: http://www.landkreis-aschaffenburg.de/__tools/dl_tmp/www.landkreis-aschaffenburg.de/PH28D5H3343093H22FB/Abfallwirtschaftsbericht_2012_k.pdf (accessed on 5 September 2016).
  21. Abfallberatung Unterfranken, 2016: Landkreis Aschaffenburg: Abfallwirtschaftlicher Steckbrief (In German). Available online: http://www.abfallberatung-unterfranken.de/landkreis_aschaffenburg.html (accessed on 10 January 2017).
  22. Eurostat, Statistics Database. 2014. Available online: http://ec.europa.eu/eurostat (accessed on 15 December 2014).
  23. Kern, M. Orientierende Restmuellanalyse Abfallzweckverband Suedniedersachsen. Report Prepared by Witzenhausen Institut, 2012. Available online: http://www.as-nds.de/upload/Bericht_Analyse_AZV_Suedniedersachsen_2012.pdf (accessed on 23 September 2016).
  24. Ecoinvent Database; v.3.0; Ecoinvent: Zürich, Switzerland, 2014.
  25. Department for Business, Energy and Industrial Strategy. UK Government Conversion Factors for Company Reporting, 2016. Available online: https://www.gov.uk/government/publications/greenhouse-gas-reporting-conversion-factors-2016 (accessed on 12 October 2016).
  26. Styles, D.; Dominguez, E.M.; Chadwick, D. Environmental balance of the UK biogas sector: An evaluation by consequential life cycle assessment. Sci. Total Environ. 2016, 560–561, 241–253. [Google Scholar] [CrossRef] [PubMed]
  27. County of Aschaffenburg. Document on the Fee Calculation with All Figures Used after Introducing the Weight-Based System (In German). 1997. Available online: http://www.landkreis-aschaffenburg.de (accessed on 5 September 2016).
  28. Slavik, J.; Pavel, J. Do the variable charges really increase the effectiveness and economy of waste management? A case study of the Czech Republic. Resour. Conserv. Recycl. 2013, 70, 68–77. [Google Scholar] [CrossRef]
  29. IA GmbH. Abfallwirtschaftliche Gesamtkosten (Total Costs for Waste Management); IA GmbH: Munich, Germany, 2015. [Google Scholar]
  30. European Commission. Proposal for a Directive of the European Parliament and of the Council Amending Directive 2008/98EC 2015. Available online: http://ec.europa.eu/environment/waste/target_review.htm (accessed on 6 September 2016).
  31. Holmes, A.; Fulford, J.; Pitts-Tucker, C. Investigating the Impact of Recycling Incentive Schemes. Available online: https://www.serco.com/Images/Serco%20Eunomia%20Incentives%20Full%20Report_tcm3–44276.pdf (accessed on 6 September 2016).
  32. Orange, R. Waste Not Want Not: Sweden to Give Tax Breaks for Repairs. Available online: https://www.theguardian.com/world/2016/sep/19/waste-not-want-not-sweden-tax-breaks-repairs (accessed on 17 December 2016).
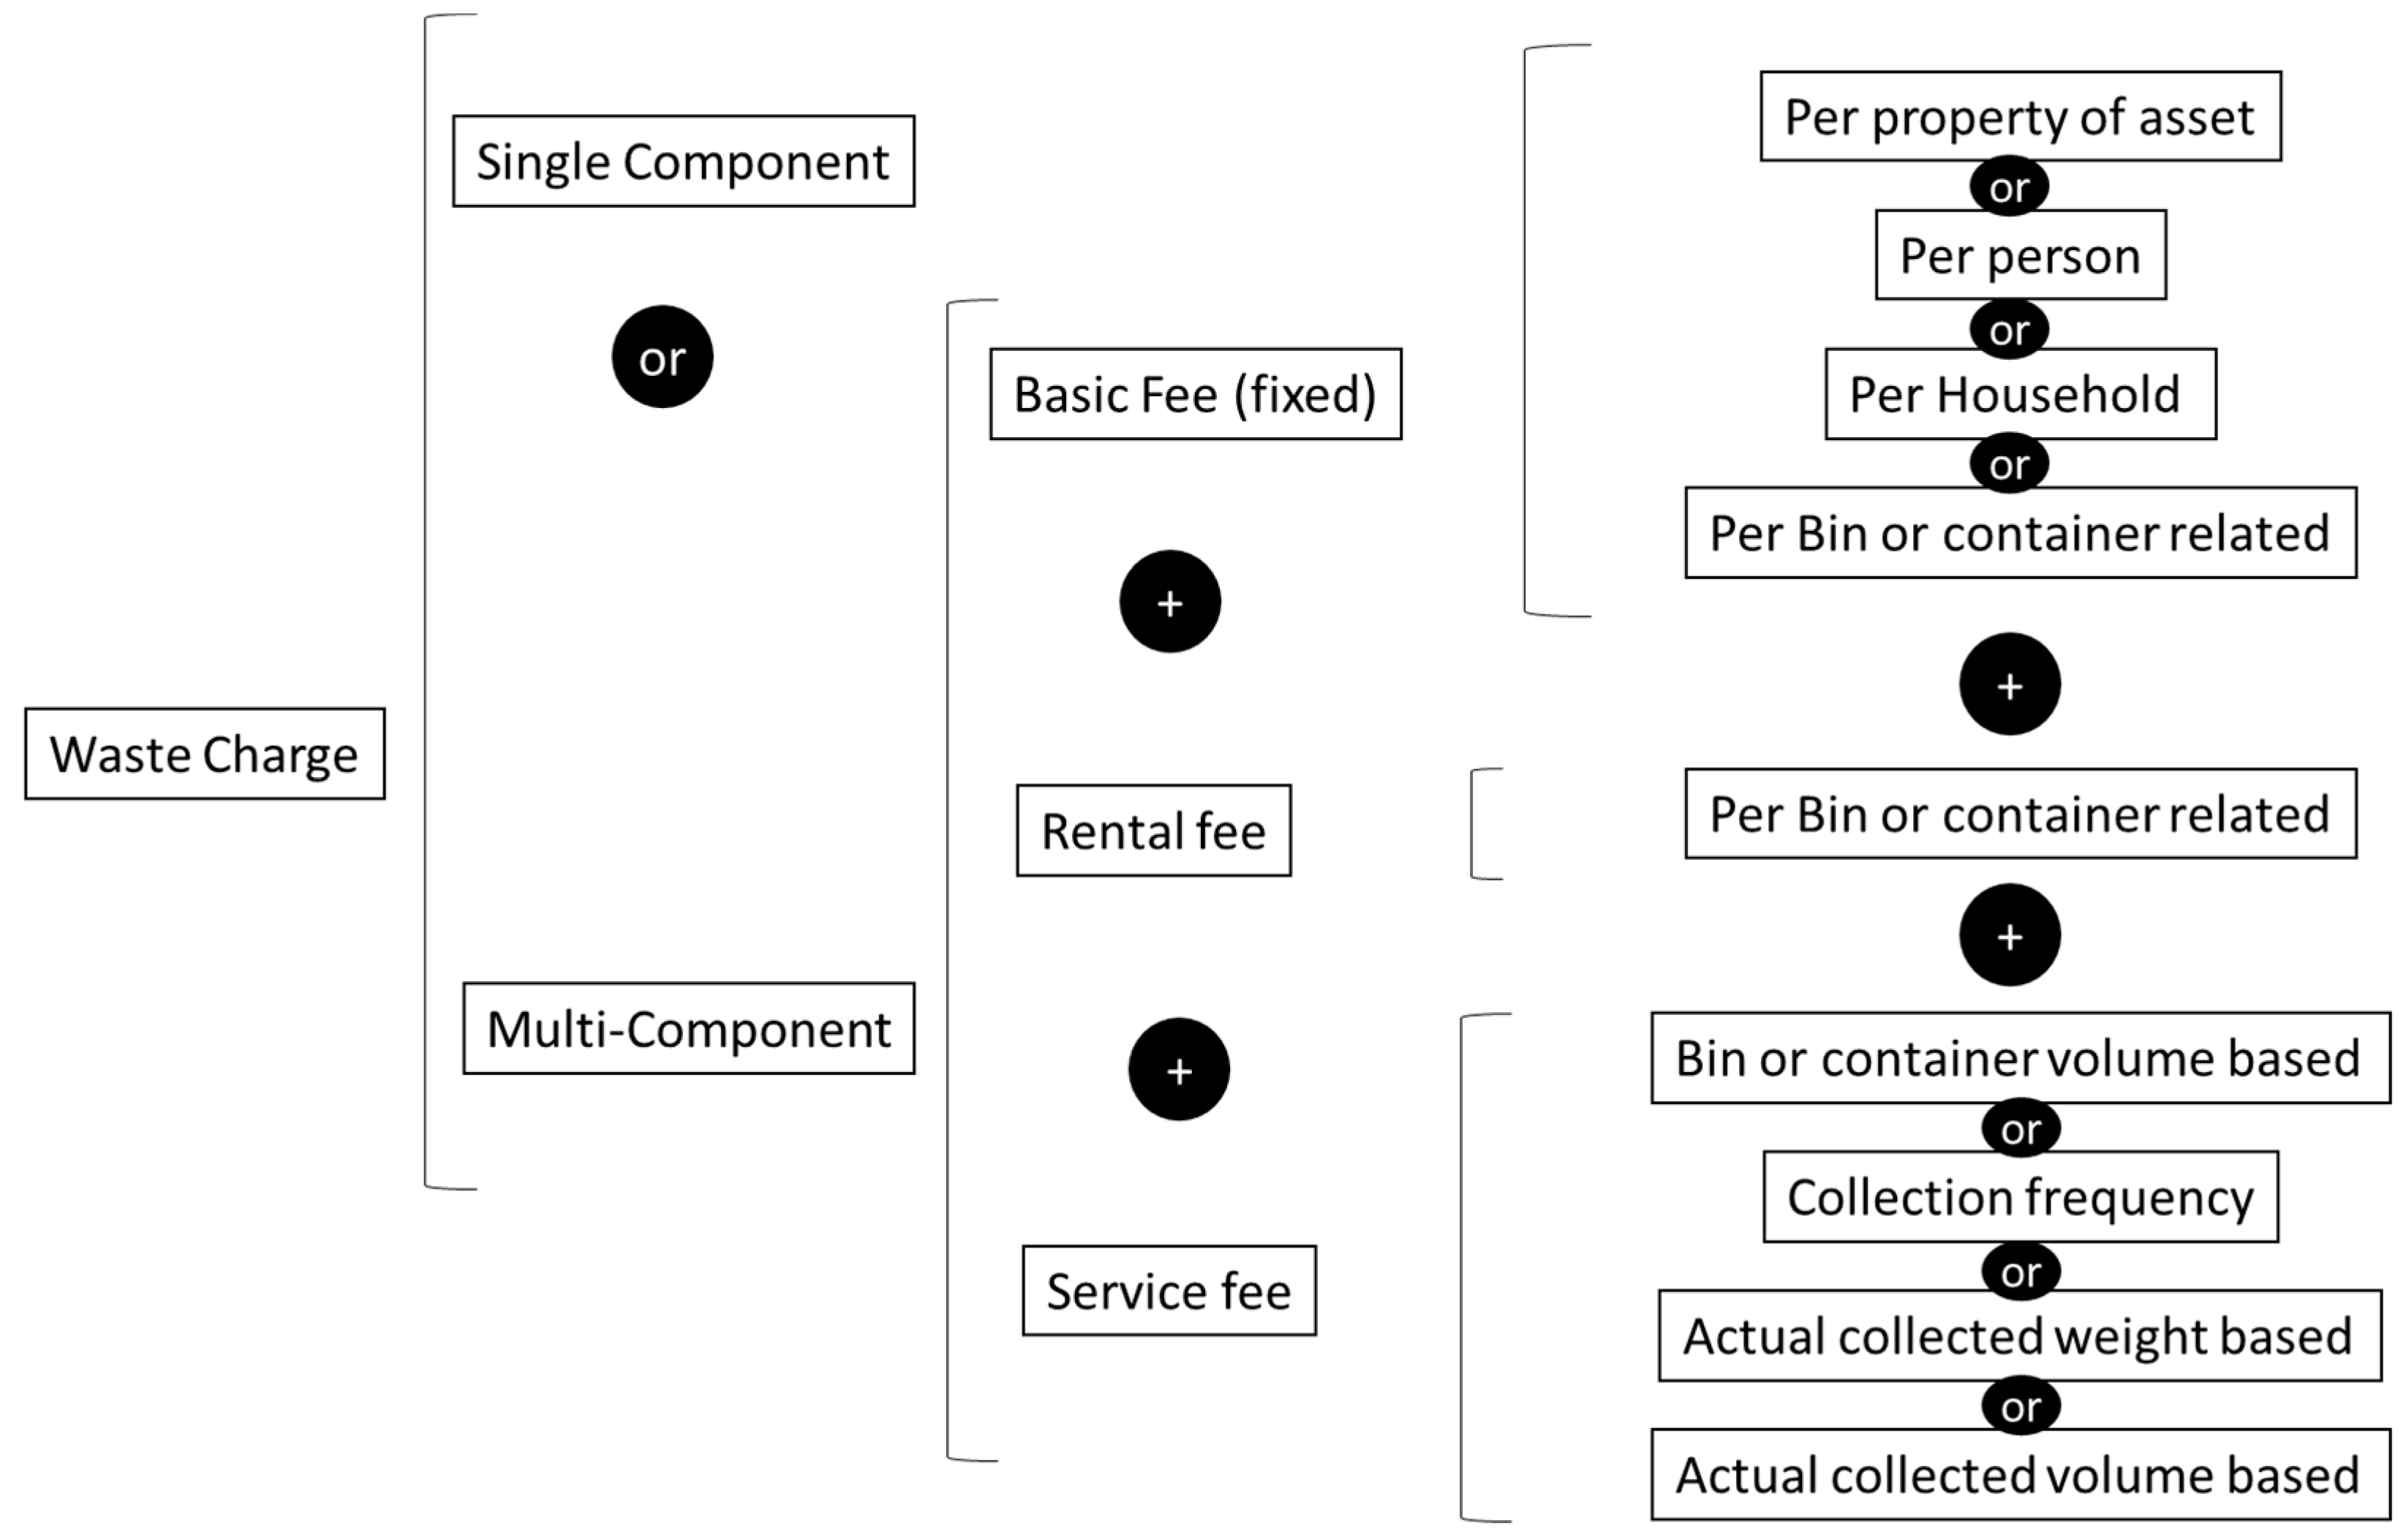
Figure 1. Possible waste fee components (adapted from [5]).
Resources 06 00008 g001
Figure 2. Process chart for electronic identification and data transfer in a bin identification scheme (adapted from [4]).
Resources 06 00008 g002
Figure 3. Example of the information automatically read by an identification system, taken from [16,18].
Resources 06 00008 g003
Figure 4. Examples of microchips (a) for new bins; and (b) for retrofitting existing bins [16,18].
Resources 06 00008 g004
Figure 5. A waste collection truck equipped with a waste identification system [16,18].
Resources 06 00008 g005
Figure 6. Quantity of the different waste fractions of the County of Aschaffenburg from 1989 to 2013; the quantities are given in kg·cap−1·yr−1 [19]. Due to the lack of reliable data, commercial waste similar to municipal solid waste (MSW) is not included.
Resources 06 00008 g006
Figure 7. Development of the quantities of residual waste and recyclables collection from municipal solid waste for 1995–2013 for (a) the County of Aschaffenburg [21] and (b) Germany [22].
Resources 06 00008 g007
Figure 8. GHG savings attributable to the reduced incineration of residual waste and the additional recycling of separated waste fractions between 1995 and 2000 in the County of Aschaffenburg, based on the absolute changes in waste volumes and changes relative to estimated business-as-usual (Table 2), accounting for raw material substitution effects.
Resources 06 00008 g008
Figure 9. Evolution of waste fees in the County of Aschaffenburg from 1997 (the year the PAYT system for residual waste was established) to 2015 for an average four-person household with and without a bin for organic waste (data from [27]).
Resources 06 00008 g009
Figure 10. Example of an annual bill for waste services for a four-person household in Aschaffenburg with separate bins for residual waste (120 L), bio waste (60 L), and paper/cardboard.
Resources 06 00008 g010
Figure 11. Unrecovered costs in 33 counties and 11 cities in Germany in 2013, based on [28].
Resources 06 00008 g011
Table 1. Existing infrastructure for the collection of recyclable waste streams in Aschaffenburg [20].
Waste TypeCollection System
Residual wasteResidual waste bin: collection rate every 14 days, with weighing and identification; bin sizes: 120, 240, 660, or 1100 L, available upon request and with a lock
Reloading station: direct delivery for a fee
Bio wasteBio waste bin: collection rate every 14 days (every 7 days in the months of June, July, and August) with weighing and identification, bin sizes: 60 or 120 L
Garden waste/green cuttingsHousehold collection rounds twice per year in each municipality on advertised dates.
Delivery to municipal collection and shredding sites, or to the district recycling centre
Waste paperPaper bin (blue bin), which has been introduced throughout the entire county, four-week collection; bin sizes: 240, or 1100 L
Collection by a non-profit association, infrequent in every municipality
30 collection centres (also known as “container parks” or “civic amenity sites”)
Sales packagingYellow recycling bags for light packaging: monthly collection
Metals: depot containers (180 locations)
Glass: depot containers for white, green, and brown glass (180 locations)
Bulky waste for disposalCollection on call, written registration required, fee by weight
Reloading station: direct delivery for a fee
Bulky waste for recyclingWaste wood, scrap metal, and electrical appliances (white goods, refrigerators, and display units) are collected twice a year at the kerbside with fixed collection schedules.
Special waste (hazardous waste in small quantities)Mobile collection, twice a year in each municipality (46 stopping points)
Year-round acceptance of small quantities in the district recycling yard
Collection centresWaste metal, waste wood, flat glass, cans, hollow glass, waste paper, rubble, electrical appliances (IT and entertainment devices), non-ferrous metals, CDs, corks, used cooking oils, PU foam cans, and textiles
Table 2. Quantities of waste fractions arising in Aschaffenburg in 1995 and 2000, before and after the implementation of PAYT, and estimated counterfactual business-as-usual (BAU) quantities of waste fractions arising in 2000, based on the average reduction in residual waste in Germany over that period.
Waste Type1995 (A)2000 PAYT (B)2000 BAU (C)Absolute Change (B−A)PAYT Effect (B−C)
kg·cap−1·yr−1
Residual waste163.048.0132.0−115.0−84.0
Aluminium0.20.10.2−0.1−0.1
Paper and cardboard80.0101.085.7+21.0+15.3
Mixed plastics14.021.015.9+7.0+5.1
Glass34.032.033.5−2.0−1.5
Steel & iron21.020.020.7−1.0−0.7
Food waste4.024.09.4+20.0+14.6
Green waste75.074.074.7−1.0−0.7
Woody waste24.020.022.9−4.0−2.9
Textiles2.62.42.5−0.2−0.1
Construction28.045.032.6+17.0+12.4
Hazardous1.50.61.3−0.9−0.7
Bulky27.02.720.5−24.3−17.8
Commercial0.010.010.0+10.0+10.0
Change in residual waste not accounted for by increase in major separated fractions *−50.0−36.5
* Calculated as the reduction in residual waste plus sum of increases in paper and cardboard, mixed plastics, and food waste.
Table 3. Waste treatment fee breakdown in the County of Aschaffenburg for the example of Figure 9 [20].
Type of Fee19972012
Basic fee32%47.0%
Collection fee17%18.5%
Weight fee51%34.5%