Article

Feasibility of Small Wind Turbines in Ontario: Integrating Power Curves with Wind Trends

1
Department of Geography, York University, 4700 Keele Street, Toronto, ON M3J 1P3, Canada
2
Department of Geography, Centre of Atmospheric Science, University of Cambridge, Cambridge CB2 3EN, UK
*
Author to whom correspondence should be addressed.
Resources 2016, 5(4), 44; https://doi.org/10.3390/resources5040044
Submission received: 18 October 2016 / Revised: 29 November 2016 / Accepted: 30 November 2016 / Published: 7 December 2016
(This article belongs to the Special Issue Advanced Analysis of Energy Systems under Sustainability Aspects)

Abstract

:
Micro-scale/small wind turbines, unlike larger utility-scale turbines, produce electricity at a rate of 300 W to 10 kW at their rated wind speed and are typically below 30 m in hub-height. These wind turbines have much more flexibility in their costs, maintenance and siting, owing to their size, and can provided wind energy in areas much less suited for direct supply to the grid system. In the future under climate change, the energy landscape will likely shift from the present centralized electricity generation and delivery system to a more distributed and locally-generated electricity and delivery system. In the new system configuration, the role of relatively small sustainable electricity generators like small wind turbines will likely become more prominent. However, the small wind industry has been substantially slow to progress in Ontario, Canada, and there is much debate over its viability in a growing energy dependent economy. This study seeks to demonstrate the performance of a small wind turbine, and speculate on its potential power output and trend over Ontario historically over the last 33 years using the North American Regional Reanalysis (NARR) data. We assessed the efficiency of a Bergey Excel 1 kW wind turbine at the pre-established Kortright Centre for Conservation test site, located north of Toronto. Using a novel approach, the Bergey optimized power curve was incorporated with reanalysis data to establish power output across Ontario at three-hour resolution. Small turbine-based wind power around the Great Lakes and eastern James Bay increased during winter and fall, contributing up to 10% of the annual electricity demand in some regions in Ontario. We purport that increases in power output are driven by long-term reductions in sea and lake ice concentrations affecting atmospheric stability in surrounding regions.

1. Introduction

The wind turbines that represent the modern renewable energy landscape consist of large utility-scale wind turbines, which can produce electricity on the scale of MW (megawatts), taking advantage of stronger winds aloft with high hub-heights and large rotor diameters. Canadian investment in installed wind turbine capacity saw a 20% growth in clean wind energy production in 2012 over previous years, representing over $2.5 billion in investment, and Canada’s current installed capacity is just over 6.5 GW (gigawatts) [1]. The province of Ontario (Figure 1) has 2.9 GW of installed wind capacity, approximately 30% of Canada’s total capacity [2]. The small wind turbine industry however is focused on the installation of wind turbines that produce electricity at an average rate between 300 W and 10 kW (kilowatts) rated power (maximum power output), with hub-heights that are generally below 30 m. Although small-scale wind turbines have been around historically, employed for different functions like grinding grains, they have failed to dominate the wind energy sector, owing to increasing doubts about their performance, technological advancements, field testing and feasibility in a changing climate.
Small wind turbines produce more costly electricity than their utility-scale counterparts, especially in poor wind sites. However, when tailored to specific wind regimes, and used at optimal conditions through wind site assessment, small wind turbines can be a reliable energy source and socio-economic benefit to regions disconnected from the grid. Seen as a means to increase electrical supply to small isolated communities in developing countries [3], the small wind industry has been especially hindered in Canada (both rural and urban) with currently between 2200 and 2500 turbines installed, 90% of which fall into the “mini” wind turbine category (<1 kW rated power). The total combined installed capacity of all Small Wind Turbines (SWTs) is estimated to be between 1.8 MW and 4.5 MW, equivalent to the capacity of one to three modern utility-grade wind turbines, with annual output roughly at 7.5 GWh (gigawatt hour) per year, equivalent to an amount of electricity consumed by approximately 750 Canadian homes [1].
The small wind industry has provided the global renewable energy sector with the benefits of energy independence for the consumer, remote electricity production in regions off-grid and a more diversified energy supply, which can be complemented with solar energy and utilized by businesses and households. However, this industry is faced with many challenges, particularly the lack of standardized field testing of these wind turbines, resulting in uncertainty in performance claims by manufacturers. Most of testing done to establish small wind turbine rated power (maximum power output) and power curves (function of power output with increasing wind) is done in wind tunnels, focusing on the electrical components of the wind turbines and not realistically assessing turbine performance in the field, owing to associated costs and inadequate policy. As environmental factors such as temperature, radiation and wind variability affect turbine performance, field testing is essential yet studies assessing the performance of small wind turbines in the field have often focused on the turbine’s effect on the local environment or turbulence patterns produced by secondary rotor effects [4,5,6,7,8,9]. Since there are currently no formal standardized testing regulations for their calibration and power output in the North American wind industry [10], it is difficult to access wind turbine data, which is often classed as “commercially sensitive” and thus studies continually rely on more simplistic formulations of power output to assess the changing wind regime caused by global warming [10,11,12,13]. Thus, we see our study as a first step to address this issue in Ontario, where a calibrated and observed (independently field-produced) wind turbine power curve is coupled with modelled data to validate the feasibility of the small wind turbine energy sector.
The Kortright Centre for Conservation has been at the forefront of renewable energy initiatives in Toronto, Ontario, being one of two main test sites for standardization of small wind turbines in Canada (the other is located in Prince Edward Island). Thus, Kortright affords this study unique and rare access to field-tested wind turbine data, allowing for the extraction of power curves, which show turbine function through a series of flow conditions. At this testing center, a leading industry standard turbine was assessed in this study, the Bergey Excel 1 kW wind turbine with a hub-height of 15.2 m. This turbine has varying specifications, as listed in Table 1. Our study seeks to understand the historical (33 year, 1980–2012) electrical output potential for small wind turbines using reanalysis wind data at 10 m and 30 m (hub-heights applicable to SWTs) over Ontario. We have incorporated highly optimized wind power curve of our small wind turbines into the reanalysis data over the 33-year period, producing a theoretical historical power production, finding trends in the electrical output that best estimate the potential of this industry, both spatially and temporally across Ontario. Research presented examines our novel approach to assessing wind energy across Ontario, and the potential implications of climate change and variability to the small wind energy industry. However, this research does not address the limitations and challenges facing the industry, owing to economic, political and other geographic aspects, but presents data within the context of exploring climatic impacts on modelled wind regimes and subsequent power output potential. It is also important to note that continued research will aid in determining impacts due to long-term changes versus those related to natural climate variability within the region.

NARR Dataset

The National Centers for Environmental Prediction (NCEP)-North American Regional Reanalysis (NARR) is a high-resolution atmospheric and land surface hydrology dataset for the North American domain [14]. At present this dataset comprises of reanalysis data (modelled data with assimilated observation input) for the period 1979–present; in the present study, three-hourly atmospheric data from 1980 to 2012 were used. The robust NARR procedure uses the very high resolution NCEP Eta Model (32 km, 45 layers) together with the Regional Data Assimilation System (RDAS), and was chosen for this study, owing to its reliability with winds over North America [15,16,17]. NARR is widely known for its successful assimilation of high-quality and detailed precipitation observations into the atmospheric analysis, which was previously lacking from many global models, vastly improving the representation of wind and other associated parameters in reanalysis data. This research focused on the electrical output potential over Ontario for the two lowest tropospheric heights of 10 m and 30 m, which are hub-heights relevant to small wind turbines. Though wind turbines can have hub-heights between these levels, analysis of 10 and 30 m will effectively measure the variability and power output within this layer, owing to minor differences in wind speeds occurring within. However, owing to a preliminary intrinsic coding error within the NARR dataset, 43 grid cells along the lower Hudson Bay coastline were found to be incorrect at the 30 m level, due to their low lying elevation [18]. However, these grid cells (0.01% of the study area) were found to be non-influential on the neighbouring cells and were omitted from the analysis.

2. Methods

2.1. Power Curves

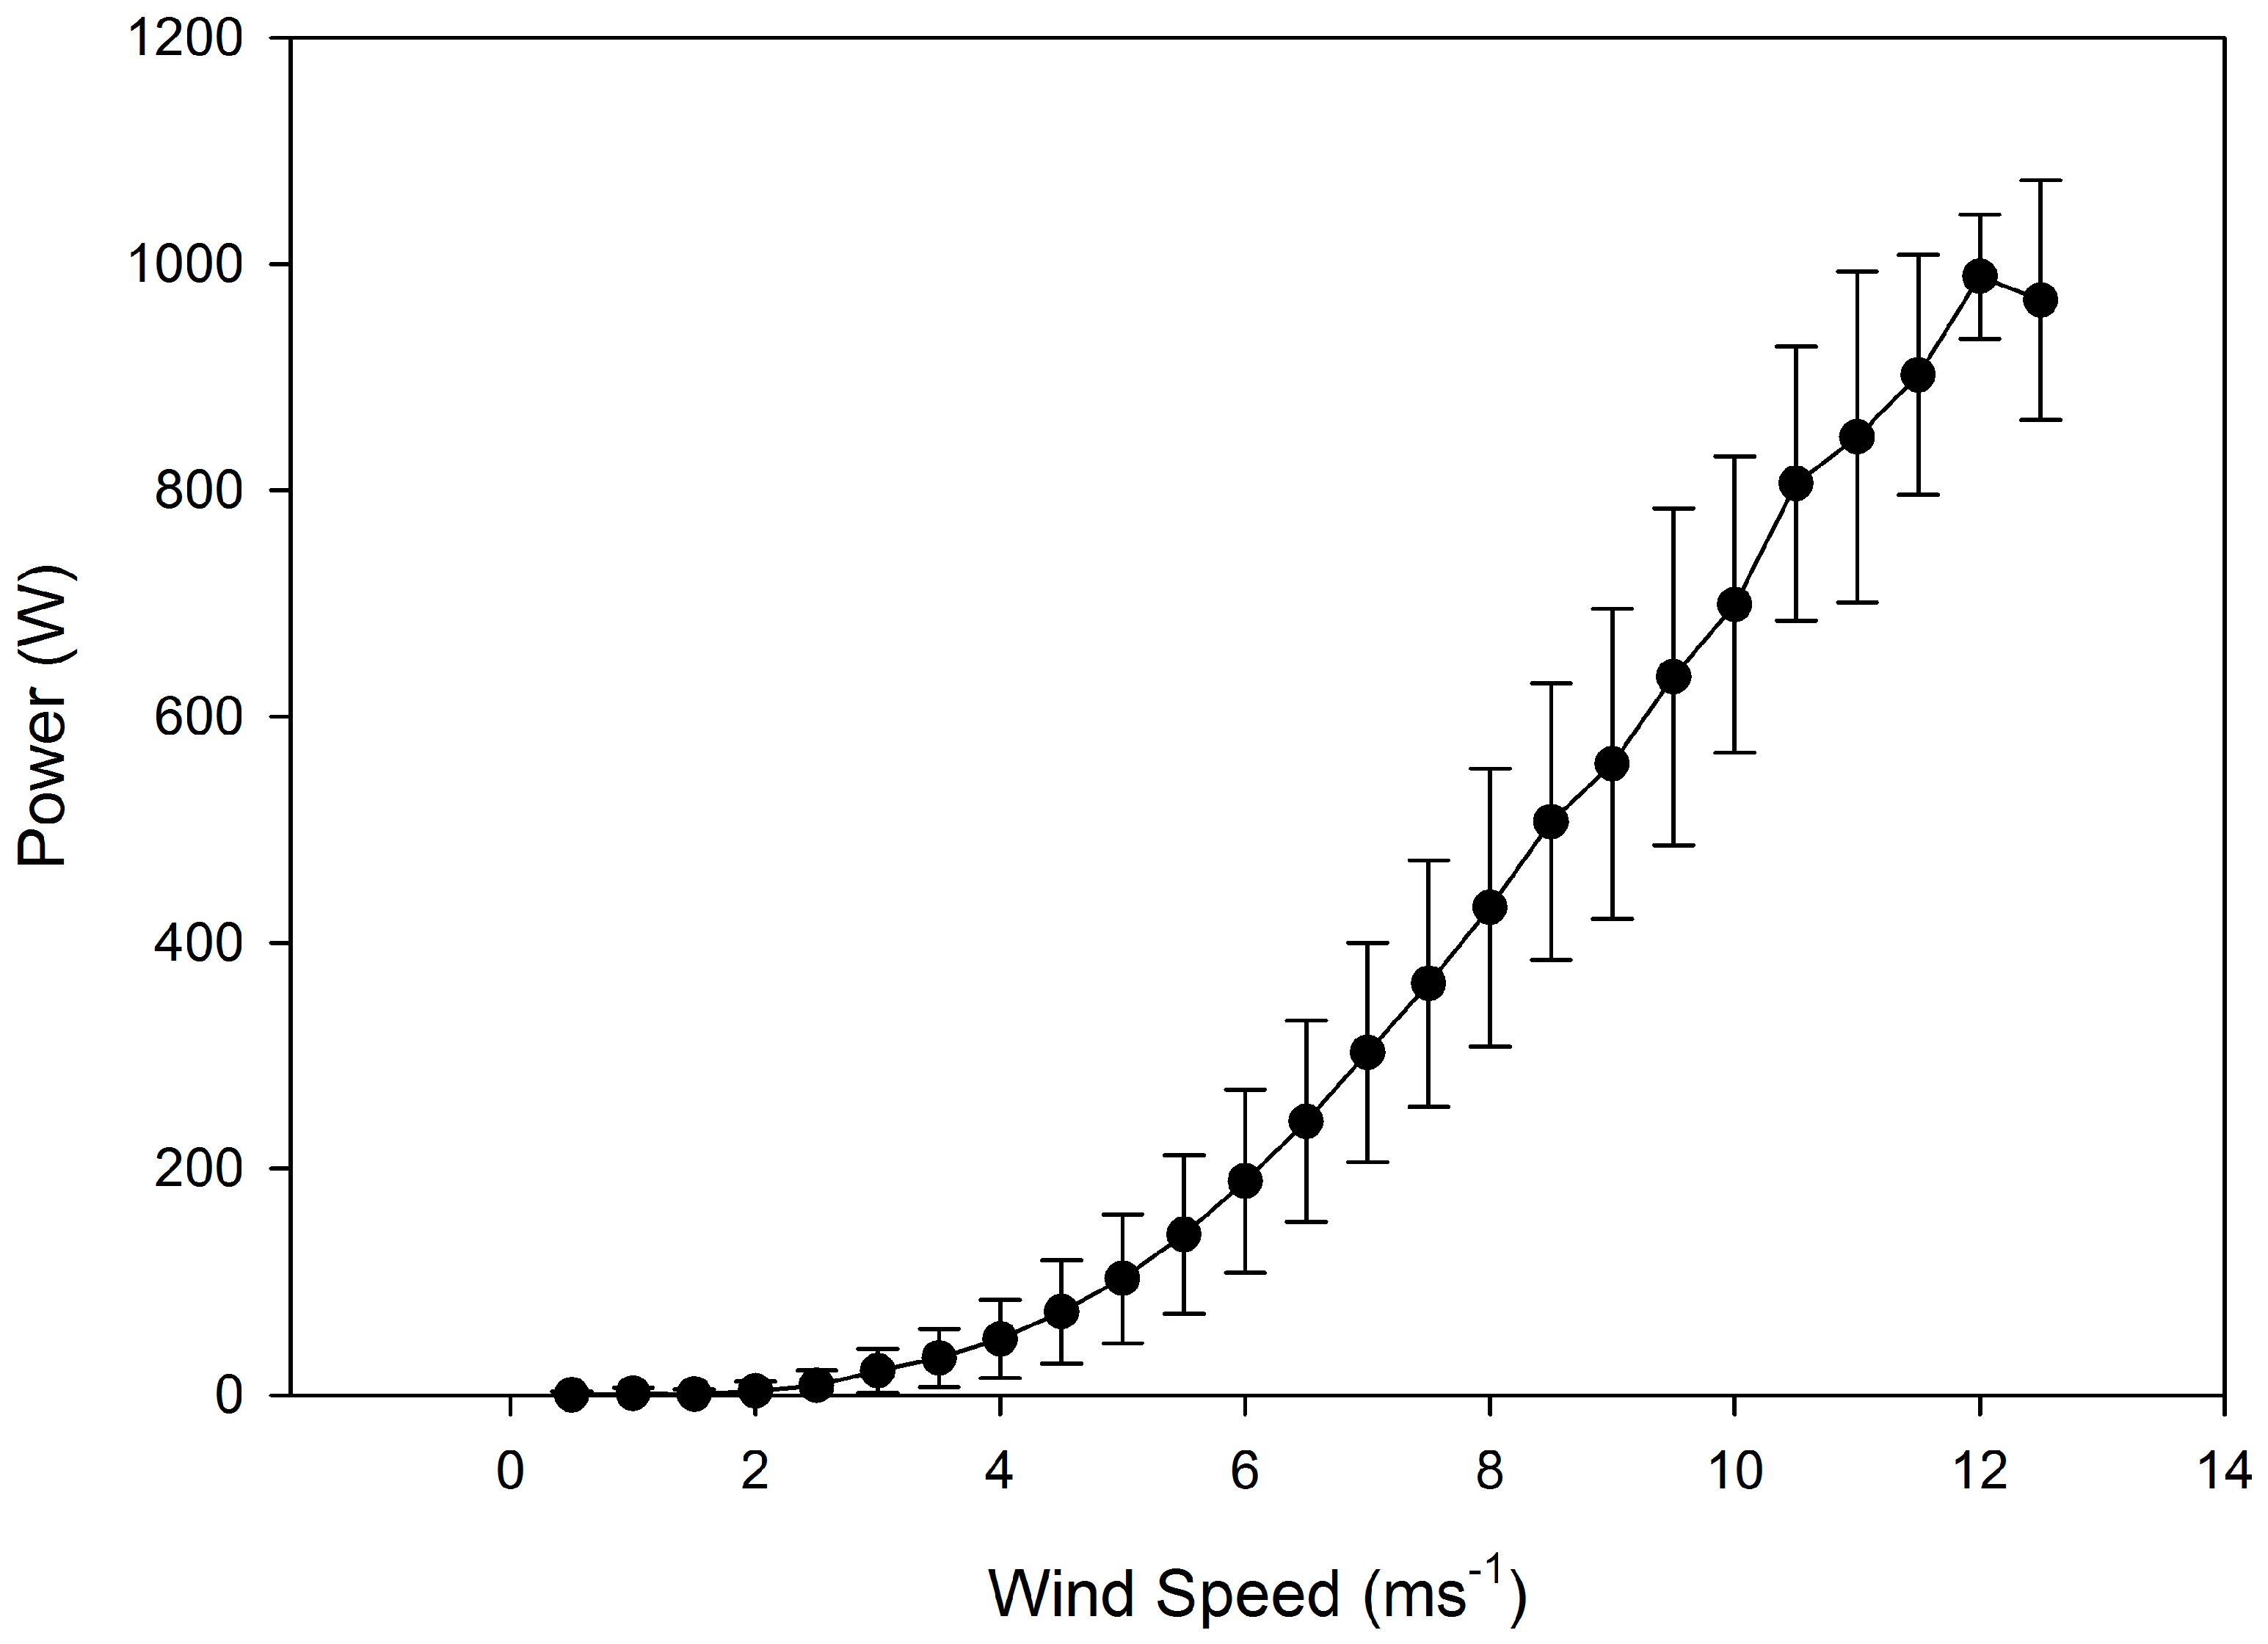
The Kortright test site is located a short distance (~30 km) north of Toronto, with an open fetch, having a predominantly southeast and northwest wind pattern. Meteorological and electrical output data were measured for the Bergey turbine between November 2012 and April 2013. These data provided 5-s readings of wind speed at 8 levels above ground, temperature, wind direction and turbine power output for ~6 months. Analysis of these data produced performance data through power curve analysis, demonstrating how the wind turbine performed at differing wind speeds. Figure 2 shows the power curve of the Bergey wind turbine. Though the observed power curve is derived from 6 months of data, it is not limited by the absence of seasonal variances, and winter months from our data collection provided a wind range of wind speeds, fully testing the responsiveness of the small wind turbine. Furthermore, studies have shown that stability, not season, plays a larger role in altering power curves [19,20], with results showing minimal difference, which present marginal bias in long-term trends and seasonal averages.
Figure 2 gives the raw power curve for the Bergey 1 kW wind turbine, with error bars representing the variance found in power output across the power curve, with larger error occurring at higher wind speeds. The Kortright field test site did not experience very high and consistent wind speeds, and only wind speed bins meeting the statistically minimum required number of data points were included. However, the Bergey turbine did experience winds at its rated power (actually 1.1 kW and not 1 kW) and we were able to assess how the wind turbine performs during these times, thus this study was not limited. The power curve remains fairly steady until the cut-out wind speed of 25 m·s−1 (not shown). This mid-region of higher variance in the power curve is standard and is known as the “belly” of the curve, an effect influenced by inertia of the rotating blades whereby the response of the blade speed to the wind is delayed, thus producing higher power outputs despite lower recorded wind speeds. Applying a best fit curve, a 4th order polynomial equation (with spline fitting), was obtained for the Bergey turbine that best described its ability to convert wind energy into electrical power (P) in Watts, such as the Bergey power curve seen in Equation (1):
Bergey Excel 1 kW wind turbine
P = { 0 ,   x < 2.5 0.10 x 4 + 2.02 x 3 2.88 x 2 2.19 x + 2.73 ,   2.5 x < 25 0 ,   x 25
where x is the output wind speed (m·s−1). This optimized power curve accounted for no power output below the cut-in wind speed, and a rated power output (1.1 kW for the Bergey turbine) between the rated wind speed (wind speed of maximum wind power output) and the cut-out wind speed of 25 m·s−1. Thus, the turbine is given a more accurate measurement of power output than a simple power estimation based on height for implementation with modelled output data from NARR.

2.2. Applying Power Curves to NARR

Using the NARR zonal and meridional wind components, u and v, wind speed U (m·s−1) at the tropospheric levels of 10 and 30 m was calculated using the standard magnitude formula (Equation (2)):
U = u 2 + v 2
Wind speeds at 10 and 30 m heights were derived for every 3-h measurement from the corresponding NARR wind data (1980–2012). Monthly mean wind speeds, 33-year monthly averages and seasonal means were assessed for winter (DJF), spring (MAM), summer (JJA) and fall (SON).
The historical power generating potential for the Bergey wind turbine was then calculated by inputting the NARR wind speed data to Equation (1). The Bergey turbine power curve was used to hindcast electrical output for each 3-h reading from the NARR dataset in megajoules (MJ) and the summed electrical output for each month were averaged based on 33 years of wind speed data. This method was repeated at the 30 m and spatial differences in performance between the hub-heights of 10 and 30 m show regions where increases in the hub-height have proven more effective than in other regions. Ontario represents an extensive landmass (~1 million km2) with varying topographical aspects that can affect wind speeds spatially. However, implementing an optimized power curve into NARR wind data captures these influences from the relief, as surface roughness is a key component in estimating the wind speeds at 10 and 30 m from NARR.
Trend analysis in the electrical output over Ontario and the Great Lakes from each wind turbine was computed with the statistical ordinary least squares (OLS) method, along with the interannual variability of wind power. Plots of significant trends using t-test analysis are reported on a seasonal basis. Other atmospheric parameters such as temperature and pressure were used for the estimating of stability.

3. Results and Discussion

3.1. Seasonal Variations in Turbine Power Output

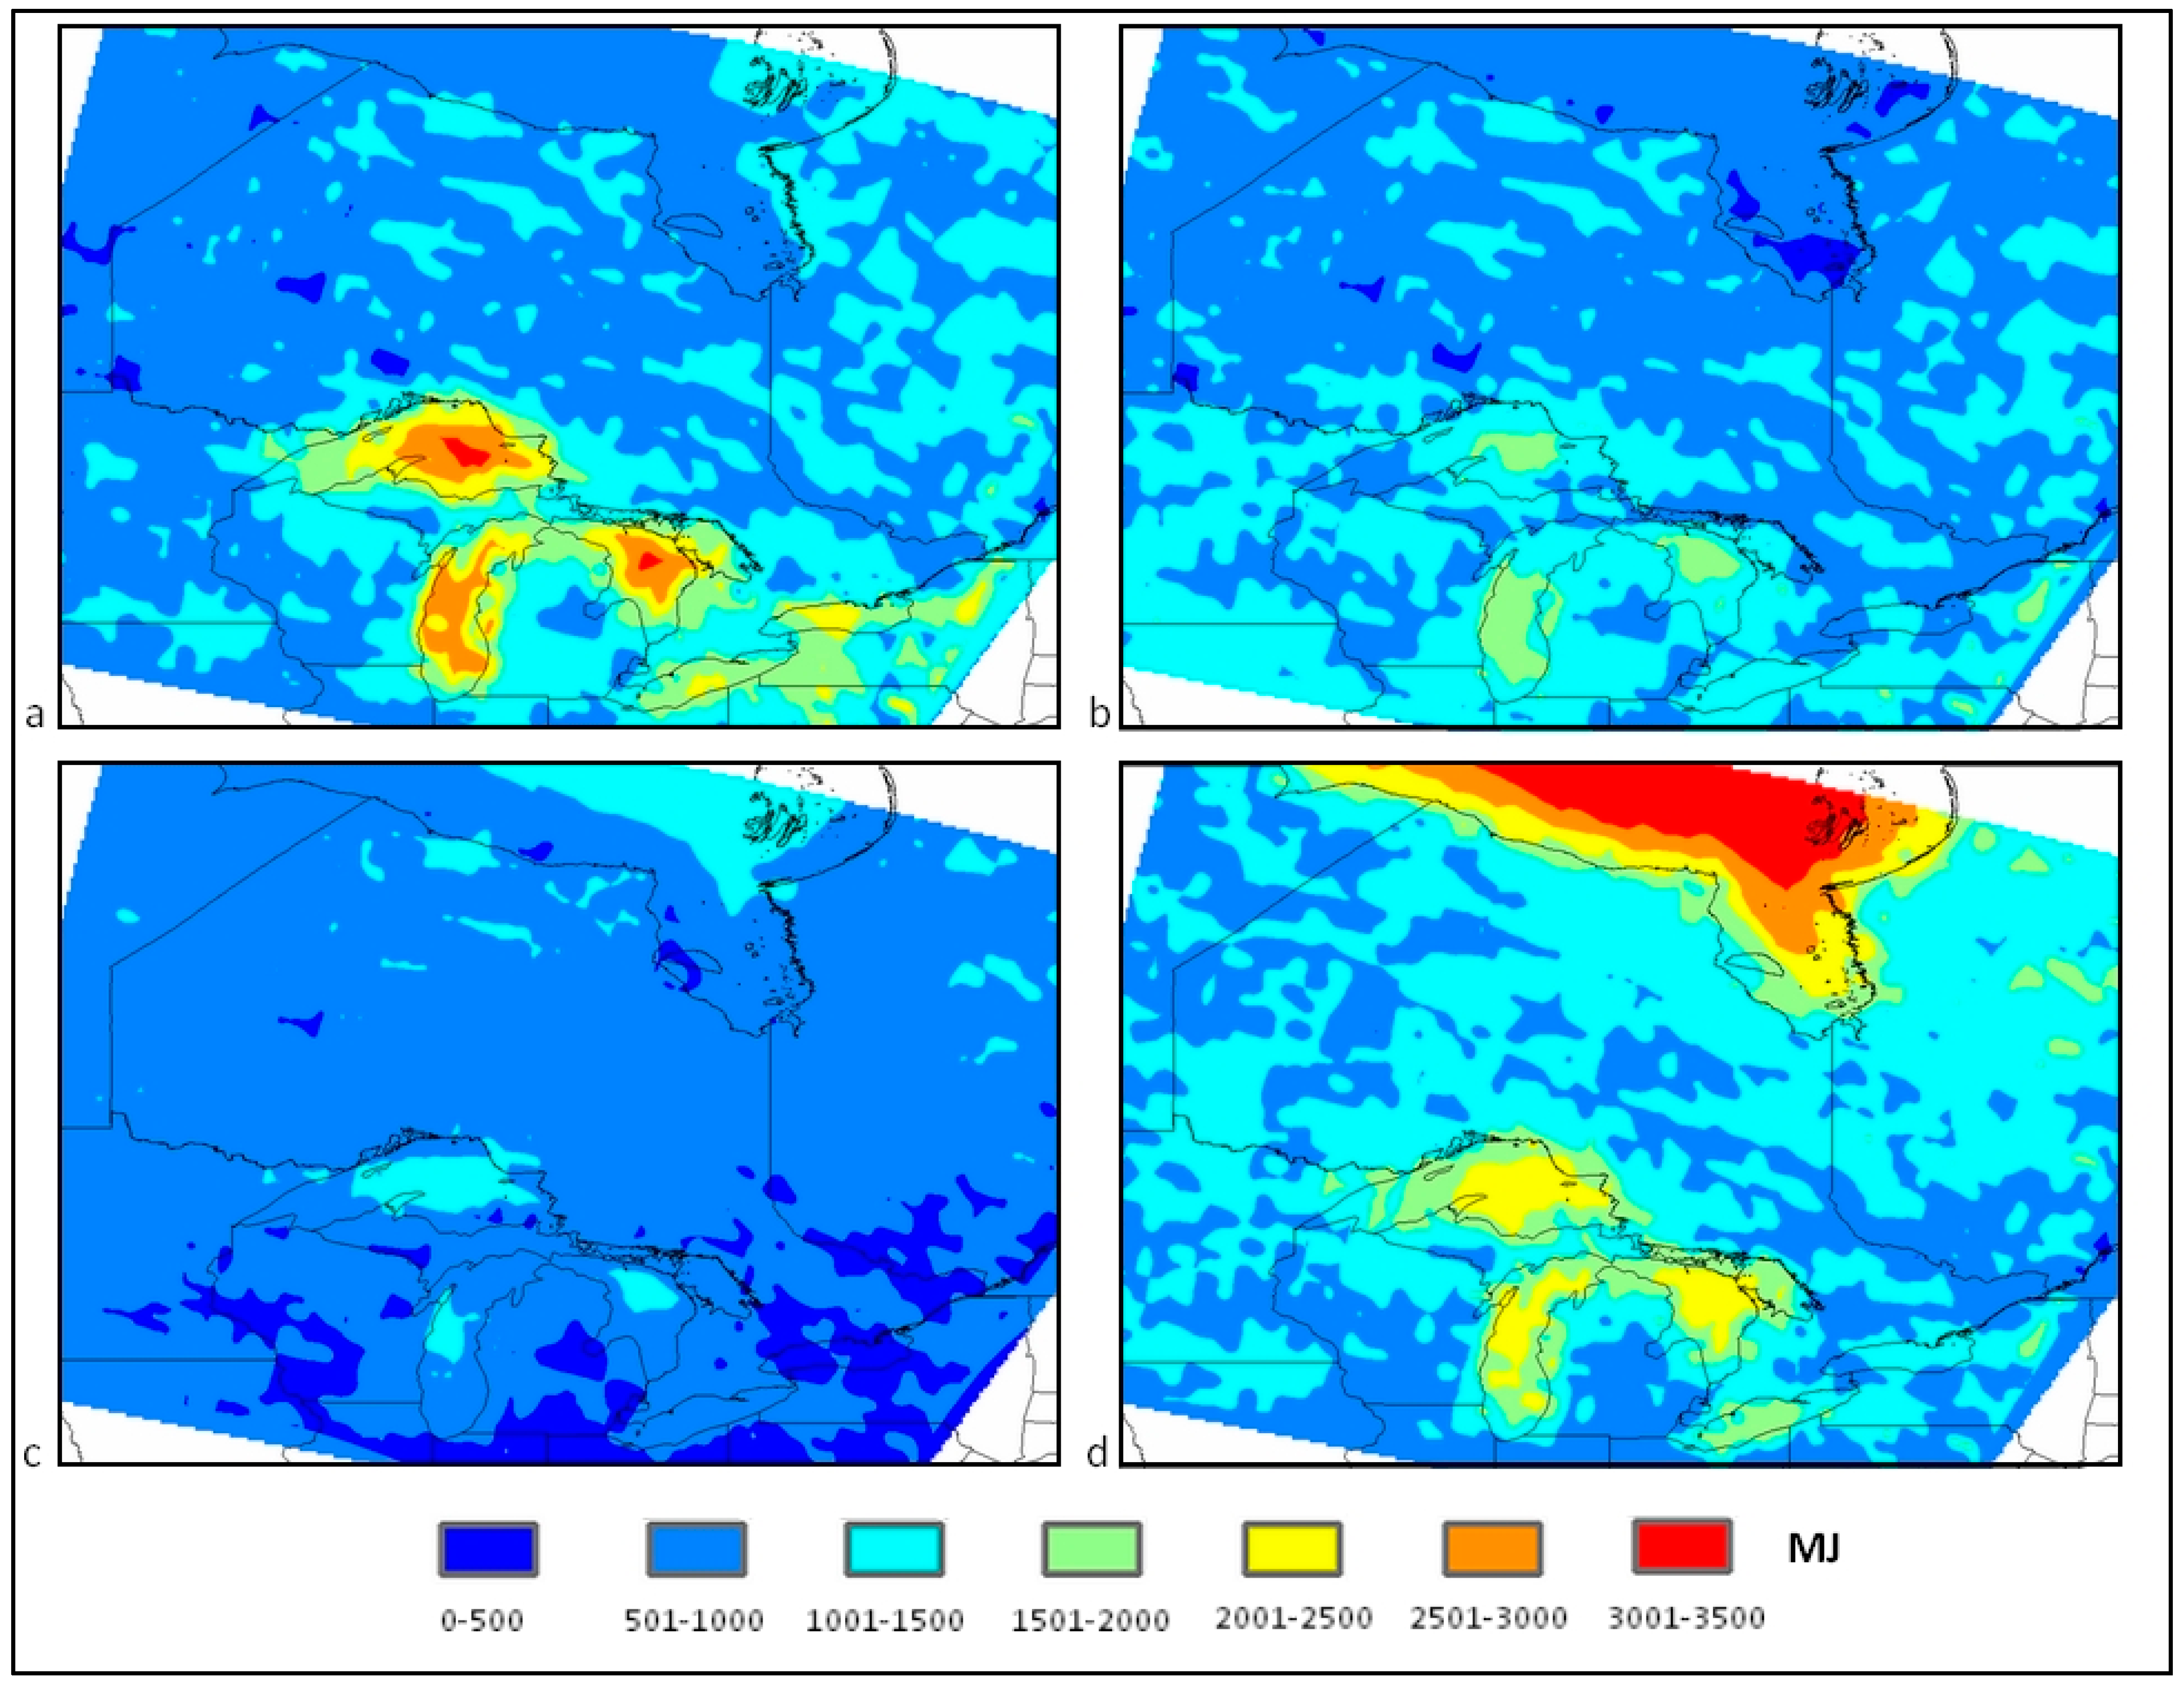
Seasonal variations and long-term trends in the NARR wind field from 1980 to 2012 at the 10 and 30 m heights have been described in Ashtine et al. [21], and the spatio-temporal patterns of the turbine energy output correspond well with changes in winds shown. Power curve produced for the Bergey 1 kW (Figure 2) wind turbine was in close agreement with the power curves of this turbine from the field testing in previous studies [22,23]. The Bergey reaches its maximum power output of 1.1 kW at 13.5 m·s−1 with a cut-in wind speed of 2.5 m·s−1. Turbine power output closely follows patterns in mean wind speeds, with the Great Lakes and James Bay producing the greatest amount of electrical energy for both turbines during the winter and fall seasons (Figure 3). Significant seasonal variations in the power output are observed over the major water bodies, as a result of the impact on surface winds from melting and formation of ice over water [23]. It is important to note that though an optimized power curve of the Bergey turbine was implemented with climate model data, this novel approach cannot account for the “belly” of the power curve as seen with high-resolution observed data, and results must be taken in the context of seasonal averages.
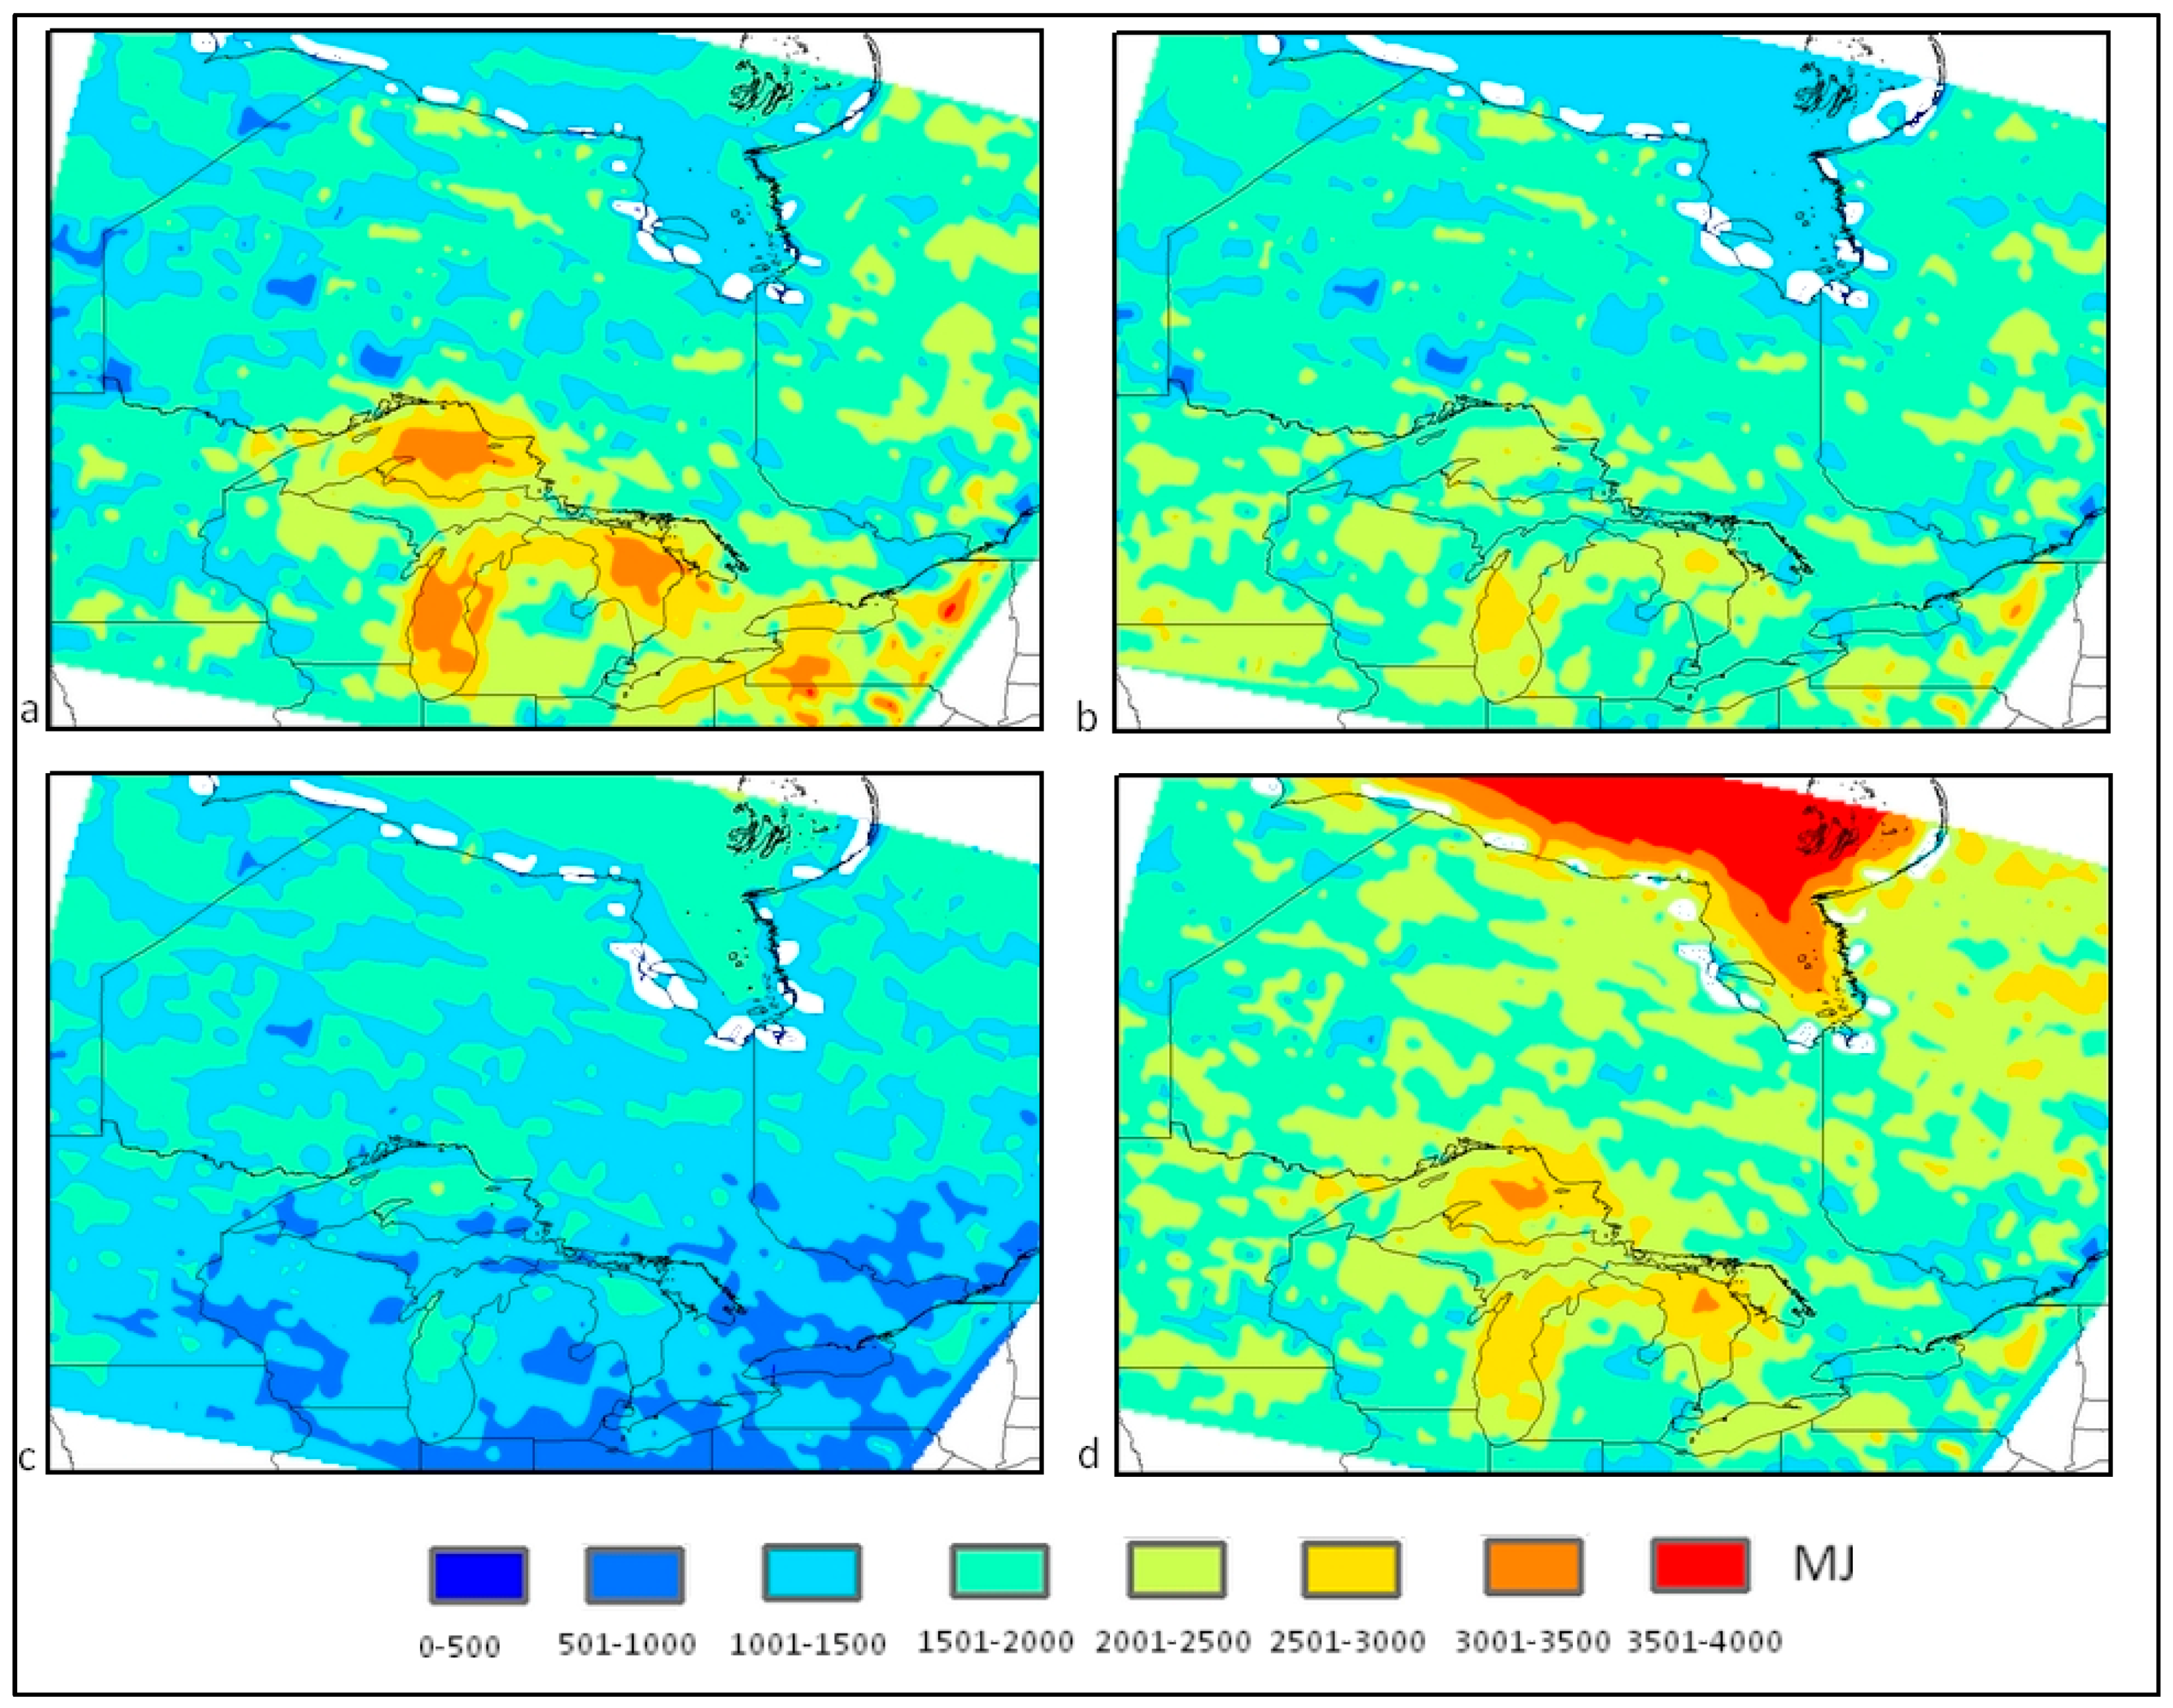
The Bergey turbine produces less electricity around Lakes Erie and Ontario, but Lake Ontario shows more promising yields during the winter by approximately 25% more electrical output. Spring values are regionally less pronounced, with electrical production becoming more uniform across the province and the Lakes have reduced output with regions surrounding the lakes producing a mean of 1000–1200 MJ (megajoules). This pattern of more uniform production is further seen during the summer, where means have fallen to 800 MJ over most of Ontario, with regions around Lake Superior having the highest yields. Northern Ontario benefits in the summer, with regions producing between 1000 and 1200 MJ. Energy output increases in northern Ontario along the Hudson Bay coastline and western James Bay during the fall, with outputs varying in the range 1500–2000 MJ. The Lakes obtain higher yields in the fall with roughly 1500–2000 MJ produced by the Bergey turbine in surrounding areas and yields are fairly evenly distributed amongst the Lakes with Lake Ontario giving slightly lower output. Electrical output patterns are similar at the 30 m hub-height with total energy production being higher, particularly in the winter and fall seasons (Figure 4).
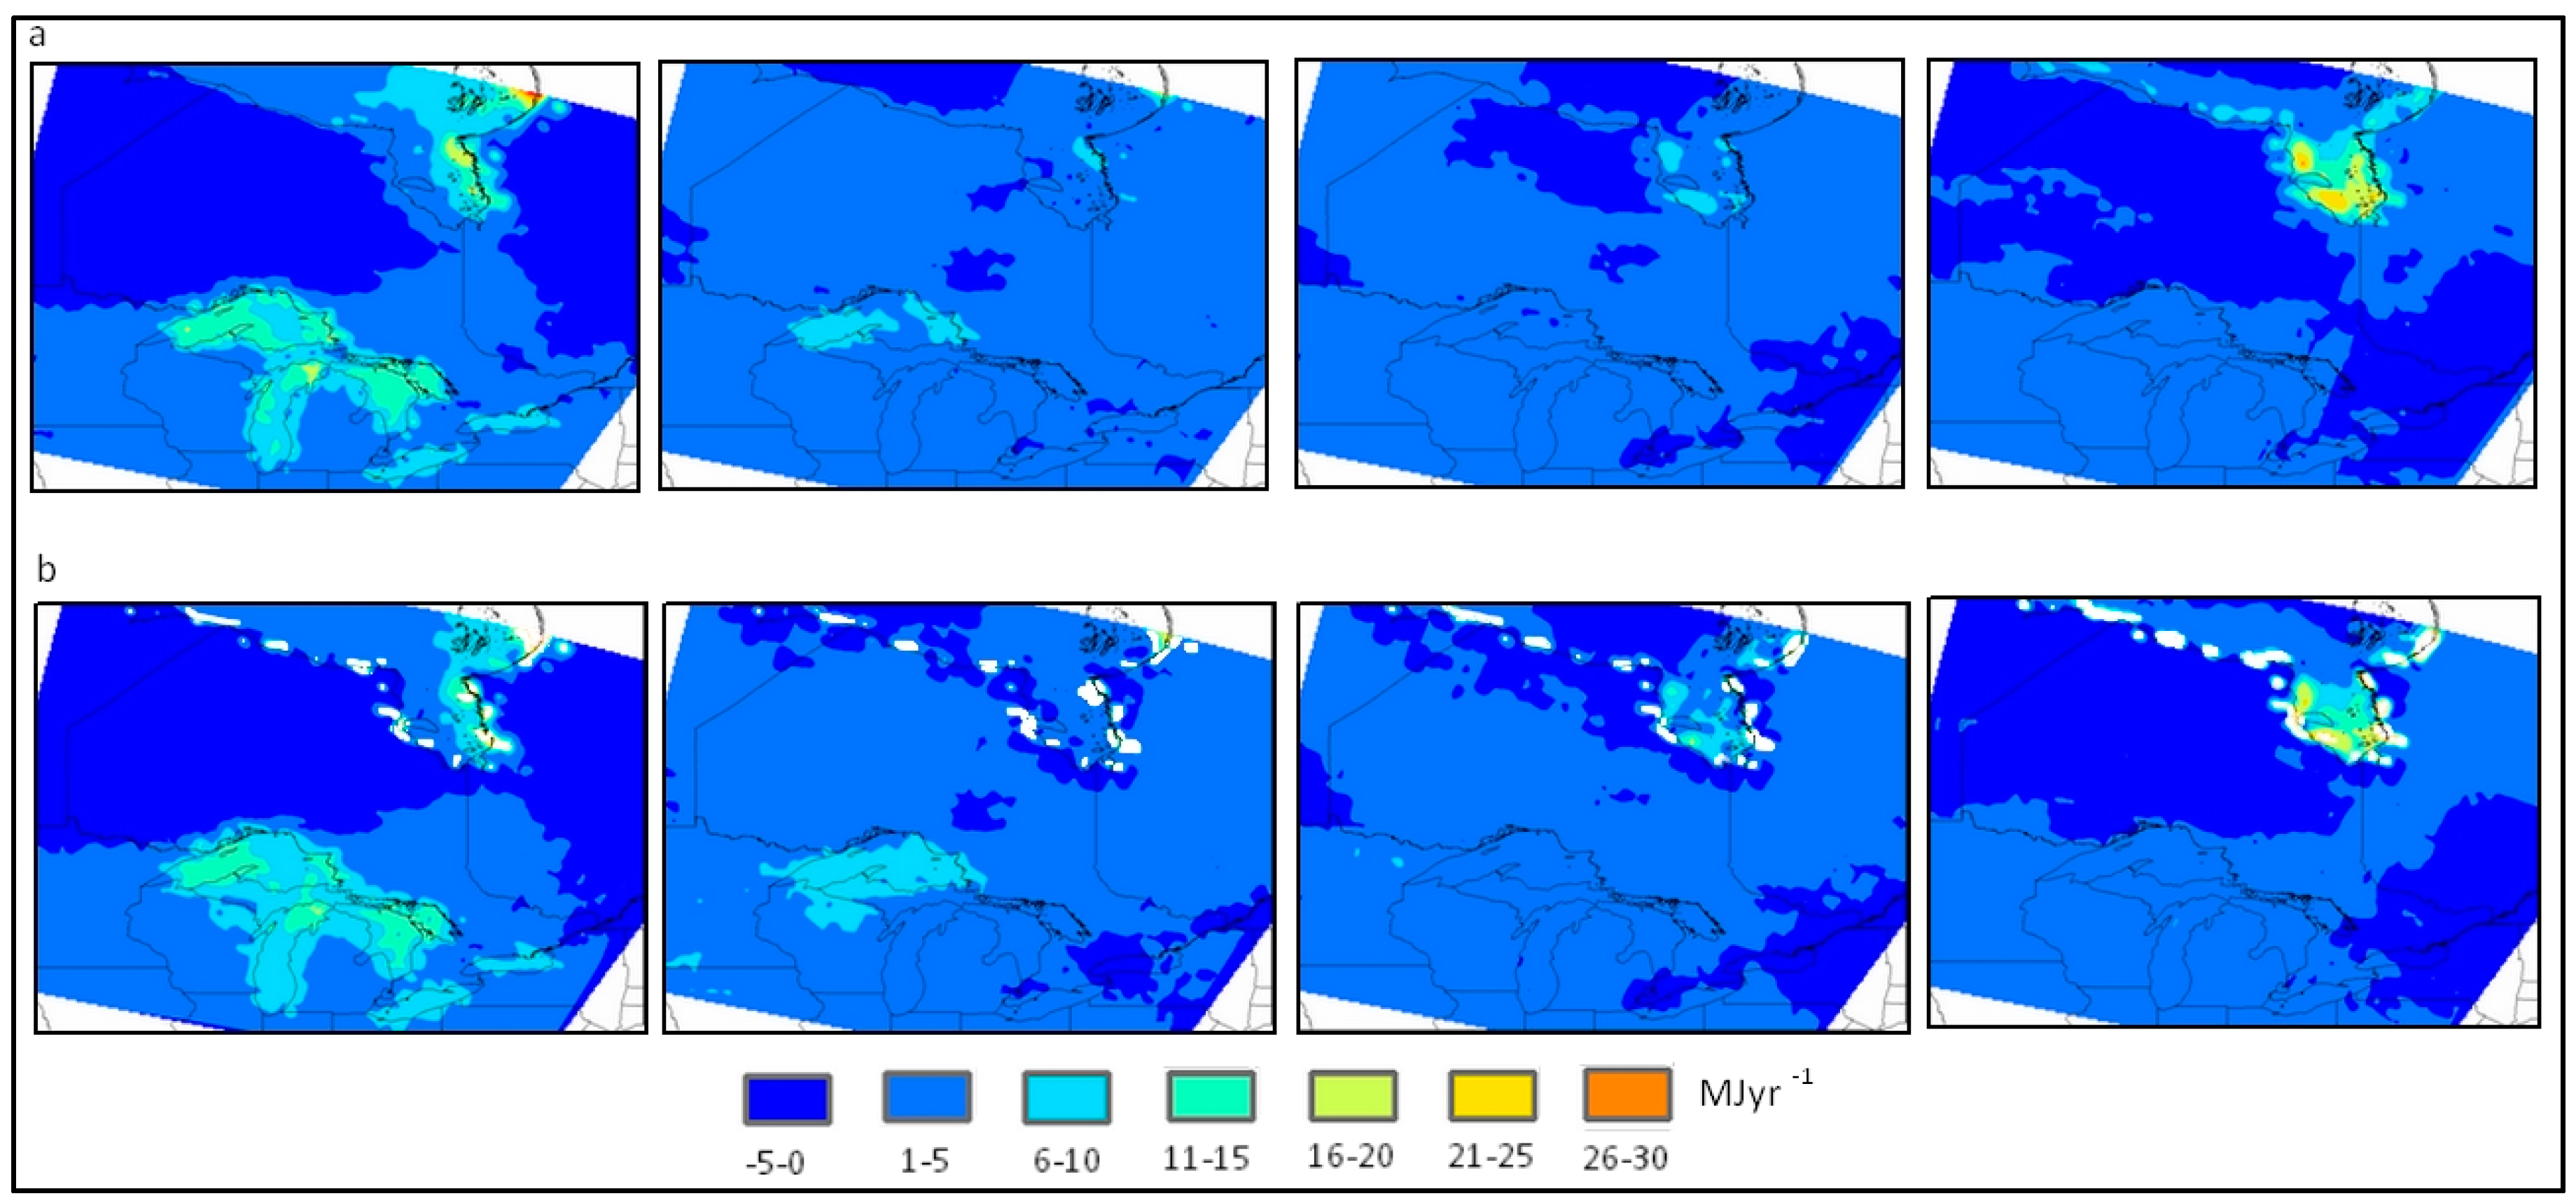
Intuitively, trends in the electrical output closely represent wind speed trends with the largest trends occurring in the winter and fall seasons (Figure 5). Winter can see positive trends in turbine electrical output at 10 m of roughly 7 MJ·year−1 (a five percent decadal increase) over regions close to the Lakes and up to 20 MJ·year−1 along the eastern James Bay coast (20% decadal increase). Fall averages are different with the trends over the Lakes being not as strong (0–5 MJ·year−1), whereas regions over the western James Bay coastline can see trends of 25 MJ·year−1 that translates to a 10% increase over means per decade. Winter trends persist into the spring season but are more limited to Lake Superior and eastern James Bay, whereas summer trends show the highest increases over western James Bay (8 MJ·year−1) and the lower Hudson Bay coastline. Trends at the 30 m hub-height follow a similar pattern but are not as strong as those at 10 m hub-height. The aforementioned trends seen during the winter and fall around the Lakes and James Bay are highly significant (p < 0.005) at both hub-heights.
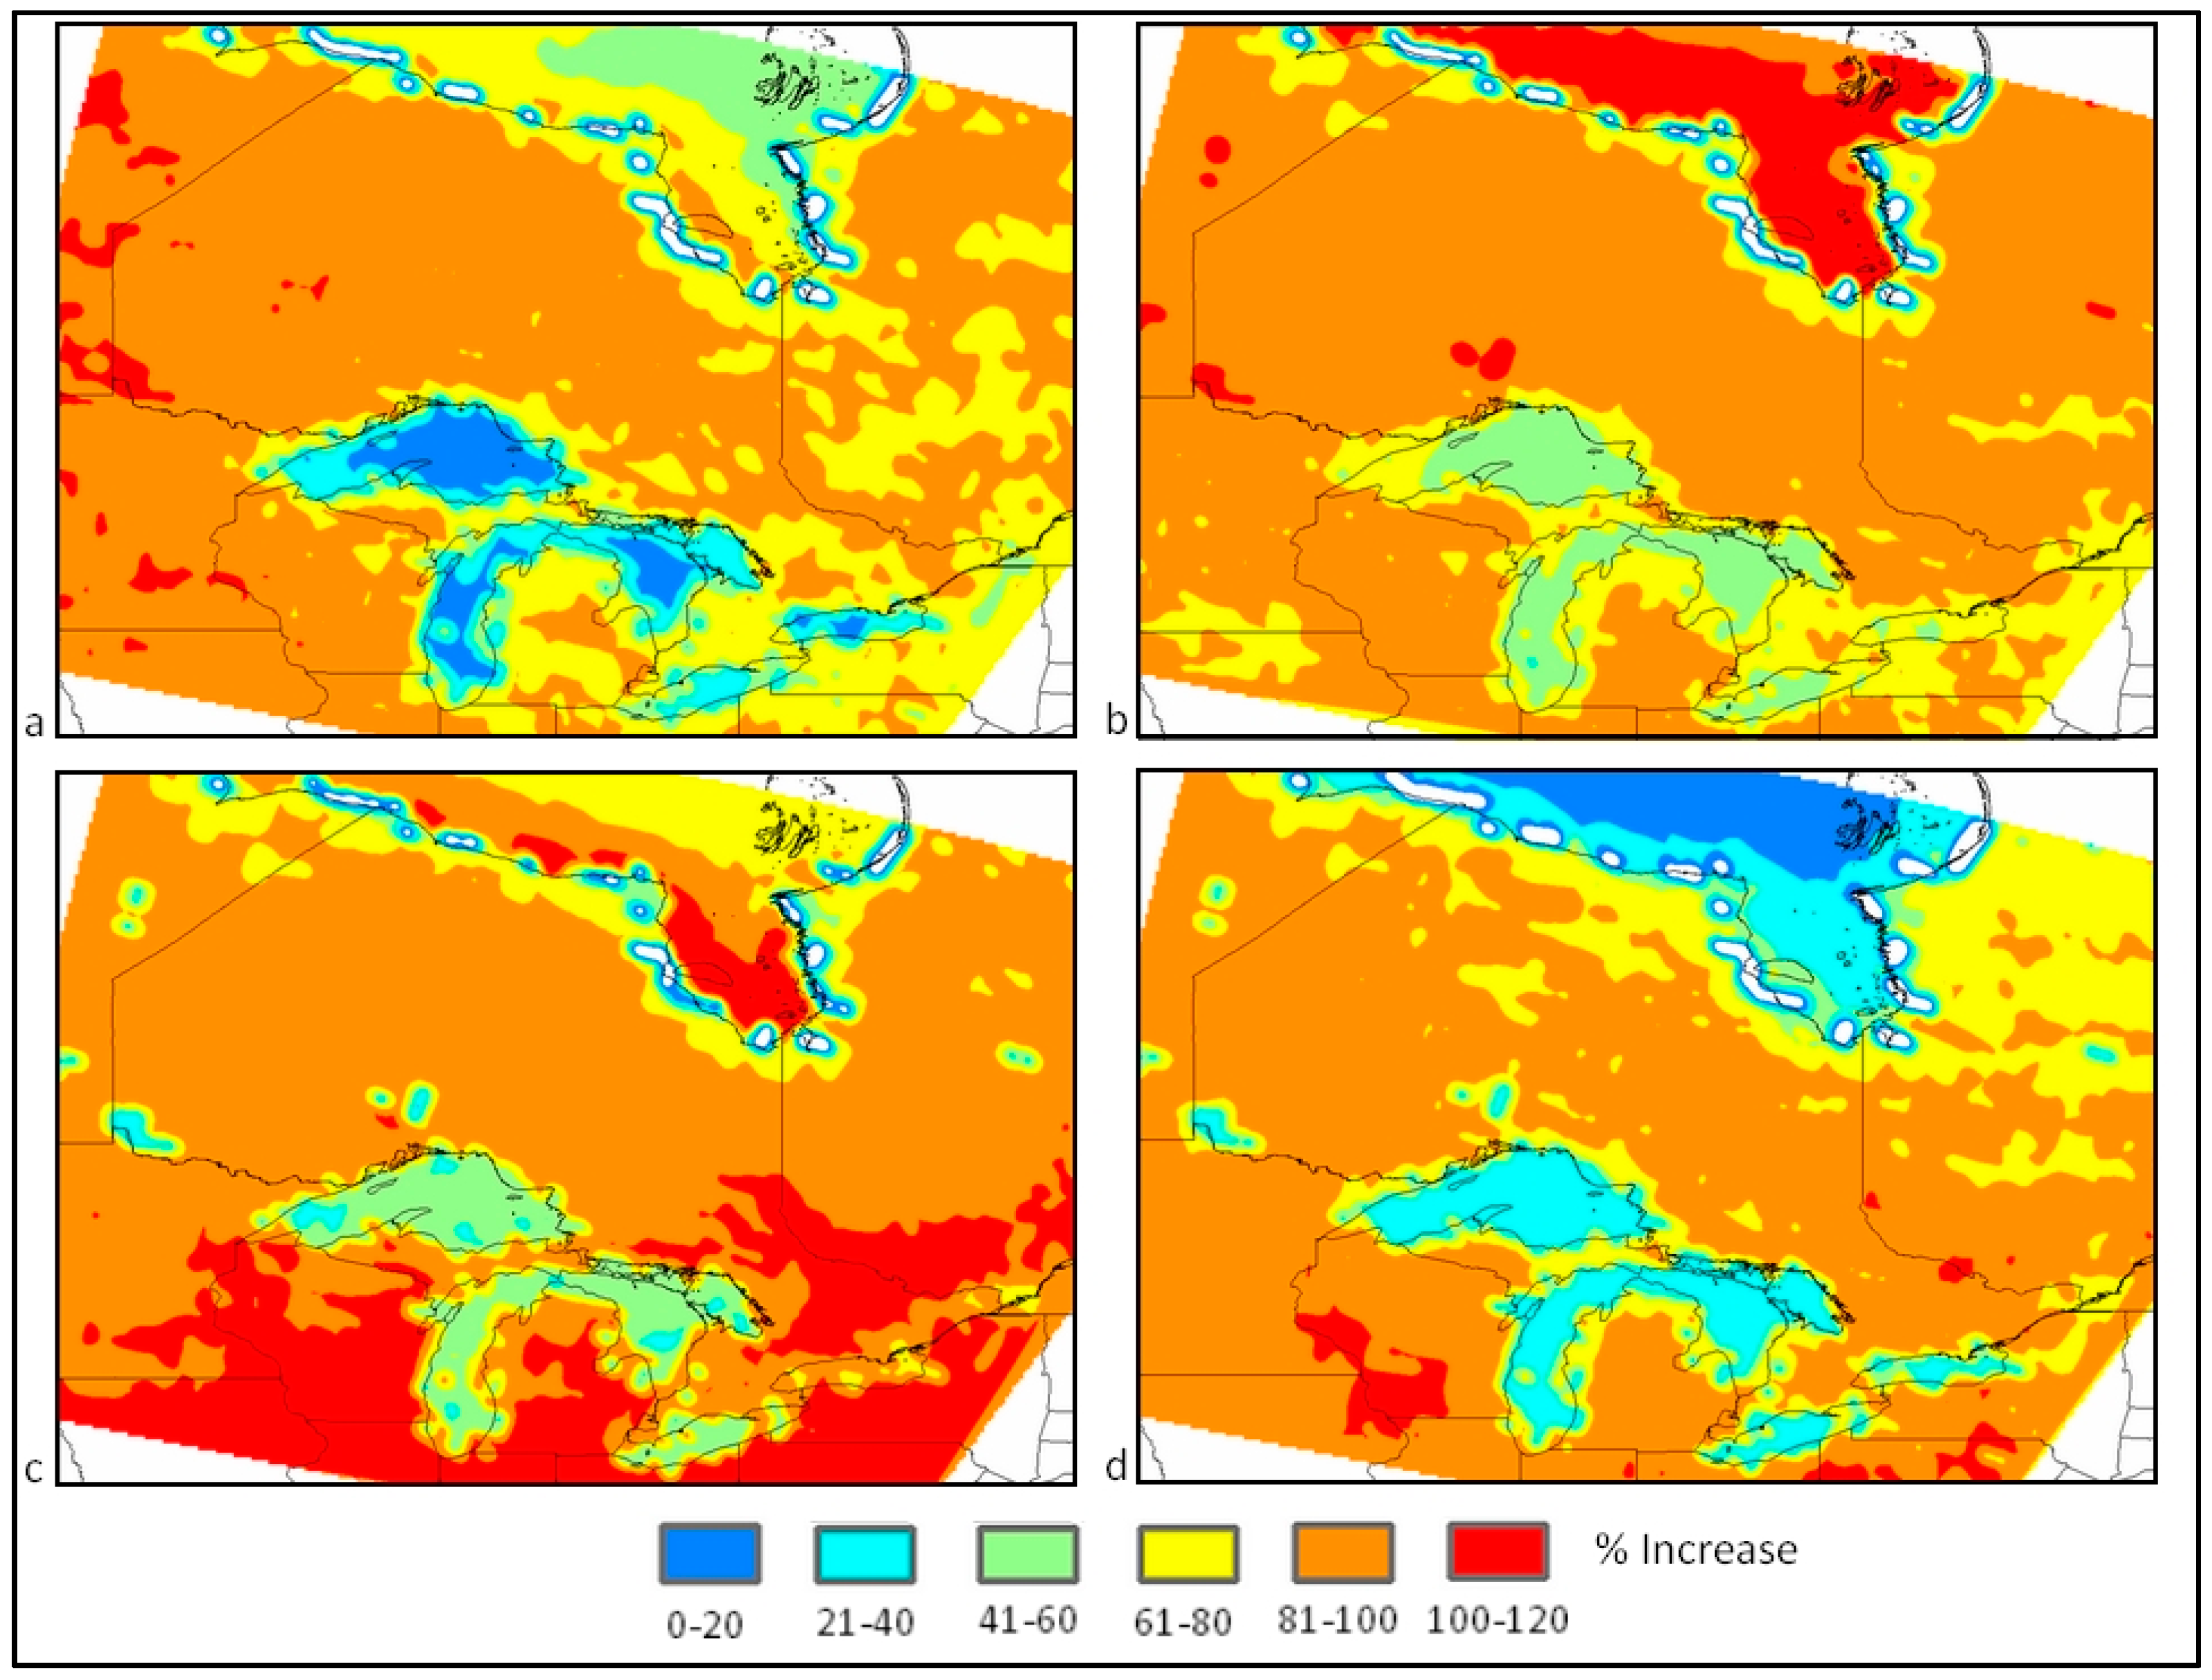
Increasing the hub-height of the Bergey turbine during the winter gives slightly higher output during the winter than in the fall; up to a 100% increase in wind speeds can be experienced over much of Ontario in the winter versus approximately 80% in the fall (Figure 6). Differences in electrical production are much less near the Lakes, with surrounding regions seeing ~60% and 20% over the Lakes themselves. Winter means are slightly lower with height over the Lakes than in the fall. Hub-height increase to 30 m can enhance electrical output by 60%–80% during the spring with less spatial variability across Ontario. The summer season presents a more spatially heterogeneous distribution of power output, as while much of northern and central Ontario experience increases in output by 80% at 30 m, southern Ontario experiences increases in the range 100%–120%, particularly in areas close to Lake Erie and Ontario.
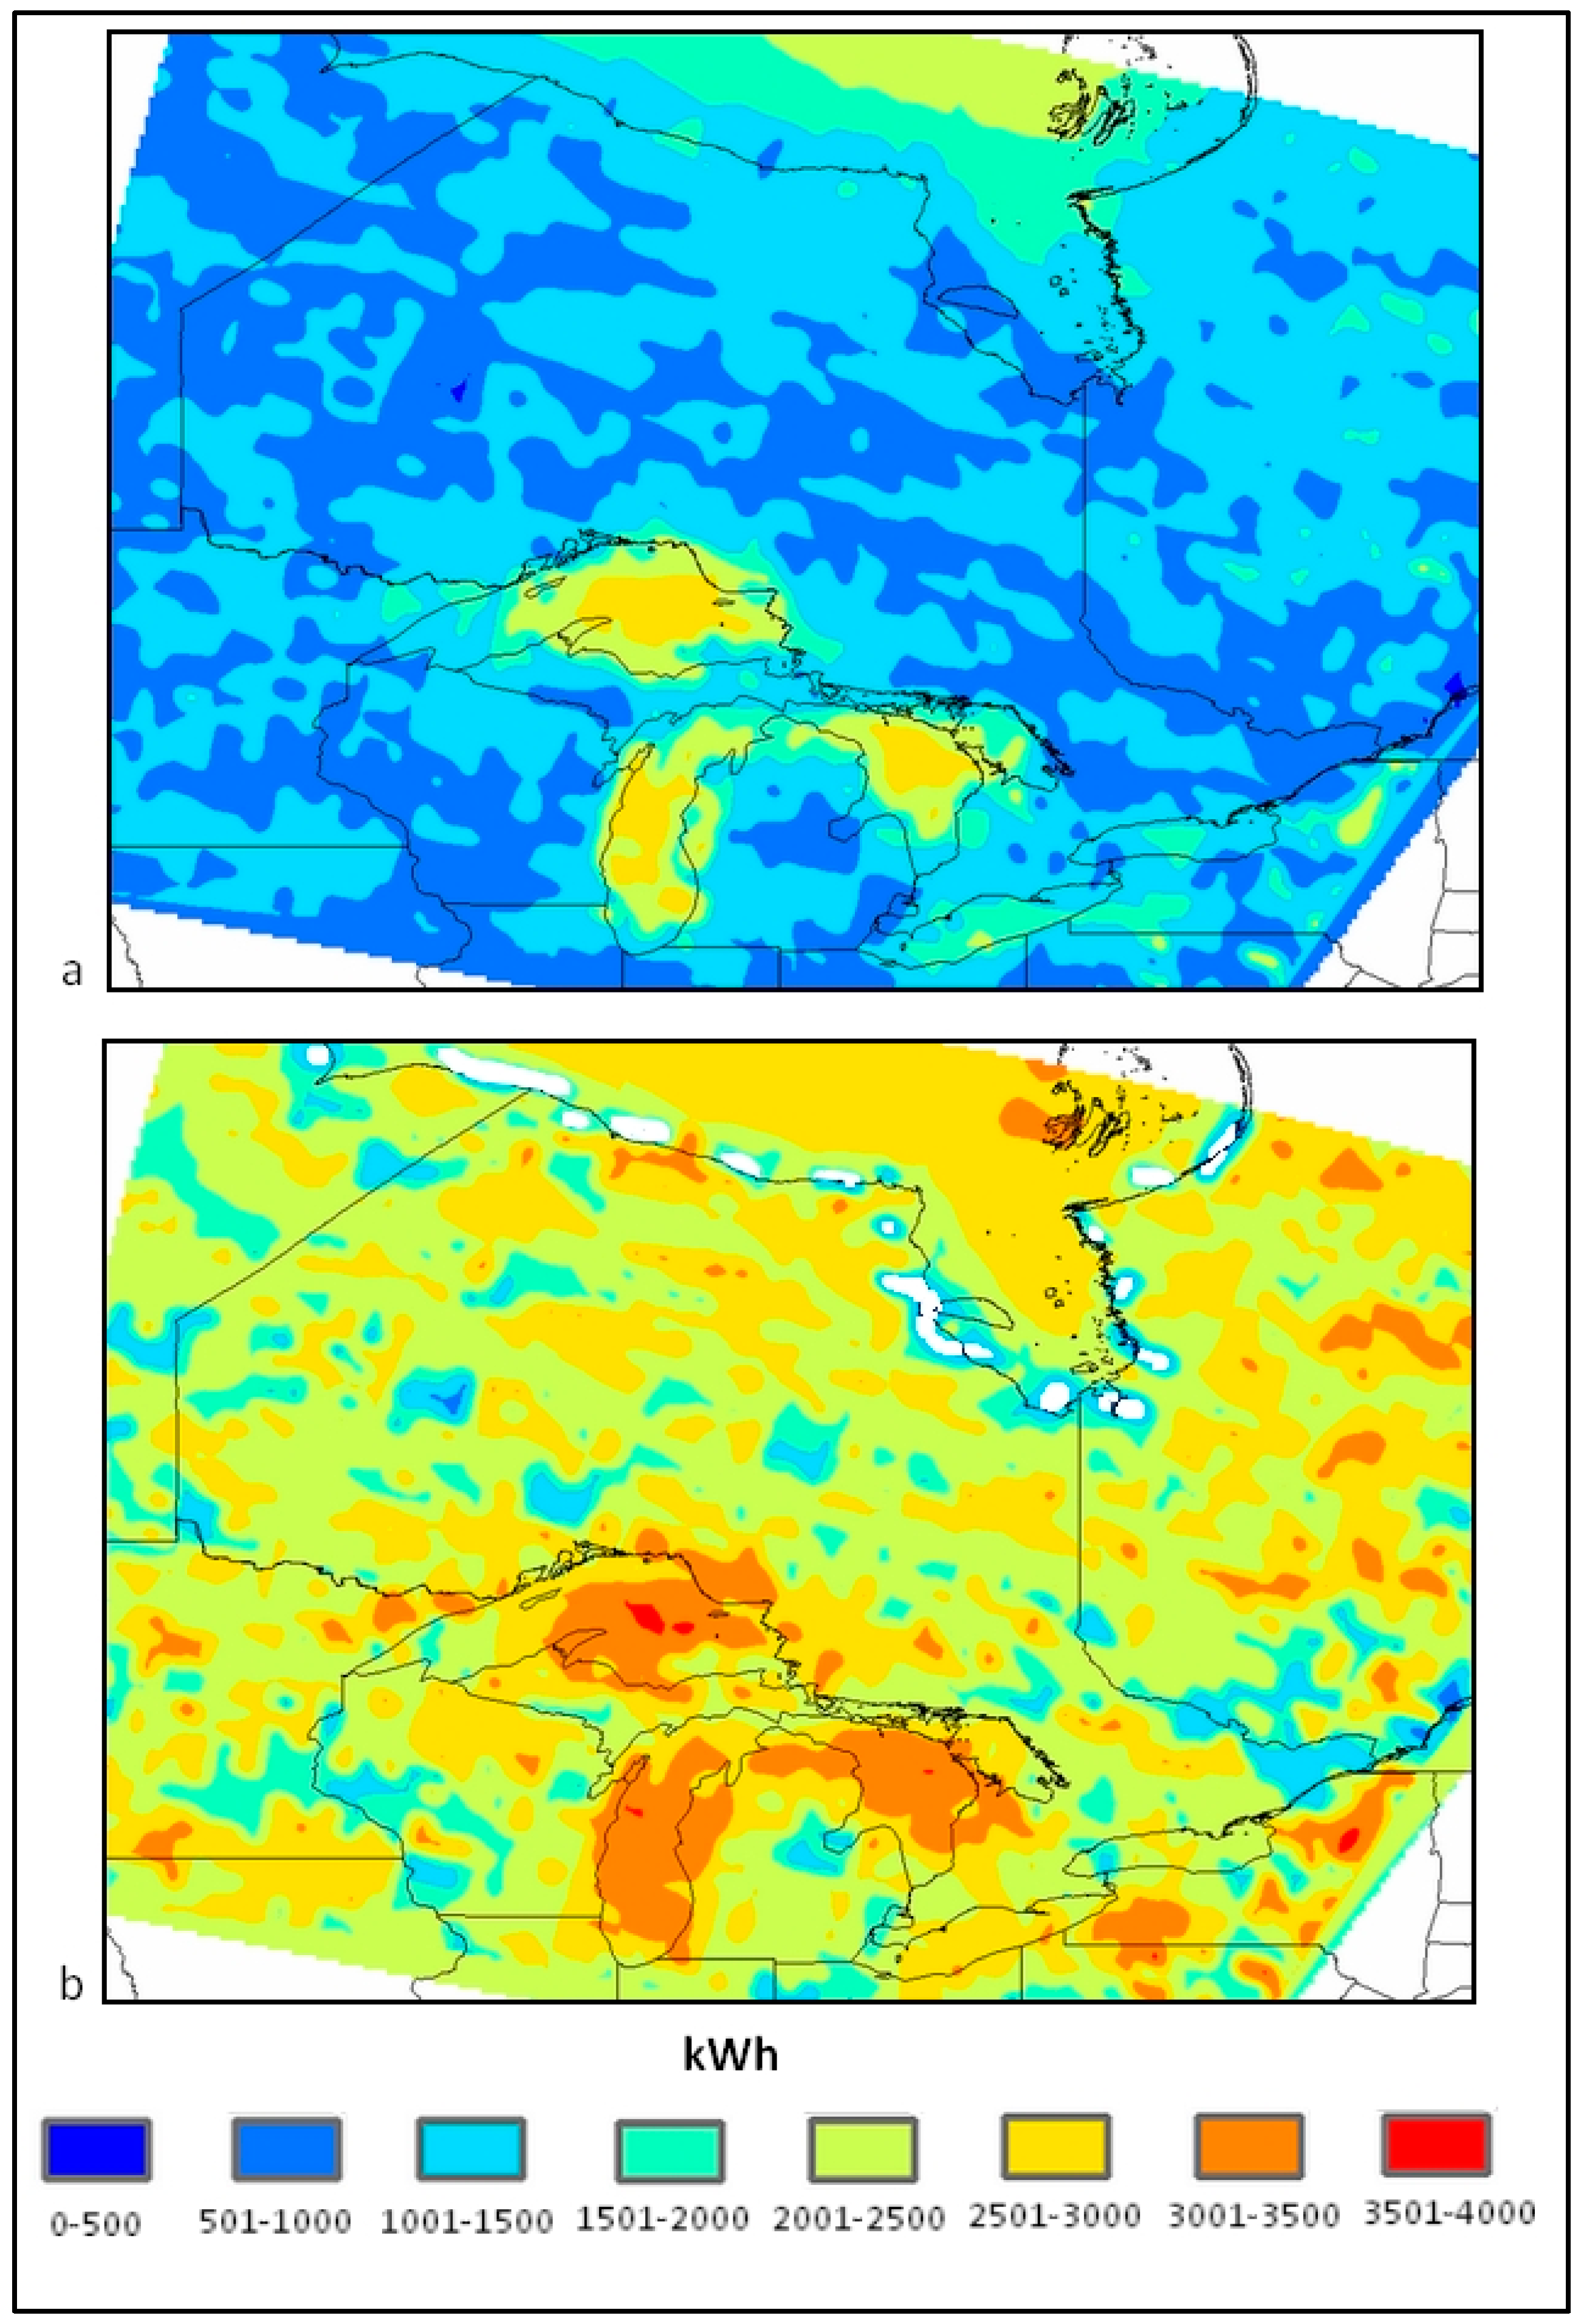
Annual averages (Figure 7) remain consistent in patterns of electrical production for the Bergey 1 kW wind turbine, with regions surrounding the Great Lakes having an annual average of total electrical energy production ~1250 kWh, with central, northern and southern Ontario having averages close to 500–1500 kWh at the 10 m hub-height. Energy production is more evenly produced at the 30 m hub-height, with most of Ontario producing between 2000 and 2500 kWh and regions around the Lakes having higher means in electrical output than regions in central and northern Ontario. When considering the capacity factor of the Bergey 1 kW turbine at 30 m, we can estimate an annual output of 9636 kWh assuming full load operation at 1.1 kW power output. This would suggest that the Bergey turbine would perform at 20.8%–28.5% of its full load production across much of Ontario based on Figure 7. Around the Great Lakes region however, we can see annual production levels increase to 36% of full capacity of the 1 kW wind turbine.

3.2. Seasonal Wind Trends at Hub-Height

Wind speed trends in seasonal mean values show greatest change and highest wind speeds in regions surrounding the Great Lakes and James Bay in northern Ontario at both the 10 and 30 m hub-height. Wind patterns change in distribution and speed when transitioning from large water bodies to land, as the latter landscapes have very distinct properties (such as greater surface friction) that influence the atmosphere above. Changing dynamics in lake/sea ice cover and its respective breakup and reformation dates can influence atmospheric conditions and stability. These changes can lead to varying wind speed over the Great Lakes and James Bay region, with a causal link existing between the observed decline in ice cover over the Great Lakes during the past decades, with an increasing wind speed during transition months (winter and fall) [24,25,26,27].

3.3. Trends in Electrical Output

Consistent with the observed spatio-temporal trends in the wind, turbine output is greatest during the winter and fall seasons, with the winter season seeing high yields in regions surrounding the Great Lakes and James Bay. These yields are expected, owing to the higher trends in the wind speed seen during these seasons. Summer and spring yields are lower due to weakening wind gradients, with spring having higher output for most of Ontario than in summer. It is evident that the majority of electrical energy produced by the turbine is seasonally and spatially dependent; thus, not all of Ontario will benefit from small wind turbine implementation. We note that the southern Ontario region surrounded by Lakes Erie, Huron and Ontario has the highest concentration of utility-scale wind farms in Ontario due to the existence of favourable wind speeds. Analysis in the Waterloo region (southern Ontario) has shown that the windiest months, where wind energy potential is the greatest, are from November to May [10]. It is widely noted that an increase in turbine hub-height increases electrical yields, as faster winds are captured at higher hub-heights, owing to the reduced effect of wind shear from the terrain [28]. Although the same patterns in electrical output by the analyzed Bergey 1 kW wind turbine at the 10 m hub-height also exist at 30 m, the yield is not always spatially and temporally consistent. Increasing the hub-height in the winter can produce up to 100% increase in wind speeds over much of Ontario versus 80% in the fall, as wind gradients are slightly steeper in the winter.
Although the focus of the present study is on small wind turbines and not on offshore production, it is useful to note that the electrical output is increased by 20% over the lakes at the 30 m hub-height versus up to 60% in regions surrounding the lakes. Surface roughness causes winds closer to the terrain to lose more momentum than over water bodies. Furthermore, wind profiles are steeper over the land, and so too is the corresponding wind energy potential [29]. Southern Ontario, particularly regions closer to Lakes Erie and Ontario, would most benefit from increases in hub-height to 30 m, as capturing lake winds can raise yields by 100%–120%. These southern regions will benefit more from turbines of a higher hub-height, potentially reducing the need for more turbines in regions where only 60% increase with hub-height is experienced. With the 10 m hub-height, decadal trends indicate increases in electrical output by approximately 6% over regions close to the lakes and up to 20% along the eastern James Bay coast in the winter. Ontario will most benefit from James Bay trends in the fall, particularly over the western James Bay coastline can see up to 10% increase in mean electrical production per decade. Trends at the 30 m hub-height are not as strong but still suggest a growing supply of wind energy through the winter and fall seasons.
Based on the examination of annually-averaged total electrical output for the Bergey 1 kW at the 10 m hub-height, it is evident that regions that will most benefit from small wind turbine investment in Ontario are those surrounding the Great Lakes, influenced by lake winds, as well as regions along northern Ontario, influenced by strong winds blowing to and from Hudson Bay and James Bay. Based on the NARR wind data, much of Ontario would see an annual power production of 800–1200 kWh at 10 m, while areas surrounding Lake Superior could have high outputs of 1.6 MWh. Power production is more evenly distributed at 30 m, since the influence of surface roughness is reduced at that height, and much of Ontario would see power outputs of approximately 1.5 to 2.3 MWh, with greatest increases in southern Ontario and around the Great Lakes. Using the mean values of 1.5 to 2.3 MWh from much of Ontario at the 30 m hub-height and the reported electrical cost of 8.6 cents CDN/kWh for Ontario as of 1 May 2015, the use of the Bergey 1 kW wind turbine can see an approximate annual saving of CDN $140 to $215 in electrical bills per annum [30]. However, this value is greatly limited by the fluctuating nature of electrical prices and the difference in costs between providers. Having a combination of higher hub-heights and a higher rated output turbine (e.g., 10 kW, 25 kW) will surely increase annual savings.
The Statistics Board of Canada gives an annual Ontario household consumption of 107 GJ from its last household electricity census in 2007. Spatial comparison (10 m hub-height) of the supply of electricity from the Bergey 1 kW wind turbine to the demand of the average Ontarian household shows that the Bergey turbine is most economically viable around the lakes but will only account for up to 6% of annual energy demand (e.g., near Georgian Bay) and approximately 3.5% to 4.5% in southern Ontario, whereas much of Ontario will see this turbine accounting for 2.5%–4% of energy demands (Figure 8). These values are increased at the 30 m hub-height with much of Ontario now experiencing between 5% and 7% of energy demand from the Bergey turbine and regions around Lake Superior can meet energy demands of up to 9%–10% in some regions.
When considering the overall feasibility of small wind turbines across the province, although not assessed within this study, there are also many political and socio-economic influences that can limit/aid the implementation of wind power in more rural communities [32,33]. However, many developing nations have shown the success of wind energy in more remote communities [34,35,36] that lack access to the national grid, owing to a multitude of factors. Small wind turbines not only provide a more reliable power source and free communities from frequent power outages, they also provide a community-oriented approach in the management and procurement of clean energy. Though rural Ontario faces different challenges, small wind turbines will provide a more diverse delivery of energy to meet demands.

4. Conclusions

Wind speed trends during the winter and fall months are the greatest at both hub-heights of 10 and 30 m, with the summer season giving the lowest means. These trends are spatially highly heterogeneous, occurring frequently over the Great Lakes, lower Hudson Bay and James Bay. Much of Ontario experiences statistically insignificant wind speed trends much lower than surrounding water bodies. It is purported that a strong correlation with decreasing lake/sea ice concentrations and increasing wind speeds exists, where loss of sea ice leads to perturbation in both physical and energy balance near the surface, leading to changes in the stability in the atmospheric boundary as suggested by Desai et al [24]. Through turbine analysis, we have postulated that the small wind turbine industry will be most feasible at a higher hub-height of 30 m and utilizing turbines of a higher rated output. Even with a 1 kW wind turbine (<0.001% of most utility-scale wind turbines), annual savings of $140–$215 can be possible for much of Ontario at the 30 m hub-height, contributing to approximately five percent and seven percent of the total provincial energy demand. These statistics, however, are derived from general energy usage averages and apply a basic energy demand to Ontario, whereas true estimates are heterogeneous and not spatially even, as energy demands are surely higher in southern populated regions. The Bergey turbine is rated at only 1 kW output, while other small turbines have commonly rated outputs of 10 kW and 25 kW, and lead to higher power output. Limitations in the estimation of turbine electrical power exist, as power curves are inherently based on data collected and the sample size of such data. However, this study’s analysis produced a power curve that was a good representation of the Bergey manufacturer power curve.

Acknowledgments

The authors are grateful for the financial support of York University, the Toronto Region Conservation Authority, MITACS Accelerate Program and assistance provided by Monica Vaswani and Kristina Delidjakova.

Author Contributions

Masaō Ashtine, Richard Bello and Kaz Higuchi played an important role in the editing and direction of research for this manuscript.

Conflicts of Interest

The authors declare no conflict of interest.

References

  1. Canadian Wind Energy Association (CanWEA). Canadian Wind Energy Market; Canadian Wind Energy Association: Ottawa, ON, Canada, 2012; Available online: http://www.canwea.ca/pdf/canweafactsheet-FedProInitiatives-final.pdf (accessed on 15 July 2015).
  2. Independent Electricity System Operator (IESO). Supply Overview. 2012. Available online: http://www.ieso.ca/imoweb/media/md_supply.asp (accessed on 18 December 2012).
  3. Celik, A.N. Energy output estimation for small-scale wind power generators using Weibull-representative wind data. J. Wind Energy Ind. Aerodyn. 2003, 91, 693–707. [Google Scholar] [CrossRef]
  4. Lubitz, D.W. Impact of ambient turbulence on performance of a small wind turbine. Renew. Energy 2012. [Google Scholar] [CrossRef]
  5. Matsushima, T.; Takagi, S.; Muroyama, S. Characteristics of a highly efficient propeller type small wind turbine with a diffuser. Renew. Energy 2006, 31, 1343–1354. [Google Scholar] [CrossRef]
  6. Eggers, A.J. Modeling of yawing and furling behavior of small wind turbines. In Proceedings of the 2000 19th ASME Wind Energy Symposium and 38th AIAA Aerospace Sciences Meeting and Exhibit, Reno, NV, USA, 10–13 January 2000.
  7. Bechly, M.E.; Clausen, P.D.; Lindeyer, J.; Wood, D.H. The Fort Scratchley wind turbine. In Proceedings of the 35th ANZSES Conference, Canberra, Australia, 1–3 December 1997.
  8. Bose, N. Icing on a small horizontal-axis wind turbine—Part 1: Glaze ice profiles. J. Wind Eng. Ind. Aerodyn. 1992, 45, 75–85. [Google Scholar] [CrossRef]
  9. Högström, U. Non-dimensional wind and temperature profiles in the atmospheric surface layer: A re-evaluation. Bound. Layer Meteorol. 1988, 42, 55–78. [Google Scholar] [CrossRef]
  10. Li, M.; Li, X. Investigation of wind characteristics and assessment of wind energy potential for Waterloo region, Canada. Energy Convers. Manag. 2005, 46, 3014–3033. [Google Scholar] [CrossRef]
  11. Reyers, M.; Moemken, J.; Pinto, J.G. Future changes of wind energy potentials over Europe in a large CMIP5 multi-model ensemble. Int. J. Climatol. 2016, 36, 783–796. [Google Scholar] [CrossRef]
  12. Pryor, S.C.; Barthelmie, R.J. Assessing the vulnerability of wind energy to climate change and extreme events. Clim. Chang. 2013, 121, 79–91. [Google Scholar] [CrossRef]
  13. Akpinar, E.K.; Akpinar, S. An assessment on seasonal analysis of wind energy characteristics and wind turbine characteristics. Energy Convers. Manag. 2005, 46, 1848–1867. [Google Scholar] [CrossRef]
  14. Mesinger, F.; di Mego, G.; Kalnay, E.; Mitchell, K.; Shafran, P.C.; Ebisuzaki, W.; Jovic, D.; Woollen, J.; Rogers, E.; Berbery, E.H.; et al. North American regional reanalysis: A long-term, consistent, high-resolution climate dataset for the North American domain, as a major improvement upon the earlier global reanalysis datasets in both resolution and accuracy. Bull. Am. Meteorol. Soc. 2006, 87, 343–360. [Google Scholar] [CrossRef]
  15. Mesinger, F.; Janjić, Z.I.; Nicković, S.; Gavrilov, D.; Deaven, D.G. The step-mountain coordinate: Model description and performance for cases of Alpine lee cyclogenesis and for a case of an Appalachian redevelopment. Mon. Weather Rev. 1988, 116, 1493–1518. [Google Scholar] [CrossRef]
  16. Janjić, Z.I. The step-mountain Eta coordinate model: Further developments of the convection, viscous sublayer, and turbulence closure schemes. Mon. Weather Rev. 1994, 122, 927–945. [Google Scholar] [CrossRef]
  17. Black, T.L. The Step-Mountain Eta Coordinate Regional Model: A Documentation; NOAA/NWS National Meteorological Center: Camp Springs, MD, USA, 1988; p. 47. [Google Scholar]
  18. Regional Reanalysis Questions and Answers. Available online: http://www.emc.ncep.noaa.gov/mmb/rreanl/faq.html#zero-30m-wind (accessed on 10 April 2016).
  19. Van den Berg, G.P. Wind turbine power and sound in relation to atmospheric stability. Wind Energy 2008, 11, 151–169. [Google Scholar] [CrossRef]
  20. Wharton, S.; Lundquist, J.K. Atmospheric stability affects wind turbine power collection. Environ. Res. Lett. 2012, 7. [Google Scholar] [CrossRef]
  21. Ashtine, M.I.; Bello, R.; Higuchi, K. Assessment of wind energy potential over Ontario and Great Lakes using the NARR data: 1980–2012. Renew. Sustain. Energy Rev. 2016, 56, 272–282. [Google Scholar] [CrossRef]
  22. Seitzler, M. The Electrical and Mechanical Performance Evaluation of a Roof Mounted, One-Kilowatt Wind Turbine; Report CWEC-2009-003; California Wind Energy Collaborative, University of California: Davis, CA, USA, 2009. [Google Scholar]
  23. Summerville, B. Small Wind Turbine Performance in Western North Carolina; Appalachian State University: Boone, NC, USA, 2005; Available online: http://www.wind.appstate.edu/reports/researcharticlesmallwindperformanceBJS (accessed on 3 December 2012).
  24. Desai, A.R.; Austin, J.A.; Bennington, V.; McKinley, G.A. Stronger winds over a large lake in response to weakening air-to-lake temperature gradient. Nat. Geosci. 2009, 2, 855–858. [Google Scholar] [CrossRef]
  25. Gagnon, A.S.; Gough, W.A. Climate change scenarios for the Hudson Bay Region: An inter-model comparison. Clim. Chang. 2005, 69, 269–297. [Google Scholar] [CrossRef]
  26. Cole, J.J.; Prairie, Y.T.; Caraco, N.F.; McDowell, W.H.; Tranvik, L.J.; Striegl, R.G.; Duarte, C.M.; Kortelainen, P.; Downing, J.A.; Middelburg, J.J.; et al. Plumbing the global carbon cycle: Integrating inland waters into the terrestrial carbon budget. Ecosystems 2007, 10, 172–185. [Google Scholar] [CrossRef]
  27. Austin, J.A.; Colman, S.M. A century of temperature variability in Lake Superior. Limnol. Oceanogr. 2008, 53, 2724–2730. [Google Scholar] [CrossRef]
  28. Lu, L.; Yang, H.; Burnett, J. Investigation on wind power potential on Hong Kong islands—An analysis of wind power and wind turbine characteristics. Renew. Energy 2002, 27, 1–12. [Google Scholar] [CrossRef]
  29. Hicks, B.B. Wind profile relationships from the ‘Wangara’ experiment. Q. J. R. Meteorol. Soc. 1976, 102, 535–551. [Google Scholar]
  30. Ontario Hydro. Ontario Hydro Electricity Rates. Available online: http://www.hydroone.com/MyHome/MyAccount/UnderstandMyBill/Pages/ElectricityRates.aspx (accessed on 16 June 2015).
  31. Statistics Canada. Households and the Environment: Energy Use. Available online: http://www.statcan.gc.ca/pub/11-526-s/2010001/part-partie1-eng.htm (accessed on 16 June 2015).
  32. Ek, K.; Persson, L.; Johansson, M.; Waldo, A. Location of Swedish wind power—Random or not? A quantitative analysis of differences in installed wind power capacity across Swedish municipalities. Energy Policy 2013, 58, 135–141. [Google Scholar] [CrossRef]
  33. Toke, D.; Breukers, S.; Wolsink, M. Wind power deployment outcomes: How can we account for the differences? Renew. Sustain. Energy Rev. 2008, 12, 1129–1147. [Google Scholar] [CrossRef]
  34. Saheb-Koussa, D.; Haddadi, M.; Belhamel, M. Economic and technical study of a hybrid system (wind–photovoltaic–diesel) for rural electrification in Algeria. Appl. Energy 2009, 86, 1024–1030. [Google Scholar] [CrossRef]
  35. Byrne, J.; Zhou, A.; Shen, B.; Hughes, K. Evaluating the potential of small-scale renewable energy options to meet rural livelihoods needs: A GIS-and lifecycle cost-based assessment of Western China’s options. Energy Policy 2007, 35, 4391–4401. [Google Scholar] [CrossRef]
  36. Byrne, J.; Shen, B.; Wallace, W. The economics of sustainable energy for rural development: A study of renewable energy in rural China. Energy Policy 1998, 26, 45–54. [Google Scholar] [CrossRef]
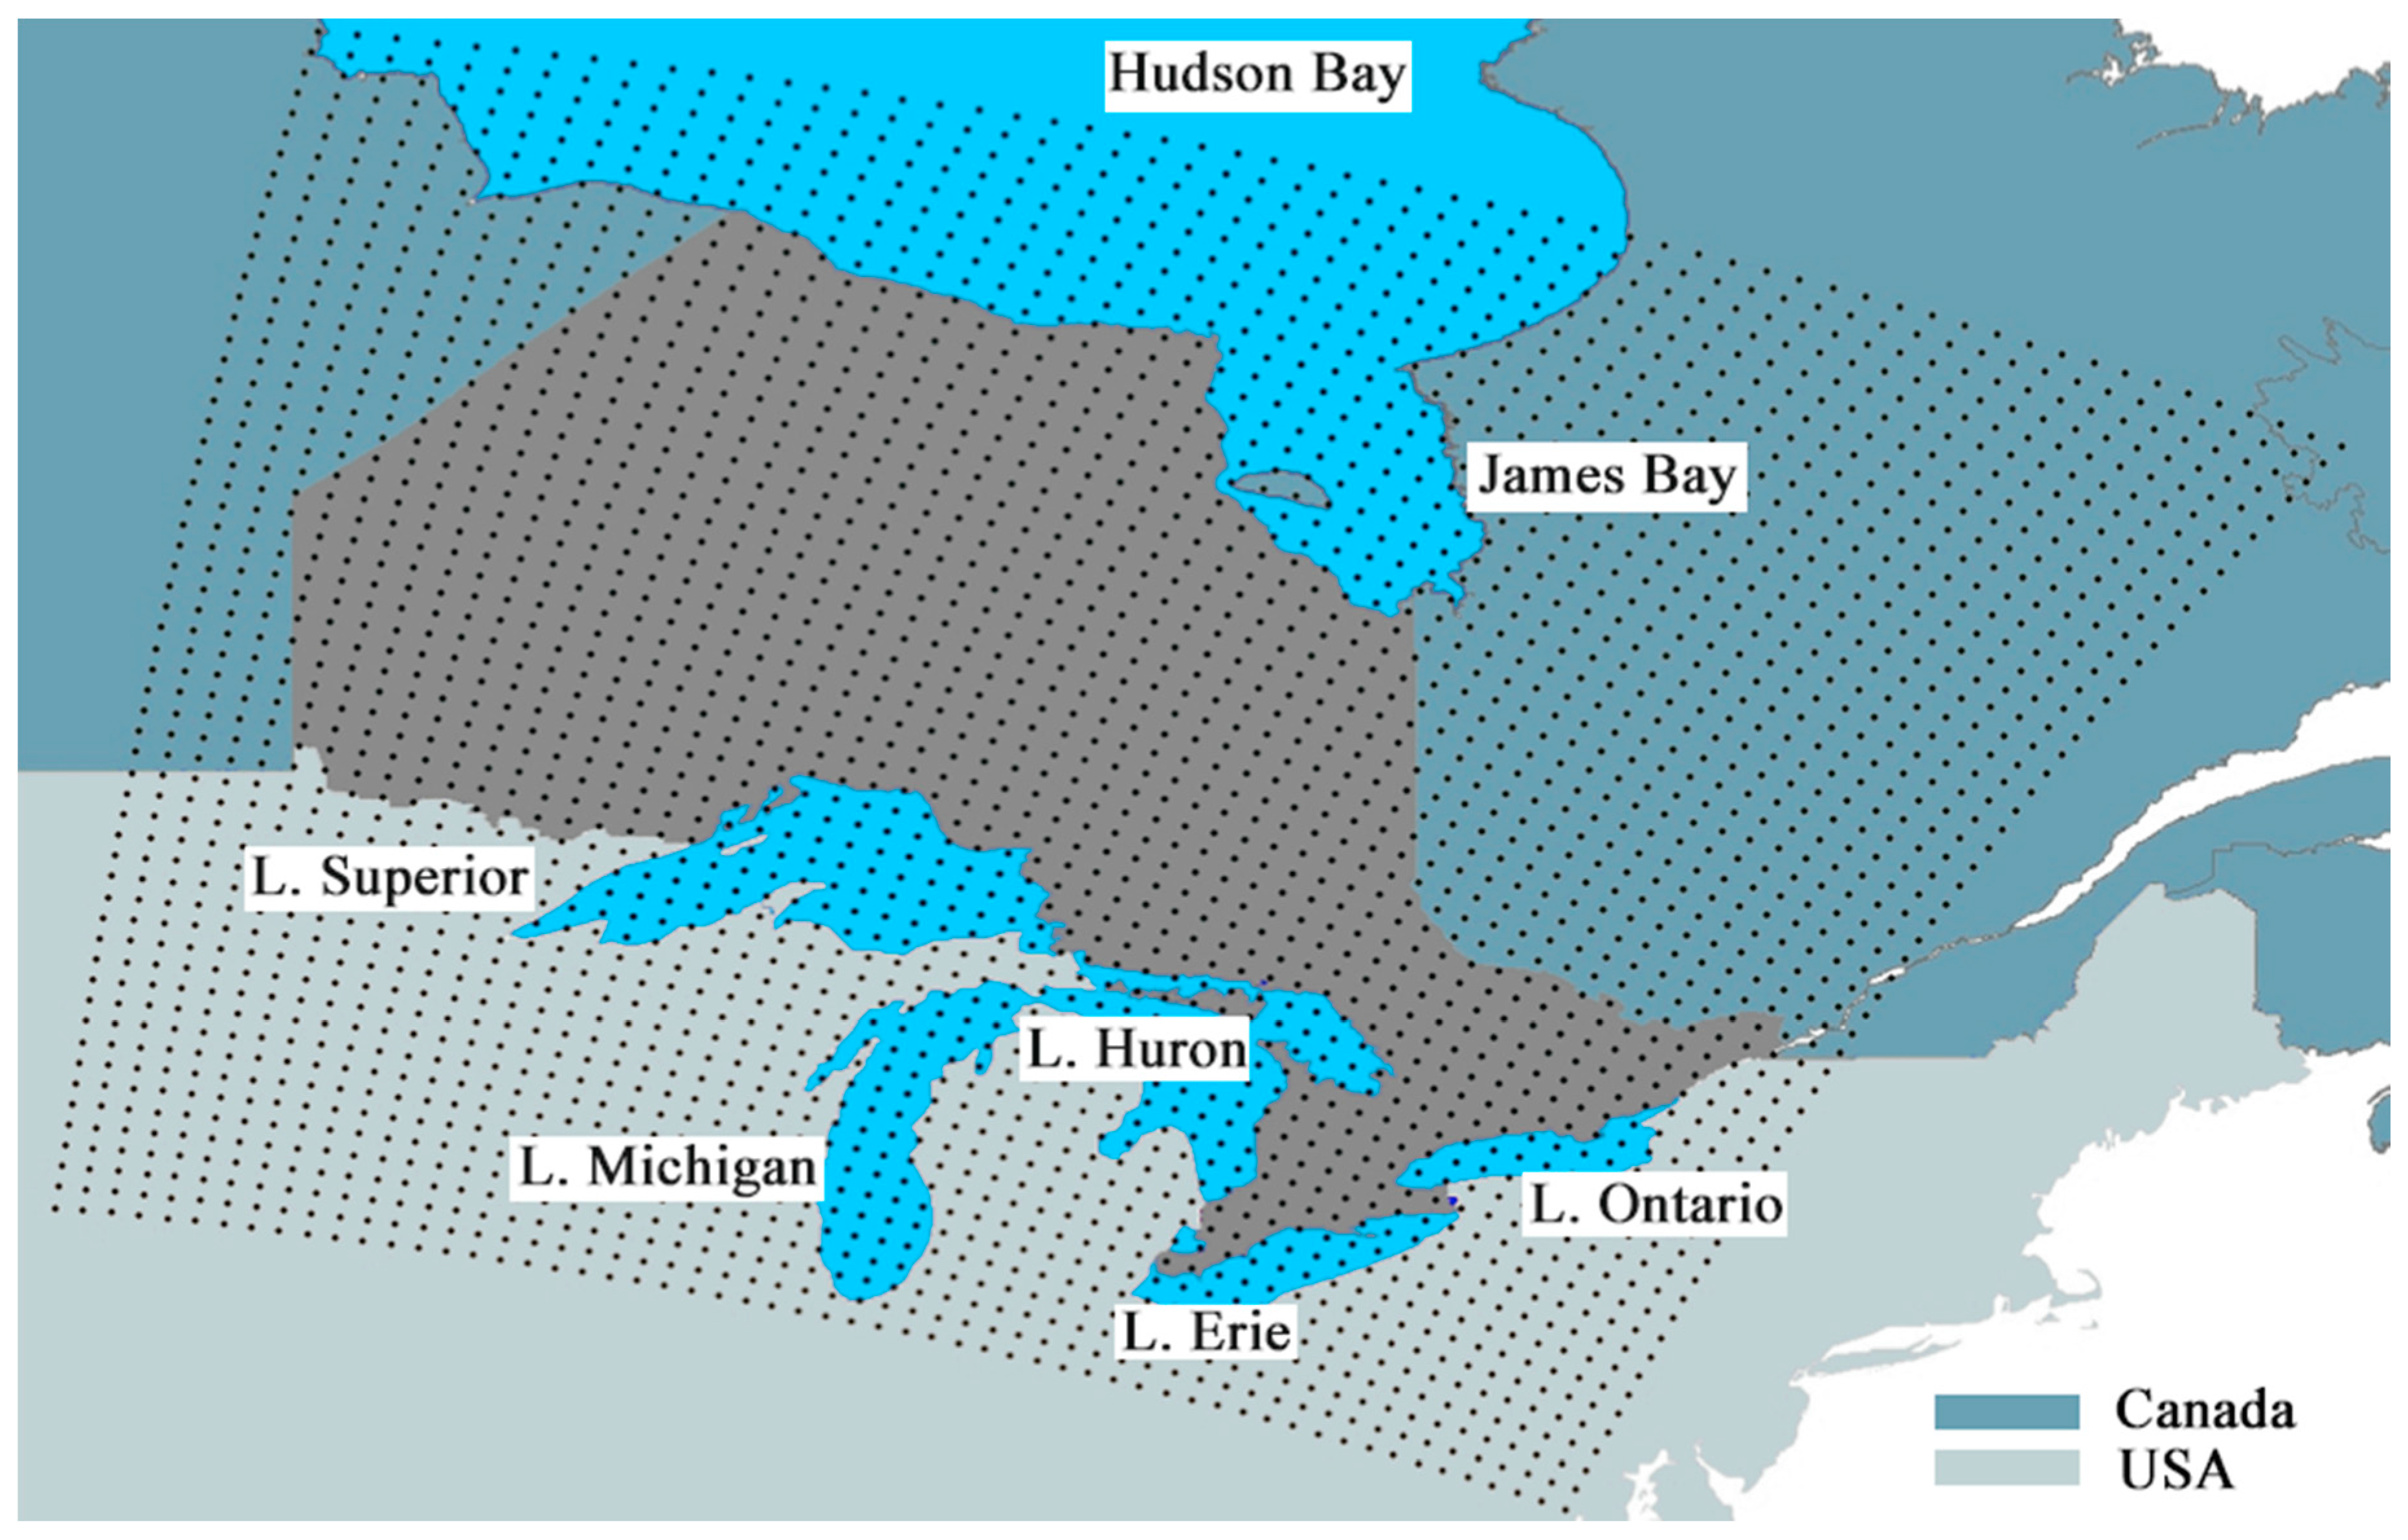
Figure 1. Ontario (dark grey) with surrounding Great Lakes to the south, and James Bay and Hudson Bay to the north. North American Regional Reanalysis (NARR) grid cells have been superimposed (dots).
Resources 05 00044 g001
Figure 2. Computed power curve for the Bergey Excel 1 kW small wind turbine. Data were collected between November 2012 and April 2013. Winds above 12 m·s−1 were not common at the site but the power curve reached its rated power at ~11.5 m·s−1 and thus gave enough information to implement within climate data.
Resources 05 00044 g002
Figure 3. Seasonal total mean turbine energy output (MJ) for the Bergey Excel 1 kW wind turbines for study area at 10 m for (a) winter (b) spring (c) summer (d) fall.
Resources 05 00044 g003
Figure 4. Seasonal total mean turbine energy output (MJ) for the Bergey Excel 1 kW wind turbines for study area at 30 m for (a) winter; (b) spring; (c) summer; (d) fall. Coastal regions in white have been omitted due to coding error at the 30 m hub height.
Resources 05 00044 g004
Figure 5. Multi-year trends in seasonal total mean turbine energy output (MJ) for the Bergey Excel 1 kW wind turbines for study area at (a) 10 m and (b) 30 m for winter, spring, summer, fall from left to right respectively. Coastal regions in white have been omitted due to coding error at the 30 m hub height.
Resources 05 00044 g005
Figure 6. Seasonal differences in turbine electrical output for the Bergey Excel 1 kW wind turbine between the 10 m and 30 m height for (a) winter; (b) spring; (c) summer; (d) fall. Values express the percent increase in turbine output as hub height increases to 30 m. Coastal regions in white have been omitted due to coding error at the 30 m hub height.
Resources 05 00044 g006
Figure 7. Annual total mean turbine energy output (kWh) for the Bergey Excel 1 kW wind turbine for (a) 10 m and (b) 30 m hub heights. Coastal regions in white have been omitted due to coding error at the 30 m hub height.
Resources 05 00044 g007
Figure 8. Annual percentage of energy demands met for an average Ontarian household by the Bergey Excel 1 kW wind turbine for (a) 10 m and (b) 30 m hub heights. The average annual energy demand for a household in Toronto is reported as 107 GJ [31]. Coastal regions in white have been omitted due to coding error at the 30 m hub height.
Resources 05 00044 g008
Table 1. Wind turbine specifications for the Bergey turbine at the Kortright field-testing site. Information obtained from manufacturer description.
StructuralHub-height17.37 m
Turbine typeHAWT, upwind
Manufacturer RatingRated Power1 kW
Rated Wind Speed11 m·s−1
Rotor SpecificsRotor Diameter2.5 m
Swept Area4.91 m2
Rotor Speed (RPM)490 (rated rotor speed, no range applied)
Blade MaterialPultruded fiberglass
WindCut-in Wind Speed2.5 m·s−1
Cut-out Wind Speed25 m·s−1
Max Design Wind Speed54 m·s−1
ProtectionFurling Wind Speed13 m·s−1
Over-speed protectionAuto tail furl, electrical breaking system