1. Introduction
Hydrogen technologies are expected to play an important role in low-emission energy systems, particularly in applications where direct electrification is difficult. Proton exchange membrane (PEM) electrolyzers can produce hydrogen using electricity and water, while PEM fuel cells can convert hydrogen into electricity for transportation, stationary power, backup power, and other end-use applications [
1,
2]. These technologies offer advantages such as high power density, fast dynamic response, compact system design, and compatibility with variable renewable electricity [
1]. However, their dependence on platinum-group metals (PGMs), particularly iridium (Ir) in PEM electrolyzers and platinum (Pt) in PEM fuel cells, creates potential material-supply constraints to hydrogen technology scale-up.
Ir and Pt supply risks arise from both geological and market concentration [
3]. Ir is produced mainly as a by-product of platinum-group-metal mining, and its annual primary supply is very small relative to the potential demand implied by large-scale PEM electrolyzer deployment [
4,
5,
6,
7]. Pt supply is larger than Ir supply, but it is also geographically concentrated and exposed to competing demand from auto-catalysts, chemical catalysts, petroleum refining, electronics, jewelry, and other industrial applications [
5,
8,
9,
10]. These supply-chain characteristics make PGM availability an important consideration for hydrogen technology deployment, especially if PEM electrolyzers and PEM fuel cells expand rapidly through mid-century.
End-of-life recovery could reduce some of this material pressure by returning Ir and Pt from retired PEM systems to secondary material supply. In PEM electrolyzers, Ir is concentrated mainly in the anode catalyst layer, where it supports the oxygen evolution reaction under acidic and oxidative conditions, while Pt is used at the cathode for the hydrogen evolution reaction [
1,
6,
7]. In PEM fuel cells, Pt is used in the membrane-electrode assembly catalyst layers, especially at the cathode where the oxygen reduction reaction is kinetically slower than hydrogen oxidation [
1]. Because these catalyst-bearing components contain the recoverable PGMs, end-of-life PEM stacks represent a potential source of secondary Ir and Pt if they can be collected, dismantled, processed, and refined through appropriate recycling pathways.
Previous studies have highlighted Ir supply risk, Pt demand, catalyst-thrifting needs, and PGM recycling opportunities for hydrogen technologies. Minke et al. [
6] emphasized that Ir demand could become a bottleneck for large-scale PEM water electrolysis, while Clapp et al. [
7] highlighted the importance of Ir catalyst development and material-efficiency strategies under future electrolyzer growth. Rasmussen et al. [
8] used dynamic material-flow analysis to examine Pt demand and possible bottlenecks in the global green transition. Other studies have evaluated Pt recovery techniques for fuel-cell catalysts and circular-economy strategies for PGM-bearing materials [
11,
12]. More recent work has also assessed PEM electrolyzer and fuel-cell recycling pathways from technical, economic, and environmental perspectives [
13,
14].
Despite this growing literature, the timing and magnitude of secondary Ir and Pt availability from end-of-life PEM technologies remain uncertain. Recycling potential depends not only on technical recovery efficiency, but also on annual PEM capacity inputs, catalyst loading rates, lifetime distributions, collection efficiency, processing losses, recycling delay, and the allocation of recovered PGMs across competing markets. These factors are especially important because recovered material does not become available at the time of installation and may not return automatically to PEM applications. Therefore, PEM recycling should be evaluated as one component of a broader critical-material management strategy rather than as an automatic closed-loop solution.
This study addresses this need by evaluating the potential contribution of end-of-life Ir and Pt recovery from PEM technologies using a scenario-based material-flow analysis for global and U.S. markets from 2020 to 2050. The model estimates annual metal demand, end-of-life metal stocks, secondary supply, remaining primary requirement, surplus, and recycling shares. Annual demand is based on U.S. Department of Energy annual PEM manufactured-capacity inputs, which include new and replacement systems, together with catalyst loading rates [
15]. End-of-life availability is estimated using distributed system lifetimes, collection efficiency, technical recovery efficiency, recycling delay, and material-loss accounting.
The specific contribution of this study is a PEM-sector material-flow framework that jointly evaluates PEM electrolyzer Ir, PEM electrolyzer Pt, and PEM fuel-cell Pt recovery while distinguishing end-of-life metal stock, collection efficiency, technical recovery efficiency, recycling delay, material losses, remaining primary requirement, and surplus under global and U.S. 2050 scenarios. By comparing an upper-bound effective-collection case, a central practical case, and a conservative practical case, the analysis shows how recovery-system assumptions affect the scale and timing of secondary Ir and Pt supply. Supplementary sensitivity cases further examine catalyst-loading uncertainty, PEM fuel-cell Pt-loading assumptions, combined uncertainty, cumulative 2020–2050 outcomes, and Ir supply context. The results provide insight into how end-of-life PEM recycling could reduce, but not eliminate, future primary Ir and Pt requirements for hydrogen technologies.
2. Background
Electrolyzers and fuel cells are central technologies in emerging hydrogen production and utilization systems. These technologies differ in operating conditions, electrolyte materials, catalyst requirements, durability constraints, and end-use applications. Because this study evaluates the recovery of iridium (Ir) and platinum (Pt), the analysis focuses on proton exchange membrane electrolyzer cells (PEMECs) and proton exchange membrane fuel cells (PEMFCs), where these platinum-group metals (PGMs) remain important for catalyst performance in current commercial and near-commercial systems.
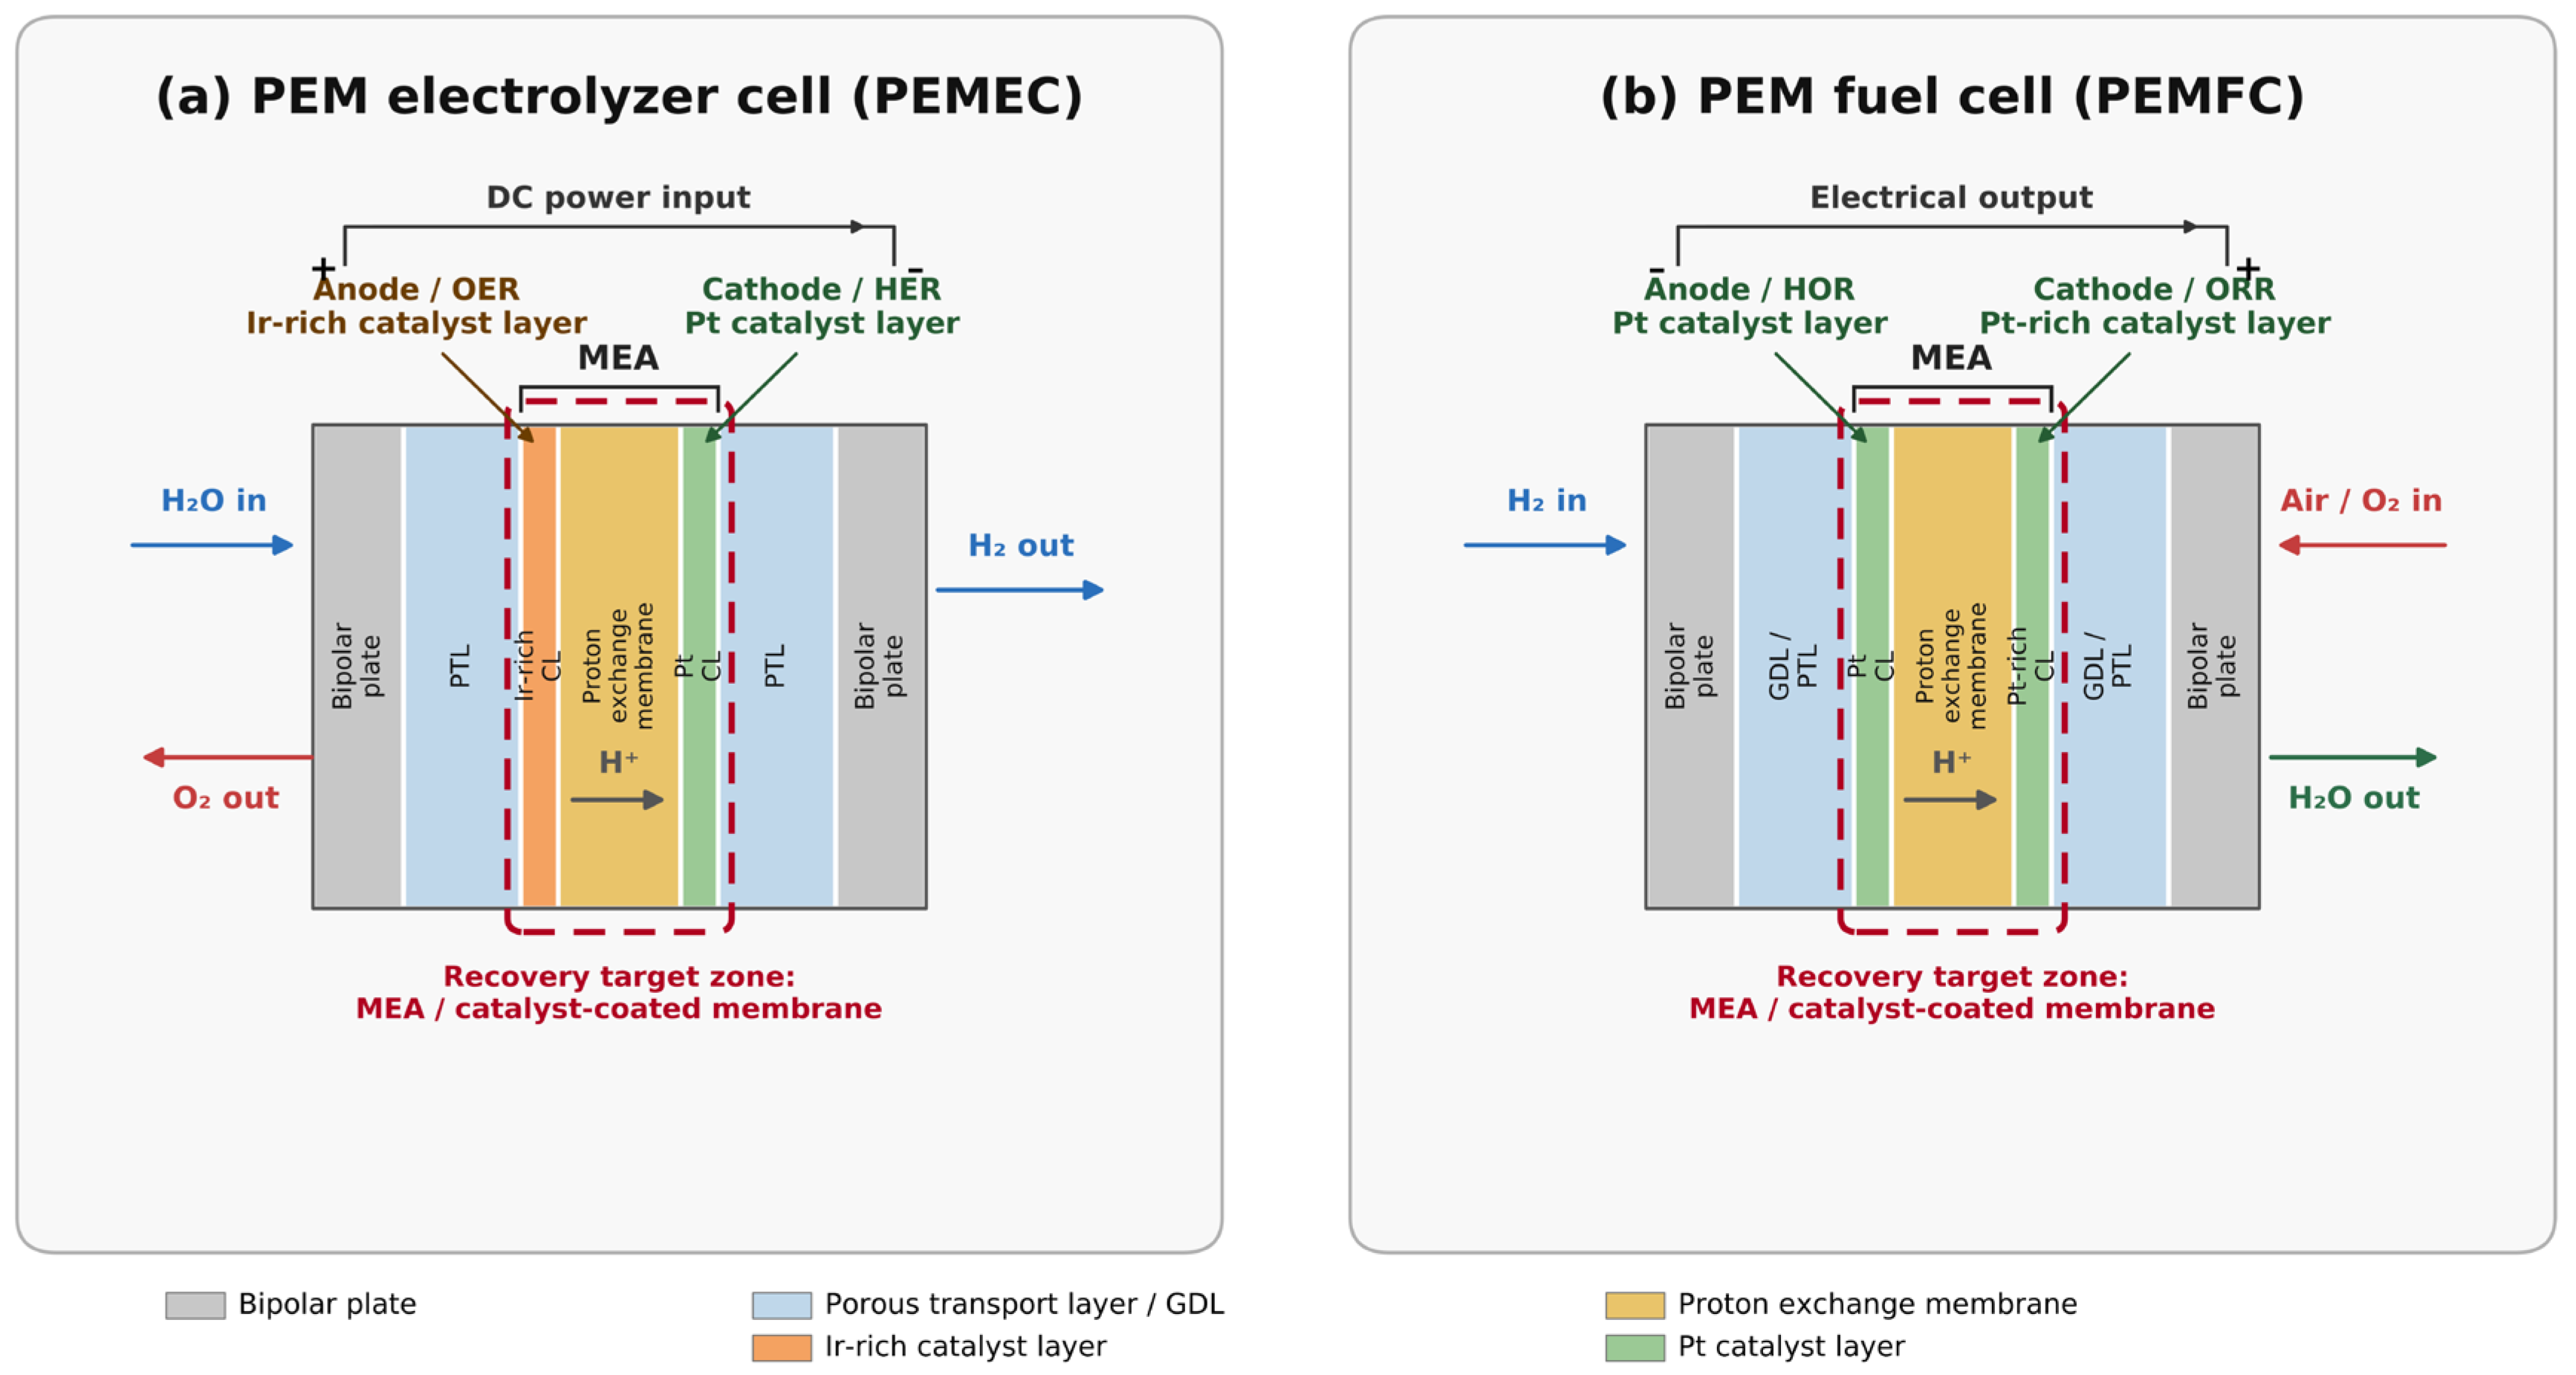
Figure 1 illustrates the PGM-bearing components and end-of-life recovery target zones in PEM electrolyzer and PEM fuel-cell systems.
2.1. PEM Technologies in the Hydrogen Technology Landscape
Several electrolyzer technologies are used or under development for hydrogen production, including alkaline electrolyzer cells (AECs), proton exchange membrane electrolyzer cells (PEMECs), and solid oxide electrolyzer cells (SOECs) [
1,
16,
17]. AECs are commercially mature and typically use alkaline electrolytes and non-noble-metal electrode materials. SOECs operate at high temperatures and use ceramic electrolytes, offering potential efficiency advantages when suitable heat sources are available. However, neither AECs nor SOECs relies on Ir and Pt in the same way as PEMECs. They are therefore discussed only as technology context and are outside the Ir and Pt recovery boundary of this study.
PEMECs use a solid polymer electrolyte membrane that conducts protons while separating the hydrogen and oxygen electrodes. Their advantages include compact design, high current density, high hydrogen purity, rapid dynamic response, and compatibility with variable renewable electricity [
1,
2,
17,
18]. These characteristics make PEMECs important for low-emission hydrogen production. However, the acidic and highly oxidative anode environment creates stringent catalyst requirements. Ir-based catalysts are commonly used for the oxygen evolution reaction at the anode, while Pt-based catalysts are typically used for the hydrogen evolution reaction at the cathode [
1,
6,
7]. As a result, PEMEC deployment has direct implications for future Ir demand and, to a lesser extent, Pt demand.
Fuel-cell technologies also differ in operating temperature, electrolyte type, application, and material requirements. PEMFCs operate at relatively low temperatures and use a proton-conducting polymer electrolyte membrane. They are well suited for transportation, backup power, and distributed power applications because they provide high power density, rapid start-up, and load-following capability [
1,
19]. In PEMFCs, Pt-based catalysts are used at both the anode and cathode, with the cathode generally requiring higher Pt loading because the oxygen reduction reaction is kinetically slower than the hydrogen oxidation reaction [
1]. SOFCs, in contrast, operate at much higher temperatures and do not depend on Pt as the dominant catalyst material. Therefore, this recovery analysis focuses on PEMFCs rather than SOFCs.
2.2. Ir and Pt Use in PEM Systems
PEM technologies are the focus of this study because they contain strategically important PGMs in catalyst-bearing components. In PEMECs, Ir is the primary critical material of concern because it is used at the anode, where the oxygen evolution reaction occurs under strongly acidic and oxidative conditions. Pt is used at the cathode for the hydrogen evolution reaction, generally at lower loading levels than Ir. Future PEMEC manufacturing therefore affects both Ir and Pt demand, but Ir remains the more critical supply concern because its primary production is much smaller and more geographically concentrated.
In PEMFCs, Pt is the dominant recoverable PGM because it is used in the MEA catalyst layers. Pt loading varies by application, system design, durability requirements, and power-output targets. Heavy-duty and high-utilization applications may require higher Pt inventories than lower-duty applications because of durability and performance requirements [
19,
20]. As PEMFC manufacturing and deployment expand, end-of-life fuel-cell stacks could become an important secondary Pt source if effective systems for collection, dismantling, and refining are developed.
The location and form of Ir and Pt in PEM systems are important for recycling analysis. In PEMECs, Ir is concentrated primarily in the anode catalyst layer, while Pt is used at the cathode. In PEMFCs, Pt is present in the catalyst layers of the MEA, with a larger share generally associated with the cathode side. These catalyst-bearing MEAs and coated components are therefore the main targets for end-of-life recovery. Their recovery depends not only on metallurgical efficiency but also on stack design, catalyst loading, MEA structure, operating lifetime, collection systems, and access to specialized recycling infrastructure.
2.3. End-of-Life Recovery and Recycling Pathways
End-of-life PEM electrolyzers and fuel cells contain Ir and Pt mainly in catalyst-bearing MEAs and catalyst-coated components. Recovery efforts therefore focus on separating and processing these components rather than treating the entire system as a uniform scrap stream. A typical recovery chain includes collection of end-of-life stacks, system dismantling, separation of the MEA or catalyst-coated membrane, pretreatment to liberate catalyst-bearing layers, chemical or thermal processing, purification, and refining into reusable PGM products.
For PEM fuel cells, Duclos et al. developed a hydrometallurgical process to recover Pt from PEMFC catalyst material through leaching, separation, precipitation, and filtration [
11]. Granados-Fernández et al. reviewed Pt recovery techniques in the context of circular-economy strategies, including hydrometallurgical and other chemical recovery approaches [
12]. For PEM water electrolyzers, Carmo et al. demonstrated catalyst separation, recovery, and recycling from catalyst-coated membranes, showing that PEM electrolyzer catalyst recovery is technically feasible under controlled conditions [
21].
Two broad recovery approaches are commonly discussed: pyrometallurgical and hydrometallurgical processing. Pyrometallurgical routes use high-temperature treatment to concentrate PGMs into a metallic phase for subsequent refining. These processes can handle complex PGM-bearing materials but may require significant energy input and may not preserve polymer membrane materials. Hydrometallurgical routes use chemical leaching and separation steps to dissolve and recover Pt, Ir, or related compounds from catalyst-bearing components. These routes can offer selective recovery but require careful control of reagents, process conditions, waste streams, and separation efficiency [
11,
12,
22].
Ir recovery from PEM electrolyzers is especially important because Ir supply is much smaller than Pt supply. However, Ir recovery from PEM electrolyzer MEAs remains less mature than Pt recovery from fuel-cell catalyst material. This lower maturity reflects the small current volume of end-of-life PEM electrolyzer stacks, the complexity of Ir oxide catalyst layers, and the still-developing scale of PEM electrolyzer recycling infrastructure. Consequently, Ir recovery assumptions should be treated as scenario parameters rather than established industrial averages.
Existing PGM recycling infrastructure provides an important foundation, but it is not equivalent to a fully developed PEM recycling system. Specialized PGM refiners already recover PGMs from complex materials and industrial catalysts, and several firms describe recycling and refining services for hydrogen fuel-cell, electrolyzer, automotive, and chemical catalyst materials [
23,
24,
25]. However, future PEM recycling will depend not only on metallurgical recovery capacity but also on collection systems, transportation logistics, disassembly protocols, stack design, regional deployment patterns, and the ability to route end-of-life PEM stacks to appropriate recycling facilities.
This distinction is central to the model used in this study. Technical recovery efficiency measures the share of Ir or Pt that can be recovered from collected and processable catalyst-bearing material under suitable processing conditions. Actual secondary supply also depends on whether end-of-life systems are collected, correctly identified, dismantled, and sent to qualified recycling facilities. Accordingly, the model separates collection efficiency, technical recovery efficiency, system lifetime, recycling delay, and material losses to distinguish theoretical recovery potential from secondary metal that could become available to offset future demand.
3. Methodology
3.1. Model Overview and Accounting Boundary
This study applies a scenario-based material-flow analysis to estimate the timing and magnitude of secondary iridium (Ir) and platinum (Pt) supply from end-of-life proton exchange membrane electrolyzer cells (PEMECs) and proton exchange membrane fuel cells (PEMFCs). The model first estimates annual metal demand from U.S. Department of Energy (DOE) annual PEM manufactured-capacity inputs and catalyst loading rates. It then estimates secondary metal availability from retiring PEM systems by accounting for lifetime distributions, collection efficiency, technical recovery efficiency, recycling delay, and material losses.
The DOE annual capacity inputs are interpreted as annual manufactured-capacity requirements for PEM technologies, including capacity associated with both new deployment and replacement of systems reaching end of life. The model does not add a separate replacement-demand term to the DOE capacity input. End-of-life retirements are modeled separately to estimate potential secondary material supply, not to create an additional replacement-demand requirement.
The model is designed as a physical material-flow framework rather than an economic market-allocation model. Therefore, the results should be interpreted as material-flow scenarios, not deterministic forecasts of actual metal reuse, market behavior, or closed-loop allocation. Recovered Ir and Pt are compared with projected PEM-sector demand to evaluate the potential scale of PEM-derived secondary supply, but the model does not assume that recovered platinum-group metals (PGMs) are necessarily reused in PEM technologies.
The model starts in 2020 and does not explicitly reconstruct pre-2020 in-use PEM stocks. Therefore, PEM systems deployed before 2020 do not contribute to modeled end-of-life metal availability. This boundary may understate early secondary Pt supply from PEMFCs because PEM fuel-cell deployment existed before 2020 and PEMFC lifetimes are shorter than PEMEC lifetimes. The effect is expected to be smaller for mid-century PEMEC Ir and Pt results because pre-2020 PEM electrolyzer deployment was limited relative to the DOE annual manufactured-capacity inputs used for 2030–2050.
The accounting boundary is limited to post-consumer end-of-life PEM systems. Manufacturing scrap, rejected catalyst-coated membranes, catalyst-coating residues, in-plant recycling loops, and refurbishment-related component replacement are excluded from the main material-flow calculations. These streams may provide additional secondary Ir and Pt, especially before large end-of-life PEM volumes emerge, but they require separate data on manufacturing yields, rejection rates, internal recycling practices, refurbishment frequency, and component replacement. Therefore, the results should be interpreted as end-of-life recovery potential rather than total circular PGM supply from all PEM manufacturing, maintenance, and retirement pathways.
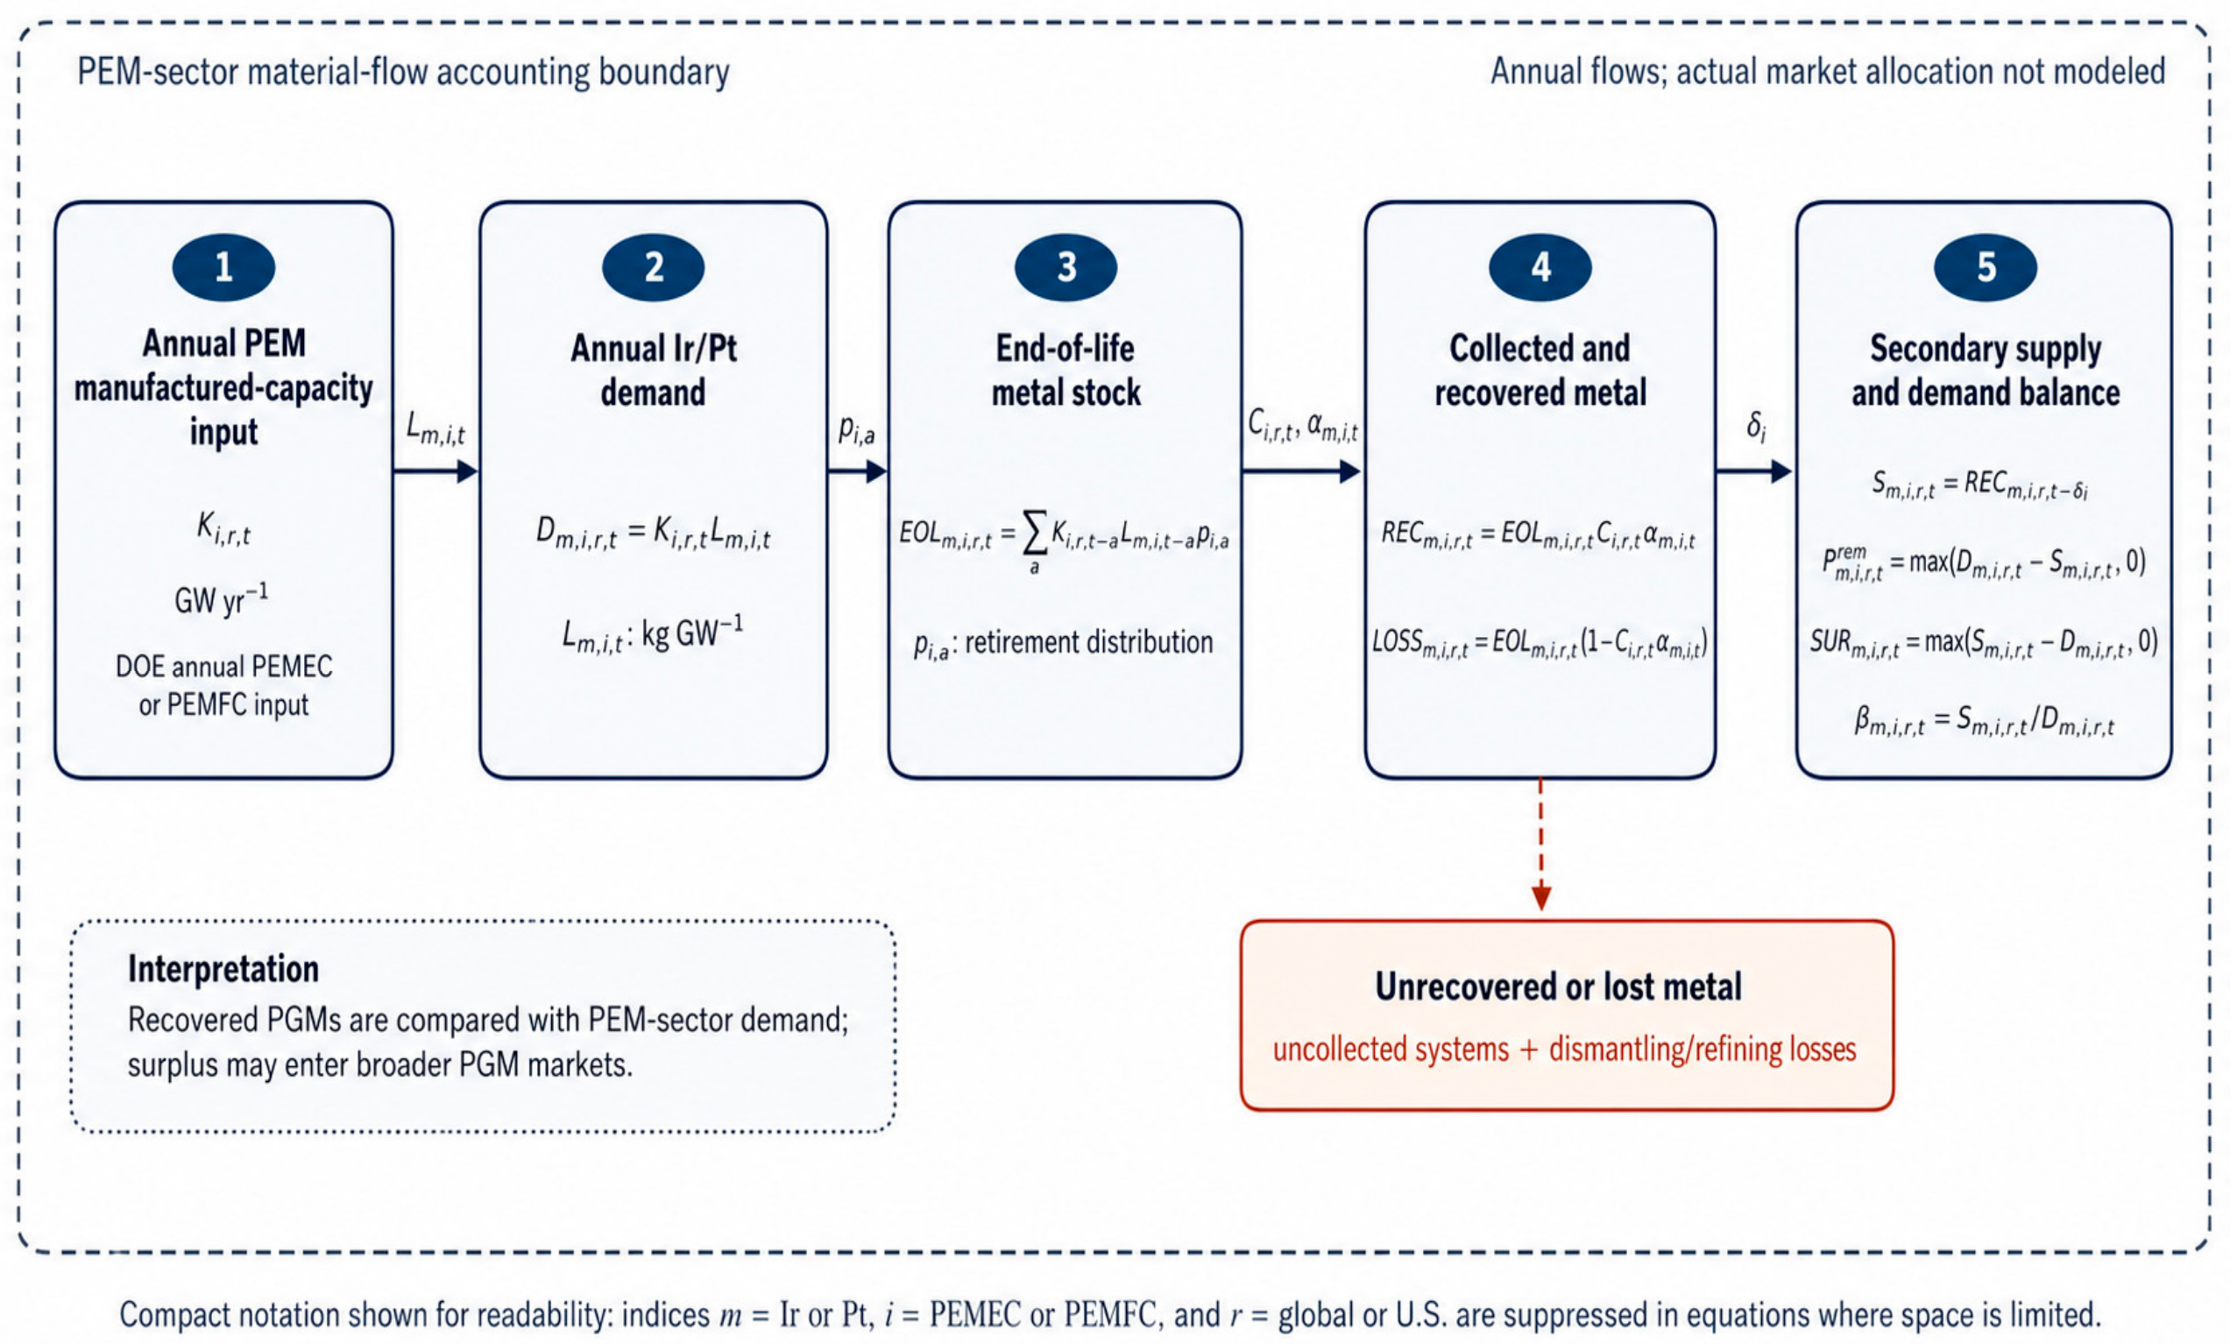
The modeling framework follows five sequential material-flow stages, as shown in
Figure 2: annual PEM manufactured-capacity input, annual metal demand, end-of-life metal stock, collected and recovered metal, and secondary supply compared with annual demand. This structure separates technical recovery from actual system-level recovery. Technical recovery efficiency represents the process-level recovery of Ir or Pt from collected and processable catalyst-bearing material, whereas actual secondary supply also depends on whether end-of-life systems are collected, dismantled, routed to qualified recyclers, processed, refined, and returned to the material supply chain.
3.2. Annual Metal Demand
For metal
m, technology
i, region
r, and year
t, annual metal demand is estimated from the DOE annual PEM manufactured-capacity input and the corresponding catalyst loading rate:
where
is annual demand for metal
m,
is the DOE annual PEM manufactured-capacity input in GW/year for technology
i and region
r, and
is the loading rate of metal
m in kg/GW. Annual metal demand therefore represents the Ir or Pt required for annual PEM manufacturing activity represented in the DOE input series.
For PEMECs, both Ir and Pt are modeled because Ir is used primarily in the anode catalyst layer and Pt is used in the cathode catalyst layer. For PEMFCs, only Pt is modeled because Pt is the dominant recoverable PGM in the fuel-cell catalyst layers. Non-PEM electrolyzer and fuel-cell technologies are not included in the Ir and Pt recovery calculations. They are discussed only as technology context to clarify why the material-flow analysis focuses on PEMECs and PEMFCs.
Catalyst loading is treated as a manufacturing-year parameter. Annual demand in year t depends on the loading rate applied to systems manufactured in year t, while end-of-life metal stock in year t depends on the loading rate of the earlier manufacturing year t − a. This cohort-based treatment is important when time-varying catalyst-loading assumptions are tested, because retired systems may contain different Ir or Pt loadings than systems manufactured in the same year they retire. The main results use constant reference loading values to isolate the effects of recovery-system assumptions, while supplementary sensitivity cases evaluate catalyst-thrifting and alternative PEMFC Pt-loading assumptions.
3.3. End-of-Life Metal Stock with Distributed Lifetimes
End-of-life metal availability depends on when earlier PEM manufacturing cohorts retire. To avoid abrupt retirement behavior from fixed-lifetime assumptions, the model uses discrete triangular lifetime distributions. This approach spreads each annual manufacturing cohort across a range of retirement ages while preserving transparent minimum, most-likely, and maximum lifetime assumptions.
For each technology
i, raw triangular retirement weights are defined as:
The normalized retirement probability for age
a is then:
For PEMECs, the triangular lifetime distribution uses a minimum lifetime of 10 years, a most-likely lifetime of 15 years, and a maximum lifetime of 20 years. For PEMFCs, the triangular lifetime distribution uses a minimum lifetime of 5 years, a most-likely lifetime of 10 years, and a maximum lifetime of 15 years.
The DOE annual manufactured-capacity input and the lifetime distribution serve different purposes in the accounting framework. The DOE input is used once to estimate annual manufacturing-related Ir and Pt demand and already includes replacement systems. The lifetime distribution is not used to add a separate replacement-demand term; rather, it is used only to estimate when previously manufactured PEM systems reach end of life and become potential sources of secondary Ir and Pt. This separation avoids double-counting replacement demand while still allowing retiring cohorts to contribute to future secondary material availability.
The amount of metal
m embedded in systems reaching end of life in year
t is calculated as:
where
is the end-of-life metal stock in kg/year. If
t −
a occurs before the first year of model input data, the corresponding capacity input is treated as zero. This means that the model does not reconstruct retirements from pre-2020 PEM systems.
3.4. Collection, Technical Recovery, and Loss Accounting
Not all metal embedded in retiring PEM systems becomes available as secondary supply. End-of-life systems must first be collected, identified, dismantled, and routed to qualified recycling facilities. In this study, collection efficiency and technical recovery efficiency represent different stages of the recovery chain.
Collection efficiency, , represents the share of end-of-life PEM systems or catalyst-bearing components that are collected, identified, dismantled, and routed to qualified PGM recovery facilities. It therefore captures system-level losses from noncollection, storage, misrouting, export, or failure to separate catalyst-bearing components. Technical recovery efficiency, , represents the metallurgical or process recovery yield from collected and processable catalyst-bearing material. It does not represent the fraction of total deployed metal that is recovered from the entire fleet. Actual available secondary supply is therefore determined by both collection efficiency and technical recovery efficiency, after accounting for the recycling delay.
The collected end-of-life metal flow is calculated as:
where
is collected end-of-life metal.
The recovered metal flow before accounting for recycling delay is:
where
is recovered metal before delay.
Collection losses are calculated as:
Processing and refining losses from collected material are calculated as:
Total unrecovered or lost metal is calculated as:
Thus, high technical recovery efficiency does not imply high fleet-level recovery unless end-of-life systems are also collected and routed to appropriate recycling pathways.
3.5. Recycling Delay and Available Secondary Supply
Recovered metal is not assumed to become available immediately after system retirement. The model includes a recycling-delay parameter, representing the time required for collection, transportation, dismantling, catalyst separation, recovery processing, purification, refining, and re-entry into the material supply chain.
Secondary supply available in year
t is calculated as:
or equivalently:
where
is the recovered secondary metal available in year
t. If
occurs before the model start year,
is set to zero.
3.6. Remaining Primary Requirement, Surplus, and Recycling Share
Secondary supply is compared with annual PEM-sector demand to estimate the remaining primary metal requirement. Because negative primary demand is not physically meaningful, the remaining primary requirement is calculated as:
where
is the remaining primary requirement for metal
m after accounting for available secondary supply.
When secondary supply exceeds annual PEM-sector demand, the excess is reported separately as surplus:
where
is surplus secondary metal within the PEM-sector accounting boundary.
The annual recycling share is calculated as:
where
is the share of annual PEM-sector metal demand represented by available secondary supply. Values of
, or greater than 100%, indicate that secondary supply exceeds annual PEM-sector demand in that year within the modeled boundary. Such values do not imply full market self-sufficiency or guaranteed closed-loop reuse, because recovered Ir or Pt may be stored, exported, sold into broader PGM markets, or allocated to competing industrial applications.
3.7. Recovery-System Cases
Three recovery-system cases are defined to distinguish idealized recovery potential from more practical end-of-life recovery conditions. These cases vary collection efficiency, recycling delay, and, for Ir, technical recovery efficiency. All three cases use distributed system lifetimes.
The upper-bound effective-collection case assumes 100% collection efficiency and a 0-year recycling delay. This case estimates maximum physical recovery potential under ideal collection and immediate processing conditions. The central practical case assumes 70% collection efficiency, a 2-year recycling delay, distributed system lifetimes, 50% Ir technical recovery efficiency, and 95% Pt technical recovery efficiency. This case is used as the main reference case for annual material-flow results. The conservative practical case assumes 50% collection efficiency, a 3-year recycling delay, distributed system lifetimes, 40% Ir technical recovery efficiency, and 95% Pt technical recovery efficiency. This case represents lower collection performance, longer recycling delays, and lower Ir recovery from PEMEC end-of-life material.
The recovery-system cases are summarized in
Table 1.
3.8. Output Metrics and Scenario Interpretation
The model produces annual results from 2020 to 2050 for each technology, metal, and region. The main outputs are:
where
D is annual metal demand,
EOL is end-of-life metal stock,
S is secondary supply available after recycling delay,
is the remaining primary requirement,
SUR is surplus secondary metal, and
is the annual recycling share.
For PEMECs, outputs are calculated separately for Ir and Pt. For PEMFCs, outputs are calculated for Pt. Results are reported separately for global and U.S. cases. Annual flows are calculated in kg/year and reported in metric tons/year, while recycling shares are reported as percentages.
The central practical case is used for the main time-series figures showing annual demand, secondary supply, remaining primary requirement, surplus where applicable, and recycling share. The upper-bound and conservative practical cases are used to show the range of 2050 outcomes. Supplementary sensitivity cases evaluate catalyst-loading trajectories, PEMFC Pt-loading assumptions, combined recovery/loading uncertainty, cumulative 2020–2050 outcomes, and Ir supply context. These supplementary cases are reported as structured scenario results rather than statistical confidence intervals because robust probability distributions are not available for several future PEM technology and recycling parameters.
4. Data and Parameters
This section summarizes the input data used in the material-flow model, including annual PEM manufactured-capacity inputs, catalyst loading rates, lifetime distributions, collection efficiency, technical recovery efficiency, and recycling delay. Annual global and U.S. PEMEC and PEMFC capacity inputs are taken from the U.S. Department of Energy (DOE) public figure dataset associated with the Water Electrolyzers and Fuel Cells Supply Chain Deep Dive Assessment [
15]. These annual inputs are treated as DOE annual manufactured-capacity requirements, which include both new deployment and replacement systems. They are not interpreted as cumulative installed capacity.
The recovery-system cases are defined in
Table 1.
Table 2 summarizes the main parameter values and ranges used in the material-flow calculations. The central practical case is used for the main annual results, while the upper-bound effective-collection and conservative practical cases are used to compare 2050 outcomes. Supplementary sensitivity cases evaluate catalyst-loading trajectories, PEMFC Pt-loading uncertainty, combined recovery/loading uncertainty, cumulative 2020–2050 outcomes, and Ir supply context.
4.1. Annual PEM Manufactured-Capacity Inputs
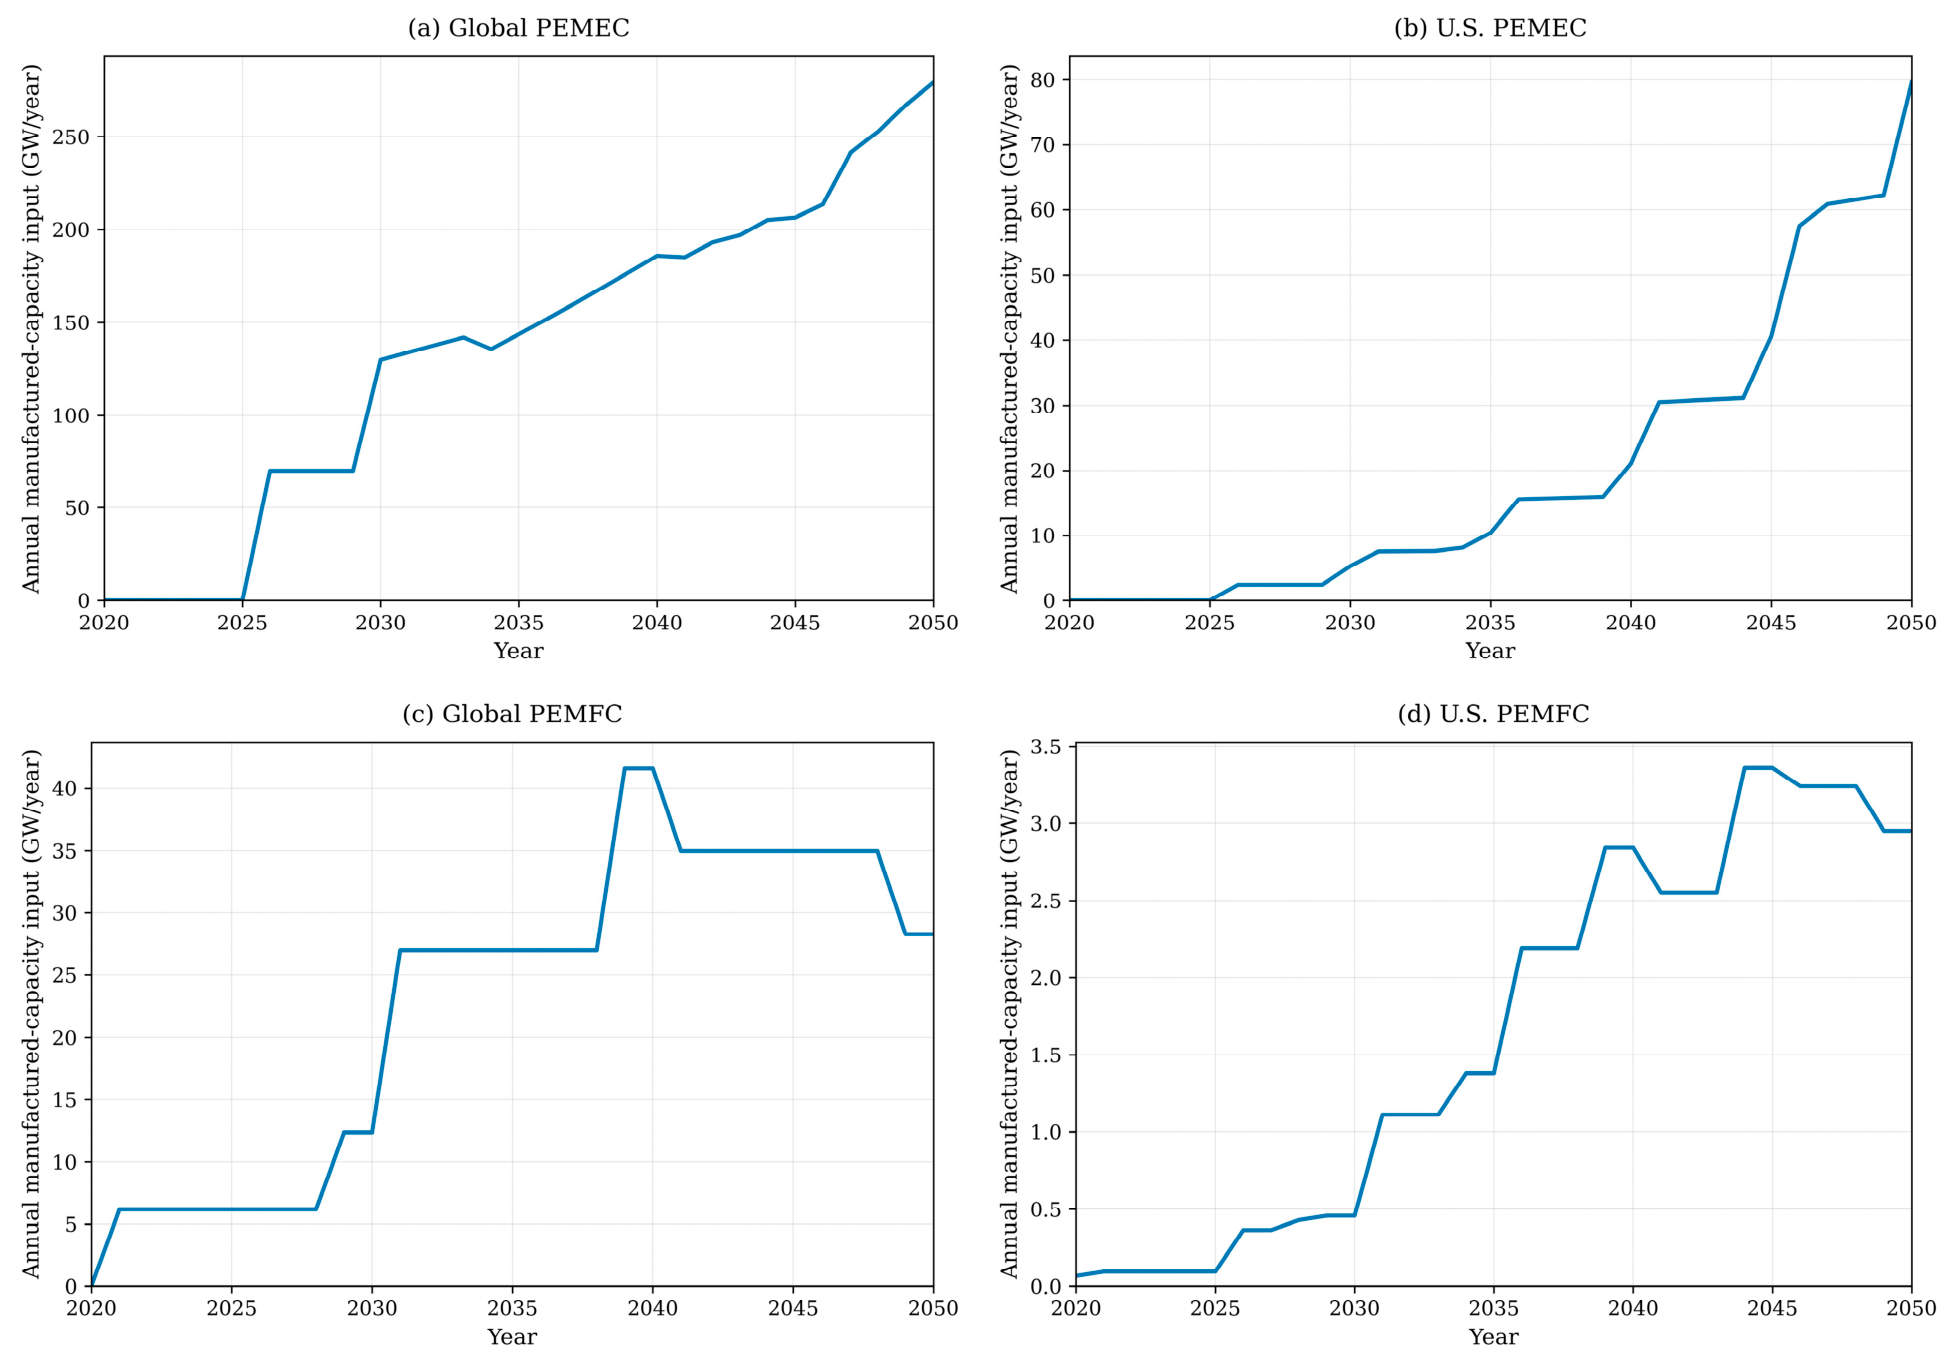
The DOE public figure dataset provides annual and cumulative capacity series for electrolyzers and fuel cells by technology type. The PEMEC and PEMFC annual series used in this study are taken from the DOE
Figure 3 and
Figure 4 datasets, respectively. These values are labeled as total annual capacity additions in the public dataset, while the DOE report describes the underlying estimates as manufactured-capacity requirements that include both new deployment and replacement of systems reaching end of life. Accordingly,
is interpreted in this model as the annual PEM capacity manufactured to satisfy total annual system requirements, including replacement capacity.
The model uses the DOE annual capacity input once to estimate annual Ir and Pt demand. It does not add a separate replacement-demand term. End-of-life retirements are modeled separately only to estimate potential secondary material supply from previously manufactured PEM systems. This treatment avoids double-counting replacement demand while preserving the ability to estimate secondary Ir and Pt availability from retiring PEMEC and PEMFC cohorts.
Figure 3 shows the annual DOE PEM capacity inputs used in the model.
Figure 3a,b show global and U.S. PEMEC manufactured-capacity inputs, respectively.
Figure 3c,d show global and U.S. PEMFC manufactured-capacity inputs, respectively. These PEMEC and PEMFC series are used to estimate annual Ir and Pt demand because these are the catalyst-bearing PEM technologies analyzed in this study.
4.2. Lifetime Distributions
System lifetime determines when metal embedded in manufactured PEM systems becomes available as end-of-life material. Instead of assigning one fixed retirement year to each manufacturing cohort, this analysis uses triangular lifetime distributions to spread retirements across a range of plausible operating lifetimes.
For PEMECs, the lifetime distribution uses a minimum lifetime of 10 years, a most-likely lifetime of 15 years, and a maximum lifetime of 20 years. This range reflects the longer expected operating life of PEM electrolyzer systems and avoids abrupt retirement behavior from fixed-lifetime assumptions [
26]. For PEMFCs, the lifetime distribution uses a minimum lifetime of 5 years, a most-likely lifetime of 10 years, and a maximum lifetime of 15 years. PEMFC lifetime varies by application, duty cycle, operating conditions, and system design, so the 5–15-year range represents heterogeneous retirement behavior across fuel-cell applications [
19,
27].
4.3. Catalyst Loading Rate
Catalyst loading rates convert annual PEM manufactured-capacity inputs into annual Ir and Pt demand. For PEMECs, the reference case assumes an Ir loading rate of 400 kg/GW and a Pt loading rate of 200 kg/GW. The Ir loading represents the Ir-rich anode catalyst material required for the oxygen evolution reaction in acidic PEM electrolyzer environments [
4,
6,
7]. The Pt loading represents cathode catalyst material used for the hydrogen evolution reaction [
29]. Although Ir is the primary critical material concern for PEM electrolyzers, Pt demand from PEMEC cathodes is included because it contributes to total PEM-sector PGM requirements.
For PEMFCs, the reference case assumes a Pt loading rate of 300 kg/GW. PEMFC Pt loading varies by application, system design, durability requirements, and power-output targets. The 300 kg/GW value is therefore treated as a mixed-fleet reference value rather than a universal PEMFC loading assumption [
19,
20]. Supplementary sensitivity cases evaluate lower and higher PEMFC Pt-loading values to test the effect of this assumption on demand, end-of-life Pt availability, and recycling shares.
The loading rates in the main results represent metal embedded in manufactured PEM systems. They do not represent gross PGM feedstock requirements that may include additional losses from catalyst ink preparation, coating, membrane-electrode assembly fabrication, quality-control rejection, or other manufacturing steps. Manufacturing scrap and rejected catalyst-coated membranes may be internally recovered or returned to refiners, but public data on PEM-specific scrap rates and internal recycling yields are limited. These manufacturing-loop flows are therefore excluded from the main end-of-life material-flow model and are identified as a future extension.
In the main material-flow results, catalyst loading rates are held constant through 2050 and are interpreted as reference loading assumptions rather than forecasts of future catalyst design. This treatment allows the central practical case to isolate the effects of manufactured-capacity inputs, lifetime distributions, collection efficiency, technical recovery efficiency, and recycling delay. Supplementary sensitivity cases examine time-varying loading trajectories for PEMEC Ir, PEMEC Pt, and PEMFC Pt to evaluate how catalyst-thrifting pathways could affect future primary requirements and recycling shares.
4.4. Collection Efficiency and Recycling Delay
Collection efficiency represents the share of end-of-life PEM systems or catalyst-bearing components that enter qualified recycling pathways. It includes collection, identification, transportation, dismantling, and routing to appropriate PGM recovery facilities. It does not represent metallurgical recovery yield. Systems that remain in storage, are exported without traceability, are discarded, are misrouted to unsuitable scrap streams, or are not dismantled to recover catalyst-bearing components are treated as collection losses.
The collection-efficiency values used in this study are scenario parameters rather than observed global averages for PEM technologies. Large-scale PEMEC and PEMFC recycling systems are still developing, and consistent empirical data on PEM-specific collection rates are limited. The upper-bound effective-collection case assumes 100% collection efficiency to estimate maximum physical recovery potential under idealized routing conditions. The central practical case assumes 70% collection efficiency and is used as an intermediate recovery-system case. The conservative practical case assumes 50% collection efficiency to represent lower collection performance and weaker routing of end-of-life PEM components to qualified recyclers.
Recycling delay represents the time between system retirement and the availability of recovered Ir or Pt as secondary material. This delay includes collection, storage, transportation, stack dismantling, separation of catalyst-bearing membrane-electrode assemblies or catalyst-coated membranes, pretreatment, recovery processing, purification, refining, quality verification, and re-entry into the material supply chain. The upper-bound effective-collection case assumes a 0-year delay only as an idealized maximum-recovery case. The central practical case assumes a 2-year delay, while the conservative practical case assumes a 3-year delay. These delay values are scenario assumptions used to evaluate the effect of processing time on secondary supply availability.
4.5. Technical Recovery Efficiency
Technical recovery efficiency represents the fraction of Ir or Pt recovered from collected and processable catalyst-bearing material under suitable recycling and refining conditions. It is applied after collection efficiency in the model and therefore should not be interpreted as total fleet-level recovery. For example, a 95% Pt technical recovery efficiency does not mean that 95% of all Pt originally deployed in PEMFCs is recovered. Actual secondary Pt supply also depends on whether end-of-life systems are collected, dismantled, and routed to qualified recycling facilities.
For Ir in PEMECs, the analysis uses a technical recovery-efficiency range of 40–50% [
28]. The upper-bound effective-collection and central practical cases use 50% Ir technical recovery efficiency, while the conservative practical case uses 40%. These values are treated as scenario parameters because Ir recovery from PEM electrolyzer catalyst-coated membranes and MEAs remains less mature than Pt recovery from PEMFC catalyst material.
For Pt, the analysis assumes 95% technical recovery efficiency for collected and processable PEMEC and PEMFC catalyst-bearing material [
11,
12,
22]. This value represents process-level recovery from suitable PGM-bearing material after collection and dismantling. It does not include losses from uncollected systems, systems not routed to qualified recyclers, or catalyst-bearing components that are not successfully separated from the stack. In the model, these losses are captured separately through collection efficiency and loss accounting.
Together, collection efficiency and technical recovery efficiency determine the fraction of end-of-life metal that becomes available as secondary supply before applying recycling delay. For the central practical case, the effective pre-delay recovery fraction is 35% for PEMEC Ir, calculated as 70% collection efficiency multiplied by 50% Ir technical recovery efficiency. For PEMEC and PEMFC Pt, the corresponding effective pre-delay recovery fraction is 66.5%, calculated as 70% collection efficiency multiplied by 95% Pt technical recovery efficiency.
4.6. Parameter Use in the Results
The central practical case is used for the main annual material-flow results. It combines triangular lifetime distributions, 70% collection efficiency, a 2-year recycling delay, 50% Ir technical recovery efficiency, 95% Pt technical recovery efficiency, and constant reference catalyst loading rates. These assumptions are applied to global PEMEC, U.S. PEMEC, global PEMFC, and U.S. PEMFC cases.
The upper-bound effective-collection and conservative practical cases are used to compare 2050 outcomes. The comparison reports annual demand, secondary supply, remaining primary requirement, surplus where applicable, and recycling share. Supplementary cases evaluate catalyst-loading trajectories, PEMFC Pt-loading assumptions, combined recovery/loading uncertainty, cumulative 2020–2050 outcomes, and Ir supply context. This structure allows the main analysis to show central practical results clearly while also reporting how alternative recovery and material-intensity assumptions affect secondary Ir and Pt supply.
5. Results
This section presents annual Ir and Pt material-flow results from 2020 to 2050 using the DOE annual PEM manufactured-capacity inputs described in
Section 4.1. The main time-series results are reported for the central practical case, which assumes 70% collection efficiency, a 2-year recycling delay, triangular lifetime distributions, 50% Ir technical recovery efficiency, 95% Pt technical recovery efficiency, and constant reference catalyst loading rates. Results are reported as annual flows in metric tons/year and as annual recycling shares,
, where
represents the ratio of available secondary supply to annual PEM-sector metal demand.
The results are organized in three parts.
Section 5.1 presents annual material-flow results for global and U.S. PEM electrolyzers and PEM fuel cells under the central practical case.
Section 5.2 compares 2050 outcomes across the upper-bound effective-collection, central practical, and conservative practical cases.
Section 5.3 interprets surplus secondary Pt values and clarifies the PEM-sector accounting boundary.
5.1. Central Practical Case Results
The central practical case provides the main reference point for evaluating secondary Ir and Pt availability under realistic recovery-system constraints. In contrast to an idealized recovery case, the central practical case accounts for incomplete collection, recycling delay, distributed system lifetimes, and recovery losses. Therefore, secondary supply appears later and at lower annual levels than in a case with complete collection and immediate recovered-metal availability. Because collection efficiency and technical recovery efficiency are applied sequentially, the central practical case corresponds to an effective pre-delay recovery fraction of 35% for PEMEC Ir and 66.5% for PEMEC and PEMFC Pt.
5.1.1. Global PEM Electrolyzer Ir and Pt Flows
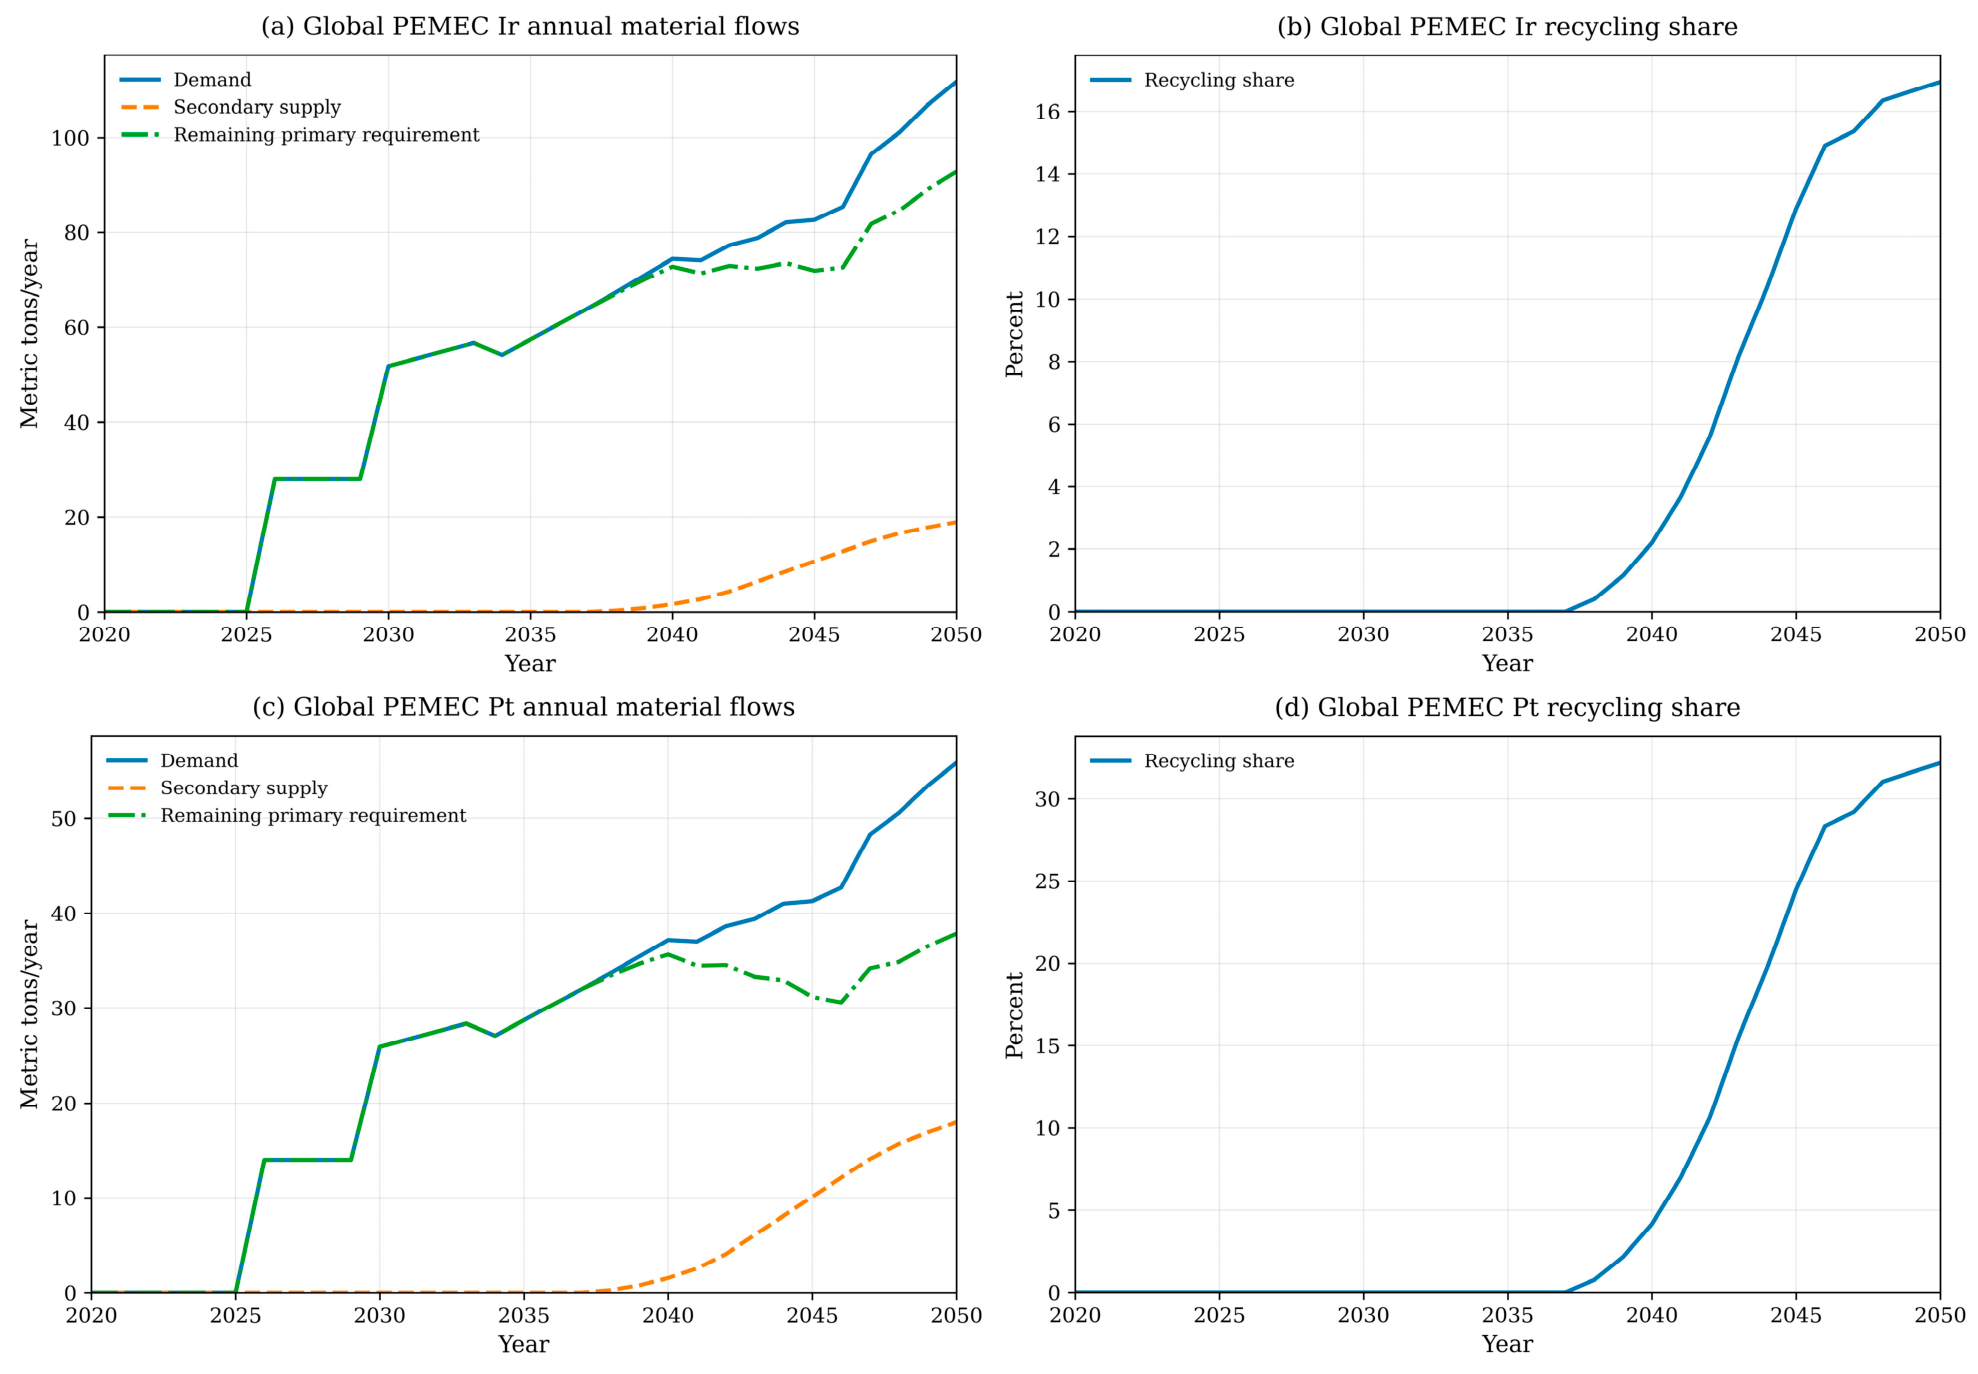
Figure 4 shows annual Ir and Pt material flows for global PEM electrolyzers under the central practical case. Global PEMEC Ir demand begins at 27.99 metric tons/year in 2026 and increases to 111.72 metric tons/year by 2050. Secondary Ir supply first becomes available in 2038, reflecting the PEMEC lifetime distribution and the 2-year recycling delay. By 2050, recovered Ir reaches 18.92 metric tons/year, corresponding to a recycling share of 16.9%. The remaining primary Ir requirement in 2050 is therefore 92.80 metric tons/year.
Global PEMEC Pt demand follows the same DOE manufactured-capacity input trajectory but is lower in absolute terms because the reference PEMEC Pt loading rate is 200 kg/GW, compared with 400 kg/GW for Ir. Global PEMEC Pt demand increases from 14.00 metric tons/year in 2026 to 55.86 metric tons/year in 2050. Secondary Pt supply first becomes available in 2038 and reaches 17.98 metric tons/year by 2050, corresponding to a recycling share of 32.2%. The remaining primary Pt requirement for global PEMEC manufacturing in 2050 is 37.88 metric tons/year.
The higher recycling share for PEMEC Pt compared with PEMEC Ir is primarily driven by the higher assumed Pt technical recovery efficiency. Under the central practical case, Pt technical recovery efficiency is 95%, whereas Ir technical recovery efficiency is 50%. These results indicate that end-of-life PEMEC recovery can reduce future Ir and Pt primary requirements, but it does not eliminate the need for primary material under rapid PEM electrolyzer scale-up.
5.1.2. U.S. PEM Electrolyzer Ir and Pt Flows
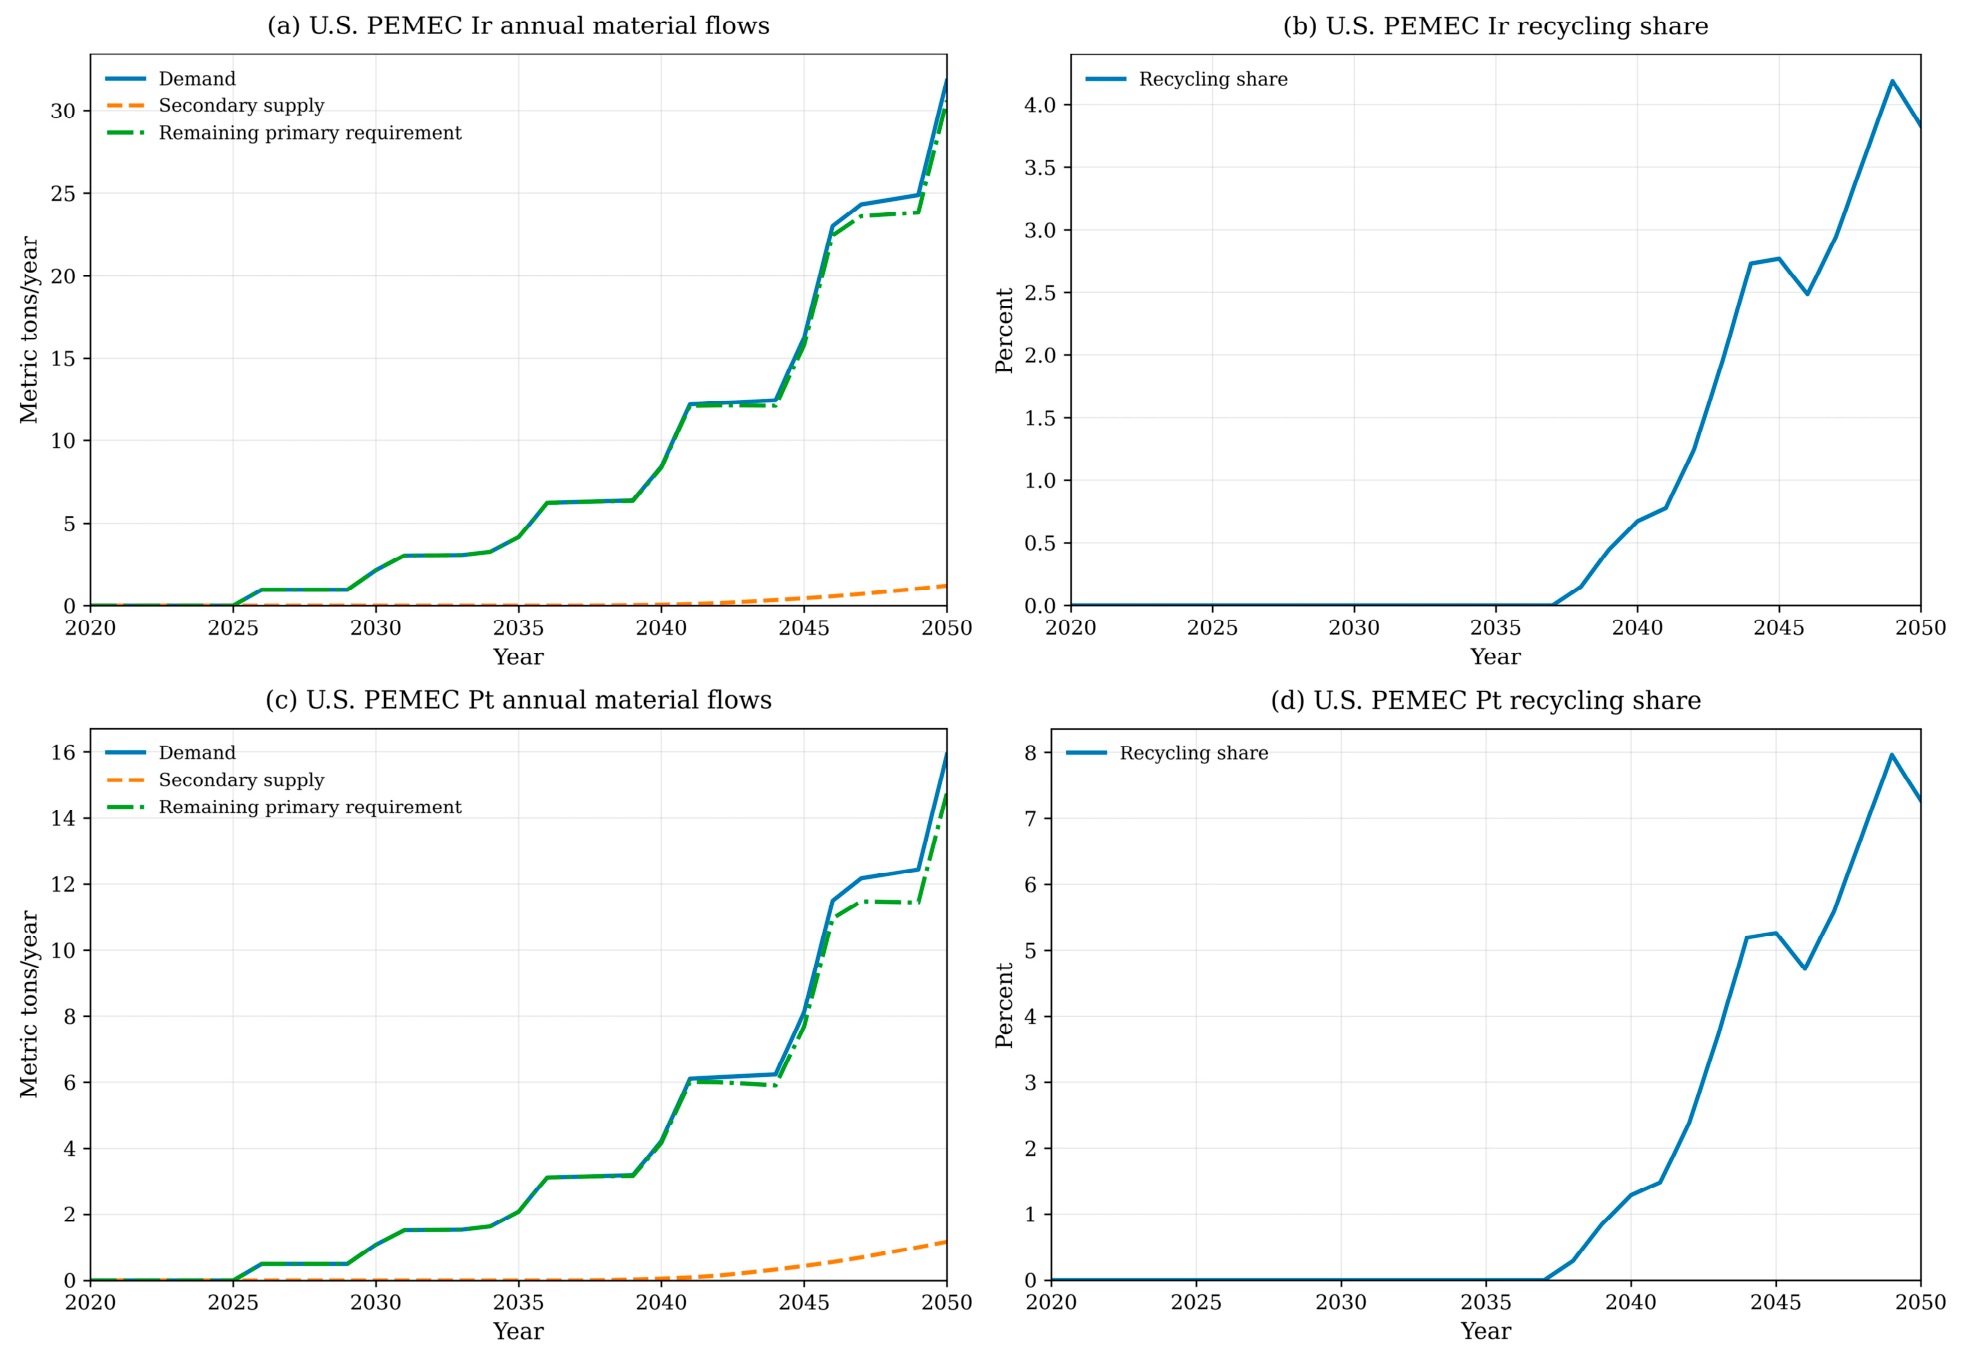
Figure 5 presents the corresponding U.S. PEM electrolyzer results under the central practical case. U.S. PEMEC Ir demand begins at 0.97 metric tons/year in 2026 and increases to 31.84 metric tons/year by 2050. Secondary Ir supply first becomes available in 2038 and reaches 1.22 metric tons/year by 2050. This corresponds to a 2050 recycling share of 3.8% and a remaining primary Ir requirement of 30.62 metric tons/year.
U.S. PEMEC Pt demand increases from 0.49 metric tons/year in 2026 to 15.92 metric tons/year in 2050. Secondary Pt supply reaches 1.16 metric tons/year by 2050, corresponding to a recycling share of 7.3%. The remaining primary Pt requirement in 2050 is 14.76 metric tons/year.
The U.S. PEMEC recycling shares are lower than the corresponding global shares because of the timing and shape of the U.S. DOE capacity-input trajectory. Under a rapidly increasing PEMEC capacity-input pathway, a large share of the systems manufactured before 2050 has not yet reached end of life by 2050. This timing effect is especially important for PEM electrolyzers because the lifetime distribution extends from 10 to 20 years. Therefore, domestic PEMEC recycling can contribute to U.S. Ir and Pt supply, but its contribution remains limited by the relatively young age of much of the modeled PEMEC stock by mid-century.
5.1.3. Global and U.S. PEM Fuel-Cell Pt Flows
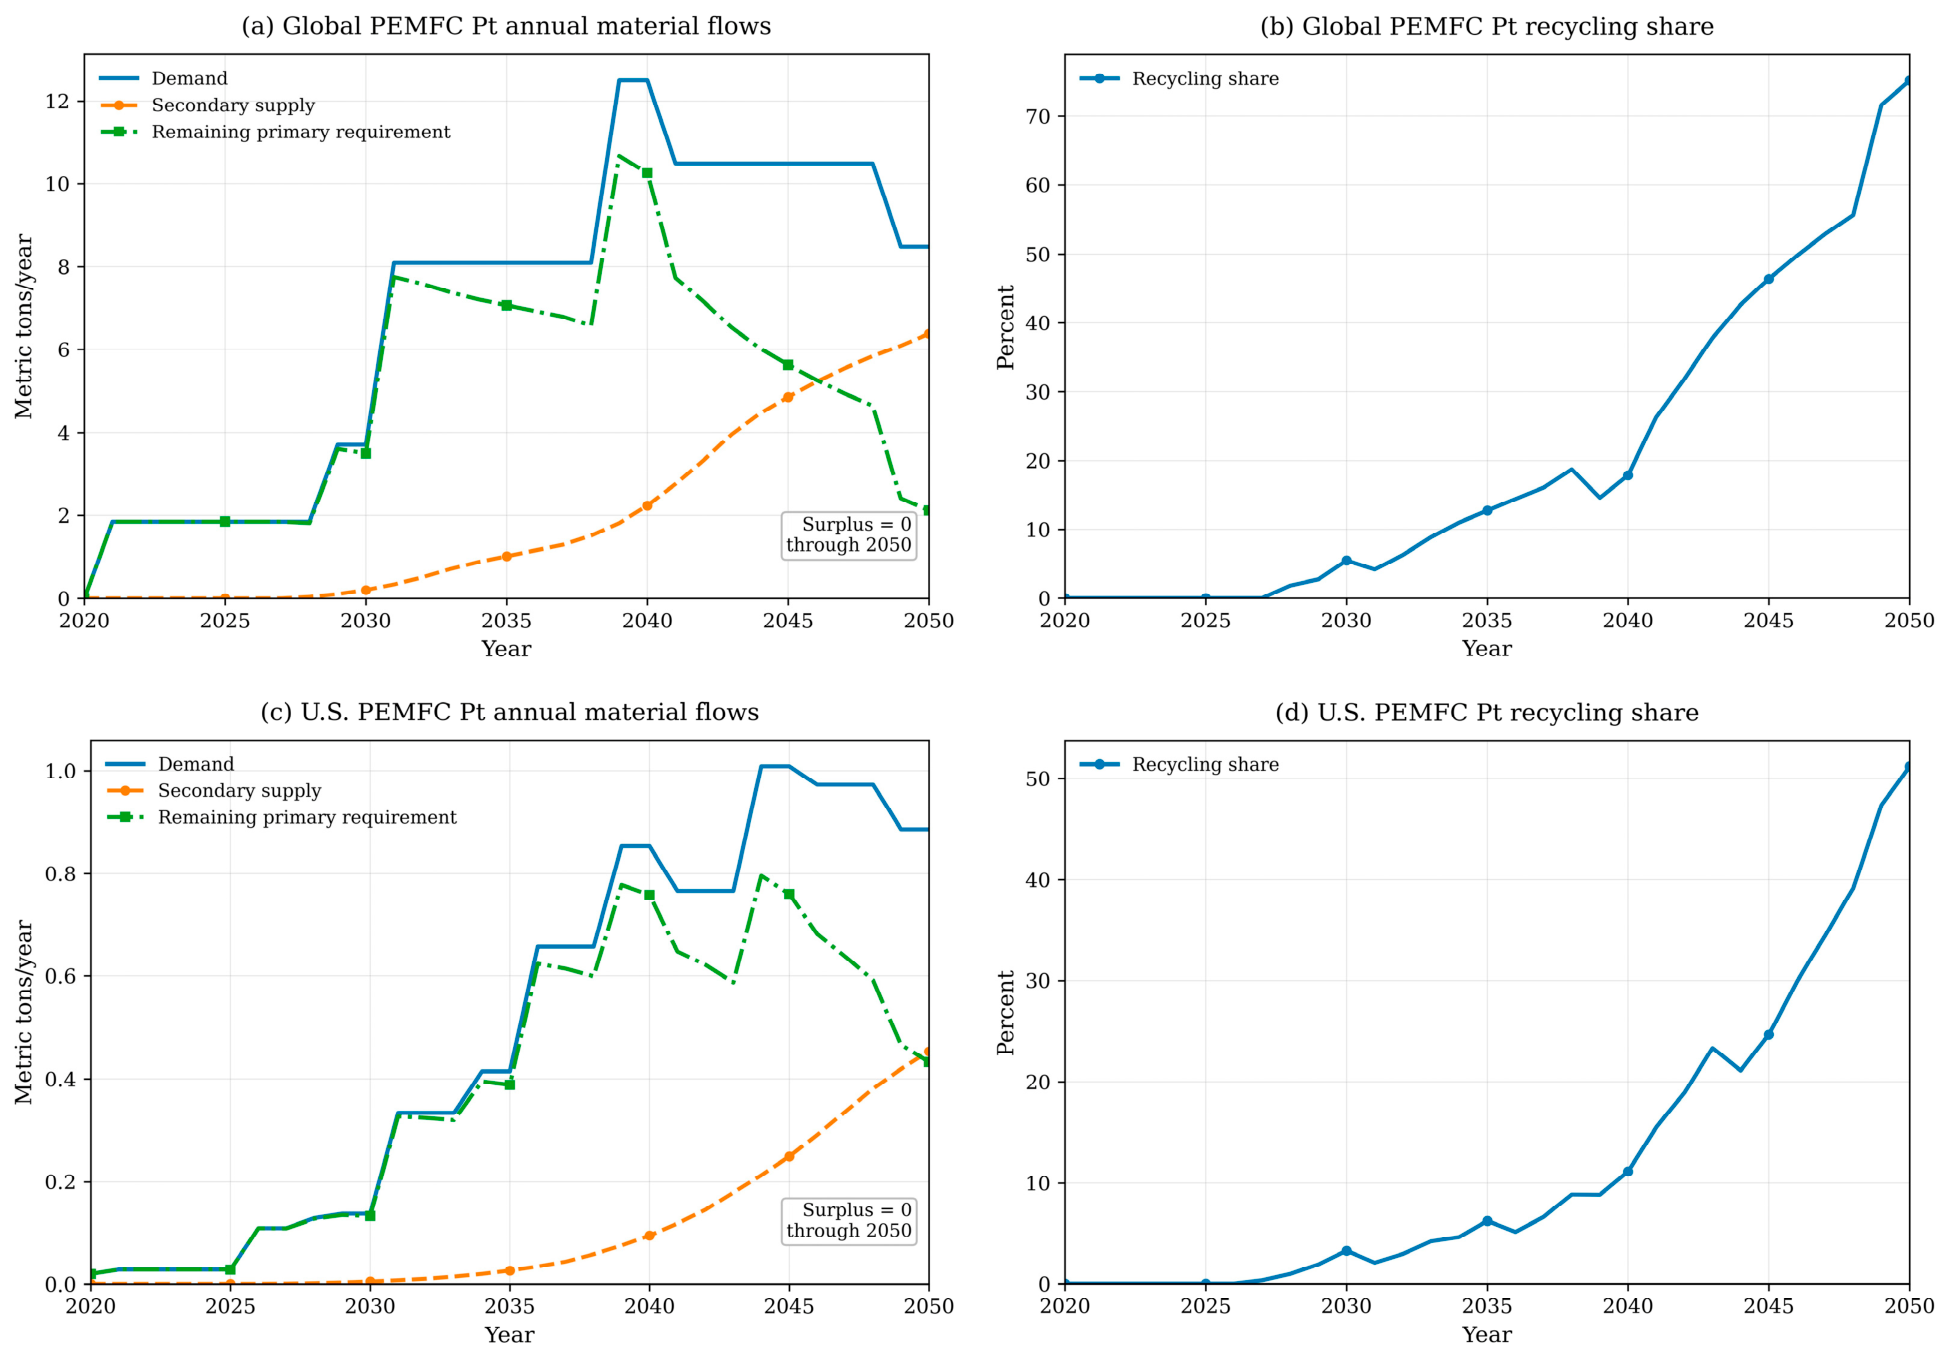
Figure 6 shows Pt material flows for global and U.S. PEM fuel cells under the central practical case. For global PEMFCs, Pt demand begins at 1.85 metric tons/year in 2021 and reaches 8.49 metric tons/year by 2050. Secondary Pt supply first becomes available in 2028 and increases to 6.38 metric tons/year by 2050. The corresponding 2050 recycling share is 75.1%, leaving a remaining primary Pt requirement of 2.11 metric tons/year.
For U.S. PEMFCs, Pt demand begins at 0.02 metric tons/year in 2020 and reaches 0.89 metric tons/year by 2050. Secondary Pt supply first becomes available in 2027 and reaches 0.45 metric tons/year by 2050. This corresponds to a recycling share of 51.2% and a remaining primary Pt requirement of 0.43 metric tons/year.
The PEMFC results show that Pt recovery from end-of-life fuel cells can become a substantial secondary source within the PEMFC accounting boundary. However, under the central practical case, secondary Pt supply does not exceed annual PEMFC Pt demand through 2050 in either the global or U.S. case. Therefore, the remaining primary requirement remains positive, and no surplus Pt is generated in the central practical PEMFC results. Surplus is nevertheless retained as an explicit output variable because it prevents physically meaningless negative primary-requirement values when secondary supply exceeds annual demand under more optimistic recovery assumptions.
5.2. Scenario Comparison and 2050 Outcomes
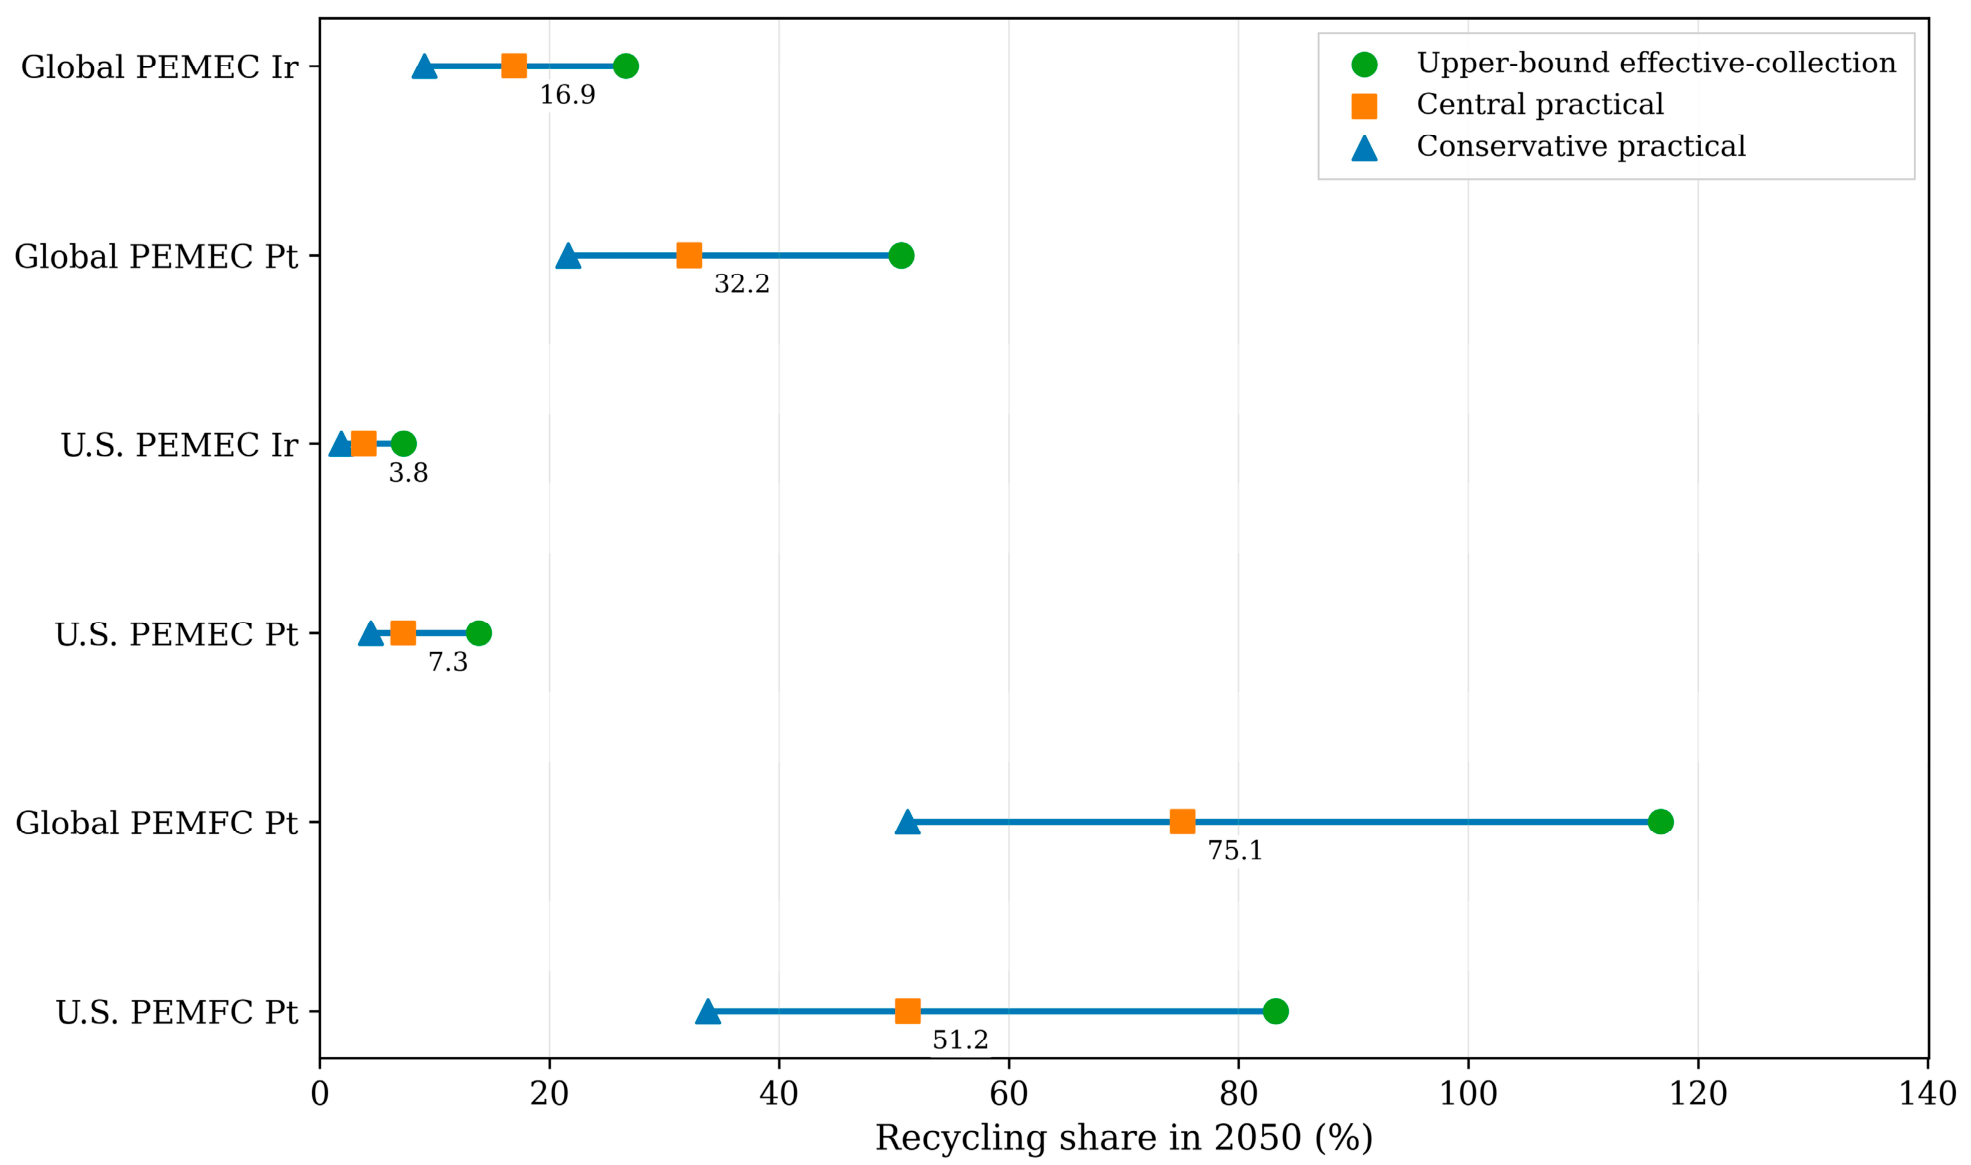
Figure 7 and
Table 3 compare 2050 recycling shares and material-flow outcomes across the upper-bound effective-collection, central practical, and conservative practical cases. This comparison shows how collection efficiency, recycling delay, lifetime treatment, and Ir recovery assumptions affect the estimated contribution of secondary Ir and Pt supply by mid-century.
For global PEMEC Ir, the central practical case provides 18.92 metric tons/year of secondary Ir against 111.72 metric tons/year of annual demand, leaving a remaining primary requirement of 92.80 metric tons/year. The corresponding recycling share is 16.9%. Across the recovery-system cases, global PEMEC Ir recycling is lowest under the conservative practical case and highest under the upper-bound effective-collection case. This range shows that Ir recovery outcomes are strongly affected by collection performance, recycling delay, and technical recovery efficiency.
For global PEMEC Pt, the central practical case provides 17.98 metric tons/year of secondary Pt against 55.86 metric tons/year of annual demand, corresponding to a recycling share of 32.2%. For U.S. PEMECs, the central practical recycling shares are lower: 3.8% for Ir and 7.3% for Pt. These lower values reflect the timing of the U.S. DOE capacity-input trajectory and the long PEMEC lifetime distribution, which delay the availability of end-of-life material.
PEMFC Pt recycling shows higher recycling shares than PEMEC Ir recovery because PEMFCs have shorter assumed lifetimes and Pt has a higher technical recovery efficiency. Under the central practical case, recovered Pt supplies 75.1% of global PEMFC Pt demand and 51.2% of U.S. PEMFC Pt demand in 2050. The upper-bound global PEMFC case is the only 2050 case in which secondary supply exceeds annual PEMFC Pt demand, generating surplus Pt within the PEMFC accounting boundary.
Overall,
Figure 7 and
Table 3 show that recovery-system assumptions materially affect secondary supply estimates. The upper-bound effective-collection case provides an estimate of maximum physical recovery potential under ideal collection and immediate availability. The central practical case provides the main reference point for interpreting intermediate recovery-system performance. The conservative practical case shows the reduction in secondary supply associated with lower collection efficiency, longer recycling delay, and lower Ir technical recovery efficiency.
A broader combined uncertainty matrix is provided in the
Supplementary Materials. This matrix combines recovery-system assumptions with catalyst-loading trajectories to evaluate how collection efficiency, recycling delay, technical recovery efficiency, and catalyst-thrifting assumptions jointly affect 2050 demand, secondary supply, remaining primary requirement, surplus, and recycling shares. The combined results are reported as structured scenario ranges rather than statistical confidence intervals because robust probability distributions are not available for several future PEM technology and recycling parameters. The results therefore complement
Figure 7 and
Table 3 by showing how recovery-system performance and material-intensity assumptions interact.
The
Supplementary Materials also includes alternative capacity-input scenarios to test the sensitivity of the results to the DOE annual manufactured-capacity trajectory. These scenarios include the reference DOE case, a low-capacity case, a high-capacity case, and a delayed-capacity case. They are used as structured scenario tests rather than forecasts. The alternative capacity cases show how annual demand, secondary supply, remaining primary requirement, surplus, and recycling share change when the DOE capacity pathway is scaled or delayed.
5.3. Interpretation of Surplus and Accounting Boundary
In years when secondary supply exceeds annual PEM-sector demand, the excess is reported as surplus rather than as negative primary requirement. This distinction is important because negative primary demand is not physically meaningful. In the model, remaining primary requirement and surplus are calculated using the nonnegative accounting definitions in Equations (12) and (13), respectively.
A recycling share above 100% means that recovered material from retiring PEM systems exceeds annual demand for new PEM manufacturing within the modeled accounting boundary. It does not imply full market self-sufficiency, nor does it guarantee that recovered Ir or Pt will be reused in PEM technologies. Recovered PGMs enter broader material markets and may be stored, exported, sold to other sectors, or allocated to competing industrial uses depending on prices, refining specifications, contractual arrangements, regional recycling capacity, and policy incentives.
This distinction is especially relevant for PEMFC Pt. In the 2050 scenario comparison, global PEMFC Pt exceeds 100% only under the upper-bound effective-collection case. Under the central practical case, global PEMFC Pt recovery reaches 75.1% of annual demand and U.S. PEMFC Pt recovery reaches 51.2%, leaving positive remaining primary requirements in both cases. Therefore, the PEMFC results indicate that end-of-life fuel-cell recycling can substantially reduce primary Pt requirements, but they should not be interpreted as evidence of guaranteed closed-loop Pt self-sufficiency.
6. Discussion
The results show that end-of-life PEM recovery can provide a meaningful secondary source of Ir and Pt, but the scale and timing of that contribution depend strongly on manufactured-capacity growth, retirement timing, collection efficiency, technical recovery efficiency, recycling delay, catalyst loading, and market allocation. Under the central practical case, recycling reduces future primary PGM requirements, especially for PEMFC Pt, but it does not eliminate primary Ir and Pt demand during rapid PEM technology scale-up. The scenario comparison and supplementary sensitivity results further show that recovery outcomes are not controlled by one parameter alone; they depend on the combined effects of recovery-system performance, catalyst intensity, and the timing of end-of-life material availability.
6.1. Implications of the Central Practical Case
The central practical case provides an intermediate recovery-system reference point rather than an idealized maximum-recovery estimate. By including 70% collection efficiency, a 2-year recycling delay, and triangular lifetime distributions, the model captures the fact that secondary material is not available at the time of PEM manufacturing and does not become available immediately at system retirement. Instead, recovered Ir and Pt enter the supply chain only after systems reach end of life, are collected and dismantled, and pass through recovery, refining, and quality-verification steps.
This timing effect is especially important for PEM electrolyzers. Because the DOE PEMEC manufactured-capacity input grows rapidly through 2050 and PEMEC lifetimes are relatively long, secondary Ir and Pt supply lags annual demand growth. Under the central practical case, recycling reduces the remaining primary requirement but does not eliminate it. The effect is more limited for Ir because Ir has both a higher reference loading requirement and a lower assumed technical recovery efficiency than Pt. PEMEC recycling should therefore be viewed as a material-risk reduction strategy, not as a stand-alone solution to Ir supply constraints.
The U.S. PEMEC results show lower recycling shares than the global results. This is not because domestic recovery parameters are assumed to be less effective; the same central practical recovery assumptions are applied. Rather, the difference reflects the timing and shape of the U.S. DOE capacity-input trajectory. Much of the projected U.S. PEMEC capacity has not reached end of life by 2050, so the available secondary supply remains small relative to annual demand. This highlights a broader feature of emerging hydrogen systems: recycling benefits increase with time, but they lag manufacturing growth.
For PEMFCs, the central practical case indicates a stronger contribution from Pt recovery because PEMFC lifetimes are shorter and Pt technical recovery efficiency is higher. Even so, recovered Pt remains a potential secondary supply within the PEMFC accounting boundary rather than guaranteed closed-loop Pt reuse. The practical value of PEMFC Pt recycling therefore depends not only on recovery volumes but also on collection systems, refining capacity, material specifications, and market or policy mechanisms that determine whether recovered Pt returns to PEMFC applications or flows into broader PGM markets.
6.2. Recovery-System Constraints: Collection, Delay, and Losses
The comparison between the upper-bound effective-collection, central practical, and conservative practical cases demonstrates that technical recovery efficiency alone is insufficient to determine secondary supply. Actual recovered material availability depends on the full recovery chain, including collection, identification, transportation, stack dismantling, separation of catalyst-bearing components, recovery processing, purification, refining, quality verification, and re-entry into material supply chains. Losses can occur at each stage.
This distinction is important for PEM technologies because large-scale PEM-specific recycling systems are still developing. The catalyst-bearing MEA or catalyst-coated membrane contains most of the recoverable Ir and Pt, but these components are embedded within stacks that require disassembly and routing to qualified recyclers. If stacks remain in storage, are exported without traceability, are misrouted to unsuitable scrap streams, or are not dismantled to recover catalyst-bearing components, high process-level recovery efficiency will not translate into high fleet-level recovery.
Recycling delay also affects the timing of secondary supply. A delay of even a few years can reduce the apparent contribution of recycling in a given year when annual PEM manufacturing requirements are increasing quickly. This is particularly relevant for PEMECs, where the growth in annual capacity inputs occurs before large end-of-life material flows become available. Reducing recycling delays through improved reverse logistics, regional processing capacity, and standardized disassembly protocols could therefore improve the timely availability of secondary Ir and Pt.
The supplementary combined uncertainty matrix reinforces this point. Recovery-system assumptions and catalyst-loading trajectories interact: lower future loadings reduce annual demand for newly manufactured systems, but they also change the metal content of future retiring cohorts. As a result, catalyst thrifting affects both the numerator and denominator of the recycling-share calculation. The scenario ranges should therefore be interpreted as structured uncertainty outcomes rather than statistical confidence intervals.
6.3. Ir Remains the Critical Constraint for PEM Electrolyzers
The results reinforce the central role of Ir as a critical constraint for PEM electrolyzer scale-up. Ir is used at the PEMEC anode for the oxygen evolution reaction under acidic and oxidative operating conditions, and current alternatives have not yet displaced Ir-based catalysts at commercial scale. Because primary Ir supply is small and geographically concentrated, rapid PEMEC manufacturing growth can create substantial pressure on Ir availability [
4,
5,
6,
7].
Under the central practical case, recovered Ir offsets only a limited share of global PEMEC Ir demand in 2050. The remaining primary Ir requirement should also be interpreted relative to the scale of current primary Ir supply. Under the central practical case, the 2050 remaining primary Ir requirement for global PEMEC manufacturing is 92.8 metric tons/year, compared with current annual primary Ir supply of only about 7 metric tons/year [
30]. This comparison reinforces that recycling alone cannot resolve Ir supply risk. The remaining primary requirement should be interpreted as a material-pressure indicator rather than as evidence that such primary Ir supply would be physically or commercially available.
Ir recycling must therefore be combined with other material-efficiency and supply-risk strategies. These include Ir loading reduction, improved catalyst utilization, longer catalyst durability, recovery-oriented MEA design, low-Ir catalyst development, and broader supply-chain risk management. The conservative practical case further emphasizes this vulnerability: lower collection efficiency, longer recycling delay, and lower Ir technical recovery efficiency substantially reduce available secondary Ir supply. Because Ir recovery from PEM electrolyzer MEAs remains less mature than Pt recovery from PEMFC catalyst material, Ir recovery assumptions should continue to be treated as scenario parameters rather than established commercial averages.
Long-term catalyst substitution could fundamentally change Ir demand if durable, scalable, and commercially viable alternatives become available. However, complete substitution by a specific future year remains uncertain because alternative catalysts must satisfy activity, durability, manufacturability, system-integration, and cost requirements under real operating conditions. Future work should therefore evaluate low-Ir and non-Ir pathways as explicit technology-transition scenarios rather than assuming full substitution in the central case.
6.4. PEMFC Pt Recovery and Cross-Sector Allocation
PEMFC Pt recovery shows a different pattern from PEMEC Ir recovery. PEMFCs have shorter assumed lifetimes, and Pt technical recovery from collected catalyst-bearing material is higher than Ir recovery from PEMEC MEAs. As a result, PEMFC Pt recovery can become a substantial secondary source by 2050 within the PEMFC accounting boundary.
However, recovered Pt should not be interpreted as material automatically reserved for closed-loop PEMFC reuse. Pt is traded in broader PGM markets and is used in autocatalysts, petroleum refining, chemical catalysts, electronics, glass manufacturing, jewelry, and other industrial applications [
5,
8,
30]. Recovered Pt from PEMFCs may therefore be allocated to non-PEM applications if prices, material specifications, contracts, or refining arrangements favor other uses.
This point is especially important for interpreting recycling shares above 100%. In the scenario comparison, global PEMFC Pt exceeds annual PEMFC Pt demand only under the upper-bound effective-collection case. This means that modeled secondary Pt supply exceeds annual PEMFC Pt demand within the PEMFC accounting boundary. It does not imply full Pt market self-sufficiency or guarantee that all recovered Pt would return to PEMFC manufacturing. Any surplus could be stored, exported, sold into other PGM markets, or allocated to competing applications.
The PEMFC Pt results therefore have two implications. First, PEMFC recycling can reduce exposure to primary Pt supply risk. Second, the actual benefit to PEMFC manufacturing depends on market allocation and supply-chain governance. Closed-loop reuse would require mechanisms such as take-back agreements, recycled-content targets, material certification, traceability systems, and long-term contracts between manufacturers and refiners.
6.5. Policy and Infrastructure Implications
The results suggest that recycling policy should focus not only on technical recovery efficiency but also on the system conditions required to make secondary PGMs available at scale. Collection efficiency is a central determinant of secondary supply. Without effective collection systems, end-of-life PEM stacks may remain in storage, be exported, be mixed with lower-value scrap streams, or fail to reach qualified PGM recyclers. Reverse logistics and collection infrastructure should therefore be developed alongside PEM technology manufacturing and deployment.
Extended producer responsibility could support this goal by assigning responsibility for end-of-life stack collection, documentation, and routing. Such policies could require manufacturers or system integrators to establish take-back pathways, document PGM-containing components, and ensure that catalyst-bearing MEAs are sent to qualified recovery facilities. Product passports or traceability systems could further improve recovery by recording stack composition, catalyst loading, manufacturer, installation date, and expected retirement window.
Design-for-recycling is also critical. PEM stacks are not recycled as simple homogeneous material streams. Recovery depends on access to catalyst-bearing MEAs, catalyst-coated membranes, porous transport layers, gas diffusion layers, and other coated or PGM-bearing components. Stack designs that simplify disassembly, reduce contamination, and allow selective separation of catalyst-bearing layers could increase actual recovery and reduce processing costs. Standardized stack designs, labeling of PGM-bearing components, and disassembly protocols could help recyclers process PEM systems more efficiently.
Regional PGM recycling and refining capacity may also be needed as PEM manufacturing and deployment expand. Long transport distances, limited qualified recycling capacity, and export-dependent refining routes can increase delays and reduce the timely availability of recovered material. Regional processing capacity could shorten recycling delays, improve traceability, and support domestic or regional access to recovered PGMs.
Quality standards for recycled catalyst materials are another important policy and industry need. Recovered Ir and Pt must meet material specifications for reuse in high-performance electrochemical systems. Certification standards, testing protocols, and traceability requirements could help build confidence in recycled PGM feedstocks. Without such standards, recovered material may be more likely to enter lower-specification applications rather than return to PEM catalyst production.
6.6. Economic and Environmental Implications of Recovery Potential
The material-flow results estimate the physical potential for secondary Ir and Pt supply under defined recovery-system assumptions. They do not, by themselves, establish that recovery will occur at the modeled scale or that all recovery pathways will be economically viable or environmentally preferable. Actual recovery will depend on the value of recovered PGMs relative to the costs of collection, transportation, stack dismantling, catalyst separation, chemical or thermal processing, purification, refining, permitting, and quality certification. High modeled secondary supply should therefore be interpreted as recoverable material potential rather than guaranteed market supply.
The economics of PEM recycling are likely to vary over time. In the early stages of PEM deployment, end-of-life stack volumes may be low, geographically dispersed, and heterogeneous in design, which could increase collection and processing costs. Under these conditions, public support, producer responsibility mechanisms, take-back agreements, or long-term offtake contracts may be needed to support early recycling infrastructure. As retirement volumes increase, economies of scale may improve the economics of collection, dismantling, and refining, but the timing of this transition will depend on deployment growth, stack lifetimes, regional collection systems, and qualified PGM recovery capacity.
The environmental implications of PEM recycling also require careful interpretation. Recycling can reduce demand for primary Ir and Pt production and may improve material circularity, but recovery processes may also involve energy use, chemical reagents, wastewater treatment, emissions, and transport-related impacts. Hydrometallurgical, pyrometallurgical, and hybrid recovery routes may have different environmental profiles. The preferred route may depend on catalyst composition, membrane materials, stack design, recovery yield, and regional energy and waste-management systems. Therefore, the environmental benefit of PEM recycling should be evaluated relative to primary PGM production and alternative recovery pathways rather than assumed solely from the presence of secondary supply.
These economic and environmental considerations reinforce the need to interpret the modeled recycling shares as material-flow indicators. The results show that end-of-life PEM systems could become important sources of secondary Ir and Pt, especially for PEMFC Pt. However, converting physical recovery potential into actual circular supply will require economically viable recycling pathways, stable reverse-logistics systems, sufficient refining capacity, quality standards for recovered catalyst materials, and policy or market incentives that route end-of-life PEM components to qualified recovery facilities.
6.7. Contribution to PEM Critical-Material Assessment
The contribution of this study is not that it is the first to identify Ir and Pt as critical materials for PEM technologies. Prior studies have already highlighted Ir supply risk and PEM water-electrolysis scale-up [
6,
18], as well as PGM recovery and circular-economy strategies [
11,
12,
13,
14]. The specific contribution of this study is the integration of PEMEC Ir, PEMEC Pt, and PEMFC Pt into a single transparent material-flow framework for global and U.S. cases through 2050.
Several features distinguish the framework from prior critical-material and recycling assessments. First, the model evaluates secondary supply from both PEM electrolyzers and PEM fuel cells, rather than focusing only on electrolyzer material demand or only on recycling process performance. Second, it separates end-of-life metal stock, collection efficiency, technical recovery efficiency, recycling delay, material losses, remaining primary requirement, and surplus. This separation is important because technical recovery efficiency alone does not determine actual secondary supply. Third, the model links recovered material to annual PEM-sector Ir and Pt requirements, allowing secondary supply to be compared with annual demand under a clearly defined accounting boundary. Fourth, the framework reports central practical recovery results together with structured scenario ranges, including recovery-system cases, catalyst-loading sensitivities, combined uncertainty outputs, cumulative material-flow outcomes, and Ir supply context in the
Supplementary Materials.
This distinction is important for interpreting the results. Studies focused on primary Ir demand or catalyst-loading reduction show the scale of material pressure associated with PEM electrolyzer growth. Studies focused on recycling technologies show that recovery pathways can reduce material cost and environmental impacts under suitable process conditions. The present study connects these perspectives by estimating when end-of-life PEM-derived Ir and Pt could become available, how much annual PEM-sector demand they could offset, and how incomplete collection, processing delays, and recovery losses reduce practical secondary supply.
The framework therefore contributes to critical-material planning by showing that PEM recycling can reduce but not eliminate future primary Ir and Pt requirements. For PEM electrolyzers, Ir remains the limiting material even when central practical recovery assumptions are included. For PEM fuel cells, Pt recovery can become a substantial secondary source, but recovered Pt should not be interpreted as guaranteed closed-loop PEMFC supply because it may enter broader PGM markets. These findings support combined strategies that include recycling infrastructure, design-for-recycling, catalyst thrifting, low-Ir catalyst development, improved durability, traceability systems, and market mechanisms that can direct recovered PGMs toward high-priority uses.
7. Limitations and Future Work
This study provides a transparent material-flow assessment of potential secondary Ir and Pt supply from post-consumer end-of-life PEM technologies. The model accounts for DOE annual PEM manufactured-capacity inputs, catalyst loading, lifetime distributions, collection efficiency, technical recovery efficiency, recycling delay, loss accounting, remaining primary requirement, surplus, and recycling share. The results should nevertheless be interpreted within the physical accounting boundary of the model. Several limitations remain, particularly with respect to capacity-input uncertainty, historical stock coverage, recovery-system scale-up, market allocation, catalyst evolution, economic feasibility, environmental impacts, and empirical validation.
7.1. DOE Capacity-Input and Scenario Uncertainty
The model uses DOE annual PEM manufactured-capacity inputs to estimate future Ir and Pt demand [
15]. These inputs provide a transparent basis for the analysis, but they should not be interpreted as deterministic forecasts. The DOE annual series represents manufactured-capacity requirements that include both new deployment and replacement systems. The public DOE figure dataset does not provide a separate decomposition of annual capacity into net-new deployment and replacement capacity. Therefore, this study treats the DOE annual series as an exogenous total annual capacity input for estimating material demand.
This treatment avoids double-counting replacement demand because the model does not add a separate replacement-demand term to the DOE annual input. End-of-life retirements are modeled separately only to estimate potential secondary Ir and Pt supply from previously manufactured PEM systems. However, because net-new deployment and replacement capacity are not separated in the DOE public figure data, the model cannot independently evaluate how much annual demand is driven by growth versus replacement. Future work should use datasets that separately report cumulative installed stock, net-new additions, retirements, and replacement requirements to distinguish growth demand from replacement demand more explicitly.
Actual PEM manufacturing and deployment requirements through 2050 may differ from the DOE trajectory because of hydrogen policy, electricity prices, electrolyzer and fuel-cell costs, infrastructure development, permitting, supply-chain constraints, industrial hydrogen demand, transportation-sector adoption, and final investment decisions. Alternative capacity pathways could change both annual PGM demand and the timing of future end-of-life material availability.
To provide a bounded test of capacity-pathway uncertainty, the
Supplementary Materials includes alternative capacity-input scenarios in which the DOE annual manufactured-capacity trajectory is scaled downward, scaled upward, or delayed. These cases are not intended to replace the DOE reference pathway; rather, they show how the material-flow results respond to plausible differences in the timing and magnitude of future PEM manufacturing requirements. The results should therefore be interpreted as conditional on the selected capacity-input pathway and the associated recovery-system assumptions.
7.2. Historical Stock and Early End-of-Life Availability
The model starts in 2020 and does not explicitly include pre-2020 in-use PEM stocks. The DOE public figure dataset used for the annual PEM manufactured-capacity inputs begins in 2020 and does not provide a consistent historical installed-stock series by region and technology. As a result, PEM systems deployed before 2020 cannot contribute to modeled end-of-life material availability in the main analysis.
This limitation is most relevant for early PEMFC Pt recovery because PEMFC systems existed before 2020 and have shorter assumed lifetimes than PEMECs. In contrast, the effect is expected to be smaller for PEMEC Ir and Pt results by 2050 because pre-2020 PEM electrolyzer deployment was limited relative to the projected mid-century DOE manufactured-capacity inputs.
To bound the effect of this assumption, the
Supplementary Materials includes a historical-stock sensitivity for PEMFC Pt. The analysis compares the current zero pre-2020 stock boundary with low and high illustrative pre-2020 PEMFC stock cases. These bounding cases are used to evaluate how omitted historical PEMFC stock could affect early secondary Pt availability. The effect is most relevant before 2035 because PEMFCs have shorter assumed lifetimes and some PEMFC deployment occurred before 2020. The bounding analysis does not change the main 2050 PEMEC Ir and Pt conclusions, which are driven primarily by post-2020 DOE manufactured-capacity inputs.
Future work should incorporate historical installed-stock estimates, retirement data, and application-specific PEMFC fleet information to improve early-period secondary-supply estimates. This would allow future models to distinguish more clearly between secondary supply from historical PEMFC deployment and secondary supply from the post-2020 manufactured-capacity inputs used in the present analysis.
7.3. Recovery-System and Scale-Up Uncertainty
The collection and technical recovery parameters used in this study are scenario assumptions rather than measured global PEM recycling averages. Actual collection rates may vary by region, ownership model, application, stack size, take-back agreements, recycling policy, and the presence of traceability systems. Technical recovery yields may vary by catalyst chemistry, MEA design, pretreatment method, recycling route, contamination level, refining facility, and material-quality requirements.
The central practical case should therefore be interpreted as an intermediate recovery-system scenario, not as a prediction of future global recycling performance. Large-scale PEM-specific recycling systems are still emerging, and public data on stack collection rates, disassembly yields, Ir recovery from PEMEC MEAs, Pt recovery from PEMFC catalyst layers, and recycling-delay distributions remain limited. Future work should calibrate collection and recovery parameters using empirical data from pilot-scale and commercial PEM recycling operations as such data become available.
7.4. Market Allocation and Closed-Loop Reuse
The model uses a PEM-sector accounting boundary. It compares Ir and Pt recovered from end-of-life PEM systems with annual PEM-sector demand, but it does not assume that recovered PGMs automatically return to PEM manufacturing. Recovered Pt and Ir enter broader PGM markets and may be stored, exported, sold to other sectors, or allocated to competing industrial applications depending on prices, refining specifications, contractual arrangements, regional recycling capacity, and policy incentives.
This limitation is especially important when recycling shares approach or exceed 100%. A value above 100% means only that secondary supply exceeds annual PEM-sector demand within the modeled boundary. It does not imply full PGM market self-sufficiency or guaranteed closed-loop reuse. Future work should extend the model to a multi-sector PGM allocation framework that includes competing demand from auto-catalysts, chemical catalysts, electronics, petroleum refining, glass manufacturing, and other PGM-using sectors.
7.5. Catalyst Loading, Substitution, and Technology Change
The main results use constant catalyst loading rates as reference values, while supplementary cases evaluate loading-reduction pathways and alternative PEMFC Pt-loading assumptions. These sensitivities are illustrative rather than predictive because future Ir and Pt loadings will depend on catalyst activity, durability, MEA design, system efficiency, operating conditions, application mix, and commercial adoption of low-PGM technologies.
Lower future loadings would reduce annual primary material requirements, but they could also change recycling shares because end-of-life systems may contain higher metal loadings than newly manufactured systems. This vintage effect is important for interpreting recycling shares under catalyst-thrifting scenarios. Future work should link loading trajectories to technology-learning models, application-specific PEMFC fleets, performance requirements, and durability constraints rather than treating loading reduction as an independent parameter.
The model also does not assume full substitution of Ir or Pt by a specific future year. Complete substitution would fundamentally change material demand, but it remains uncertain because alternative catalysts must meet simultaneous requirements for activity, durability, manufacturability, system integration, and cost. This is particularly challenging for Ir replacement in acidic PEM electrolyzer oxygen-evolution environments. Future work should evaluate low-Ir, non-Ir, low-Pt, and non-Pt pathways as explicit technology-transition scenarios.
7.6. Future Techno-Economic and Life-Cycle Assessment Needs
The present model quantifies physical material-flow potential but does not include techno-economic analysis, price feedback, investment behavior, or life-cycle assessment. It does not estimate collection costs, dismantling labor, transportation costs, capital investment, process operating costs, reagent costs, energy use, refining margins, permitting costs, recycled-material certification costs, or the market value of recovered Ir and Pt.
Future work should integrate techno-economic assessment with the material-flow framework to evaluate when PEM recycling is financially viable at different deployment scales and end-of-life volumes. Such analysis should also include price feedback and investment behavior because PGM prices may influence catalyst thrifting, recycling investment, collection incentives, substitution research, and allocation of recovered PGMs across competing sectors.
Life-cycle assessment is also needed to evaluate the environmental performance of PEM recycling pathways. Future work should compare primary and secondary Ir and Pt supply in terms of greenhouse-gas emissions, energy use, water use, chemical reagent demand, wastewater generation, solid waste, transport impacts, and regional environmental burdens. Such analysis should distinguish between hydrometallurgical, pyrometallurgical, and hybrid recovery routes and should account for differences in recovery yield, material quality, stack design, and regional energy systems.
7.7. Manufacturing Scrap, Refurbishment, and Data Gaps
The model does not include manufacturing scrap, rejected catalyst-coated membranes, catalyst-coating residues, in-plant recycling loops, or stack refurbishment flows. These streams could provide earlier and potentially higher-yield secondary Ir and Pt than post-consumer end-of-life systems because they may be generated in controlled manufacturing environments and routed directly to internal recycling or qualified refiners. However, they require data that are not consistently available in public sources, including catalyst-coated membrane rejection rates, coating and ink-preparation losses, MEA fabrication yields, stack refurbishment frequency, component replacement rates, internal recycling yields, and the extent to which recovered material is returned to catalyst production.
Excluding these streams means that the results should be interpreted as post-consumer end-of-life recovery potential, not total secondary PGM supply from all PEM manufacturing, maintenance, and retirement pathways. Future work should extend the model to include manufacturing scrap, internal recycling loops, refurbishment-related component replacement, and component-level retirement flows when consistent data become available.
Several additional data gaps remain. Public data are limited for PEM stack lifetimes by application, regional deployment by technology type, actual collection rates, disassembly yields, Ir recovery performance from PEMEC MEAs, recycling delay distributions, recycled-catalyst quality, and allocation of recovered PGMs across end-use sectors. Better reporting of these parameters would improve future material-flow assessments and support more accurate planning for circular PEM supply chains.
Overall, the results should be interpreted as scenario-based estimates of physical secondary supply potential under clearly stated assumptions. They show that recycling can reduce primary Ir and Pt requirements, but future work is needed to evaluate how deployment uncertainty, historical stock, technology change, collection infrastructure, market allocation, economic viability, and environmental impacts shape the real-world contribution of PEM recycling to critical-material supply resilience.
8. Conclusions
This study evaluated the potential contribution of end-of-life recovery of iridium (Ir) and platinum (Pt) from proton exchange membrane electrolyzer cells (PEMECs) and proton exchange membrane fuel cells (PEMFCs) using a scenario-based material-flow analysis for global and U.S. markets from 2020 to 2050. The model estimates annual metal demand, end-of-life metal stocks, secondary supply, remaining primary requirement, surplus, and recycling shares using DOE annual PEM manufactured-capacity inputs, catalyst loading rates, distributed system lifetimes, collection efficiency, technical recovery efficiency, recycling delay, and material-loss accounting. The analysis is limited to post-consumer end-of-life PEM systems and does not include manufacturing scrap, rejected catalyst-coated membranes, in-plant recycling loops, or refurbishment-related component replacement.
The results show that end-of-life PEM recovery can meaningfully reduce future primary PGM requirements, but it cannot eliminate the need for primary Ir and Pt during rapid PEM technology scale-up. Under the central practical case, recovered Ir supplies 16.9% of global PEMEC Ir demand and 3.8% of U.S. PEMEC Ir demand in 2050. Recovered PEMEC Pt supplies 32.2% of global PEMEC Pt demand and 7.3% of U.S. PEMEC Pt demand. For PEMFCs, recovered Pt supplies 75.1% of global PEMFC Pt demand and 51.2% of U.S. PEMFC Pt demand in 2050. These results indicate that PEMFC Pt recovery can become a substantial secondary supply source, whereas Ir recovery from PEM electrolyzers remains more limited relative to projected demand.
The scenario comparison shows that recovery outcomes are highly sensitive to collection efficiency, recycling delay, lifetime treatment, and Ir recovery assumptions. The upper-bound effective-collection case provides an estimate of maximum physical recovery potential under ideal collection and immediate recovered-metal availability, while the central and conservative practical cases show how incomplete collection, processing delays, and lower Ir recovery reduce available secondary supply. Supplementary catalyst-loading sensitivities and combined uncertainty analyses further show that catalyst thrifting affects both annual demand and future end-of-life metal availability.
Ir remains the more critical material constraint for PEM electrolyzer scale-up. Even under the central practical case, recovered Ir offsets less than one-fifth of global PEMEC Ir demand in 2050, leaving a remaining primary Ir requirement of 92.8 metric tons/year. This value is more than an order of magnitude larger than current annual primary Ir supply [
30]. Recycling should therefore be viewed as a necessary but insufficient component of Ir supply-risk management. It must be combined with Ir loading reduction, improved catalyst utilization, longer catalyst durability, recovery-oriented MEA design, low-Ir catalyst development, and broader supply-chain strategies.
The PEMFC Pt results show stronger potential for circular supply, but they require careful interpretation. A recycling share above 100% means only that recovered Pt exceeds annual PEMFC Pt demand within the modeled accounting boundary. It does not imply full Pt market self-sufficiency or guaranteed closed-loop reuse in PEMFCs. Recovered Pt and Ir enter broader PGM markets and may be stored, exported, sold to other sectors, or allocated to competing industrial applications depending on prices, contracts, refining capacity, material specifications, and policy incentives.
Overall, the findings suggest that PEM recycling can become an important component of future critical-material management for hydrogen technologies. Realizing this potential will require more than high technical recovery efficiency. Effective reverse logistics, stack collection systems, design-for-recycling, standardized disassembly protocols, regional PGM recycling and refining capacity, traceability systems, and quality standards for recycled catalyst materials will be needed to convert end-of-life PEM systems into reliable secondary Ir and Pt supply. Future work should integrate material-flow analysis with techno-economic assessment, life-cycle assessment, alternative capacity pathways, catalyst-thrifting and substitution scenarios, historical stock reconstruction, and multi-sector PGM allocation models to evaluate how recovered PGMs can support resilient, economically viable, and circular hydrogen technology supply chains.