1. Introduction
Mining constitutes one of Chile’s principal economic activities and plays a strategic role in international markets. The country is the world’s leading copper producer, accounting for approximately 35% of global output, thereby consolidating the mining sector as a fundamental pillar of the national economy [
1,
2]. Following the end of the commodities supercycle, productivity has emerged as one of the most significant challenges for maintaining the sustainability and competitiveness of the industry. Improvements in productivity not only contribute to economic growth but also help mitigate the slowdown observed in resource-dependent economies [
2]. This challenge has become increasingly pronounced due to the growing social and environmental demands imposed on mining operations [
3], positioning productivity as a strategic determinant of the sector’s long-term viability.
Within this context, medium-scale mining assumes particular relevance. In 2023, this segment produced 226,151 tonnes of fine copper, representing 4.2% of total national production, while also generating substantial levels of investment and exports [
4]. The Coquimbo Region is especially significant in this regard, as it ranks as the country’s third-largest copper-producing region, providing a particularly relevant context for the analysis of mining productivity.
The management of productivity is further challenged by the progressive depletion of mineral deposits, declining ore grades, and rising operational costs [
5,
6,
7]. Simultaneously, the global energy transition is increasing pressure on the sector to enhance efficiency and productive capacity [
6], thereby intensifying the demands placed on mining operations management.
Furthermore, mining activities are increasingly embedded within global value chains characterized by greater specialization, extensive outsourcing, and a growing dependence on innovations developed outside mining companies [
8,
9]. In this environment, suppliers have evolved beyond their traditional operational functions to assume strategic roles associated with innovation, process optimization, and technological development [
10,
11]. Consequently, they have become critical actors capable of influencing both productive performance and the adaptive capacity of mining operations.
The literature acknowledges that the optimization of mining performance requires systematic approaches capable of supporting decision-making in complex operational environments [
12]. However, a substantial proportion of existing studies address productivity from fragmented perspectives, focusing on isolated dimensions such as costs, workforce performance, or specific operational variables [
2]. Similarly, factors associated with the productive environment and the role of suppliers have received limited attention within integrated evaluation frameworks. As a result, important limitations remain regarding the simultaneous assessment and prioritization of multiple productivity determinants within a unified decision structure.
In response to this challenge, multi-criteria decision-making (MCDM) methods have gained increasing prominence as effective tools for supporting complex decision-making processes in the mining sector. These methods have been applied to a wide range of areas, including mine planning, risk management, sustainability assessment, and productivity improvement [
13]. Among the available approaches, the Analytic Hierarchy Process (AHP) was selected as the methodological framework for this study because of its ability to systematically structure, compare, and prioritize decision factors. Its theoretical foundation, methodological justification, and implementation procedure are presented in detail in the methodology section [
14,
15,
16].
Several studies have employed AHP to prioritize productivity-related factors in mining contexts [
17,
18,
19,
20]. At the regional level, Ramírez et al. [
21] applied this approach to the selection of explosive suppliers in small- and medium-scale mining operations. Nevertheless, existing applications remain largely confined to specific decision problems and do not conceptualize productivity through a comprehensive framework that simultaneously integrates operational, organizational, external factors, and productive-environment dimensions.
Consequently, a conceptual, methodological, and empirical gap persists in medium-scale mining, particularly within the Coquimbo Region, where no structured framework currently exists to simultaneously compare and rank productivity factors within a single decision structure.
Accordingly, the objective of this research is to identify and rank the critical factors associated with the productivity of medium-scale mining in the Coquimbo Region through the application of AHP, with the purpose of supporting decision-making processes and strategically guiding resource allocation.
The principal contribution of this study lies in the development of a hierarchical decision-support framework specifically designed to evaluate mining productivity by integrating Internal factors, External factors, and productive-environment elements within a single evaluation structure. In addition, the research incorporates multidimensional sensitivity analysis to assess the structural stability and model robustness of the priorities obtained under different decision scenarios. Through this approach, the study contributes to the mining management literature by providing empirical evidence and a methodologically replicable decision-support tool for the prioritization of productivity factors in operational contexts characterized by multiple constraints and complex decision environments.
2. Problem Statement
Mining productivity is influenced by a wide range of technical, organizational, human, and contextual factors that collectively affect operational performance. Consequently, effective productivity management requires not only the identification of relevant factors but also the determination of which factors should be prioritized when available resources are constrained.
In practice, mining companies operate under technical, economic, and operational limitations that prevent the simultaneous implementation of actions targeting all factors associated with productive performance. As a result, productivity management becomes a problem of resource allocation and action prioritization, in which decision-making must focus on those factors offering the greatest potential for performance improvement.
This need is particularly relevant in medium-scale mining, where resource constraints are frequently more pronounced than in large-scale operations. Despite ongoing efforts to improve productive performance, this segment continues to exhibit significant productivity gaps compared with larger-scale mining operations [
22]. Moreover, structural challenges such as deposit depletion, declining ore grades, increasing energy costs, water scarcity, and the misalignment between productivity and labor costs further intensify pressure on the productive system [
2].
Furthermore, mining operations must manage factors that differ substantially in terms of controllability. While some factors correspond to internal capabilities that can be directly managed by the organization, others are determined by external conditions associated with market dynamics, regulatory frameworks, resource availability, and the productive environment. The coexistence of factors with different characteristics complicates the identification of those that should be prioritized when budgetary, operational, or managerial constraints are present.
Consequently, the primary challenge does not lie in identifying productivity factors, which have been extensively documented in the literature, but rather in the absence of decision-support tools capable of establishing relative priorities among these factors within a unified decision structure. This limitation hinders effective resource allocation, the formulation of improvement strategies, and the implementation of interventions focused on those factors with the greatest potential influence on productive performance.
Given this context, there is a need to address productivity as a structured decision problem aimed at identifying and ranking critical factors within a resource-constrained environment. From this perspective, productivity should not be understood exclusively as an operational outcome but rather as a prioritization problem in which decision-making requires distinguishing among multiple factors that simultaneously compete for scarce organizational resources.
3. Methodology
3.1. Decision-Making Process
MCDM enables the evaluation of alternatives based on multiple criteria that may be mutually conflicting, a situation commonly encountered in complex systems such as the mining industry. In this context, criteria represent relevant evaluation dimensions, whereas alternatives correspond to feasible options considered for achieving a specific goal.
MCDM methods have been widely employed to address complex decision problems involving multiple conflicting criteria and substantial volumes of information, becoming established as important tools within operations research and decision analysis [
23]. These approaches are particularly valuable in contexts characterized by uncertainty, incomplete information, and the participation of multiple stakeholders, as they facilitate the structuring of complex problems and enhance the transparency of the decision-making process. Nevertheless, the final decision remains dependent on expert judgment and the specific context in which the methodology is applied [
24].
Within the mining sector, the literature indicates that MCDM methods have been applied primarily to mine planning and to the resolution of strategic and operational challenges, encompassing decision-making processes at the strategic, tactical, and operational levels [
13,
25]. These applications have consolidated multi-criteria approaches as valuable methodological tools in mining-related research and practice [
26].
3.2. Analytic Hierarchy Process
The AHP, developed by Saaty [
14], is one of the most widely adopted multi-criteria methodologies for structuring and prioritizing complex decision problems. Its principal contribution lies in organizing decision problems through a hierarchical structure and incorporating expert judgment through pairwise comparison procedures to derive quantifiable priorities, thereby integrating both quantitative and qualitative information within a unified analytical framework [
14,
27]. The method has been extensively applied across engineering, economics, and management disciplines, including the mining industry, where it is frequently used to prioritize critical variables in contexts characterized by uncertainty and high operational complexity [
28,
29].
From an operational perspective, AHP decomposes the decision problem into a hierarchical structure consisting of a goal, criteria, subcriteria, and alternatives. Based on pairwise comparisons conducted using standardized evaluation scales, the method generates relative priorities that enable the determination of the importance of each element within the analyzed system [
15]. This capability is particularly valuable when information is incomplete or uncertain and when causal relationships cannot be established with precision [
14,
27].
A distinctive characteristic of the method is its ability to evaluate judgment consistency through the consistency ratio (CR), which enables the verification of the internal coherence of pairwise comparisons. Values equal to or below 0.10 are generally considered acceptable in multi-criteria studies, thereby ensuring the reliability of the resulting priorities. This mechanism contributes to quality control in expert judgment and reduces potential inconsistencies associated with the inherent subjectivity of expert evaluation [
14,
30,
31].
Among the available MCDM methods, AHP was selected because of its suitability for addressing mining productivity as a prioritization problem under conditions of uncertainty and operational constraints. Specifically, the method enables: (i) the hierarchical structuring of criteria, subcriteria, and alternatives; (ii) the integration of quantitative and qualitative information; and (iii) the transformation of expert judgment into comparable priorities [
14,
32]. Furthermore, its application has been extensively documented in production- and performance-related studies, establishing it as an appropriate methodological tool for the analysis of complex productive systems [
33,
34].
In addition, AHP facilitates sensitivity analysis, allowing the evaluation of the stability of the priorities obtained under variations in the weights assigned to the criteria. This capability is particularly relevant given the limited integration between prioritization processes and robustness analysis reported in the literature [
35,
36,
37]. In the present study, sensitivity analysis complements the identification of priority factors by enabling the assessment of the structural stability of the results under different decision scenarios [
35]. Consequently, AHP constitutes the methodological foundation supporting the development of the proposed decision model.
Despite its advantages, AHP presents several limitations. First, the method relies on subjective judgments, which may introduce biases associated with the perceptions and experiences of the participants [
14]. Second, it assumes independence among the evaluated elements, potentially oversimplifying the interdependent nature of complex systems [
36]. Finally, phenomena such as rank reversal may affect the stability of the resulting ranking, although their influence can be evaluated through sensitivity analysis [
35].
Nevertheless, the incorporation of sensitivity analysis in the present study enables a systematic examination of result stability and strengthens the interpretation of the priorities obtained, representing a valuable complement to conventional applications of AHP within the mining sector [
35,
37].
3.3. AHP Fundamentals
A fundamental characteristic of the AHP is the use of pairwise comparison procedures. Elements belonging to the same hierarchical level are compared with respect to an element located at the immediately higher level, which serves as a common evaluation reference. Through these comparisons, participants express the relative importance of one element over another, enabling qualitative judgments to be transformed into quantitative priorities.
The pairwise comparison of a set of elements results in a square reciprocal pairwise comparison matrix A = [a
ij], where each element a
ij represents the relative importance of element (i) with respect to element (j) and satisfies the reciprocal property a
ij = 1/a
ji. The judgments expressed through these comparisons constitute the basis for deriving the priority weights associated with the evaluated elements. The general form of the pairwise comparison matrix is presented in Equation (1).
Priority estimation is performed using the eigenvector method. To this end, the principal eigenvector of the pairwise comparison matrix, associated with its maximum eigenvalue λ
max, is calculated. The components of this vector represent the relative weights of the evaluated elements, reflecting their contribution within the decision structure. The mathematical relationship used for its determination is presented in Equation (2).
An important advantage of the AHP methodology is its ability to evaluate the logical consistency of the judgments provided. Because pairwise comparisons are based on subjective assessments, inconsistencies may arise during the evaluation process. To address this issue, the method incorporates a verification procedure based on the consistency index (CI) and the consistency ratio (CR). The consistency index is calculated using Equation (3):
where λ
max corresponds to the principal eigenvalue of the pairwise comparison matrix and (n) represents the matrix dimension.
Subsequently, the CR is obtained by comparing the consistency index with the Random Index (RI), which represents the expected level of inconsistency in randomly generated pairwise comparison matrices. In general, CR values equal to or below 0.10 are considered acceptable, indicating an adequate level of coherence among the judgments provided by the evaluators [
14].
The combination of hierarchical structuring, pairwise comparisons, priority derivation, and consistency evaluation has contributed to the widespread application of AHP in complex engineering and management problems. In the mining context, this methodology enables the integration of technical, organizational, and operational criteria within a coherent and quantifiable decision structure.
3.4. Methodological Structuring
Hierarchical structuring constitutes a critical stage within the AHP, as it determines how the decision problem is represented and directly influences the quality and validity of the results obtained [
14]. This phase involves defining the goal of the analysis, identifying the relevant criteria, subcriteria, and alternatives, and constructing a hierarchy that represents the relationships among the evaluated elements. The literature indicates that an inadequate definition of the hierarchical structure may introduce bias into the results and compromise the validity of the decision model [
30,
36]. In general, the methodology follows a sequence consisting of problem definition, goal establishment, identification of criteria and alternatives, and construction of the corresponding hierarchy [
14]. This approach has been widely validated in MCDM studies applied to complex productive systems [
35,
37].
In the present study, hierarchical structuring enables the representation of mining productivity as a multi-criteria decision-making problem in which critical factors are modeled as evaluation elements whose relative importance is determined through expert judgment. This approach addresses a limitation identified in the literature, where productivity-related factors are frequently analyzed independently rather than being integrated into a structured prioritization framework [
28,
35].
The proposed hierarchical structure integrates Internal factors, External factors, and elements associated with the productive environment within a single decision model. This configuration provides a more comprehensive representation of the relative priorities associated with mining productivity and enables the simultaneous evaluation of multiple dimensions within the same decision structure [
33,
34]. The developed hierarchy consists of an overall goal focused on the prioritization of productivity factors, main criteria representing the principal dimensions of the productive system, subcriteria that further disaggregate these dimensions, and a set of specific decision factors evaluated through pairwise comparison procedures. Consequently, the hierarchy provides an organized representation of the elements considered relevant to the productivity of medium-scale mining in the Coquimbo Region.
In this context, AHP was implemented following its standard methodological procedure, including pairwise comparison, priority weight calculation using the eigenvector method, and consistency verification. The only methodological adaptation involved the procedure used to construct the group judgment matrix from the individual evaluations provided by the participating experts.
The evaluations obtained from the 16 experts were consolidated to construct a representative group judgment matrix. To achieve this objective, all responses corresponding to each pairwise comparison were organized, and the value most frequently selected by the participants was identified. The use of the mode as the aggregation criterion was intended to represent the predominant opinion of the expert panel while preserving the discrete values originally expressed within the evaluation scale employed. Consequently, each element of the group judgment matrix corresponds to the most frequently observed judgment for the respective pairwise comparison.
The resulting judgment matrix was subsequently incorporated into Expert Choice software Version 11 to obtain priority weights and relative weights through the AHP model. Finally, matrix consistency was verified through the CR following the procedure proposed by Saaty [
14].
3.5. Sensitivity Analysis
Sensitivity analysis constitutes a fundamental stage in multi-criteria decision models, particularly in expert-judgment-based approaches such as AHP, where the inherent subjectivity of judgments requires an explicit evaluation of model robustness. This procedure involves systematically modifying the weights associated with criteria and subcriteria to analyze the effects of such variations on the prioritization of decision factors.
Within the context of AHP, sensitivity analysis enables the assessment of result stability in response to changes in the judgments and weightings incorporated into the model through controlled modifications of input values and observation of their effects on the global ranking of alternatives. When such variations do not produce significant changes in the order of priorities, the results may be considered stable and reliable [
36,
37,
38,
39]. However, in complex systems, even minor modifications may generate meaningful changes in the ranking, making additional analysis necessary to evaluate model coherence and robustness [
40].
Beyond its validation function, sensitivity analysis facilitates the identification of stability and transition zones within the decision system, revealing the extent to which the ranking depends on the model’s initial conditions. It also enables the identification of dominant or latent factors whose relative importance may emerge under marginal variations in criterion weights, thereby providing a deeper understanding of the structural behavior of the system. Consequently, sensitivity analysis not only contributes to validating result stability but also expands the interpretative scope of the findings by enabling the anticipation of changes in prioritization under different decision scenarios. This capability strengthens both process reliability and the validity of the strategic decisions derived from the proposed model [
41].
The sensitivity assessment was conducted using the analytical tools incorporated into Expert Choice software (Version 11), which enable the dynamic visualization of variations in global priorities resulting from controlled perturbations of criterion weights. In the present study, the interpretation focuses on the relative evolution of decision factors rather than on absolute values, a criterion consistent with the objective of understanding the internal logic and structural behavior of the productive system.
In the figures corresponding to the Performance Sensitivity Analysis and Gradient Sensitivity Analysis , the color legend identifies the decision factors represented in each analysis. Because color assignment is automatically generated by Expert Choice software (Version 11), the same decision factor may appear in different colors across figures. Accordingly, each figure should be interpreted independently, considering the correspondence among the legend, graphical lines, and associated labels.
It should also be noted that some figures exhibit partial label overlap due to the high number of decision factors incorporated into the model. Nevertheless, this overlap does not affect the scientific interpretation of the results, as the analysis is primarily based on the identification of structural patterns, including trends, slopes, crossover points, and changes in the relative hierarchy of factors, rather than on the precise reading of numerical values or individual labels. To facilitate interpretation, explanatory labels were incorporated within the graphs to highlight dominant factors and the principal hierarchical relationships observed, thereby improving figure readability and guiding the analysis toward the most relevant elements in models containing a large number of decision variables.
3.6. Reliability and Consistency Assessment
3.6.1. Questionnaire Reliability
The reliability of the questionnaire used to collect expert judgment was evaluated using Cronbach’s alpha coefficient, one of the most widely employed indicators for assessing the internal consistency of measurement instruments. This coefficient enables the evaluation of the degree of homogeneity among the items comprising an instrument, thereby verifying whether they consistently measure the same underlying construct [
42].
Cronbach’s alpha coefficient is expressed on a scale ranging from 0 to 1, where higher values indicate greater internal consistency. According to widely accepted criteria in the literature, coefficients above 0.70 are considered adequate for applied research, whereas values exceeding 0.80 indicate high levels of reliability.
In the present study, the analysis was performed using the responses provided by the participating experts to verify the internal consistency of the collected data before its incorporation into the AHP model. The results demonstrated a satisfactory level of reliability, indicating that the instrument exhibited adequate internal coherence and that the collected responses were suitable for supporting the subsequent analysis.
Complementarity Between Reliability and Consistency: Although both indicators are associated with data quality, they evaluate distinct and complementary dimensions of reliability. Cronbach’s alpha coefficient assesses the internal consistency of the measurement structure used to collect expert judgments, whereas the CR evaluates the logical coherence of the pairwise comparisons employed within the AHP methodological framework. Consequently, Cronbach’s alpha provides evidence regarding the reliability of the measurement process, while the CR verifies the coherence of the judgments used to estimate priority weights. Because both indicators assess different methodological aspects, their combined application provides complementary evidence regarding the robustness of the collected data and does not constitute a redundant evaluation.
3.6.2. Consistency Ratio Assessment
The coherence of the judgments provided by the experts was evaluated using the CR proposed by Saaty [
14]. Within the AHP framework, decision-makers perform pairwise comparisons among criteria and subcriteria to express their relative importance. Because these comparisons are based on human judgment, inconsistencies may arise and must be verified before estimating the final priorities.
The CR constitutes a quantitative measure of judgment coherence and is calculated from the relationship between the CI and the RI corresponding to matrices of the same dimension [
14,
36]. According to Saaty [
14], CR values below 0.10 are considered acceptable, indicating that the judgments exhibit an adequate level of consistency for priority estimation. Conversely, values above this threshold suggest the need to review the pairwise comparisons in order to improve the logical coherence of the model.
In this research, all consistency calculations were performed using Expert Choice software Version 11, which automatically determines consistency indicators for each pairwise comparison matrix generated during the analysis process. The results showed that all evaluated matrices presented CR values below the acceptability threshold established in the literature, demonstrating an adequate level of logical coherence in the judgments provided by the experts. Consequently, all evaluations were considered valid and were incorporated into the final analysis.
4. Problem Structuring
4.1. Definition and Identification of the Goal, Criteria, Subcriteria, and Decision Factors
Problem structuring constitutes a fundamental stage in the application of the AHP, as it establishes the hierarchical organization of the model and defines the relationships among the elements considered within the decision-making process. In this study, the structure employed to analyze the productivity of medium-scale mining in the Coquimbo Region was developed through a comprehensive review of the specialized scientific and technical literature, enabling the identification, classification, and organization of productivity-related factors within a conceptually coherent hierarchical framework.
The overall goal of the model is to prioritize the factors associated with the productivity of medium-scale mining in the Coquimbo Region, thereby providing a decision-support framework for contexts characterized by multiple evaluation criteria and operational constraints. Within this perspective, the problem is addressed as a multi-criteria prioritization exercise based on expert judgment, aimed at determining the relative importance of the elements incorporated into the proposed structure.
Unlike conventional AHP applications focused on selecting among mutually exclusive alternatives, the objective of this research is not to identify a single optimal option. Consequently, the terminal level of the hierarchy is composed of decision factors, understood as specific elements associated with mining productivity whose relative importance is estimated through pairwise comparisons performed by industry experts.
The hierarchical structure was organized into four levels:
Level 1—Goal: Prioritize the factors associated with the productivity of medium-scale mining in the Coquimbo Region.
Level 2—Criteria: Correspond to the principal structural dimensions of the model. In this study, two categories are distinguished: Internal Factors and External Factors. This classification is based on the conceptual framework proposed by Velásquez et al. [
43], which differentiates between elements associated with the organizational domain and those linked to the external operating environment.
Level 3—Subcriteria: Represent thematic groupings derived from the specialized literature and are used to organize the various dimensions related to mining productivity into homogeneous and analytically distinct categories.
Level 4—Decision Factors: Correspond to the terminal evaluation elements of the model. These factors were defined through the integration of evidence from the scientific literature, technical reports from the mining sector, and expert validation.
The definition of this structure was supported by evidence recognizing mining productivity as a multidimensional phenomenon that requires the simultaneous consideration of organizational and contextual factors. Accordingly, the hierarchical tree was constructed using the conceptual framework proposed by Velásquez et al. [
43] as the primary reference, complemented by empirical and conceptual evidence obtained from subsequent studies and specialized technical documents.
The Internal Factors criterion encompasses elements associated with the organizational and operational domains of the mining company. Its inclusion is supported by evidence highlighting the influence of planning, management, human resources, technology, safety, and operational practices on productive performance.
Conversely, the External Factors criterion comprises elements related to the economic, regulatory, geological, social, and market environment within which mining operations are conducted. Although these factors are beyond the direct control of the organization, their inclusion is essential to ensure a comprehensive representation of the operational context in which mining activities take place.
Collectively, the proposed structure represents the problem through a hierarchical multi-criteria framework in which the relative importance of the different elements is estimated based on expert judgment. This approach facilitates the identification of priorities and contributes to supporting planning processes, resource allocation, and the effective direction of management efforts.
The complete hierarchy of the model, comprising 2 criteria, 16 subcriteria, and 44 decision factors, is presented in
Table 1. This structure synthesizes the integration of theoretical evidence, technical background, and expert knowledge incorporated throughout the model development process.
It should be noted that all elements located at the terminal level of the hierarchy are designated as decision factors, regardless of the hierarchical path through which they are represented. In certain cases, specific subcriteria do not require further decomposition due to their level of conceptual specificity and therefore function directly as terminal nodes within the structure. This methodological decision preserves the conceptual consistency of the model while ensuring alignment between the aggregation level of each element and the evidence available in the specialized literature.
4.2. Hierarchical Structure
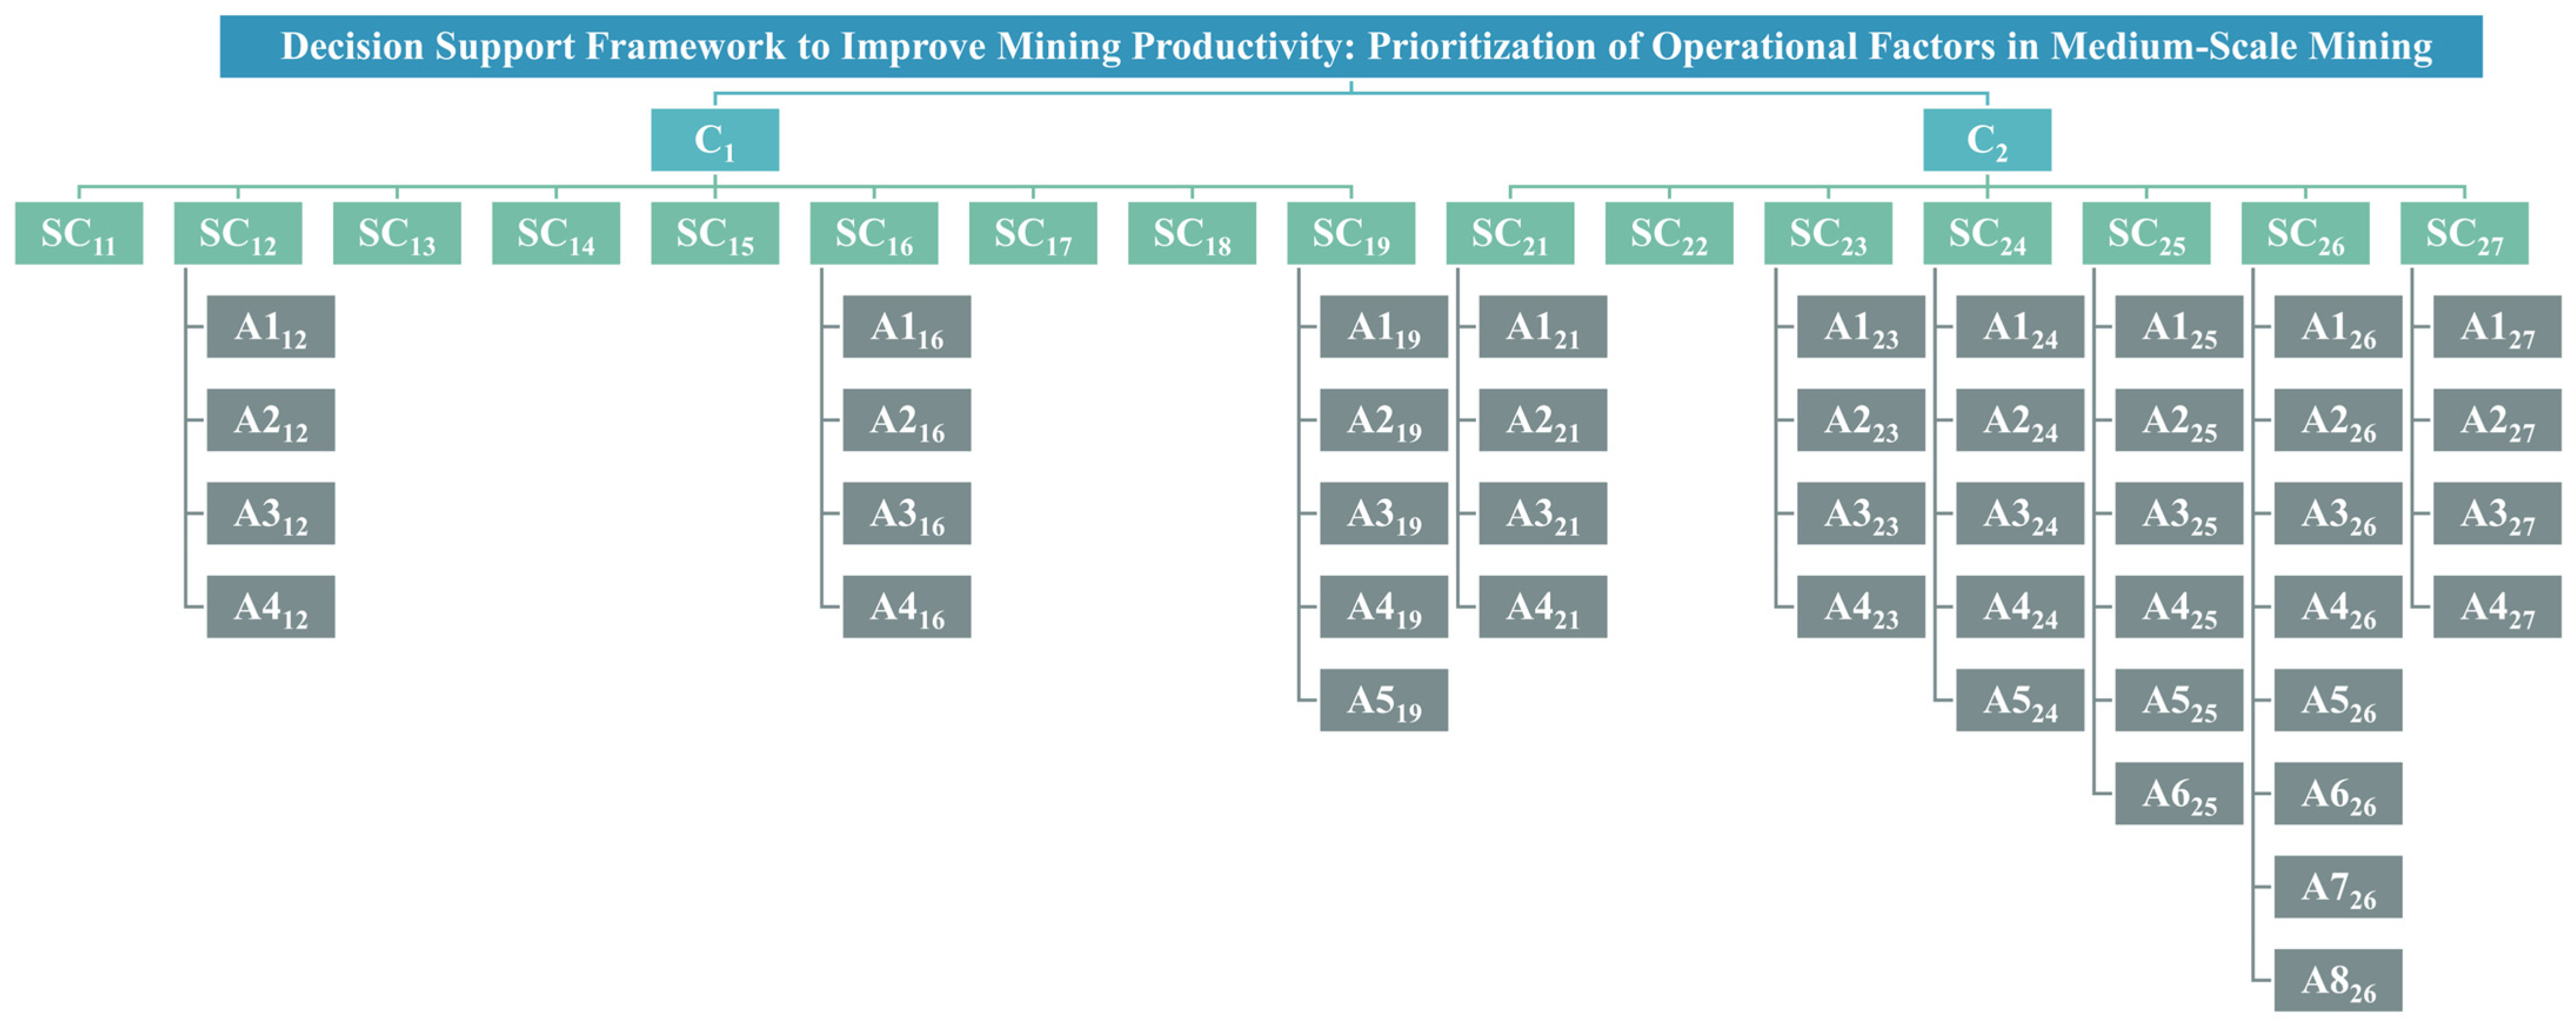
The criteria of the model are organized through a tree-shaped hierarchical structure (
Figure 1), which is characteristic of the AHP. The hierarchy graphically represents the four levels defined for the model—goal, criteria, subcriteria, and decision factors—thereby enabling a clear visualization of the relationships among the different components of the evaluation system.
This representation facilitates the decomposition of a complex problem into analytically manageable elements and constitutes the foundation for constructing the pairwise comparison matrices, which represent a central component of the AHP methodology. Furthermore, it enables the systematic evaluation of the relative importance of each component while maintaining the structural consistency of the decision-making process.
Figure 1 presents the complete hierarchical structure of the model, where each level is visually differentiated through color coding, allowing the relationships among the various elements of the system to be readily identified. The figure illustrates the overall goal at the upper level, followed by the main criteria, the associated subcriteria, and the decision factors located at the terminal level of the hierarchy.
In addition, each element incorporates a specific alphanumeric code, defined in
Table 1, which enables the unambiguous identification of the model components and ensures the traceability of the analysis. This coding system establishes a direct correspondence between the graphical representation, the analytical structure, and the pairwise comparison matrices employed throughout the evaluation process.
Taken together,
Figure 1, the structured coding system, and the hierarchical organization presented in
Table 1 provide an integrated representation of the model, facilitating the transition from the conceptual formulation of the problem to its quantitative operationalization within the methodological framework of the AHP.
4.3. Formulation of the Measurement Instrument
Once the hierarchical structure of the model had been defined, the measurement instrument was formulated to collect the expert judgments required for the application of the AHP. Because each relationship among elements belonging to the same hierarchical level generates a pairwise comparison matrix, the questionnaire was constructed directly from the hierarchical structure of the model, thereby ensuring full traceability between the research objective, the criteria, subcriteria, and decision factors.
Accordingly, pairwise comparisons were conducted among criteria and subcriteria belonging to the same hierarchical level, as well as among decision factors with respect to the subcriteria located at the immediately higher hierarchical level. The resulting instrument consisted of a pairwise comparison survey based on the methodology proposed by Saaty [
14], comprising a total of 151 questions.
Each question required participants to evaluate the relative importance of two elements belonging to the same hierarchical level with respect to an element located at the immediately superior level. Although the AHP traditionally employs the fundamental 1–9 scale, a discrete 7-level scale was adopted for practical implementation purposes. This decision was supported by previous evidence indicating that lower-resolution scales can reduce the cognitive burden associated with evaluation processes involving a large number of comparisons, thereby promoting more consistent judgments and mitigating fatigue effects during assessment [
36,
44]. Furthermore, the use of simplified scales has been reported as an effective strategy for facilitating expert participation and enhancing response quality in complex decision-making environments [
45,
46].
The hierarchical structure of the AHP further contributes to reducing evaluation complexity by decomposing the problem into limited sets of localized comparisons. Consequently, experts performed assessments within specific groups of elements rather than comparing all factors included in the model simultaneously, thereby facilitating the formulation of coherent and consistent judgments.
The questionnaire was administered through face-to-face interviews with continuous support from the researcher throughout the evaluation process. This approach enabled the immediate clarification of questions, ensured a homogeneous interpretation of the requested comparisons, and verified the correct understanding of the evaluated criteria. Additionally, the interviews were conducted under controlled conditions designed to minimize interruptions and reduce potential sources of error associated with participant fatigue or loss of attention.
The survey was directed toward professionals from the mining industry belonging to the medium-scale mining sector of the Coquimbo Region. Participants were professionals directly involved in management and decision-making processes related to mining productivity, including managers, deputy managers, superintendents, mine managers, planning managers, operations managers, engineering managers, and management supervisors.
The pairwise comparison matrices were subsequently constructed from the judgments provided by the experts and processed using Expert Choice software (Version 11) to obtain priorities, rankings, and consistency measures. The quality and coherence of the evaluations were subsequently verified through the CR, following the criteria established by Saaty.
4.4. Expert Panel and Data Collection
This research was conducted within the methodological framework of the AHP, in which the quality and representativeness of expert judgments constitute the foundation of the decision model. Accordingly, the unit of analysis corresponds to an expert panel rather than a conventional statistical sample.
The population of interest consisted of the medium-scale mining sector of the Coquimbo Region, comprising nine operating companies. The participation of two professionals per company was established to incorporate diverse organizational and operational perspectives, resulting in a potential panel of 18 experts.
Participants were selected through purposive sampling, prioritizing professionals directly involved in decision-making processes associated with mining productivity. The panel included managers, deputy managers, superintendents, and supervisors responsible for mine operations, planning, operations, engineering, and management functions. This selection criterion is consistent with the AHP literature, where the validity of the model depends primarily on the experience, knowledge, and decision-making capacity of experts rather than on probabilistic sampling procedures [
14,
30].
As a complementary reference, a minimum panel size of 16 experts was estimated using classical finite-population formulas. Although this calculation does not serve inferential purposes within the AHP framework, it provided a useful benchmark for contrasting the achieved panel coverage against the accessible population. The study met this threshold through the effective participation of 16 experts from different mining companies within the region, positioning the panel within the range commonly recommended in the literature for AHP-based studies, which generally suggests between 7 and 15 experts [
47,
48].
The composition of the panel incorporated multiple hierarchical levels, functional areas, and operational backgrounds, thereby promoting broad representation of the regional productive system.
Each expert completed a structured instrument composed of 151 pairwise comparisons derived directly from the hierarchical structure of the AHP model. In total, 2416 individual judgments were collected, constituting the basis for the construction of the pairwise comparison matrices and the subsequent calculation of priorities using Expert Choice software (Version 11).
Since the objective of the study was to identify the prevailing priority structure within a heterogeneous panel of experts, no consensus-building procedures, such as Delphi rounds or iterative reassessment processes, were implemented. Differences in opinion were addressed through judgment aggregation while retaining all responses provided by the participants. Specifically, a modal aggregation approach was employed, whereby the comparison value selected most frequently was used to construct the group pairwise comparison matrix. This procedure enables the representation of the predominant preference within the panel while avoiding the compensatory effects commonly associated with averaging-based aggregation methods.
The consistency of the generated matrices was verified through the CR, calculated automatically by Expert Choice software (Version 11). All matrices exhibited values below the threshold recommended by Saaty (CR ≤ 0.10); therefore, all evaluations were incorporated into the final analysis.
To strengthen the transparency and traceability of the study, the participating companies are identified below, as they collectively represent the productive structure of medium-scale mining in the Coquimbo Region.
Mina El Romeral, operated by Compañía Minera del Pacífico (CAP), is located 22 km northeast of La Serena. Its operations include the annual production of approximately 400,000 tonnes of lump ore, 300,000 tonnes of fines, and 1.7 million tonnes of pellet feed, integrating crushing, beneficiation, and product handling processes.
Minera San Gerónimo, through its Talcuna Division, is located in the Marquesa Valley, 48 km from La Serena. It operates both underground and open-pit deposits, with a processing capacity of 120,000 tonnes per month, producing copper concentrate and by-products including silver, gold, and iron.
Mina Florida, owned by Compañía Las Palmas SpA, is located in the Tambillos district and is characterized by chalcopyrite-dominated copper mineralization with the presence of iron, gold, and silver, representing a relevant case of mining activity within the Coastal Range.
Teck Carmen de Andacollo is an open-pit operation located at approximately 1000 m above sea level, producing copper concentrates from hypogene ore while undergoing a progressive transition from cathode production derived from supergene ore.
Mina Tambo de Oro, operated by HMC Gold, is located in the municipality of Punitaqui and exploits ore through underground mining using the Bench-and-Fill method, with production rates of approximately 14,000 tonnes per month and average gold and copper grades.
Mina Verde, owned by Cominor Inversiones Mineras S.A., is located in the municipality of Coquimbo and contains disseminated primary chalcopyrite mineralization hosted within brecciated limestone formations.
Compañía Minera del Valle, located in Talcuna (municipality of Vicuña), conducts underground copper mining with processing in a concentrator plant and forms part of the Talcuna mining district.
Mina Santa Alicia, located in the municipality of Ovalle, produces copper minerals in the form of oxides and sulfides, together with gold and silver.
Minera La Cruz Ltd.a., operating in the Limarí Province, exploits copper mineral deposits through several mining operations and complements its activities with mining services and an SX–EW hydrometallurgical plant with a processing capacity of 10,000 tonnes per month.
Collectively, this group of companies includes both underground and open-pit operations, different mineralization types, and diverse operational scales, thereby providing broad structural coverage of the regional medium-scale mining sector. Consequently, the selection followed a purposive coverage strategy aimed at representing the operational diversity existing within the productive system under analysis.
5. Results and Discussion
5.1. Cronbach’s Alpha
The reliability analysis yielded a Cronbach’s alpha coefficient of 0.90, indicating excellent internal consistency according to the criteria established by Cronbach [
42].
This result demonstrates a high degree of coherence among the responses provided by the participating experts, thereby supporting the reliability of the information subsequently employed in the development of the AHP model.
5.2. Consistency Ratio
Table 2 presents the CR values obtained for the pairwise comparison matrices developed in this research.
All CR values were below the threshold recommended by Saaty [
14], indicating that the judgments provided by the experts exhibit an adequate level of logical consistency.
Furthermore, the overall model achieved a CR of 0.08, confirming the reliability of the comparison process and supporting the validity of the priorities obtained through the application of the AHP.
In this study, CR values were calculated and reported automatically by Expert Choice software (Version 11), following the standard AHP procedure based on the principal eigenvalue approach. It is important to note that in complex hierarchical models such as the present one, consistency is not interpreted as a single mandatory global value but rather as an assessment performed at each hierarchical level and for each pairwise comparison matrix.
5.3. Analysis and Interpretation of the Priorities Associated with the Main Criteria
The results obtained through the AHP and processed using Expert Choice software reveal the distribution of priorities between the two principal criteria of the model: Internal Factors (C2) and External Factors (C1).
Internal Factors (C2) exhibit a global priority of 0.75, whereas External Factors (C1) attain a priority of 0.25. This difference reflects a substantially greater relative weighting assigned to elements associated with the organization’s direct sphere of control within the hierarchical structure of the model.
In relative terms, the results indicate a pronounced concentration of priority within the Internal Factors (C2) criterion, which accounts for three-quarters of the total weight assigned to the main criteria of the system, while External Factors (C1) represent the remaining quarter.
This distribution of weights corresponds to the synthesis of the aggregated expert judgments incorporated into the AHP model and constitutes the basis for the subsequent decomposition toward subcriteria and lower-level decision factors throughout the hierarchy.
5.4. Analysis and Interpretation of the Global Priorities of the Alternatives
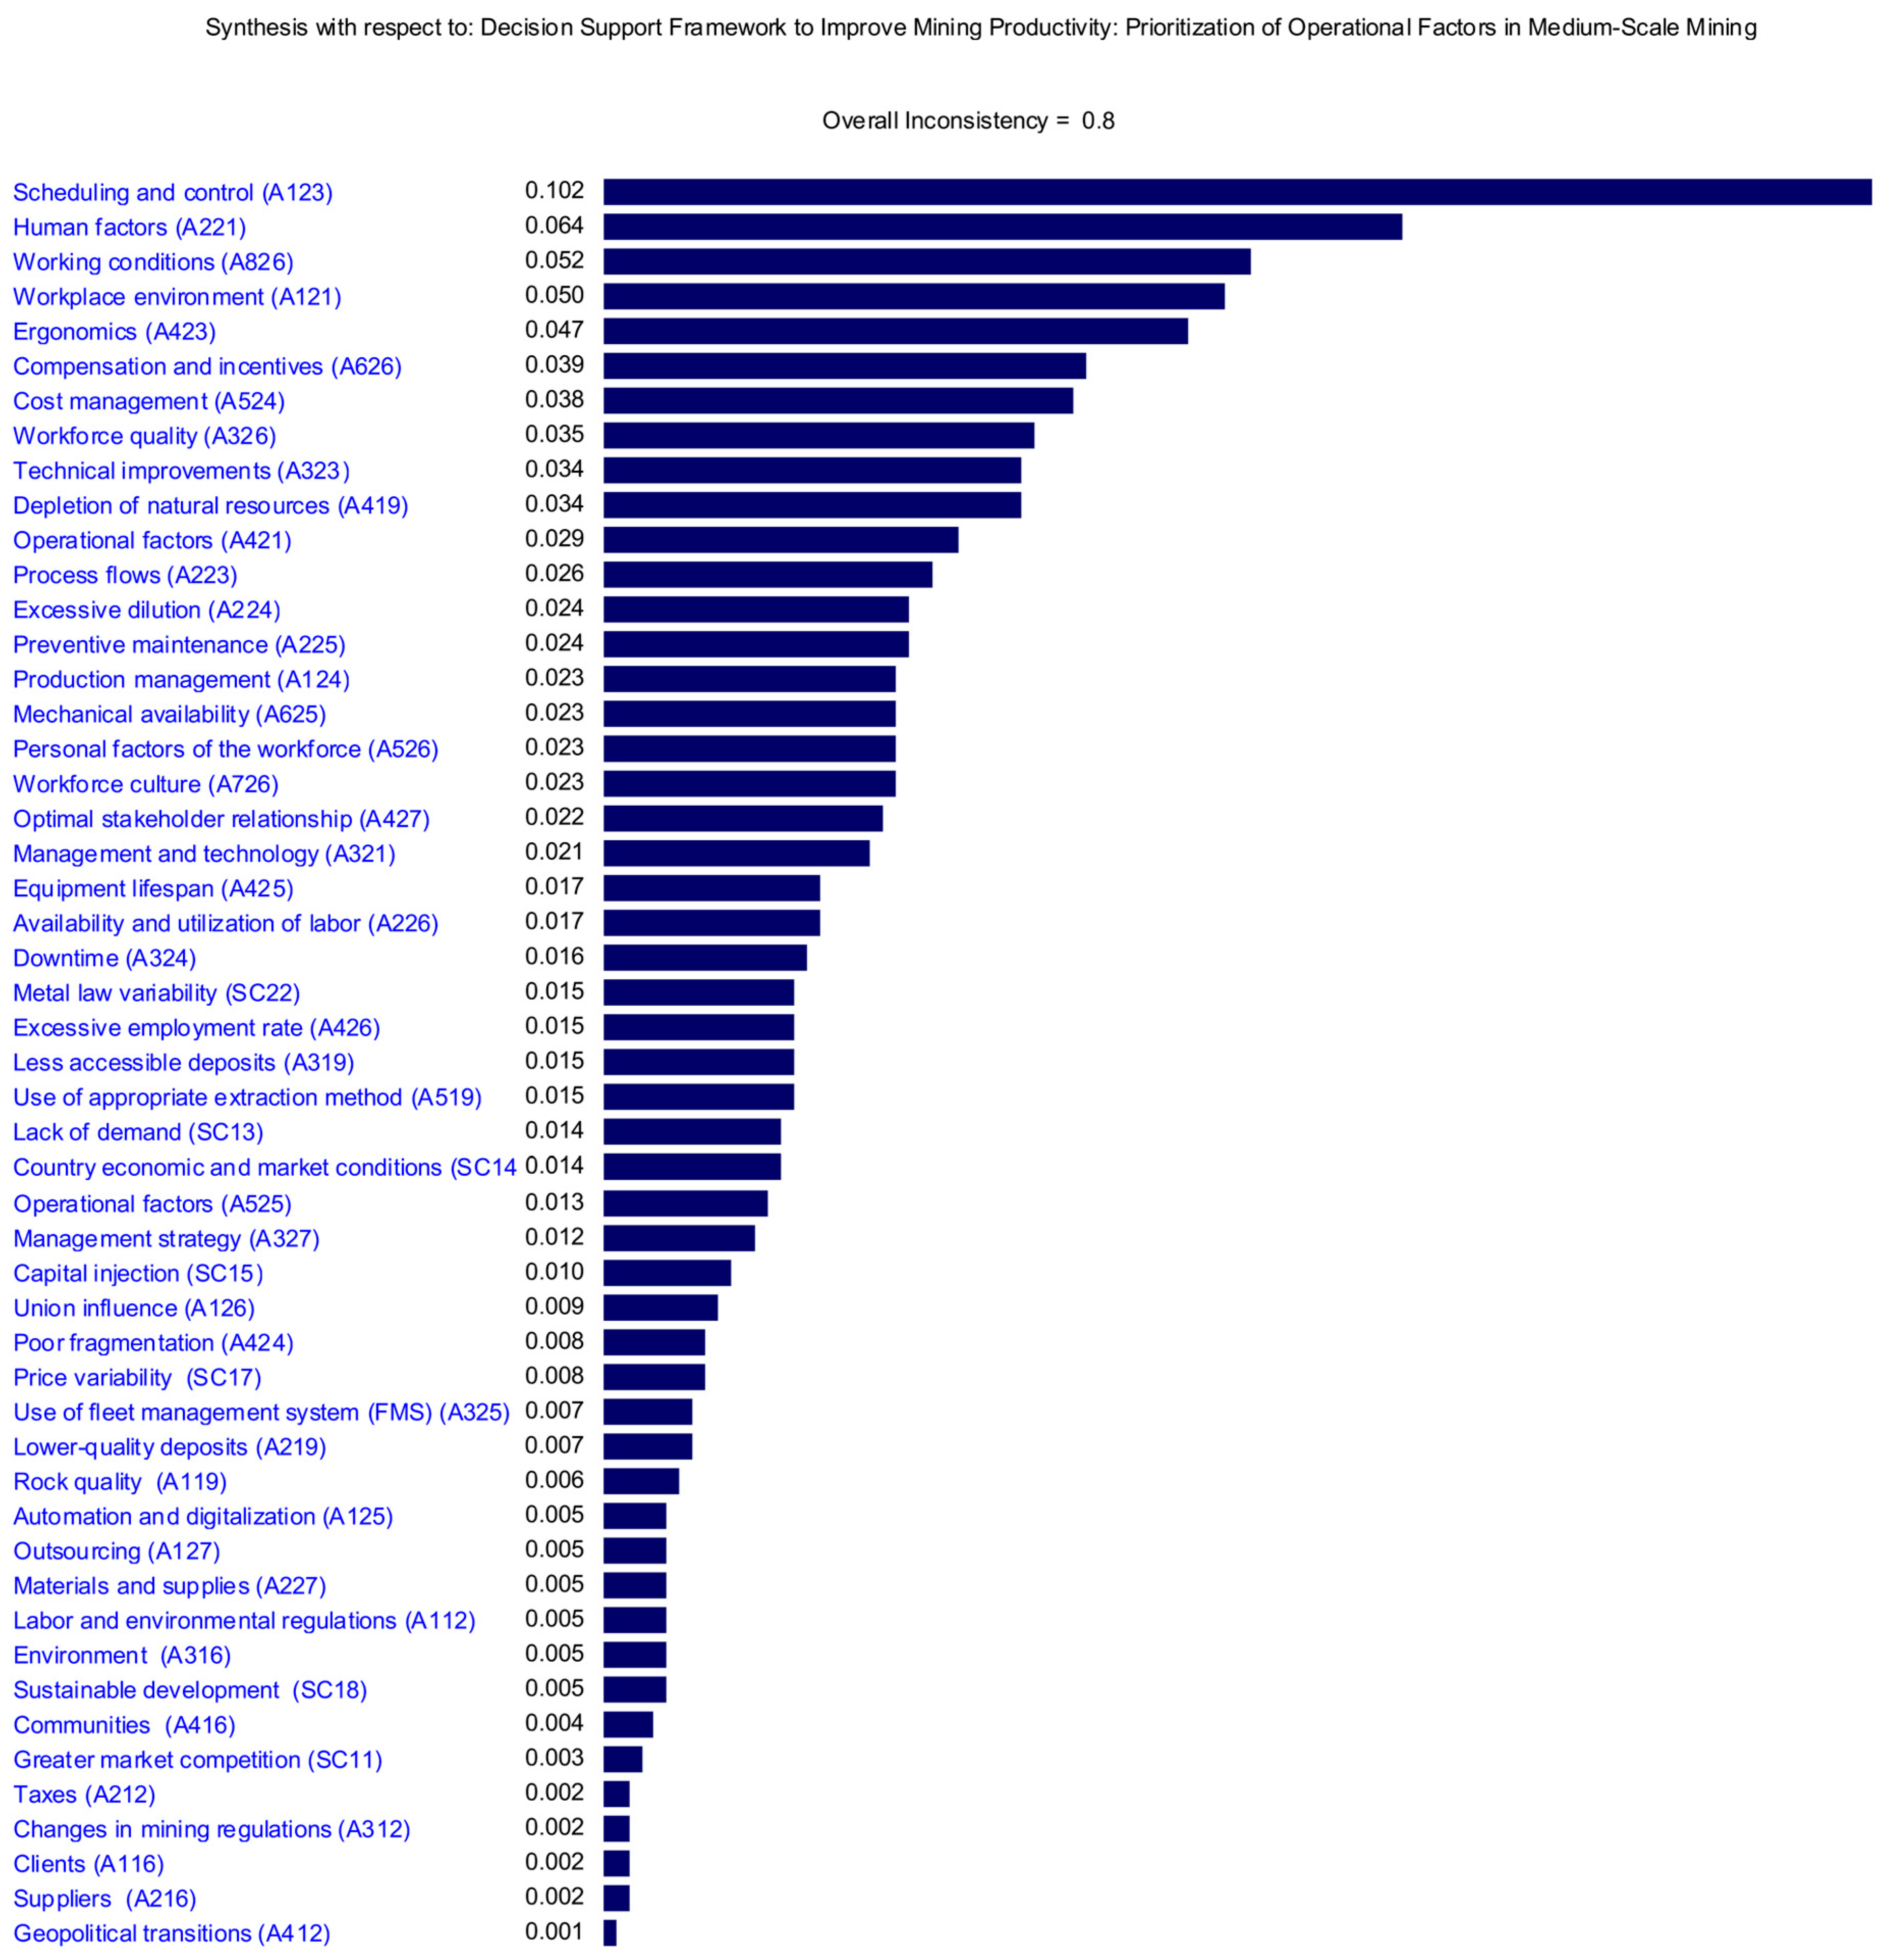
Figure 2 presents the global weights of the 44 decision factors considered in the model.
The decision factor with the highest global weight is Scheduling and Control (A123), associated with the subcriterion Work Planning (SC23), with a priority of 0.102. This is followed by Human Factor (A221) with 0.064, Working Conditions (A826) with 0.052, Workplace Environment (A121) with 0.050, and Ergonomics (A423) with 0.047. Collectively, these five decision factors account for approximately 31.5% of the total global weight of the model.
The global ranking allows the identification of three groups of decision factors according to their priority level:
High-priority factors (≥0.04): Scheduling and Control (A123), Human Factor (A221), and Working Conditions (A826).
Medium-priority factors (≈0.02–0.04): Cost Management (A524), Workforce Quality (A326), Technical Improvements (A323), and Depletion of Natural Resources (A419).
Low-priority factors (≤0.02): Labor and Environmental Regulations (A112), Geopolitical Transitions (A412), and Suppliers (A216), among others.
It should be noted that the figure corresponds to the standard output generated by Expert Choice software, in which the terminal elements of the model—including those subcriteria that have not been further decomposed into additional hierarchical levels—are displayed in descending order of priority and accompanied by horizontal bars proportional to their global weights. In this context, the software treats such subcriteria as terminal nodes of the hierarchy whenever no lower level exists, incorporating them directly into the global priority synthesis.
Due to the number of elements included in the model, the visualization may appear dense; however, its interpretation extends beyond the ranking itself and is instead oriented toward understanding the underlying priority distribution structure. In this regard, the relative comparison of bar lengths and the hierarchical position of each element facilitate the identification of patterns of concentration, dominance, and dispersion within the system, which constitute a central aspect of the proposed analytical approach.
Consequently, the figure represents not merely a ranking of priorities but also a tool for understanding the structural logic of the model, consistent with the objective of the study to move beyond purely descriptive approaches and advance toward a systemic analysis of mining productivity.
Given the scope and granularity of the model, the complete results associated with the local priority weights at each hierarchical level, as well as the detailed AHP decomposition, are provided in the
Supplementary Material of the study. This supplementary document includes all pairwise comparison matrices and the local priority vectors for criteria, subcriteria, and decision factors, ensuring full traceability of the priority synthesis process within the AHP framework. Accordingly, the main body of the article focuses on the global priority results, while the
Supplementary Material provides the necessary technical detail to ensure model transparency, reproducibility, and methodological rigor.
5.5. Sensitivity Analysis
5.5.1. Performance Sensitivity Analysis
The performance sensitivity analysis evaluates how the global priorities of the decision factors vary in response to changes in the weighting of the main criteria. This approach facilitates the identification of dominant factors, the assessment of hierarchical stability, and the examination of the extent to which the resulting ranking depends on modifications to the weighting structure of the model.
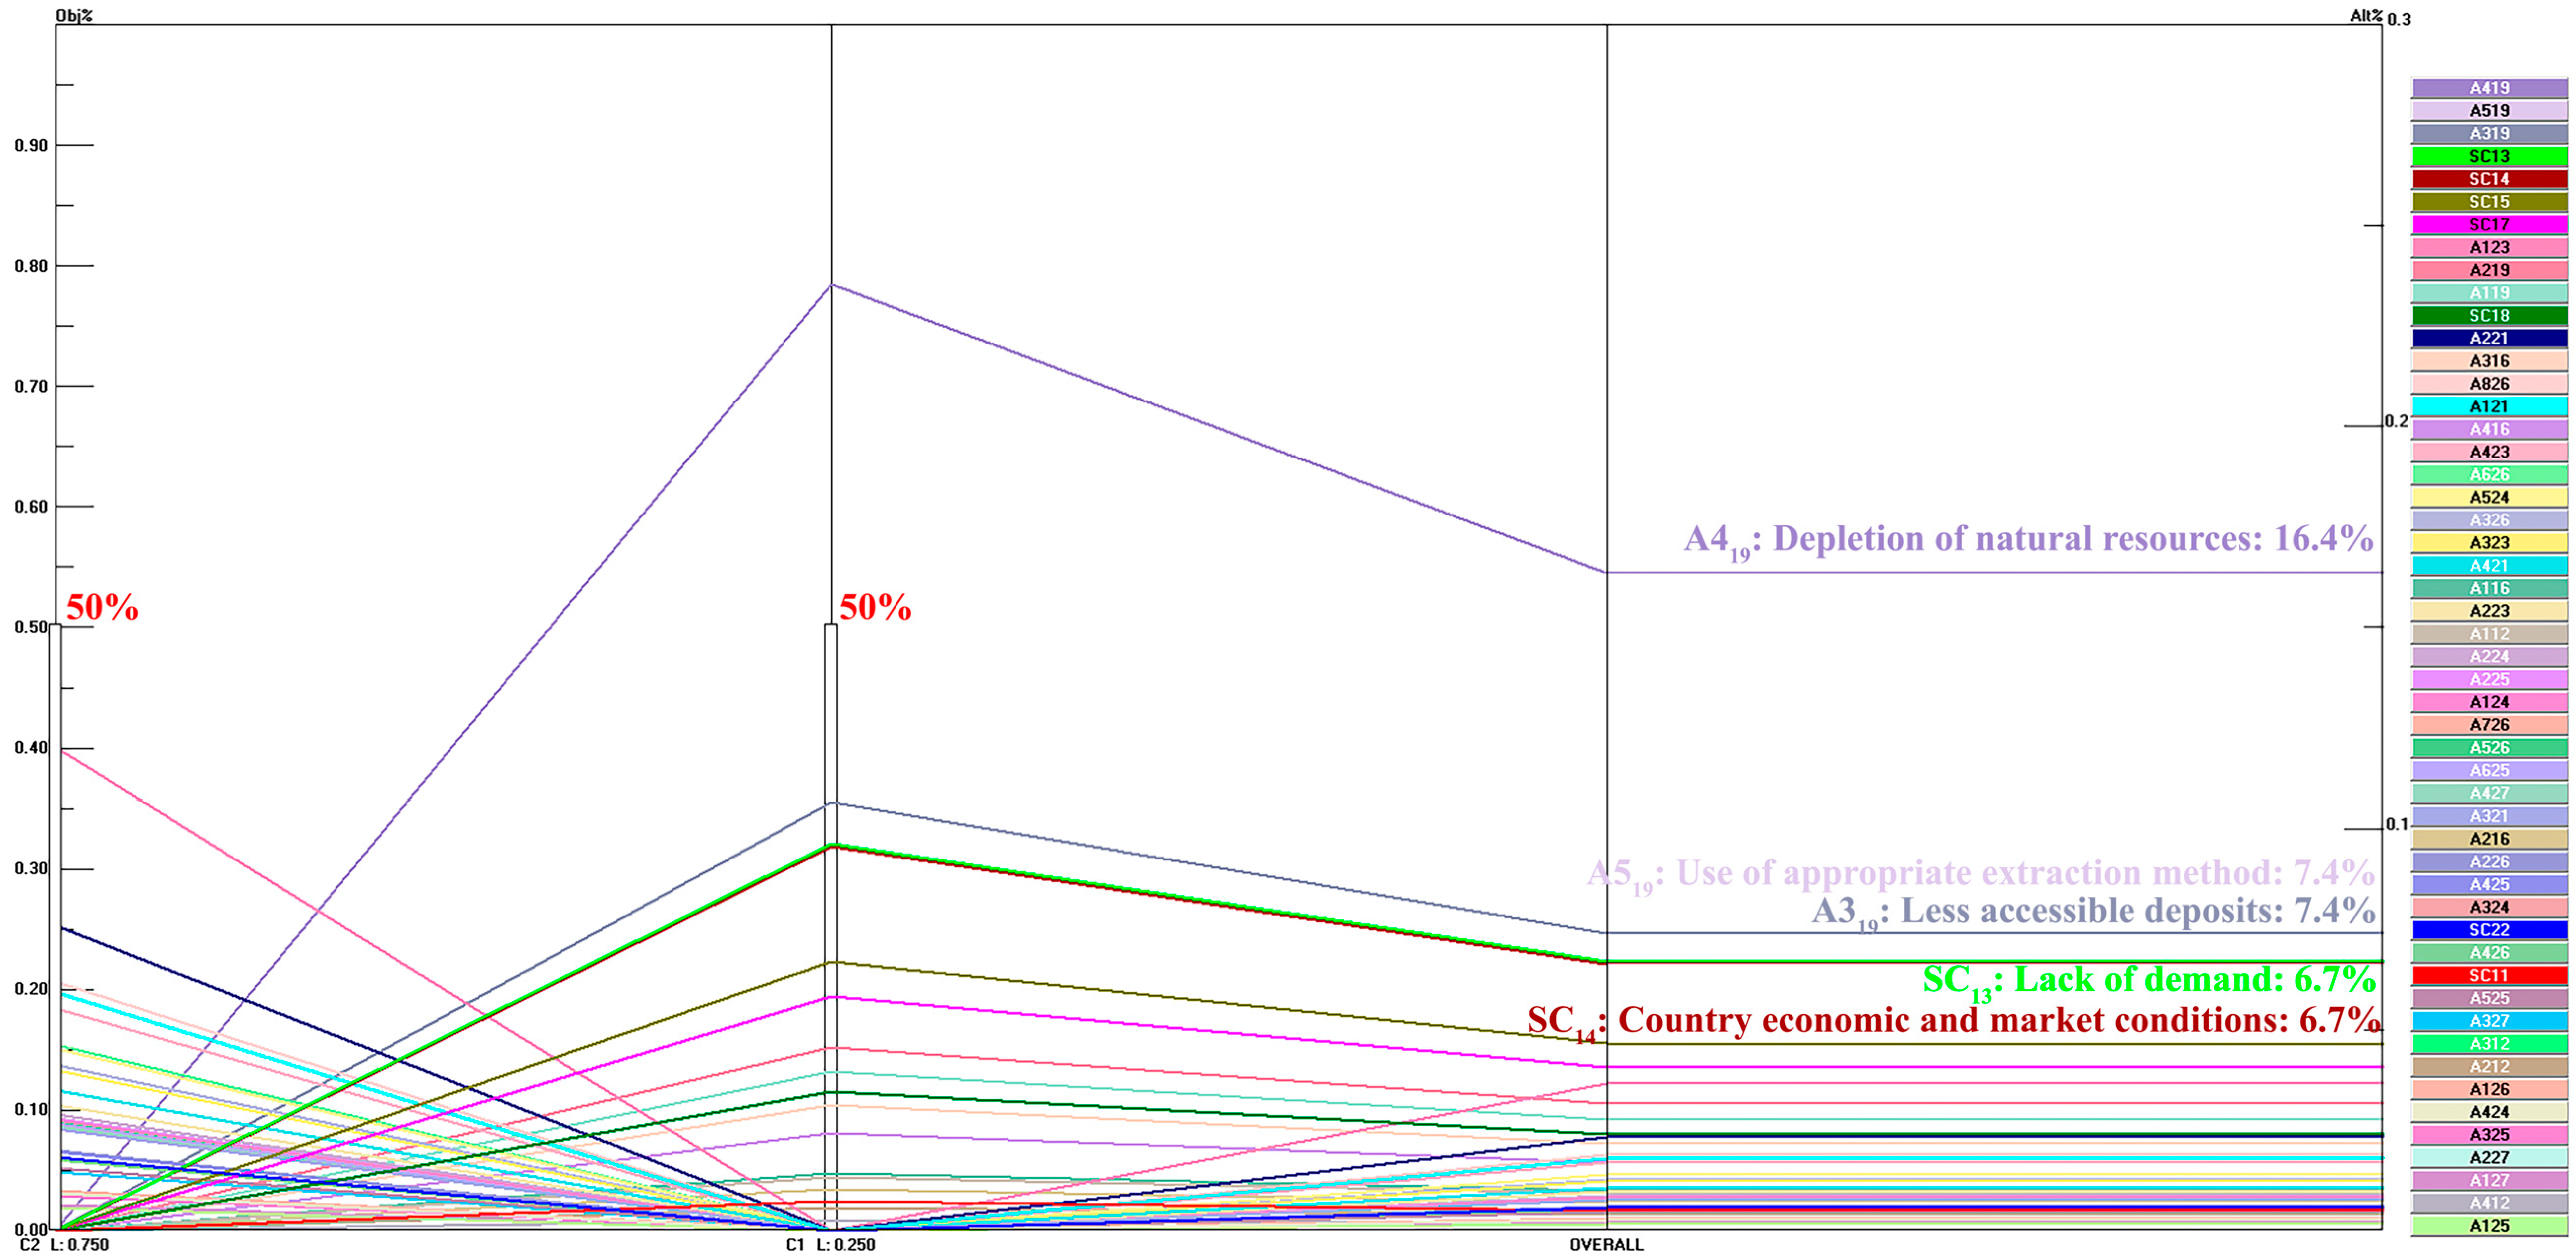
To interpret this analysis, the left vertical axis represents the local weight of each decision factor within its corresponding criterion, whereas the right vertical axis displays its global priority. The vertical bars indicate the weights assigned to the main criteria, and the local weight of each factor reaches its maximum value only within the criterion to which it belongs, being equal to zero for all others. The right-hand side of the graph presents the final ranking of the decision factors according to their global priorities. Due to the visual complexity of this representation, interpretation should focus primarily on the overall behavior and trajectories of the curves, which reflect the relative contribution of each factor within the system.
To evaluate the robustness of the hierarchical structure under contrasting conditions, two analytical scenarios were defined. The first corresponds to a theoretical equilibrium between the main criteria, in which Internal Factors (C2) and External Factors (C1) receive identical weights (50–50%). This scenario represents a neutral condition that enables the stability of the hierarchy to be examined when both dimensions have equivalent relevance and allows the identification of factors that maintain dominant positions even when the relative advantage observed in the original weighting structure is eliminated.
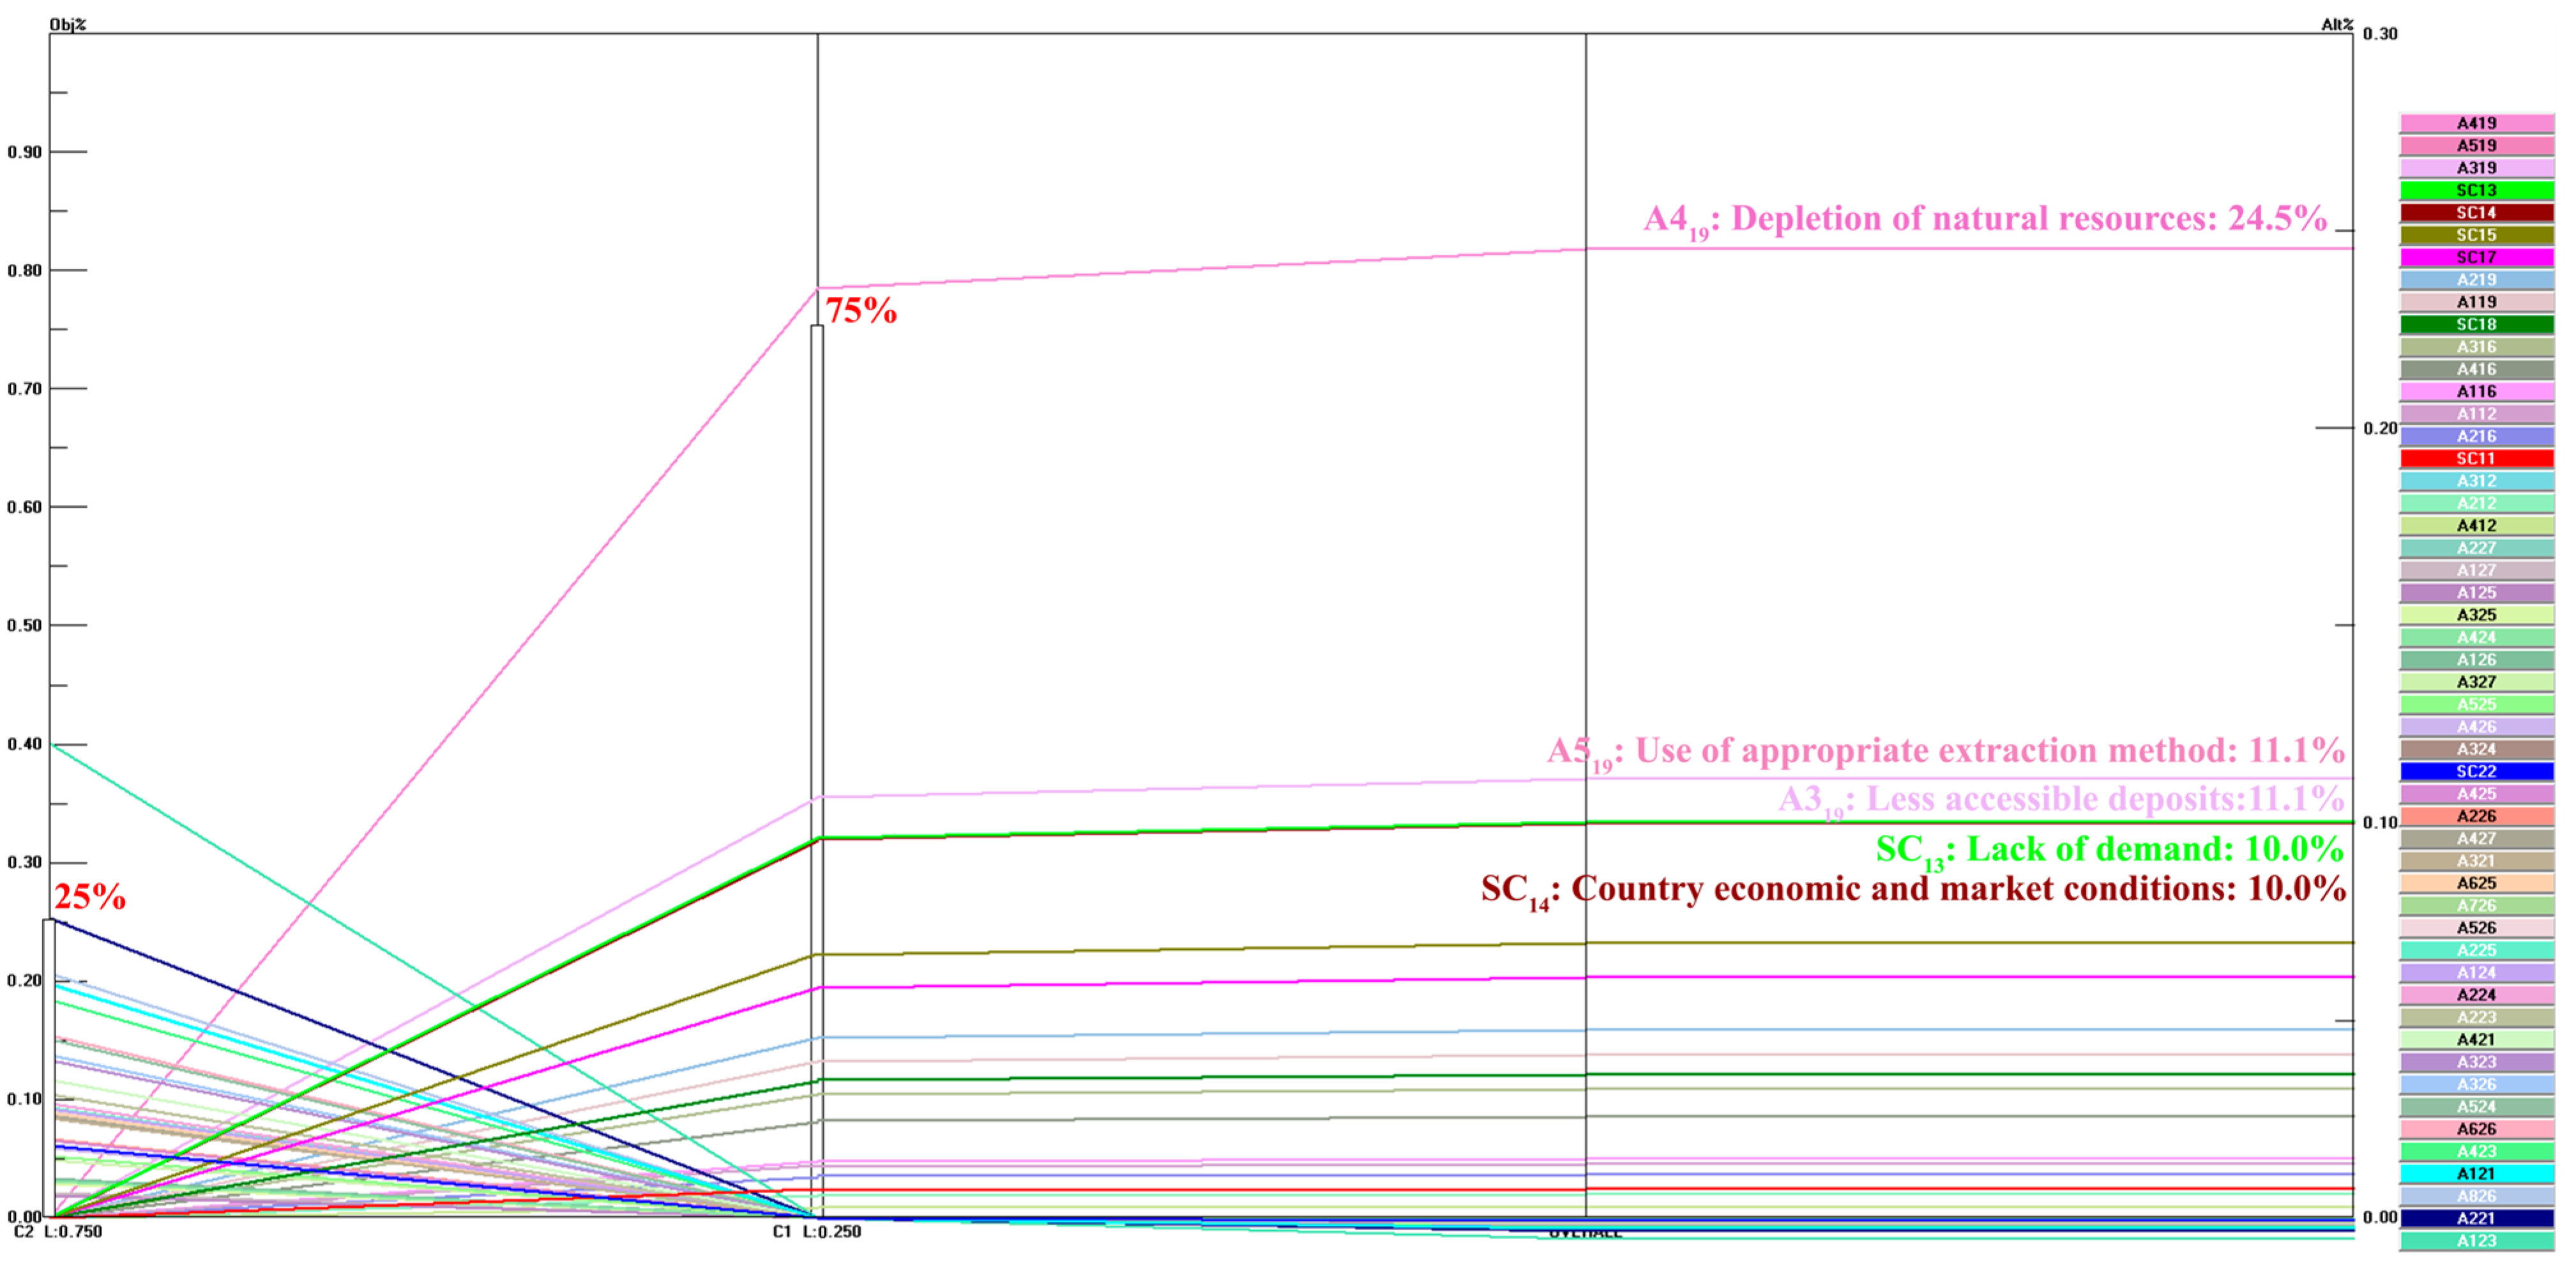
The second scenario increases the weight assigned to External Factors (C1) to 75%, representing a hypothetical condition in which external variables dominate the internal capabilities of the organization. This scenario functions as a stress test of the model, enabling the evaluation of the system’s capacity to preserve or modify the priority hierarchy under substantial deviations from the weights derived from expert judgments. Furthermore, it facilitates the identification of factors that are particularly sensitive to changes in the external environment and the detection of potential structural transition points within the resulting ranking.
Scenario 1: Theoretical Equilibrium Between Main Criteria (50–50%)
Under an equal weighting scheme between Internal Factors (C2) and External Factors (C1), a substantial reconfiguration of the priority structure is observed. In this scenario, the decision factor Scheduling and Control (A123) reduces its weight from 0.102 to approximately 0.037, indicating a relative decline in its influence within the model.
In contrast, Depletion of Natural Resources (A4
19) increases its priority from 0.034 to approximately 0.164, becoming the decision factor with the highest global weight. Similarly, other decision factors associated with external conditions, such as Deposits with Limited Accessibility (A3
19) and Country Economic and Market Conditions (SC
14), also increase their relative importance within the ranking, reinforcing the shift in the system toward external components under this weighting scenario (
Figure 3).
Scenario 2: Dominance of External Factors (75%)
When the weight assigned to External Factors (C1) is increased to 75%, the model exhibits a pronounced shift in the priority hierarchy. Under this scenario, the decision factor Depletion of Natural Resources (A419) reaches an approximate priority of 0.245, consolidating its position as the dominant factor within the system.
Simultaneously, Scheduling and Control (A1
23) experiences a substantial decline in its position within the global ranking, reflecting its lower relative influence in a context dominated by external factors. In contrast, decision factors such as Lees Accessible Deposits (A3
19) and Use of an Appropriate Extraction Method (A5
19) increase their relative weights, further reinforcing the reconfiguration of the priority structure toward variables associated with the external environment and specific operational conditions (
Figure 4).
5.5.2. Head-to-Head Sensitivity Analysis
The head-to-head sensitivity analysis enables the direct comparison of specific decision factors within the model, allowing the stability of the resulting ranking to be evaluated beyond the global aggregation of priorities. This approach is particularly useful for examining the relative dominance of the principal decision factors and verifying whether their positions remain stable under individual comparisons within the hierarchical structure.
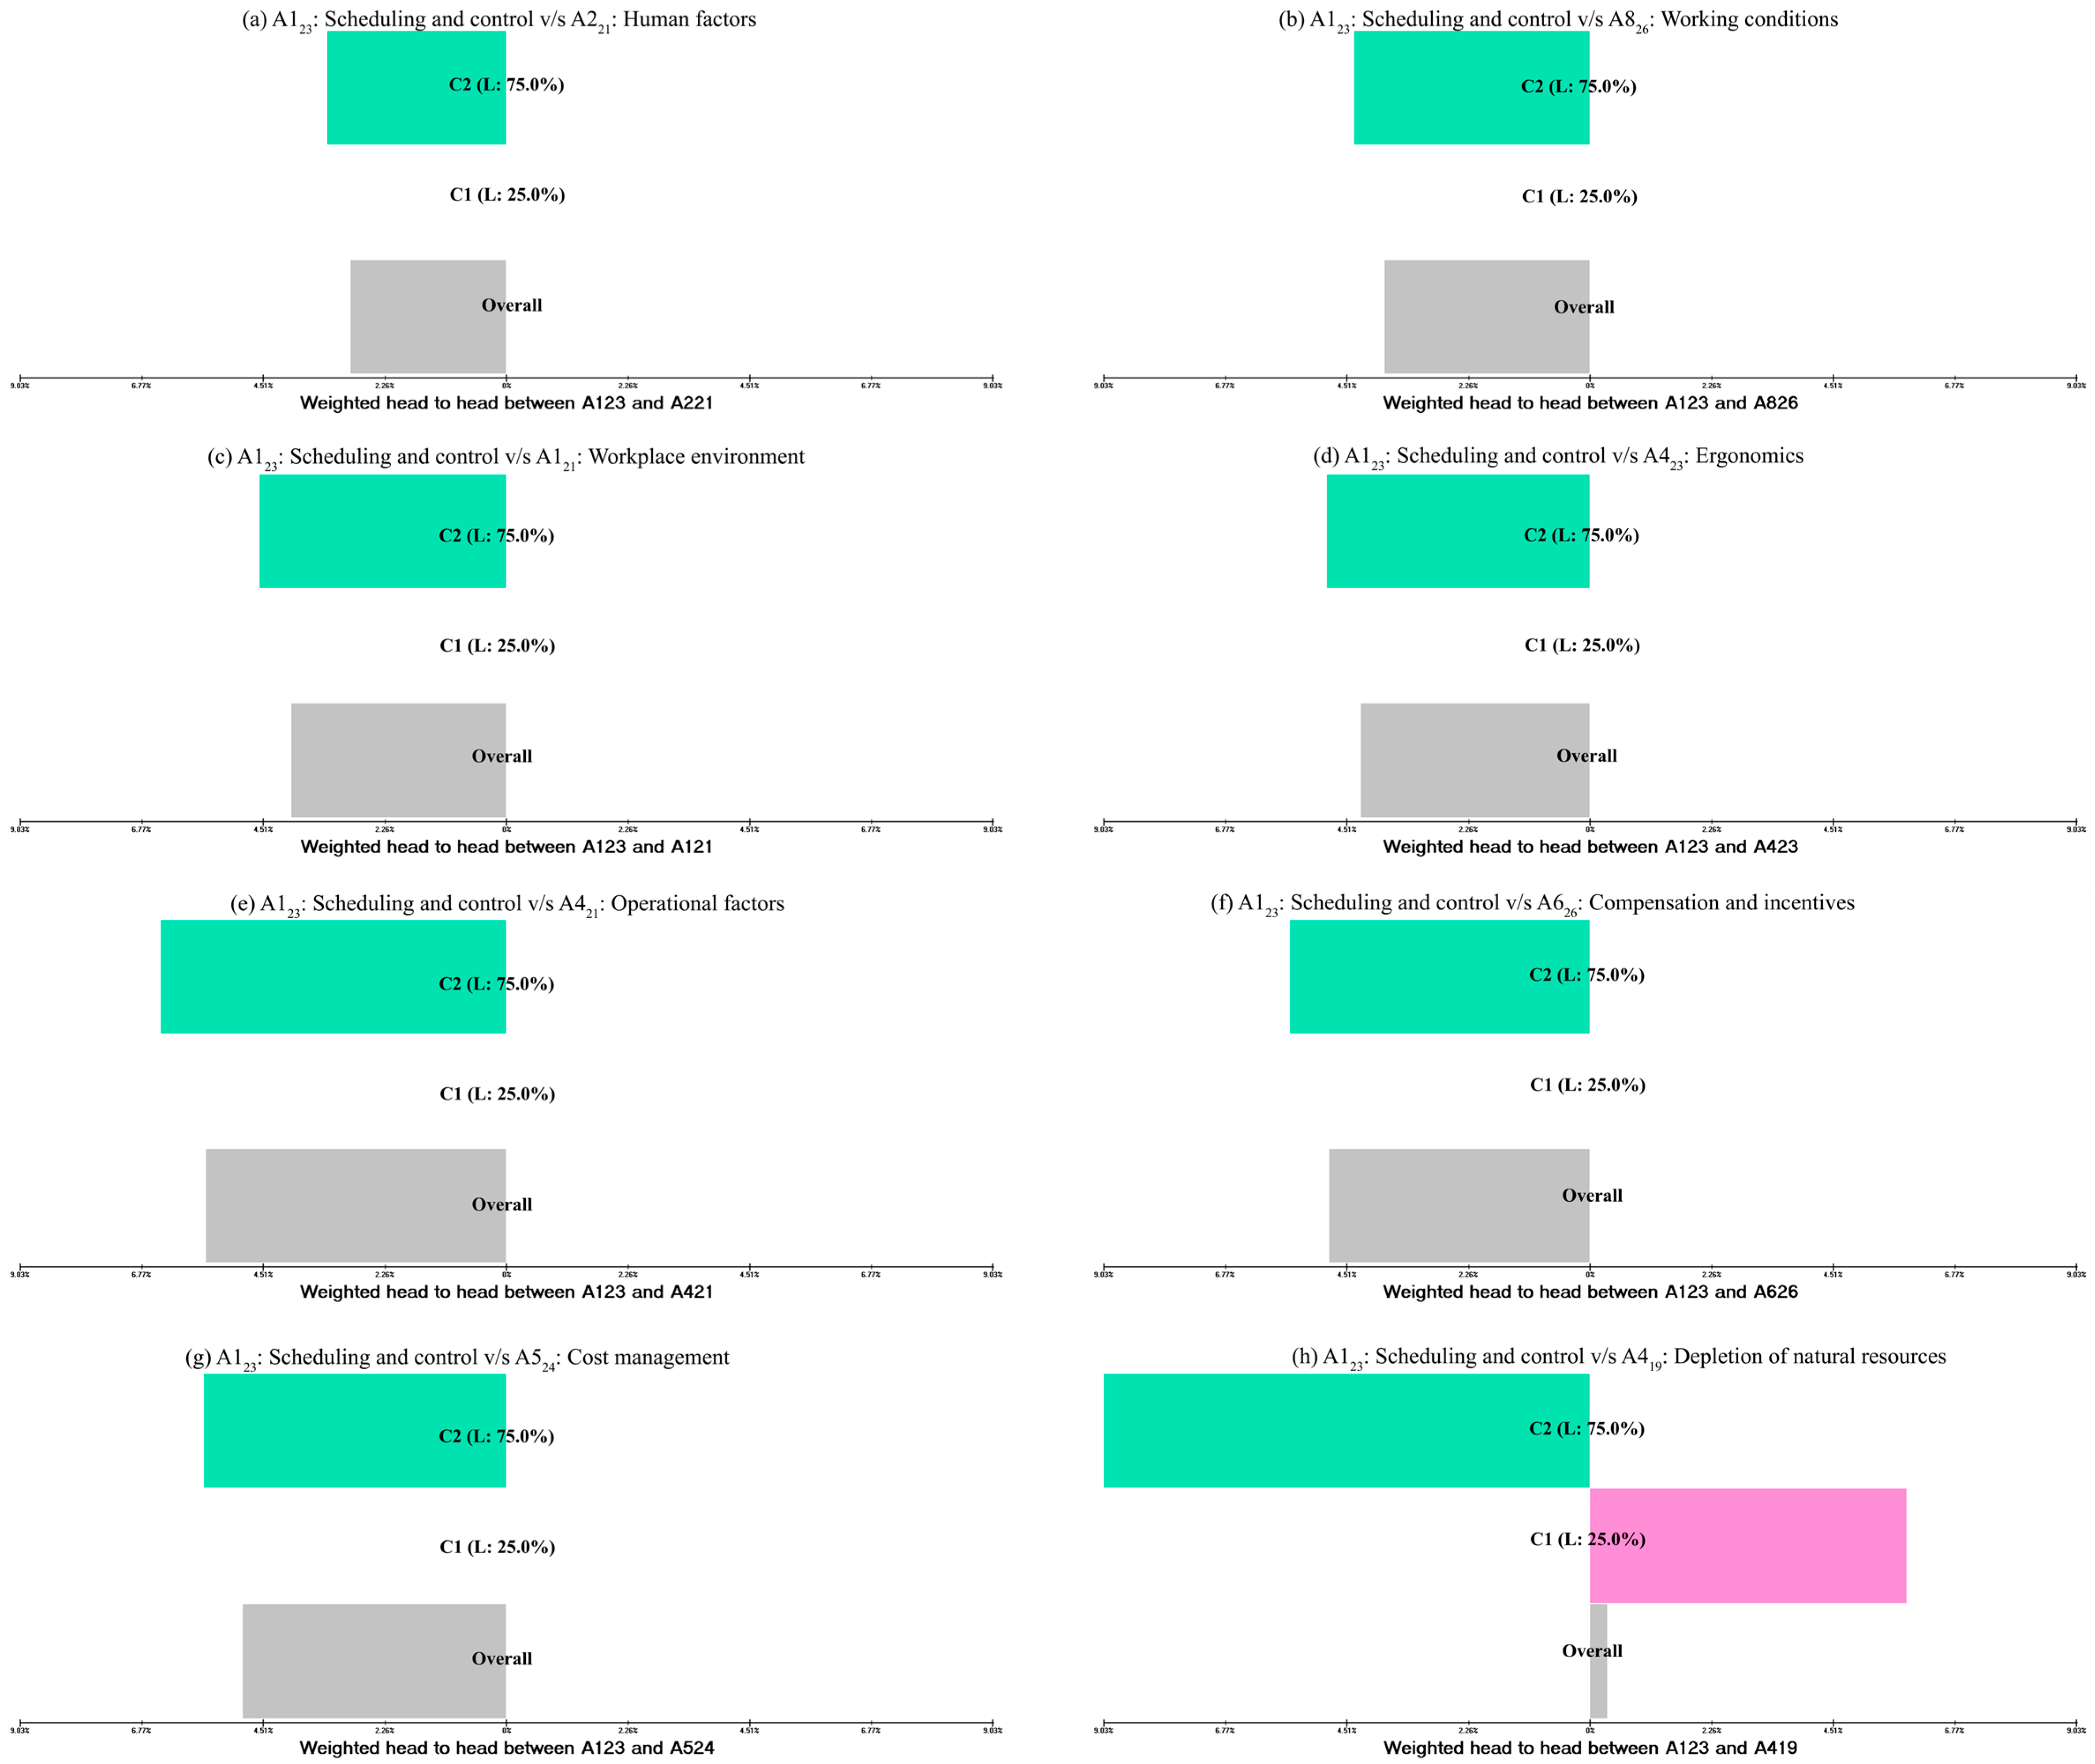
For this analysis, eight comparisons were conducted using Scheduling and Control (A123) as the reference decision factor. This factor belongs to the subcriterion Work Planning (SC23) within Internal Factors (C2) and was selected because it exhibited the highest global priority within the model hierarchy. To perform the analysis, the authors selected A123 as the reference factor and conducted a series of head-to-head evaluations in Expert Choice using the priorities previously obtained from the validated AHP model. These comparisons did not involve the incorporation of additional expert judgments but were generated from the hierarchical structure and priorities already established within the model, thereby enabling the assessment of the relative distance and dominance among the principal decision factors.
To interpret the head-to-head graph, each bar represents the weighted difference between the reference decision factor (A123) and the compared decision factor. The green areas indicate an advantage in favor of Scheduling and Control (A123), whereas the remaining bars represent the relative preference associated with the compared factor. The greater the bar length, the larger the preference difference between the decision factors, reflecting either the stability of the ranking or the degree of competition between the compared elements.
The Overall column in the head-to-head analysis represents the global preference difference between the reference decision factor (A123) and the compared decision factor, integrating the entire hierarchical structure of the AHP model. This indicator synthesizes the combined effect of criterion and subcriterion weights, thereby determining the final dominance relationship within the global ranking.
Comparisons were conducted using Scheduling and Control (A123) as the reference decision factor.
The results show preference differences ranging from 3.2% to 5.6% relative to decision factors such as Human Factor (A221), Working Conditions (A826), and Work Environment (A121). In the comparison with Depletion of Natural Resources (A419), a preference difference of 3.2% in favor of A123 was observed. No ranking reversals were identified in any of the evaluated comparisons.
Table 3 summarizes the results obtained from the head-to-head comparisons, demonstrating the consistency of the leading decision factor relative to several representative decision factors within the model. Unlike the graphical representation, the table enables the simultaneous examination of global weights, local weights, and Overall values, thereby facilitating a more precise assessment of relative dominance among decision factors.
The results indicate that Scheduling and Control (A123) maintains a positive advantage across all evaluated scenarios, with no ranking reversals observed. This finding reinforces both the structural stability of the model and the robustness of the prioritization obtained through the application of the AHP methodology.
The graphical representation of the Head-to-Head Sensitivity Analysis (
Figure 5) complements these results by illustrating the relative preference relationships among decision factors. The findings indicate that Scheduling and Control (A1
23) maintains systematic dominance across all evaluated comparisons, with no ranking reversals observed, thereby constituting a robust indicator of model stability. Positive Overall values consistently indicate a relative advantage of A1
23 over the compared decision factors.
It should be noted that the labels displayed in the pairwise comparison graphs, namely C1 (L: 0.25) and C2 (L: 0.75), do not represent the outcome of the comparison itself. Rather, they correspond to the global priorities of the parent criteria within the AHP hierarchy, namely External Factors (C1) and Internal Factors (C2).
The repeated value of 0.75 observed across several comparisons reflects the constant global weight assigned to Internal Factors (C2), since the reference decision factor, Scheduling and Control (A123), belongs to this criterion. Consequently, these values remain unchanged across comparison scenarios and should not be interpreted as indicators of comparative dominance among decision factors.
The actual outcome of each pairwise comparison is represented by the Overall indicator, which quantifies the difference in global preference between the reference decision factor and the compared factor while considering the complete hierarchical structure of the AHP model. Therefore, the Overall value constitutes the appropriate measure for assessing relative dominance and separation among decision factors.
5.5.3. Gradient Sensitivity Analysis
Gradient Sensitivity Analysis enables the evaluation of the continuous stability of the model under progressive variations in the weighting of the main criteria, capturing the dynamic behavior of the system beyond discrete scenarios. Unlike approaches based on point comparisons, this method allows the complete evolution of the system to be observed and facilitates the identification of critical thresholds at which changes occur in the hierarchy of decision factors.
This approach supports the assessment of the relative robustness of criteria and decision factors under gradual modifications in decision-maker preferences, revealing the extent to which the ranking depends on the weighting structure of the model. Within this context, intersections between curves represent threshold points beyond which changes in global prioritization occur.
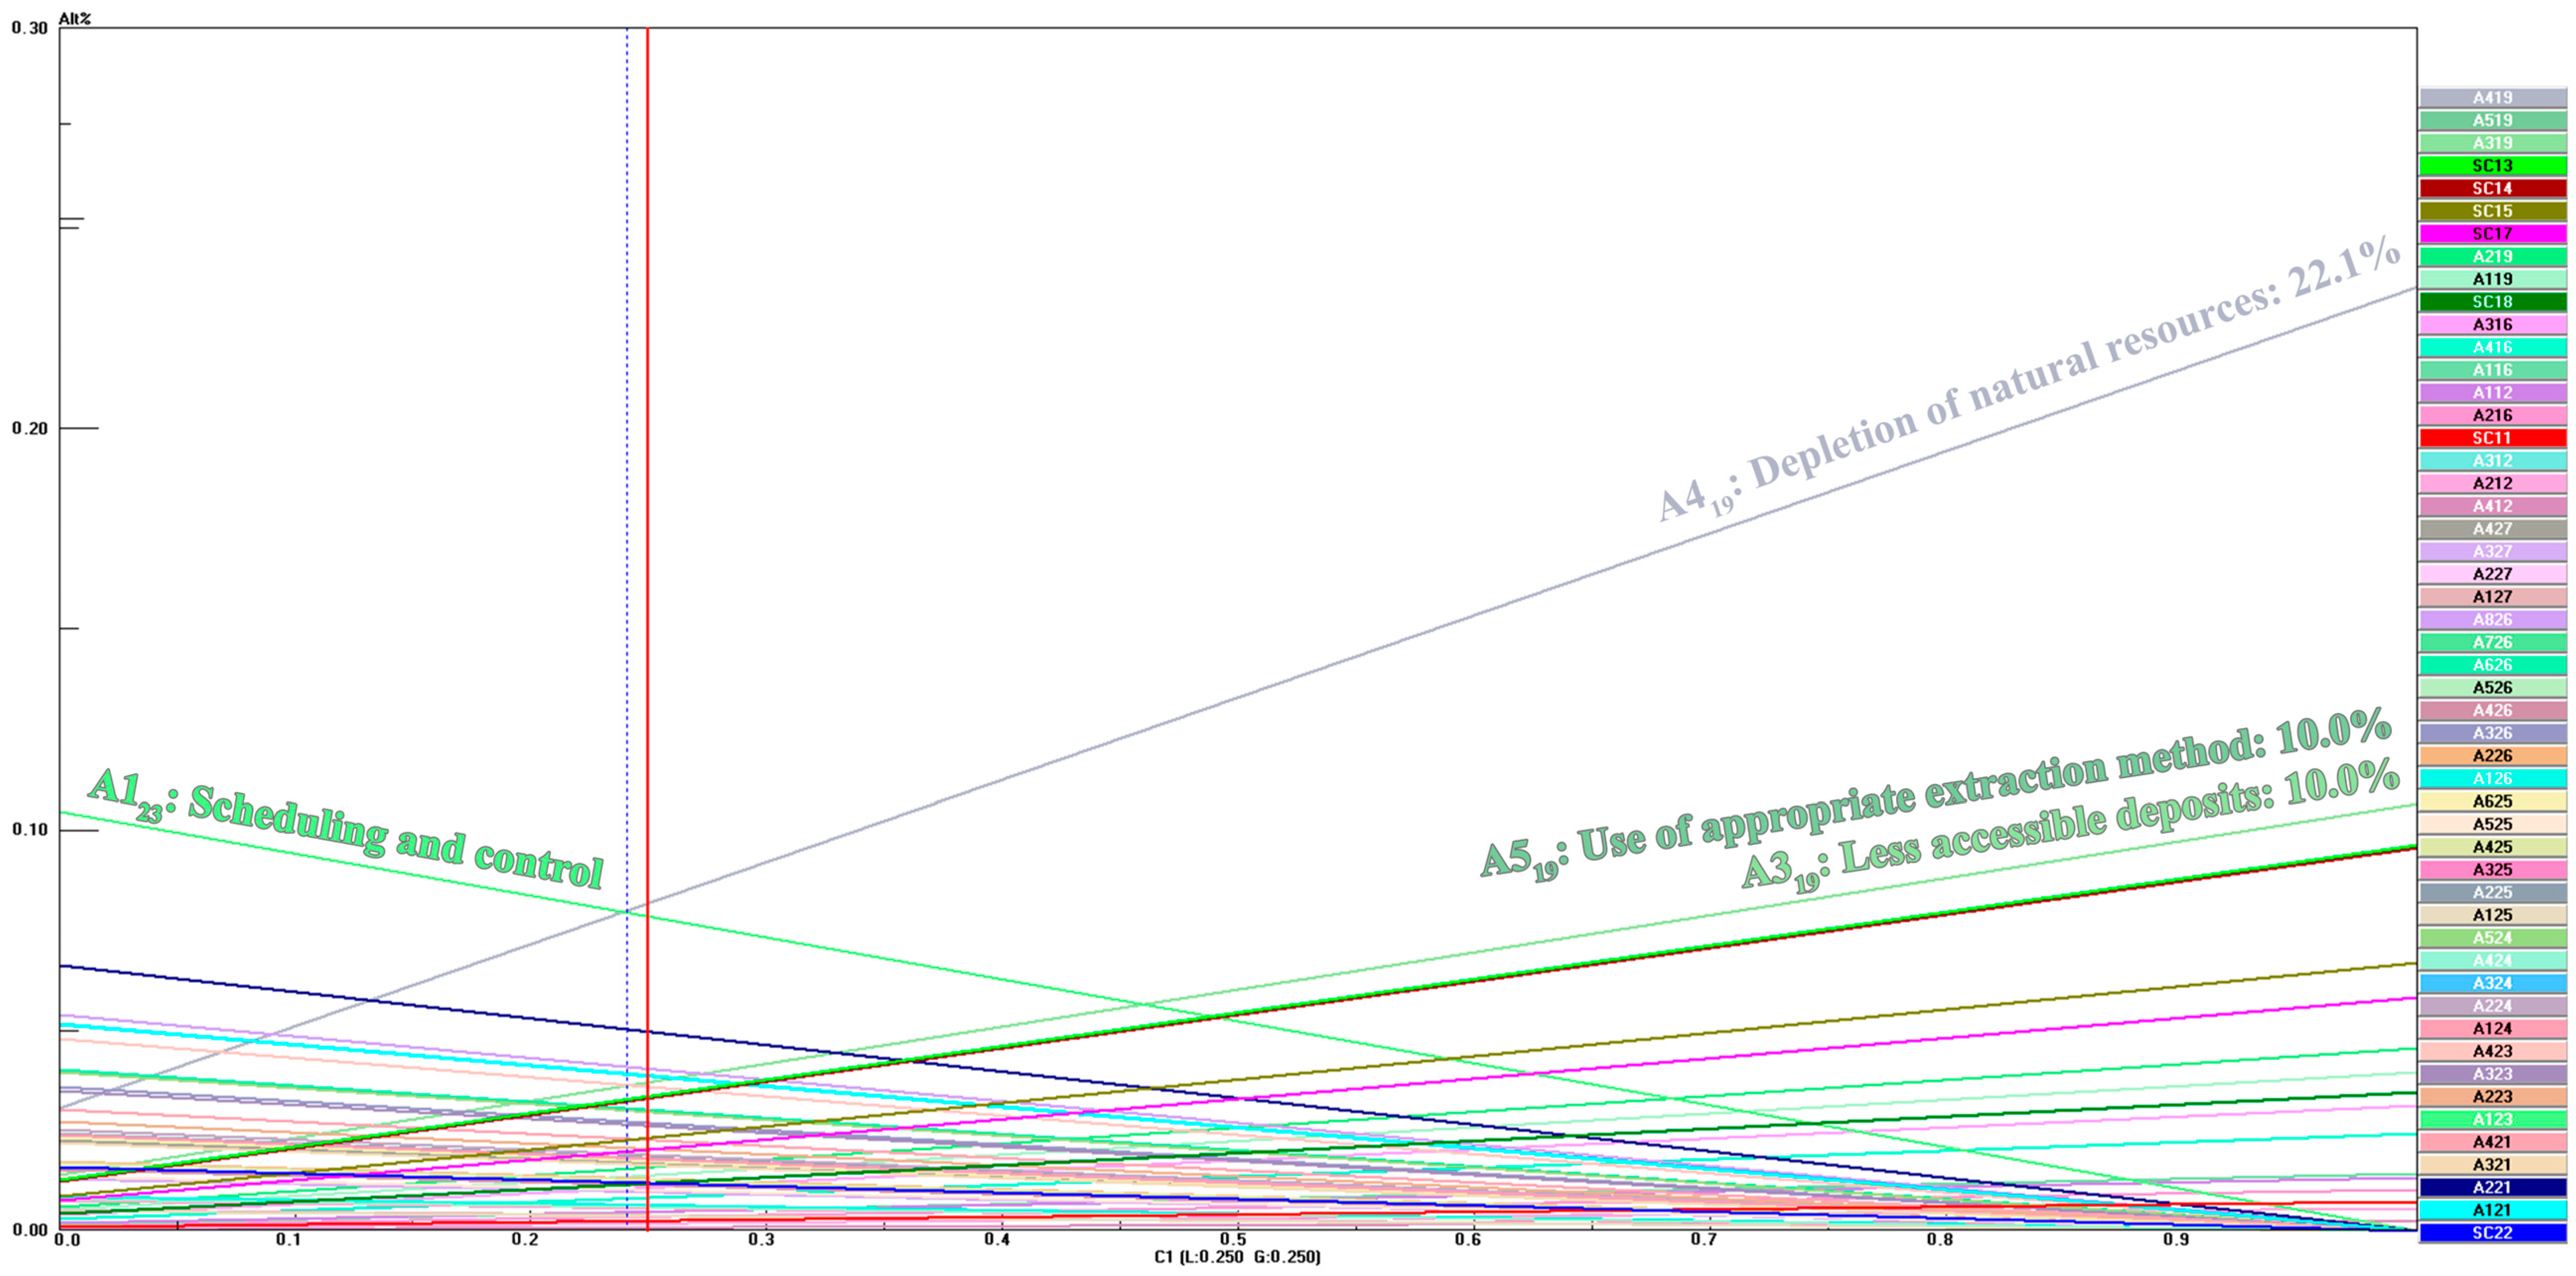
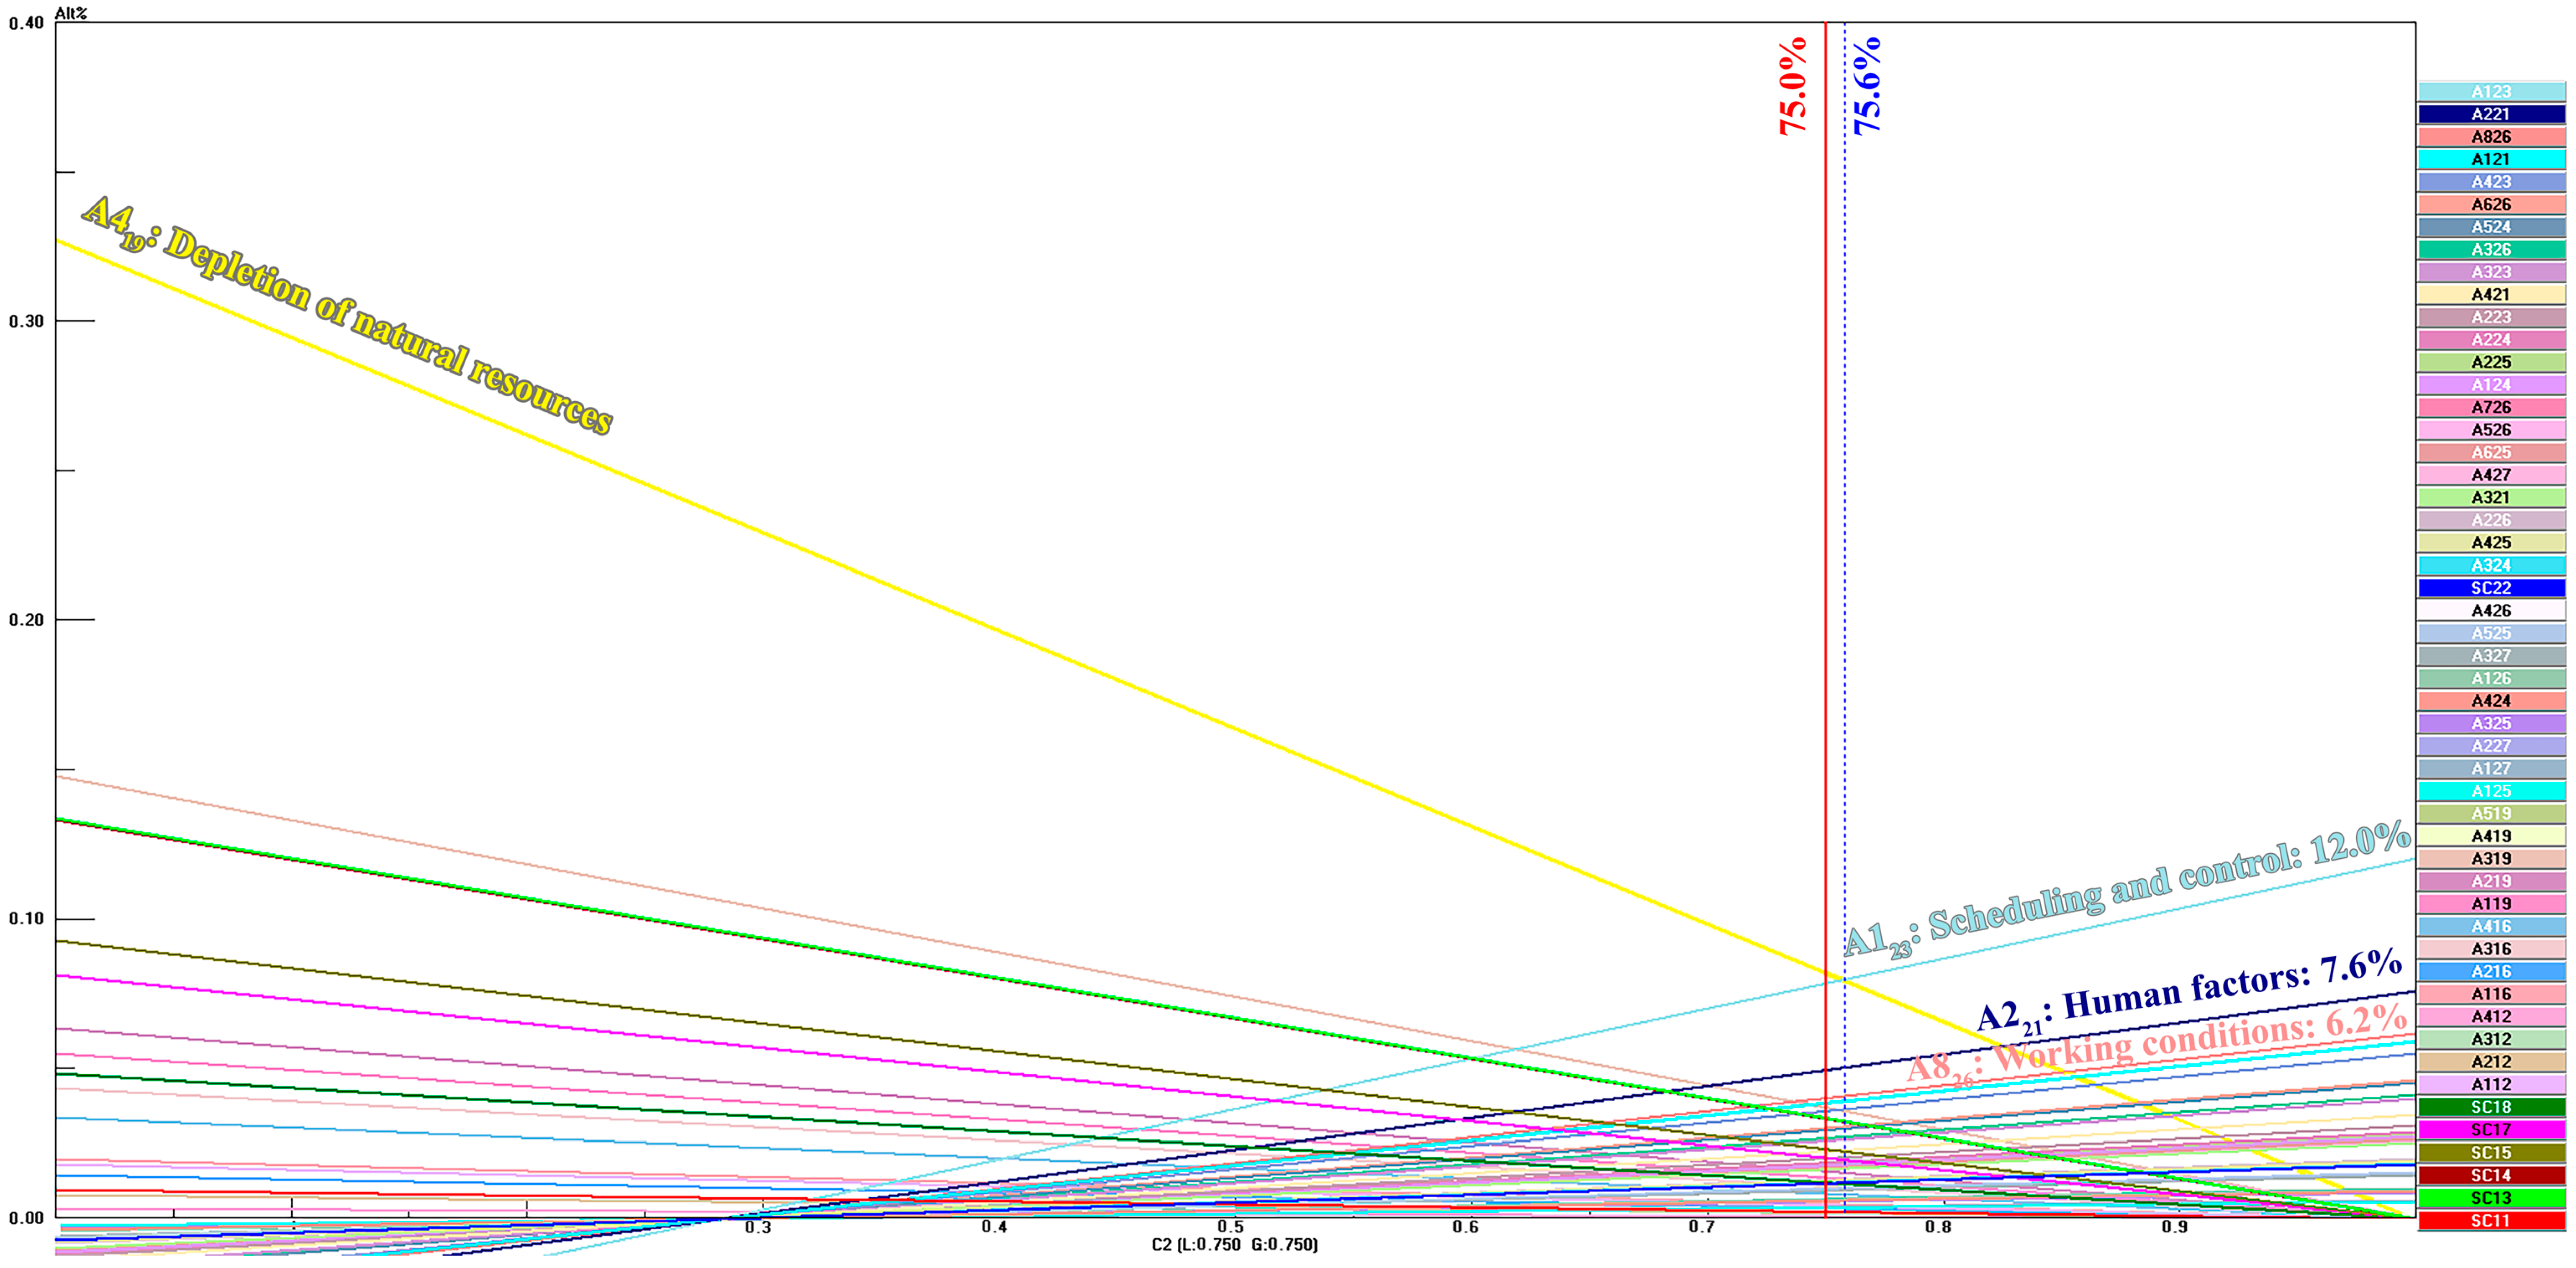
For proper interpretation of these graphs, the horizontal axis represents variations in the weight of the criterion under analysis, whereas the vertical axis represents the local priority of the decision factors. Each curve illustrates how the relative importance of a decision factor evolves throughout the entire range of variation considered.
Two types of curves can be distinguished: (i) curves with positive slopes, corresponding to decision factors associated with the evaluated criterion, whose priorities increase as the criterion weight increases; and (ii) curves with negative slopes, corresponding to decision factors belonging to other criteria, whose relative importance decreases as a consequence of weight normalization within the hierarchical model.
The graph also incorporates two key reference elements: a fixed red vertical line representing the criterion weight under the baseline scenario and a movable dashed blue line that enables the dynamic exploration of alternative scenarios and the visual identification of points at which changes in the priority hierarchy occur.
Because these representations are automatically generated by Expert Choice software (Version 11), the visual arrangement of the curves may exhibit a certain degree of complexity. Nevertheless, interpretation should focus on the trends, slopes, and intersections among curves rather than on the exact graphical position of individual decision factors.
Accordingly, Gradient Sensitivity Analysis enables the identification of stability and transition zones within the decision system, providing a deeper understanding of its structural behavior under progressive changes in criterion weights.
The scenarios evaluated through Gradient Sensitivity Analysis were selected from the main criteria constituting the first hierarchical level of the model. Since the structure contains only two main criteria, External Factors (C1) and Internal Factors (C2), both were included to comprehensively assess the system response to progressive variations in each decision dimension. The selection also considered their global priorities within the hierarchy, beginning with the criterion exhibiting the greatest relative importance and subsequently extending the analysis to the second criterion.
Gradient Analysis of the External Factors Criterion
The resulting curves illustrate the evolution of the global priorities of the decision factors as a function of variations in the External Factors criterion (C
1), providing a continuous interpretation of model sensitivity and the stability of dominant decision factors (
Figure 6). The results reveal the existence of two clearly differentiated patterns, represented by positively and negatively sloped curves, reflecting direct and inverse relationships between decision factors and variations in the weight assigned to C
1.
A critical threshold is identified near a 0.6% variation in criterion weights, at which changes occur in the global hierarchy of decision factors. Under these conditions, the decision factor Depletion of Natural Resources (A419) progressively improves its relative position as the weight assigned to External Factors (C1) increases.
Gradient of the Internal Factors Criterion
Figure 7 presents the Gradient Sensitivity Analysis applied to the Internal Factors criterion (C
2), showing that as its relative importance increases, the decision factors associated with this criterion progressively increase their global priorities, demonstrating a direct and consistent relationship with the hierarchical structure of the model. In particular, the highest-ranked decision factors—Scheduling and Control (A1
23), Human Factor (A2
21), and Working Conditions (A8
26)—exhibit sustained positive slopes, confirming their stability and structural dominance within the system.
This behavior indicates a unidirectional tendency of the model with respect to the dominant criterion (C2), constituting a robust indicator of internal consistency in the allocation of priorities.
Overall, the Gradient Sensitivity Analysis confirms that the model maintains stable behavior under reasonable variations in the weights of the main criteria, thereby reinforcing its structural robustness. However, the identification of a critical threshold near 0.6% in criterion weighting reveals the existence of a sensitivity zone in which reordering of the global ranking may occur.
Within this context, Depletion of Natural Resources (A419) emerges as the only decision factor belonging to External Factors (C1) capable of competing with the dominant internal decision factors under marginal variations in criterion weights. This finding reinforces its strategic relevance and positions it as a critical factor in decision-making associated with the objective of the model.
Taken together, the Gradient Sensitivity Analyses provide a continuous assessment of model robustness, demonstrating how the prioritization structure responds dynamically to progressive variations in the weighting of the main criteria. In both cases—External Factors (C1) and Internal Factors (C2)—a systematic and coherent pattern of behavior is observed, whereby decision factors respond predictably according to their position within the hierarchical structure of the model.
The most significant finding is the consistent identification of a critical inflection point near 0.6% in the weighting of the main criteria, at which non-linear changes occur in the global hierarchy of decision factors. At this threshold, Depletion of Natural Resources (A419), belonging to the Geological Factors subcriterion (SC19), emerges as a competitive decision factor relative to the dominant internal decision factors, revealing its capacity for structural escalation under specific conditions.
In this sense, the Gradient Sensitivity Analysis not only validates the structural stability of the model but also identifies critical thresholds of change, transforming the resulting ranking into a dynamic decision-support framework. Rather than representing a static outcome, the model reveals the conditions under which the priority hierarchy may be reconfigured, thereby strengthening its strategic applicability in decision-making contexts within medium-scale mining.
6. Discussion
Unlike previous studies that have addressed mining productivity through fragmented perspectives or focused on isolated variables, the results of this study reveal a decision structure strongly concentrated on manageable internal factors, according to the relative priorities assigned by the participating experts. This configuration suggests that productivity is perceived primarily as a function of organizational capabilities related to planning, coordination, and resource management, rather than as a direct consequence of external constraints. The predominance of Internal Factors (C
2) may be attributed to their directly manageable nature, in contrast to many external variables that are conditioned by market dynamics, regulatory frameworks, or geological conditions beyond the scope of day-to-day operational control. This finding is consistent with the work of de Solminihac, Gonzales, and Cerda [
2], who identify productivity as a challenge closely associated with the management capabilities of mining operations. It also complements the arguments presented by Sharma et al. [
12] by demonstrating that improvements in productive performance require structured approaches capable of integrating multiple dimensions within a unified decision-making framework.
The results further indicate that productivity is not distributed uniformly across the evaluated decision factors but is instead concentrated within a limited set of critical variables. The evidence that a relatively small number of factors accounts for a substantial proportion of the model’s global weight confirms the existence of a hierarchical prioritization structure in which certain decision factors receive significantly greater relative importance than others. This finding contributes to overcoming the fragmentation identified in the literature, where productivity determinants are frequently analyzed independently, by demonstrating that their relative significance depends on their position and interaction within an integrated decision structure. In this regard, the findings reinforce the need to adopt systemic approaches capable of capturing the interdependencies among productivity determinants and providing a more comprehensive understanding of the mechanisms influencing productive performance in mining operations.
Within this context, the positioning of Scheduling and Control (A1
23) as the decision factor with the highest global priority suggests a strong valuation of operational planning within the analyzed decision framework. This result highlights the importance of effective activity coordination, resource scheduling, and systematic process control as fundamental components of productivity management. The prominence assigned to this factor is consistent with studies emphasizing the need to improve operational efficiency in response to progressive resource depletion, declining ore grades, and increasing operational costs [
6,
7]. Under such conditions, effective planning assumes a strategic function by maximizing the utilization of increasingly constrained resources while simultaneously supporting the management of growing operational complexities.
Complementarily, the high relevance assigned to human capital-related decision factors, such as Human Factor (A221) and Working Conditions (A826), indicates that experts perceive a strong relationship between productivity and workforce management, integrating technical and human dimensions within a common decision framework. Collectively, these results suggest that productivity improvements depend not only on the ability to effectively plan and coordinate operations but also on the development of workforce competencies and the enhancement of working conditions. This evidence reinforces the notion that mining productivity should not be understood exclusively as a technological or operational challenge but also as an organizational one, in which human capabilities play a central role in the successful implementation of productivity improvement strategies.
A particularly relevant finding is the low relative priority assigned to Suppliers (A2
16), which is positioned among the decision factors with the lowest global weights. Although numerous studies have emphasized the role of supply chains and supplier relationships in enhancing mining performance, the results obtained in this study indicate that, within the analyzed context, experts assign substantially greater priority to factors associated with internal organizational management. This finding contrasts with research highlighting suppliers as strategic sources of innovation, technological development, and process improvement within the mining industry [
8,
10,
11]. However, the lower priority assigned to Suppliers (A2
16) should not be interpreted as evidence of limited operational importance. Rather, it reflects the perception that the benefits derived from suppliers depend largely on the existence of internal organizational capabilities capable of absorbing, implementing, and effectively managing such external contributions. Consequently, the lower relative position of Suppliers (A2
16) reflects a difference in priority within the decision structure rather than an absence of relevance to productive performance.
This evidence becomes particularly significant considering that medium-scale mining operations are frequently constrained by technical, economic, and operational limitations that restrict their ability to intervene simultaneously across all factors affecting productivity. Consequently, the results provide a structured basis for guiding the strategic allocation of resources by indicating that investments aimed at strengthening operational planning, activity coordination, and workforce management may generate greater relative benefits than interventions distributed uniformly across multiple organizational dimensions. Furthermore, the findings provide practical guidance for companies, public agencies, and technical support organizations interested in designing capacity-building programs focused on the dimensions identified as priorities within the resulting decision structure.
The Sensitivity Analysis adds a further dimension to the interpretation of the results by demonstrating that, although the model exhibits a high degree of structural stability, it does not constitute a completely rigid configuration. The identification of a critical threshold near 0.6% in the weighting of the main criteria reveals the existence of transition zones in which relatively small variations may generate changes in the global hierarchy of decision factors. Within this framework, Depletion of Natural Resources (A4
19) acquires particular relevance because, despite exhibiting a relatively low priority under the baseline scenario, it substantially improves its relative position as the importance assigned to External Factors (C
1) increases. This behavior demonstrates that certain decision factors may become strategically significant under specific conditions, thereby reinforcing the value of Sensitivity Analysis as a mechanism for anticipating potential shifts in management priorities. These findings are especially relevant in the current context, where the mining industry faces increasing pressures associated with the energy transition, resource availability, and sustainability requirements, conditions that may substantially alter the relative importance of specific productivity determinants over time [
3,
6].
From a theoretical perspective, these findings demonstrate that the contribution of the model extends beyond the identification of priority decision factors to include the evaluation of the stability of those priorities under modifications to the decision structure. In this sense, the study extends previous AHP applications in mining that have focused on specific productivity, evaluation, or selection problems [
17,
18,
19,
20,
21] by simultaneously integrating Internal Factors (C
2), External Factors (C
1), and production-environment-related variables within a single hierarchical structure. Consequently, the research not only generates a prioritization of productivity determinants but also provides empirical evidence regarding the structural robustness of the resulting decisions through the application of Performance Sensitivity Analysis, Gradient Sensitivity Analysis, and Head-to-Head Sensitivity Analysis.
From a practical perspective, the results suggest that productivity improvement strategies in medium-scale mining should prioritize strengthening operational planning, process optimization, and human capital management by concentrating resources on the variables receiving the highest relative priorities within the resulting decision structure. Rather than providing a static ranking of decision factors, the model constitutes an analytical tool capable of supporting efficient resource allocation, evaluating the stability of priorities, and anticipating potential changes under alternative decision scenarios. Furthermore, the study contributes to reducing the existing empirical gap in the Coquimbo Region by providing context-specific evidence regarding the factors that influence productivity in medium-scale mining under conditions characterized by operational constraints, competitive pressure, and the increasing complexity of the productive environment.
7. Conclusions
This study identifies and prioritizes the factors considered most relevant by participating experts for the productivity of medium-scale mining in the Coquimbo Region, using a hierarchical AHP-based approach. In contrast to approaches that analyze productivity determinants in isolation, the developed model integrates technical, organizational, and contextual dimensions within a single decision structure, providing a hierarchical representation of priorities associated with productive performance.
The results reveal a structural predominance of Internal Factors (C2) (0.75) over External Factors (C1) (0.25), indicating that experts assign greater relative importance to variables that are manageable at the organizational level. These findings reflect expert perceptions obtained under specific regional conditions and should not be interpreted as objective causal relationships between the evaluated factors and productivity.
In specific terms, Scheduling and Control (A123) is identified as the decision factor with the highest global priority within the model, while Human Factor (A221) and Working Conditions (A826) also occupy prominent positions. Overall, these results suggest that productivity is primarily perceived as a function of operational planning, resource coordination, and human capital management.
From a structural perspective, productivity is concentrated within a reduced set of critical variables, where a limited number of decision factors accounts for a substantial proportion of the model’s total weight. This pattern suggests that interventions focused on priority factors may constitute a more efficient resource allocation strategy than approaches distributed uniformly across multiple management areas.
Sensitivity analyses confirmed the robustness of the model in structural, local, and continuous terms. However, the identification of a critical threshold near 0.6% in the weighting of the main criteria reveals the existence of transition zones in which small variations may alter the priority hierarchy. In this context, Depletion of Natural Resources (A419) exhibits particularly relevant sensitivity, increasing its relative priority under scenarios in which External Factors (C1) gain greater weight.
From an applied perspective, the results suggest that, under the evaluated conditions and according to the collected expert judgments, productivity improvement strategies in medium-scale mining should prioritize strengthening operational planning, process optimization, and human capital management. This approach supports proactive management based on internal capabilities that experts consider decisive for productive performance.
In terms of scientific contribution, the study not only identifies and prioritizes critical factors but also proposes a structured decision-making framework that integrates multidimensional sensitivity analysis, enabling the simultaneous evaluation of dominance, stability, and conditions of change within the system. Thus, the contribution extends beyond factor prioritization by providing insight into how priority structures remain stable or change under different decision scenarios.
Finally, the applicability of the results should be interpreted considering that the model was constructed using expert judgments from medium-scale mining operations in the Coquimbo Region. Therefore, transferring these findings to other mining contexts requires consideration of the operational, organizational, and territorial specificities of each implementation environment.
8. Limitations and Future Research Directions
This study presents certain limitations that should be considered when interpreting the results. First, the model is based on expert judgments from medium-scale mining operations in the Coquimbo Region, Chile, which may limit the generalizability of the findings to other geographic contexts, mining environments, or operational conditions. Additionally, the hierarchical structure of the AHP depends on the selection of criteria, subcriteria, and decision factors; therefore, alternative configurations could lead to different prioritization outcomes.
Furthermore, although the model incorporates robust sensitivity analysis, it is developed under the assumption of hierarchical independence inherent to AHP, which limits the representation of interdependencies, feedback relationships, or mutual influences among criteria that may affect the priority structure in more complex decision environments.
Finally, since the model is constructed from expert judgments processed through AHP, the resulting priorities reflect perceived relative importance rather than direct measurements of productive performance. Consequently, the results should be interpreted as a structured representation of expert priorities rather than empirical evidence of causal relationships or quantified impacts on productivity. Future research could complement this approach by incorporating operational indicators and longitudinal data to contrast perceived priorities with observed productive performance.
As future research directions, the proposed framework could be applied in different mining contexts to assess the stability and transferability of the identified priorities. Additionally, the incorporation of advanced multi-criteria approaches, such as the Analytic Network Process (ANP), would allow modeling interdependencies among decision factors, while longitudinal studies and the integration of prospective scenarios could enhance the understanding of temporal dynamics and support decision-making under uncertainty.