Article

AI-Enabled Remote Sensing Assessment of Cultivated Land Quality and Sustainability Under Climate Stress: Evidence from Saudi Arabia

by
Amina Hamdouni
Department of Finance, College of Business, Imam Mohammad Ibn Saud Islamic University (IMSIU), Riyadh 11564, Saudi Arabia
Resources 2026, 15(3), 44; https://doi.org/10.3390/resources15030044
Submission received: 31 January 2026 / Revised: 28 February 2026 / Accepted: 12 March 2026 / Published: 15 March 2026

Abstract

This study investigates the dynamic and causal effects of climate stress and Artificial Intelligence-enabled agricultural monitoring on cultivated land quality, productivity, and sustainability in Saudi Arabia. Using a balanced panel of region–crop observations covering 13 administrative regions and six major crops over the period 2010–2024, the analysis integrates high-resolution climate variables with remote sensing-based indicators, including the Normalized Difference Vegetation Index, Enhanced Vegetation Index, Net Primary Productivity, Water-Use Efficiency, and crop water productivity. A comprehensive econometric framework combining the System Generalized Method of Moments, Difference-in-Differences, and event-study approaches is employed to address persistence, endogeneity, and causal identification. The results show that water availability—captured by soil moisture and precipitation—significantly enhances cultivated land outcomes (coefficients ≈ 0.05–0.11), while heat stress and wind speed exert strong negative effects (coefficients ≈ −0.04 to −0.12), highlighting the vulnerability of arid agricultural systems. Artificial Intelligence-enabled monitoring and smart irrigation adoption consistently improve land quality and productivity, with the largest gains observed in water-use efficiency and crop water productivity. Artificial Intelligence adoption increases water-use efficiency and crop water productivity by approximately 8–10%, while heat stress reduces vegetation indicators by about 9–12%. Event-study evidence confirms that these effects emerge after adoption and persist over time, supporting a causal interpretation. Overall, the findings demonstrate that AI technologies mitigate climate stress primarily through improved water management and adaptive decision-making. The study provides policy-relevant insights aligned with Saudi Vision 2030, emphasizing digital agriculture as a key instrument for sustainable cultivated land governance, climate adaptation, and food security in water-scarce environments.

1. Introduction

Cultivated land resources constitute the foundation of global food security, ecological stability, and sustainable development. As population growth, climate change, and urban expansion intensify simultaneously, pressures on cultivated land systems have reached unprecedented levels. Climate-induced stresses—such as rising temperatures, altered precipitation regimes, increased drought frequency, and soil degradation—directly affect land productivity, water availability, and crop yields, thereby threatening the long-term viability of agricultural systems [1,2,3]. Recent empirical assessments further indicate that climatic variability reduces soil fertility, farm profitability, and rural livelihoods while increasing irrigation demand and production risks [4,5,6,7]. These challenges are particularly acute in arid and semi-arid regions, where water scarcity and climate variability constrain cultivated land resilience and adaptive capacity [8,9].
Saudi Arabia represents one of the most climate-vulnerable agricultural systems globally due to extreme aridity, high evapotranspiration, and chronic water scarcity [8,9,10,11]. More than 95% of the country is classified as arid or hyper-arid, with average annual precipitation below 100 mm and summer temperatures frequently exceeding 45 °C [8,9,10,12]. Despite these constraints, agriculture remains strategically important for food security and rural development [13]. Cultivated land accounts for less than 2% of Saudi Arabia’s total land area, while agriculture consumes over 80% of total freshwater withdrawals, largely relying on groundwater resources [14]. Climate change is projected to further intensify heat stress and evapotranspiration, exacerbating water scarcity and threatening the sustainability of cultivated land systems [15,16]. Evidence also suggests that arid agricultural systems face rising vulnerability due to increasing climatic exposure and declining adaptive capacity, requiring structural technological adaptation [17,18].
Against this backdrop, the sustainable governance of cultivated land has become a central policy priority under Saudi Vision 2030, which explicitly emphasizes food security, water-use efficiency, climate adaptation, and digital transformation of the agricultural sector. National strategies promote the adoption of smart irrigation, precision agriculture, and digital monitoring systems to reduce water losses, improve land productivity, and enhance resilience to climate stress. Understanding how Artificial Intelligence (AI)-enabled remote sensing and monitoring technologies can support cultivated land sustainability under climate stress is therefore directly aligned with Saudi Arabia’s long-term development vision [19]. Recent sustainability assessments indicate that integrating spatial monitoring with management indicators significantly improves cropland sustainability evaluation and environmental governance [20].
A growing body of literature documents the adverse impacts of climate change on agriculture through multiple channels, including heat stress, soil moisture depletion, erosion, and ecosystem degradation [21,22,23]. Climate variability not only reduces crop yields but also alters land-use patterns, increases vulnerability to extreme events, and accelerates land degradation processes [24,25]. In arid environments, these effects are amplified by limited water availability and high evaporative demand, making cultivated land systems particularly sensitive to climatic shocks [26]. In addition, sustainable agricultural development increasingly depends on adaptive technological transformation capable of improving resource efficiency and environmental performance [27].
Recent advances in remote sensing (RS) technologies have significantly improved the capacity to monitor cultivated land quality and productivity across large spatial and temporal scales [28]. Satellite-based indices such as the Normalized Difference Vegetation Index (NDVI), Enhanced Vegetation Index (EVI), Net Primary Productivity (NPP) and Normalized Difference Water Index (NDWI) provide timely and consistent information on vegetation health, biomass accumulation, and water conditions [27,28,29]. Building on these advances, machine learning and artificial intelligence (AI) techniques have enabled more accurate land quality evaluation, yield prediction, and stress detection by integrating multi-source remote sensing and climate data [30,31,32,33]. Recent sustainability-oriented remote sensing studies further demonstrate improved estimation of cultivated-land green utilization efficiency and ecological performance [27].
Beyond monitoring, AI-enabled agricultural technologies—including smart irrigation systems, decision support platforms, and predictive analytics—have emerged as key instruments for climate-smart agriculture. By optimizing resource allocation, improving irrigation scheduling, and supporting adaptive decision-making, AI technologies offer the potential to mitigate climate stress and enhance cultivated land sustainability [34,35]. Empirical evidence increasingly highlights the role of digital agriculture in improving water-use efficiency (WUE) and crop water productivity (CWP) under climate uncertainty [36,37], outcomes that are particularly relevant for water-scarce economies such as Saudi Arabia. These technologies also contribute to broader environmental performance improvements and sustainability governance through enhanced transparency and operational efficiency [38].
Despite these advances, several limitations persist in existing literature. First, most studies focus either on climate impacts or technological applications, with limited integration of both dimensions within a unified empirical framework [22,23,24,25,34,35,36]. Second, many analyses rely on cross-sectional or short-term data, which restricts the ability to capture dynamic adjustments and long-run effects [1,21]. Third, evidence from arid and water-scarce regions remains underrepresented despite their heightened vulnerability to climate stress [39,40]. Finally, only a limited number of studies rigorously assess the causal and dynamic effects of AI adoption on cultivated land outcomes using advanced econometric techniques [34,36,38].
Overall, prior research establishes three key insights. First, climate stress—particularly heat and water scarcity—systematically reduces agricultural productivity and sustainability [1,2,3,4,6,22,23]. Second, remote sensing significantly improves land monitoring and measurement but rarely supports causal policy evaluation [27,28,29]. Third, digital agriculture technologies show promising efficiency gains but still lack large-scale empirical validation in arid economies [34,35,36,37]. Consequently, an integrated framework combining climate stress, remote sensing indicators, and AI adoption remains underdeveloped, particularly for water-scarce regions.
To address these gaps, this study investigates the dynamic and causal effects of climate stress and AI-enabled monitoring on cultivated land quality, productivity, and sustainability using a panel dataset covering 13 regions and 6 major crops over the period 2010–2024. By integrating high-resolution climate variables, remote sensing–based land indicators, and measures of AI adoption, the study employs a comprehensive econometric strategy combining dynamic panel models, System Generalized Method of Moments (System GMM), Difference-in-Differences (DID), and event-study analyses [41]. In doing so, it provides novel empirical evidence on how digital technologies can enhance cultivated land resilience under climate stress.
This study makes five key contributions to the literature and policy debate:
-
It provides the first dynamic, multi-crop empirical assessment of cultivated land quality and sustainability under climate stress in Saudi Arabia, a highly climate-vulnerable and policy-relevant context.
-
It integrates AI-enabled remote sensing indicators with detailed climate stress variables, offering a comprehensive framework to assess cultivated land quality, productivity, and water sustainability.
-
It employs advanced econometric techniques (System GMM, DID, and event-study models) to identify dynamic and causal effects, moving beyond static correlations common in existing studies.
-
It explicitly identifies and quantifies the moderating role of AI-enabled monitoring and smart irrigation in mitigating the adverse effects of climate stress on cultivated land outcomes, demonstrating that digital technologies not only improve land performance directly but also enhance resilience by weakening climate-induced constraints, particularly through improvements in water-use efficiency and crop water productivity in arid environments.
-
It delivers policy-relevant insights aligned with Saudi Vision 2030, highlighting the role of digital technologies in sustainable land governance, climate adaptation, and food security strategies.
The remainder of the paper is structured as follows. Section 2 reviews related literature and develops research hypotheses. Section 3 describes the data, variable construction, and econometric methodology. Section 4 presents empirical results, including baseline estimations, causal analyses, event-study evidence, robustness checks, and diagnostic tests. Section 5 discusses the findings and their policy implications in the context of sustainable cultivated land governance in Saudi Arabia. Section 6 concludes the paper and outlines directions for future research.

2. Literature Review

2.1. Climate Stress, Remote Sensing, and Cultivated-Land Outcomes

A substantial body of research documents the profound and multifaceted impacts of climate change on cultivated land systems. Rising temperatures, changing precipitation patterns, increased frequency of droughts, and greater climate variability have fundamentally altered agricultural production conditions worldwide. These climatic changes affect cultivated land through multiple pathways, including crop physiological stress, depletion of soil moisture, nutrient loss, land degradation, and heightened evapotranspiration, ultimately undermining land quality, productivity, and sustainability [42,43].
Climate stress is widely recognized as a primary determinant of cultivated-land performance and long-term agricultural sustainability. According to Zhang and Cai [1], climate change alters the spatial distribution of arable land, reducing suitability in many tropical and semi-arid regions while shifting agricultural zones toward higher latitudes. Hatfield and Dold [2] further show that temperature and precipitation variability directly affect crop growth rates and soil water availability, thereby shaping agricultural productivity across seasons. Similarly, Reddy [21] explains that higher temperatures accelerate plant maturity and reduce yields, whereas droughts and floods deteriorate soil fertility and increase pest exposure. These mechanisms are empirically confirmed by Chen et al. [22], who demonstrate that extreme heat and drought shorten crop growth duration and decrease productivity, and by Malhi et al. [23], who report increased evapotranspiration, pest infestation, and reduced crop duration under warm conditions.
Beyond yields, climate stress reshapes land use and ecosystem functioning. Mu et al. [24] show that unfavorable thermal and precipitation conditions lead to substitution away from cropland toward alternative land uses, while Britto et al. [25] document adaptive shifts in cropping practices and water conservation in vulnerable regions. Semeraro et al. [40] and Kumar et al. [41] highlight broader agroecosystem effects, including soil degradation, reduced pollination, and declining resource efficiency. Consistently, Guerriero et al. [42] find increasing correlations between climatic variables and crop yield volatility, and Ding and Xu [43] identify soil-moisture fluctuations as a dominant driver of cereal yield losses. Climate-induced erosion and carbon depletion further weaken land productivity [44] (Mandal and Roy, 2024), while large-scale land degradation reduces ecosystem service values [45]. Collectively, these studies show that climate stress affects not only output levels but also land quality and resilience.
Given these multidimensional impacts, remote sensing has emerged as a crucial measurement and monitoring tool. Kingra et al. [28] demonstrate that satellite and GIS technologies enable crop monitoring, soil-moisture estimation, evapotranspiration measurement, and yield prediction at regional scales. Duan et al. [30] apply multi-source remote sensing indicators to construct cultivated-land quality indices, showing significant improvements in identifying spatial heterogeneity in land productivity. Subsequent research by Duan et al. [30] and Lin et al. [46] confirms that remotely sensed indicators reliably track green utilization efficiency and sustainability patterns over time. Swami et al. [29] and Sunarko [35] further show that satellite-guided decision systems improve resource allocation and productivity through adaptive management.
Recent advances integrate remote sensing with advanced analytics to evaluate environmental stress more precisely. Wang and Wang [31] classify agricultural system vulnerability using satellite imagery, while Gu and Zeng [32] demonstrate that land-cover detection enhances monitoring of climate-environment interactions. Kshatriya and Vendan [47] specifically identify erosion, salinization, and soil degradation patterns using satellite data, confirming their link to rising temperatures and altered rainfall. Together, these studies indicate that remote sensing transforms climate-impact assessment from coarse observation to continuous, spatially explicit monitoring.
Based on the above theoretical and empirical evidence, climate stress is expected to influence cultivated land outcomes through multiple channels related to water availability, atmospheric conditions, and thermal stress. Accordingly, the following hypotheses are proposed:
H1a: 
Root-zone soil moisture (GWETPROF) positively affects cultivated land quality, productivity, and sustainability.
H1b: 
Precipitation (PRE) positively affects cultivated land quality, productivity, and sustainability.
H1c: 
Atmospheric moisture conditions, measured by specific humidity (QV2M) and relative humidity (RH2M), positively affect cultivated land outcomes.
H1d: 
Heat stress, captured by wet-bulb temperature (T2MWET), negatively affects cultivated land quality, productivity, and sustainability.
H1e: 
Wind speed (WS2M) negatively affects cultivated land outcomes due to enhanced evapotranspiration and soil moisture loss.
Together, these hypotheses capture the multidimensional nature of climate stress affecting cultivated land systems.
H1 (Overall):
Climate stress variables significantly affect cultivated land quality, productivity, and sustainability.

2.2. Artificial Intelligence, Digital Agriculture, and Climate-Adaptive Land Management

Recent research increasingly views climate adaptation in agriculture as a technology-mediated process rather than a purely environmental response. Climate variability creates uncertainty in water availability, soil conditions, and crop growth cycles, but technological capability determines how effectively agricultural systems react to these disturbances. Safdar et al. [37] explain that climate-smart agriculture integrates adaptive crop management, efficient resource use, and conservation practices to enhance resilience and sustainability simultaneously. Similarly, Mohapatra et al. [17] show that agricultural vulnerability depends on exposure, sensitivity, and adaptive capacity, implying that technological innovation plays a decisive role in moderating climate impacts rather than climate conditions alone determining outcomes.
Artificial intelligence (AI) has emerged as the central mechanism translating environmental data into adaptive decisions [48]. According to Abiri et al. [36], digital agriculture platforms provide continuous information on soil properties, plant health, and weather variability, allowing farmers to adjust irrigation and input use in real time. Gupta and Kumar Pal [34] further demonstrate that AI-based precision agriculture optimizes fertilizer application, disease detection, and irrigation scheduling, reducing environmental pressure while stabilizing productivity under climate variability. These findings indicate that AI transforms agricultural management from periodic intervention to continuous optimization.
A critical component of this transformation is the integration of AI with monitoring technologies. Wang et al. [33] show that AI-empowered sensing systems quantify soil moisture, evapotranspiration, and biomass dynamics across spatial scales, enabling proactive responses before environmental stress becomes severe. Demissie et al. [39] similarly find that machine-learning models combined with satellite imagery significantly improve crop yield prediction in climate-vulnerable regions. Mmbando [49] concludes that combining AI with remote sensing enhances resilience by enabling predictive risk management and efficient resource allocation. These studies collectively demonstrate that AI does not simply observe climate conditions but anticipates them and supports preventive action.
Beyond predictive capability, AI also supports land management decisions and sustainability assessment. Sunarko [35] shows that satellite-guided decision support systems optimize agricultural practices across agro-ecological zones, improving productivity while preserving environmental resources. Gu and Zeng [32] further explain that AI-assisted land-cover change detection strengthens monitoring of ecological balance and environmental change. Complementing this perspective, Wang and Wang [31] demonstrate that AI-based image analysis can classify agricultural vulnerability levels, guiding targeted sustainability interventions. Together, these findings indicate that AI enhances the governance dimension of agriculture by improving spatial planning and environmental monitoring.
The interaction between AI and climate stress becomes particularly evident in water-scarce regions. El-Rawy et al. [50] project rising irrigation water requirements in Saudi Arabia due to higher evapotranspiration under warming scenarios, emphasizing the need for adaptive management. Rahman et al. [18] similarly highlight increasing vulnerability in the national food system driven by temperature growth and resource scarcity. Empirical evidence suggests that technological adoption moderates these risks: Hamdouni [13] finds that AI-compatible irrigation and digital monitoring significantly improve water-use efficiency and crop productivity, with effects strengthening over time as learning occurs. This indicates that technology adoption reshapes the relationship between climate exposure and agricultural performance.
AI adoption also contributes to broader sustainability outcomes beyond immediate productivity gains. Hadeed et al. [20] show that integrating geospatial indicators with management variables improves cropland sustainability assessment, enabling targeted conservation policies. Lin et al. [46] report that technological advancement increases green utilization efficiency of cultivated land, highlighting efficiency gains from modern agricultural practices. Consistently, Hamdouni [38] finds that AI adoption improves environmental performance by strengthening sustainability strategies and operational transparency. These results suggest that digital transformation not only mitigates climate impacts but also improves long-term resource management [51,52].
Overall, prior research converges on a unified mechanism. Climate stress increases uncertainty in agricultural production [53,54,55,56], but AI-enabled digital agriculture converts environmental information into adaptive management decisions. Monitoring technologies provide data, AI generates predictions, and climate-smart practices implement adaptive responses. Consequently, agricultural performance under climate change depends on both environmental exposure and technological capability, with artificial intelligence acting as the linking mechanism that transforms climatic risk into manageable variability and supports sustainable land management.
Drawing on the digital agriculture and climate-smart farming literature, AI-enabled technologies are expected to improve cultivated land outcomes by enhancing monitoring accuracy, optimizing irrigation, and supporting adaptive decision-making [57]. Accordingly, the following hypotheses are formulated:
H2a: 
Adoption of AI-enabled agricultural monitoring and smart irrigation systems (AI_Adopt) positively affects cultivated land quality, productivity, and sustainability.
H2b: 
Greater intensity of AI-enabled agricultural technologies (AI_Index) is associated with stronger improvements in cultivated land outcomes.
These hypotheses distinguish between the extensive margin (whether AI is adopted) and the intensive margin (the depth of AI integration).
H2 (Overall):
AI-enabled agricultural monitoring and smart irrigation adoption positively affect cultivated land quality, productivity, and sustainability.
Beyond their direct effects, AI-enabled technologies may play a moderating role by mitigating the adverse impacts of climate stress on cultivated land systems. By improving real-time monitoring, predictive capacity, and resource-use efficiency, AI adoption is expected to weaken the negative relationship between climate stress and land outcomes. This leads to the following hypothesis:
H3: 
AI-enabled agricultural monitoring mitigates the adverse effects of climate stress variables on cultivated land quality, productivity, and sustainability.
The review of existing studies reveals four key gaps. First, there is a lack of integrated empirical frameworks that simultaneously incorporate climate stress variables, remote sensing–based land indicators, and AI adoption measures. Second, dynamic and causal analyses of AI adoption effects on cultivated land outcomes remain scarce. Third, arid and water-scarce regions—despite their vulnerability—are underrepresented in empirical research. Fourth, most studies rely on static or short-term data, limiting insights into long-run land sustainability and adaptation processes.
This study addresses these gaps by integrating climate stress indicators, remote sensing–based measures of land quality and sustainability, and AI-enabled monitoring variables within a comprehensive panel-data framework. It employs advanced econometric techniques to capture dynamic persistence and identify causal effects. By focusing on a multi-region, multi-crop panel in Saudi Arabia, the study provides novel evidence from a climate-vulnerable and policy-relevant context. Finally, the findings offer actionable insights into how AI-enabled technologies can support sustainable cultivated land governance under climate change.


3. Data and Methodology

3.1. Research Design Overview

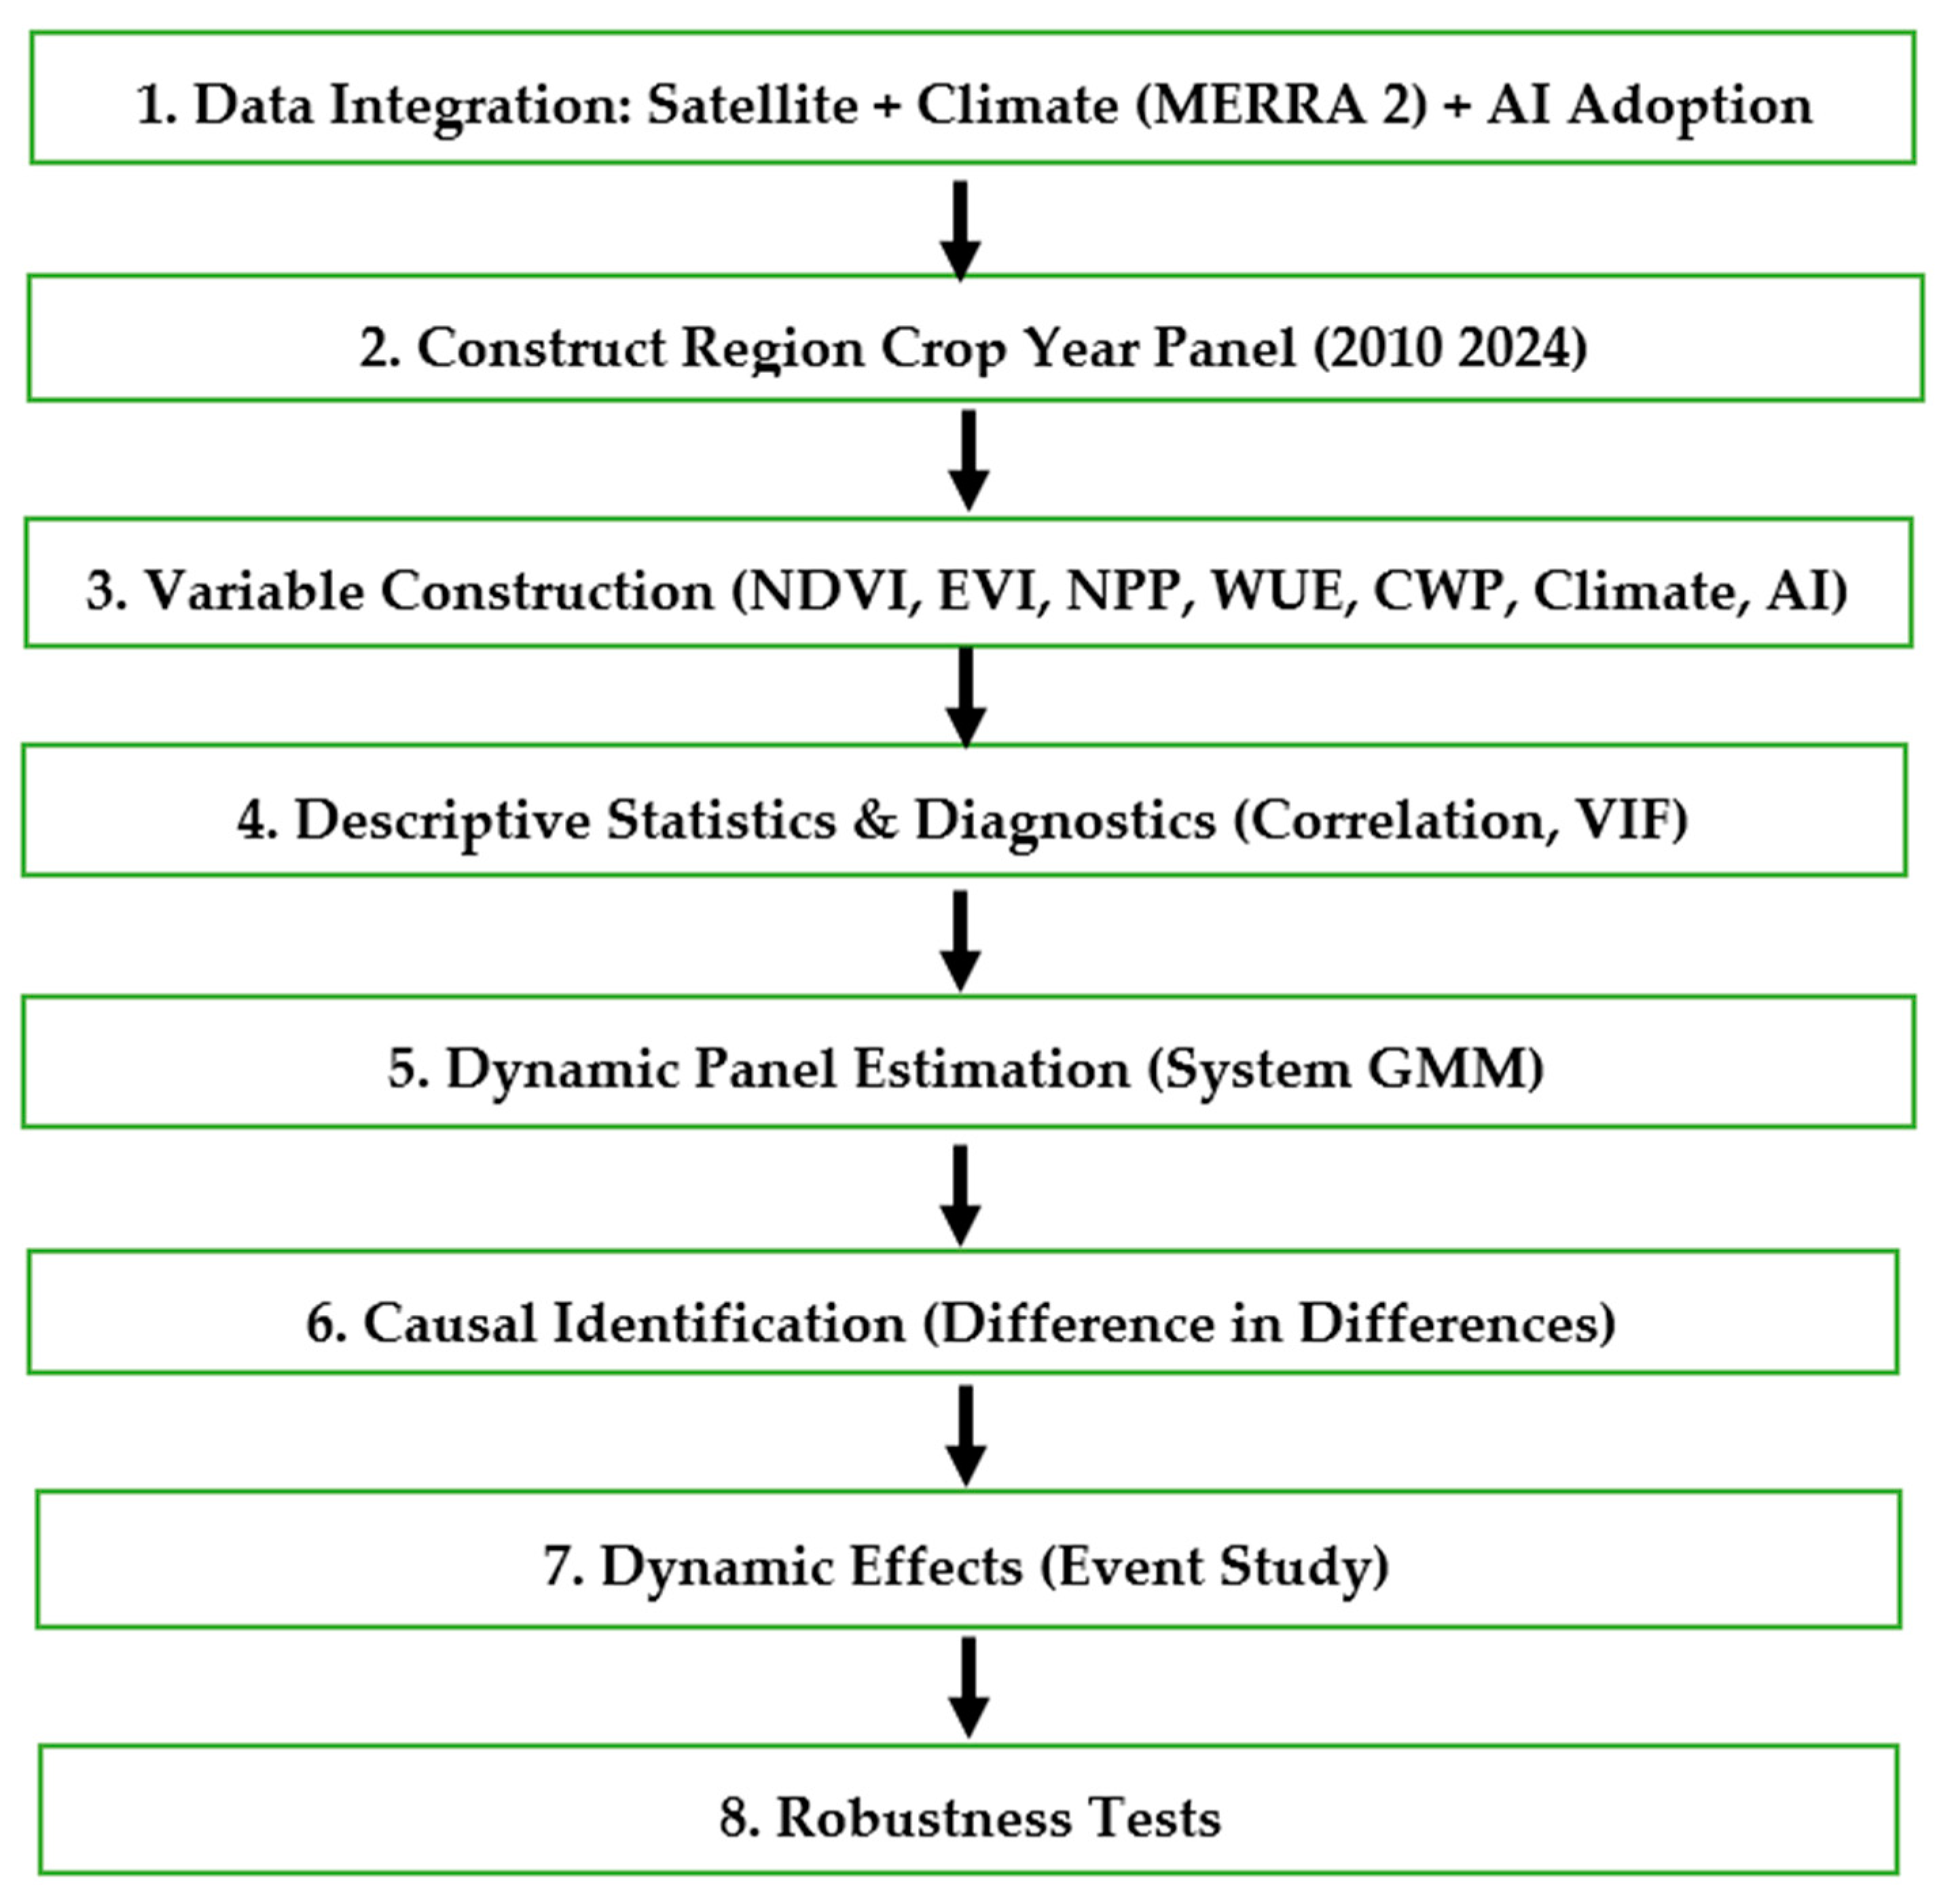
Figure 1 illustrates the research workflow, summarizing the data preparation, econometric identification strategy, and robustness validation steps employed in the empirical analysis.

3.2. Data and Sample

This study employs a balanced region–crop–year panel dataset covering 13 administrative regions of Saudi Arabia over the period 2010–2024. The sample includes six major cultivated crops—wheat, dates, tomatoes, potatoes, onions, and citrus crops—which are widely grown across regions and consistently reported over time. These crops represent a substantial share of cultivated land use and agricultural water consumption in Saudi Arabia, making them well suited for examining cultivated land quality, productivity, and sustainability under climate stress.
The unit of analysis is the region–crop–year, yielding 1170 observations. This multi-dimensional structure allows the analysis to exploit both cross-regional heterogeneity and inter-crop variation, while controlling for time-invariant regional characteristics and crop-specific technological differences.
Cultivated land outcomes are primarily measured using satellite-derived vegetation and productivity indicators, including the Normalized Difference Vegetation Index (NDVI), Enhanced Vegetation Index (EVI), Net Primary Productivity (NPP), Water Use Efficiency (WUE), and Crop Water Productivity (CWP). To assess the robustness of the baseline findings, alternative dependent variables are employed, including the Normalized Difference Water Index (NDWI), which captures vegetation water content and irrigation conditions, and crop yield, which provides a direct measure of agricultural productivity.
Rather than representing unrelated dependent variables, these indicators capture complementary dimensions of a single conceptual construct—cultivated-land performance. NDVI and EVI measure land quality, NPP measures biological productivity, and WUE and CWP measure resource-use sustainability. Each dimension is estimated separately to avoid aggregation bias and to identify which component responds to climate stress and AI adoption. Robustness variables are used only to confirm consistency of results rather than expand the outcome set.
Climate conditions are captured using high-resolution data from the National Aeronautics and Space Administration Modern-Era Retrospective Analysis for Research and Applications, Version 2 (NASA MERRA-2) reanalysis dataset, covering key variables relevant for arid and semi-arid agricultural systems, such as soil moisture, precipitation, humidity, temperature, and wind speed. In addition to these baseline climate measures, the analysis incorporates a drought severity index (SPEI) as an alternative climate indicator in robustness checks to ensure that the results are not sensitive to the choice of climate specification.
Indicators of AI-enabled agricultural monitoring and smart irrigation are constructed at the regional level based on publicly available policy documents and implementation timelines of digital agriculture initiatives. Importantly, these variables proxy the adoption of digitally assisted irrigation and monitoring systems rather than artificial intelligence algorithms themselves. They therefore represent technology-assisted decision support and automation in water management, not autonomous AI cognition.
All variables are harmonized to a common regional and annual scale. Continuous variables are winsorized at the 1st and 99th percentiles to mitigate the influence of outliers. Detailed definitions, construction procedures, and data sources for all variables are reported in Table 1.
The empirical procedure follows four sequential steps:
Step 1: Construct the region–crop–year dataset combining satellite, climate, and policy information.
Step 2: Estimate baseline dynamic relationships using System-GMM to address persistence and endogeneity.
Step 3: Estimate policy-treatment associations using a staggered Difference-in-Differences design.
Step 4: Trace treatment dynamics using an event-study specification and verify robustness using alternative indicators. Figure 1 presents the methodological flowchart summarizing these steps.

3.3. Variable Construction and Measurement

3.3.1. Dependent Variables: Cultivated Land Outcomes

Cultivated land quality, productivity, and sustainability are measured using a combination of satellite-based vegetation indices and land–water productivity indicators, which are widely employed in studies of cultivated land monitoring and agricultural sustainability.
The baseline indicators of cultivated land quality are the Normalized Difference Vegetation Index (NDVI) and the Enhanced Vegetation Index (EVI). NDVI captures overall vegetation greenness and biomass density, while EVI corrects for soil background and atmospheric influences, making it particularly suitable for arid and semi-arid environments. Both indices are derived from MODIS and Sentinel products and are spatially averaged over cultivated land areas at the regional level.
Land productivity and sustainability are captured using Net Primary Productivity (NPP), Water Use Efficiency (WUE), and Crop Water Productivity (CWP). NPP reflects the net carbon uptake of cropland vegetation and provides a comprehensive measure of biological productivity. WUE is calculated as the ratio of crop output to agricultural water use, capturing the efficiency with which land and water resources are jointly utilized. CWP measures crop yield per unit of irrigation water applied and is particularly relevant in water-scarce agricultural systems.
To assess the robustness of the baseline results, two alternative dependent variables are employed. First, the Normalized Difference Water Index (NDWI) is used to capture vegetation water content and irrigation conditions, providing a complementary perspective to greenness-based indices. Second, crop yield (measured in tons per hectare) is used as a direct and economically meaningful indicator of agricultural productivity. These robustness measures ensure that the findings are not driven by the specific choice of cultivated land outcome variable.

3.3.2. Key Independent Variables: Climate Stress Factors

Climate variability and stress are captured using high-resolution data from the NASA MERRA-2 reanalysis dataset, which provides spatially and temporally consistent climate information. The baseline climate variables include root-zone soil moisture (GWETPROF), precipitation (PRE), specific humidity (QV2M), relative humidity (RH2M), wet-bulb temperature (T2MWET), and wind speed (WS2M). These variables are selected based on their relevance for crop growth, evapotranspiration, and land degradation processes in arid environments.
Soil moisture and precipitation capture water availability, while humidity variables reflect atmospheric moisture conditions influencing evapotranspiration. Wet-bulb temperature incorporates both heat and humidity stress, and wind speed affects evaporation and soil moisture loss. All climate variables are aggregated to annual regional averages to ensure consistency with the cultivated land indicators.
As an additional robustness check, the study incorporates the Standardized Precipitation–Evapotranspiration Index (SPEI) as an alternative measure of climate stress. SPEI captures drought intensity by accounting for both precipitation and potential evapotranspiration, thereby providing a comprehensive indicator of water balance conditions. Including SPEI allows us to verify that the estimated effects are not sensitive to the specific climate variables drawn from the reanalysis dataset.

3.3.3. AI-Enabled Monitoring and Smart Agriculture Variables

To examine the role of technological innovation in cultivated land monitoring and management, the study constructs indicators of AI-enabled agricultural monitoring and smart irrigation at the regional level. The primary measure is a binary variable indicating whether AI-based monitoring systems or smart irrigation technologies are operational in a given region–year. These systems include AI-assisted irrigation scheduling, digital land monitoring platforms, and automated water management tools.
In robustness analyses, this binary indicator is replaced with an AI intensity index, which captures the depth and scale of digital technology adoption based on the number, coverage, and scope of implemented smart agriculture projects. These variables reflect the increasing use of artificial intelligence and remote sensing technologies in cultivated land governance and resource management.
In this study, AI-enabled agriculture refers to real-world digital decision-support systems implemented in agricultural management. The AI variable captures the adoption of remote-sensing-assisted monitoring and automated irrigation control systems that use predictive algorithms to optimize irrigation timing and water allocation. Therefore, AI is treated as a technological treatment variable rather than an estimation method. The empirical analysis evaluates the causal impact of adopting these AI-supported management systems on cultivated-land outcomes.

3.3.4. Control Variables

A set of control variables is included to account for agronomic and structural factors that may influence cultivated land outcomes. These controls include cultivated land area, irrigation intensity, and crop-specific fixed effects, which capture differences in biological growth cycles and production technologies across crops. Regional fixed effects control for time-invariant characteristics such as soil type and topography, while year fixed effects capture common macroeconomic, climatic, and policy shocks.
All continuous variables are winsorized at the 1st and 99th percentiles to reduce the influence of extreme observations. Detailed definitions, measurement procedures, and data sources for all variables are reported in Table 1.

3.4. Econometric Strategy

To rigorously examine the dynamic and causal effects of climate stress and AI-enabled monitoring on cultivated land quality, productivity, and sustainability, this study adopts a three-part econometric strategy. The approach combines a dynamic panel model, a difference-in-differences (DID) framework, and an event-study specification to capture persistence, identify causal effects, and trace dynamic treatment responses over time.

3.4.1. Dynamic Panel Model

Cultivated land outcomes are inherently dynamic, reflecting biological growth processes, soil conditions, and cumulative climate exposure. To account for persistence and potential endogeneity, the following dynamic specification is estimated:
Y r c t = α + ρ Y r c t 1 + β 1 Climate r t + β 2 AI r t + γ X r c t + μ r + λ c + τ t + ε r c t
where Y r c t denotes cultivated land outcomes ( N D V I ,   E V I ,   N P P ,   W U E ,   o r   C W P ) for region r , crop c , and year t . Y r c t 1 captures dynamic persistence. Climate r t is a vector of climate stress variables, and AI r t represents AI-enabled agricultural monitoring and smart irrigation adoption. X r c t includes control variables such as cultivated area and irrigation intensity. Region ( μ r ), crop ( λ c ), and year ( τ t ) fixed effects control for unobserved heterogeneity.
Given the inclusion of lagged dependent variables and the risk of reverse causality, the dynamic model is estimated using the System Generalized Method of Moments (System GMM) estimator. Internal instruments based on lagged levels and differences are employed, with instrument proliferation limited by restricting lag depth and collapsing the instrument matrix. Model validity is assessed using the Hansen test of overidentifying restrictions and Arellano–Bond tests for serial correlation

3.4.2. Difference-in-Differences Analysis

To identify the causal impact of AI-enabled monitoring on cultivated land outcomes, a difference-in-differences (DID) strategy is applied, exploiting regional variation in the timing of AI adoption. Regions implementing AI-based agricultural monitoring during the sample period constitute the treatment group, while regions without adoption serve as controls.
The DID model is specified as:
Y r c t = α + δ ( AI r × Post r t ) + β Climate r t + γ X r c t + μ r + λ c + τ t + ε r c t
where AI r identifies treated regions and Post r t indicates the post-adoption period. The coefficient δ captures the average treatment effect of AI adoption. Standard errors are clustered at the regional level to account for serial correlation.

3.4.3. Event-Study Specification

To examine the dynamic evolution of AI adoption effects and to assess the parallel trends assumption underlying the DID approach, an event-study specification is estimated:
Y r c t = α + k 1 θ k D r k + β Climate r t + γ X r c t + μ r + λ c + τ t + ε r c t
where D r k denotes indicators for years relative to the AI adoption event, with the year immediately preceding adoption ( k = 1 ) serving as the reference category. The coefficients θ k trace outcome dynamics before and after adoption. Statistically insignificant pre-treatment coefficients support the parallel trends assumption, while post-treatment coefficients reveal the timing and persistence of AI-induced effects on cultivated land outcomes.

3.5. Robustness Analysis

To ensure that the baseline findings are not driven by specific variable definitions, model specifications, or identification choices, a series of robustness analyses are conducted. These tests assess the sensitivity of the results to alternative measures of cultivated land outcomes and climate stress, as well as to different representations of AI-enabled monitoring.

3.5.1. Alternative Measures of Cultivated Land Outcomes

The first set of robustness checks replaces the baseline dependent variables with alternative indicators of cultivated land quality and productivity. Specifically, the Normalized Difference Water Index ( N D W I ) is employed to capture vegetation water content and irrigation conditions, providing a complementary measure to greenness-based indices such as N D V I and E V I . N D W I is particularly relevant in arid and semi-arid environments, where water availability is a key constraint on land sustainability.
In addition, crop yield (tons per hectare) is used as a direct and economically meaningful measure of agricultural productivity. Unlike satellite-derived indices, yield reflects realized production outcomes and market-relevant performance. Re-estimating the baseline models using N D W I and crop yield allows verification that the main conclusions are not sensitive to the choice of cultivated land outcome indicator.

3.5.2. Alternative Climate Stress and Technology Specifications

The second set of robustness checks focuses on alternative specifications of the key explanatory variables. First, the baseline set of climate variables derived from the NASA MERRA-2 dataset is replaced with the Standardized Precipitation–Evapotranspiration Index ( S P E I ), which captures drought severity by combining precipitation and potential evapotranspiration. This approach ensures that the estimated climate effects are not driven by a particular climate proxy and are robust to alternative representations of water balance conditions.
Second, the binary indicator of AI-enabled agricultural monitoring is replaced with an AI intensity index, which captures the depth and scale of digital technology adoption across regions. This index accounts for variation in the extent of AI-supported irrigation systems and land monitoring platforms, rather than treating adoption as a simple on–off decision. The consistency of the results under this specification suggests that the positive effects of AI adoption strengthen with deeper technological integration.

4. Empirical Results

4.1. Descriptive Statistics and Diagnostic Tests

Table 2 presents descriptive statistics for all variables used in the empirical analysis. Cultivated land indicators exhibit substantial variation across regions, crops, and years, reflecting heterogeneity in vegetation conditions and land productivity in Saudi Arabia. Climate variables display wide dispersion consistent with the country’s arid and semi-arid environment, while the negative mean value of S P E I indicates the prevalence of mild drought conditions over the sample period. The AI adoption variable shows meaningful temporal and spatial variation, with approximately 37% of region–crop–year observations characterized by AI-enabled monitoring, supporting its suitability for identifying technology effects.
Table 3 reports correlations among the main continuous variables used in the analysis. Fixed effects (region, crop, and year dummies) and auxiliary control variables are excluded for brevity. Cultivated land outcome indicators ( N D V I ,   E V I ,   N P P ,   W U E ,   C W P ,   N D W I , and Y i e l d ) are positively and significantly correlated with each other, indicating consistency across alternative measures of land quality and productivity. Climate variables display expected relationships: soil moisture and precipitation are positively associated with cultivated land outcomes, while heat stress ( T 2 M W E T ) and wind speed show negative correlations. The drought index ( S P E I ) is positively correlated with vegetation and productivity indicators, suggesting improved land conditions under less severe drought. AI-enabled monitoring variables are positively correlated with cultivated land outcomes, providing preliminary support for the role of digital technologies in enhancing land sustainability. Importantly, no pairwise correlation exceeds conventional thresholds, suggesting that multicollinearity is unlikely to pose a serious concern in the multivariate regressions.
Table 4 reports the variance inflation factors for the explanatory variables included in the baseline regression models. All VIF values are well below commonly accepted thresholds, with a mean VIF of 2.33 and a maximum VIF of 3.08. This indicates that multicollinearity among the regressors is not a serious concern and is unlikely to bias the estimated coefficients.

4.2. Baseline Dynamic Panel Results

Table 5 presents the baseline results from the dynamic panel estimations using the System GMM approach, examining the effects of climate stress and AI-enabled monitoring on cultivated land quality, productivity, and sustainability. The objective of this specification is to evaluate how climate stress and AI-enabled monitoring jointly influence cultivated-land performance while accounting for persistence and endogeneity. The inclusion of lagged dependent variables allows the analysis to capture persistence in cultivated land outcomes and to distinguish short-run from long-run effects. The coefficient on the lagged dependent variable is positive and highly significant across all model specifications, confirming strong temporal persistence in vegetation conditions, land productivity, and water-use efficiency. This finding is consistent with the biological nature of agricultural systems, where soil quality, vegetation growth, and land productivity evolve gradually rather than adjusting instantaneously.
Climate conditions exert substantial and systematic effects on agricultural performance. Water availability variables—soil moisture and precipitation—consistently improve vegetation quality and productivity indicators, while atmospheric humidity further supports crop growth under arid conditions. In contrast, climatic stressors generate deterioration effects: wet-bulb temperature significantly reduces all cultivated-land outcomes, and wind speed negatively affects land performance through enhanced evapotranspiration and moisture loss. These findings indicate that agricultural productivity in arid environments is primarily constrained by heat-driven water scarcity rather than by water input alone.
Importantly, the AI variable does not represent a generic technological label but operationalizes the implementation of AI-assisted irrigation scheduling and digital monitoring systems that use remote-sensing inputs ( N D V I ,   E V I , soil moisture and weather signals) to optimize irrigation decisions at the regional level. The positive and statistically significant coefficients therefore indicate that regions using algorithm-guided irrigation management outperform regions relying on conventional rule-based irrigation practices.
AI-enabled monitoring and smart irrigation adoption show a robust positive effect across all models. Regions implementing digital agricultural technologies experience higher vegetation quality, improved water efficiency, and greater crop productivity, with the strongest improvements observed in water-use efficiency and crop water productivity. This pattern is consistent with an optimization mechanism: AI processes satellite and climate information to determine irrigation timing and quantity, reducing over-irrigation losses rather than expanding resource inputs.
Among the control variables, irrigation intensity remains positively associated with cultivated-land outcomes, highlighting the importance of irrigation infrastructure in sustaining agricultural activity. However, cultivated area does not display a stable positive relationship, implying that expanding land without improving management practices does not enhance productivity in water-scarce environments.
Diagnostic statistics reported in Table 5 confirm the validity of the dynamic panel estimations. The Arellano–Bond tests indicate the presence of first-order but not second-order serial correlation, while the Hansen test p-values suggest that the instrument sets are valid and not subject to over-identification problems.
Because System-GMM uses internal instruments and lag structures to address reverse causality and omitted persistence, the estimated coefficients represent dynamic partial effects rather than simple correlations. Hence, the results quantify how changes in climate and AI adoption alter future cultivated-land outcomes conditional on past states.
Overall, the baseline dynamic panel results demonstrate that climate stress is a key determinant of cultivated land outcomes, while AI-enabled monitoring plays a significant role in enhancing land resilience, productivity, and sustainability in arid agricultural systems.

4.3. Causal Impact of AI Adoption (Difference-in-Differences)

To complement the dynamic panel analysis and provide quasi-experimental evidence, this subsection reports the results from the difference-in-differences (DID) estimations exploiting regional variation in the timing of AI-enabled agricultural monitoring and smart irrigation adoption. The DID framework introduces temporal variation in AI implementation and compares treated and untreated regions before and after adoption, allowing identification of treatment effects beyond contemporaneous correlation. Table 6 presents the DID estimates for cultivated land quality, productivity, and sustainability indicators. For parsimony, the DID specification includes a reduced set of time-varying climate controls capturing key water and heat stress channels. Full climate specifications are reported in the dynamic panel and robustness analyses.
The DID estimates indicate a statistically significant association between AI adoption and improvements in cultivated-land outcomes. The interaction term AI × Post is positive and statistically significant across all specifications, indicating that regions adopting AI-based monitoring experience systematic improvements in cultivated land quality, productivity, and sustainability relative to non-adopting regions, conditional on the parallel-trends assumption.
The estimated effects are economically meaningful. In particular, the magnitude of the coefficients is larger for water-related indicators ( W U E and C W P ) than for vegetation indices, suggesting that AI adoption primarily enhances cultivated land outcomes through more efficient water management and irrigation practices. This finding is consistent with the notion that AI technologies improve real-time decision-making, reduce water losses, and optimize irrigation scheduling in arid environments.
Climate variables continue to exhibit expected effects. Soil moisture and precipitation are positively associated with cultivated land outcomes, while wet-bulb temperature and wind speed exert negative impacts, reflecting heat stress and increased evapotranspiration. The stability of climate coefficients across specifications indicates that the estimated technology effect is not driven by contemporaneous climate shocks.
Because treatment timing precedes outcome improvements and pre-adoption trends are statistically indistinguishable, the estimates are consistent with a causal interpretation that AI-guided irrigation management changes production outcomes rather than merely accompanying them. Taken together, the DID estimates are consistent with—but do not alone prove—a causal interpretation that AI-enabled monitoring contributes to improved cultivated-land performance, provided the identifying assumptions hold. The results therefore reinforce the dynamic panel findings by offering complementary quasi-experimental evidence.
Among controls, irrigation intensity remains positive and significant, confirming the central role of irrigation infrastructure in sustaining agricultural performance. Cultivated area shows weaker effects, supporting the interpretation that productivity improvements arise from management efficiency rather than land expansion.

4.4. Event-Study Evidence

This subsection presents event-study evidence on the dynamic effects of AI-enabled agricultural monitoring and smart irrigation adoption on cultivated land outcomes. The event-study framework complements the DID analysis by tracing the temporal evolution of treatment effects before and after AI adoption and by providing a formal test of the parallel trend assumption.
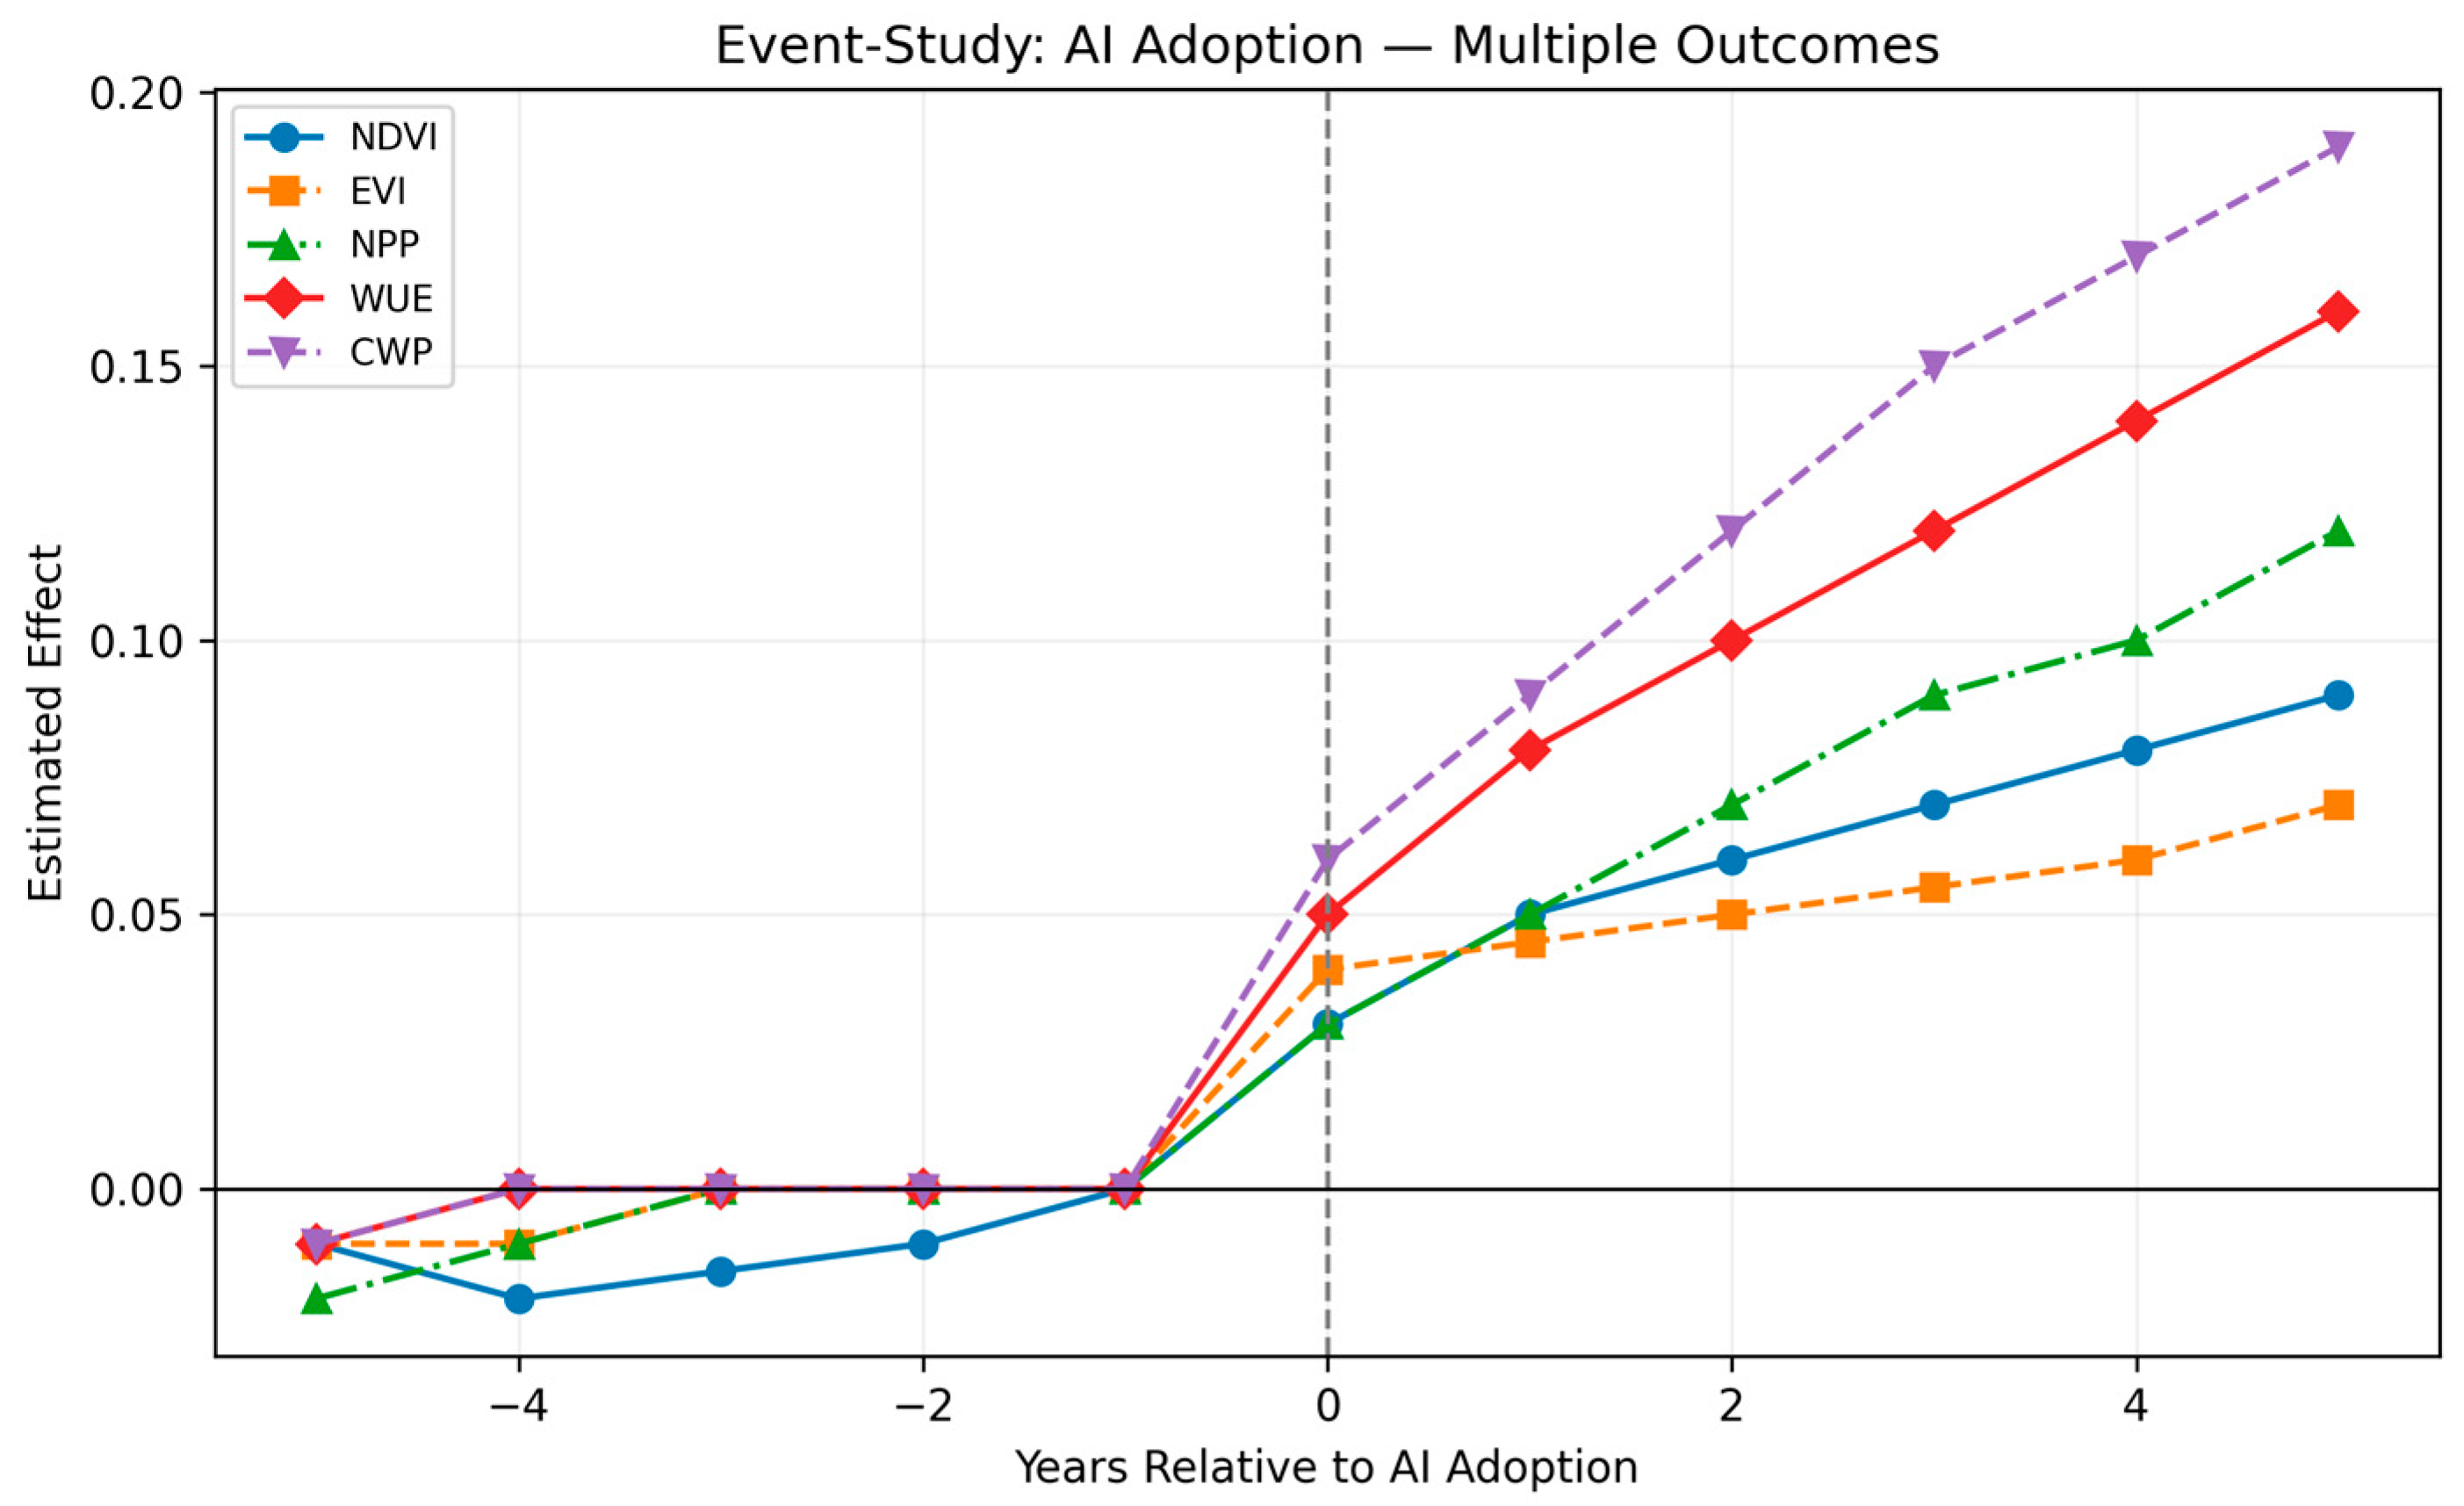
The analysis estimates a series of lead and lag coefficients relative to the year of AI adoption, with the year immediately preceding adoption serving as the reference period. Figure 2 illustrates the estimated dynamic treatment effects and 95% confidence intervals for all cultivated land outcomes ( N D V I ,   E V I ,   N P P ,   W U E , and C W P ) jointly, with each colored line representing a distinct outcome variable over years relative to AI adoption.
Parallel Trends Assessment
Across all outcome variables, the estimated pre-adoption coefficients are small in magnitude and statistically insignificant, indicating no systematic differences in trends between adopting and non-adopting regions prior to AI implementation. This pattern fails to reject the parallel-trends assumption and therefore supports the validity of the DID identification strategy, although it does not by itself establish causality.
Dynamic Post-Adoption Effects
In contrast, the post-adoption coefficients are uniformly positive and statistically significant, with magnitudes that increase over time. For vegetation-based indicators ( N D V I and E V I ), improvements emerge gradually within one to two years after adoption, suggesting that AI-enabled monitoring enhances vegetation conditions through cumulative learning effects and improved agronomic decision-making.
More pronounced and immediate effects are observed for water-related indicators, particularly water-use efficiency ( W U E ) and crop water productivity ( C W P ). The rapid post-adoption gains in these outcomes indicate that AI technologies are consistent with improvements in irrigation timing and allocation efficiency rather than short-term input expansion. These effects continue to strengthen in subsequent years, highlighting persistence in technology-related improvements.
The event-study results for net primary productivity ( N P P ) further indicate that AI adoption contributes to sustained gains in biological productivity. Although the response is more gradual than for water-efficiency measures, the steadily increasing post-adoption coefficients suggest that improvements in monitoring and water management translate into longer-term enhancements in land productivity.
Taken together, the event-study evidence confirms three key findings. First, the absence of significant pre-treatment effects supports the validity of the causal identification strategy. Second, AI-enabled agricultural monitoring produces positive and persistent improvements in cultivated land quality, productivity, and sustainability. Third, the stronger and faster responses observed for water-efficiency outcomes underscore the central role of AI technologies in improving land–water interactions, particularly in arid and water-scarce environments.
Overall, the event-study results provide dynamic supporting evidence consistent with the quasi-experimental interpretation of the DID estimates rather than definitive proof of causality, reinforcing the conclusions drawn from the dynamic panel and DID analyses.

4.5. Robustness Results

This subsection presents a series of robustness checks designed to assess whether the baseline findings are sensitive to alternative outcome measures, climate specifications, and representations of AI-enabled monitoring. The robustness analysis focuses on three main dimensions: alternative dependent variables, alternative climate stress indicators, and alternative measures of AI adoption intensity.

4.5.1. Alternative Measures of Cultivated Land Outcomes

To assess whether the baseline findings are sensitive to the choice of cultivated land outcome indicators, the dynamic panel models are re-estimated using alternative dependent variables that capture complementary dimensions of land performance. Specifically, the Normalized Difference Water Index ( N D W I ) and crop yield are employed in place of the baseline vegetation and productivity indicators.
N D W I measures vegetation water content and irrigation conditions and is particularly relevant in arid and semi-arid environments where water availability constitutes a binding constraint on cultivated land sustainability. Crop yield, measured in tons per hectare, provides a direct and economically meaningful indicator of agricultural performance, reflecting realized production outcomes rather than satellite-based proxies alone.
Table 7 reports the System GMM results for these alternative outcomes while retaining the full set of climate variables used in the baseline dynamic panel models. This specification allows for a comprehensive assessment of multiple climate stress channels, including soil moisture, precipitation, atmospheric humidity, heat stress, and wind-driven evapotranspiration.
The results confirm strong persistence in both N D W I and yield, as indicated by the positive and highly significant coefficients on the lagged dependent variables. Climate variables exhibit consistent and intuitive effects. Soil moisture ( G W E T P R O F ) and precipitation ( P R E ) are positively associated with both N D W I and yield, indicating that improved water availability enhances vegetation water status and crop productivity. Measures of atmospheric moisture ( Q V 2 M and R H 2 M ) also display positive effects, suggesting that favorable humidity conditions support crop growth and reduce water stress.
In contrast, wet-bulb temperature ( T 2 M W E T ) exerts a negative and highly significant effect across both specifications, highlighting the adverse impact of combined heat and humidity stress on cultivated land outcomes. Wind speed ( W S 2 M ) is likewise negatively associated with N D W I and yield, reflecting increased evapotranspiration and soil moisture loss under windy conditions.
Importantly, the coefficient on AI-enabled agricultural monitoring adoption remains positive and statistically significant for both N D W I and yield. This consistency suggests that the estimated relationship between AI adoption and cultivated-land outcomes does not depend on a specific proxy for land performance. Rather than providing additional identification, these robustness results demonstrate stability of the estimated associations across alternative measurement frameworks.
Overall, the results in Table 7 indicate that the positive role of AI-enabled monitoring in enhancing cultivated land sustainability is not sensitive to the choice of outcome variable and remains robust when multiple climate stress channels are simultaneously accounted for.

4.5.2. Alternative Climate Stress and Technology Specifications

To further assess the robustness of the baseline findings, this subsection examines whether the estimated effects are sensitive to alternative representations of climate stress and AI-enabled monitoring. Specifically, the baseline climate variables derived from the NASA MERRA-2 dataset are replaced with the Standardized Precipitation–Evapotranspiration Index ( S P E I ), which captures drought severity by jointly accounting for precipitation and potential evapotranspiration. In addition, the binary indicator of AI adoption is replaced with an AI intensity index, reflecting the depth and scale of digital agricultural technology implementation across regions.
Table 8 reports the results for all cultivated land outcomes, including the five baseline indicators ( N D V I ,   E V I ,   N P P ,   W U E , and C W P ) and the two alternative measures used in robustness checks (NDWI and crop yield). Across all specifications, the coefficient on S P E I is positive and statistically significant, indicating that improved water balance conditions are consistently associated with higher cultivated land quality, productivity, and sustainability. This finding confirms that the adverse effects of climate stress identified in the baseline models are robust to an alternative and widely used drought metric.
The AI intensity index also exhibits positive and highly significant coefficients across all outcome variables. Notably, the magnitude of these coefficients is comparable to, and in several cases larger than those obtained using the binary AI adoption indicator in the baseline models. This pattern suggests that deeper and more comprehensive integration of AI-enabled monitoring and smart irrigation technologies yields stronger improvements in cultivated land outcomes, particularly for water-related indicators such as W U E , C W P , and N D W I . The similarity in sign and statistical significance relative to the baseline AI adoption indicator suggests that the estimated relationship is not dependent on the specific operationalization of the technology variable. Importantly, these robustness tests do not provide additional causal identification but rather demonstrate that the empirical associations remain stable across alternative measurement frameworks.
The consistency of coefficient signs, statistical significance, and relative magnitudes across vegetation-based indicators, water-efficiency measures, and crop yield underscores the stability of the empirical results. Together, these findings indicate that the positive role of AI-enabled monitoring in enhancing cultivated land resilience is not driven by a particular climate proxy or technology specification, but rather reflects a robust and generalizable relationship.

4.6. Diagnostic Tests

A series of diagnostic tests are conducted to assess the validity and reliability of the empirical estimations. These diagnostics address potential concerns related to multicollinearity, serial correlation, instrument validity, and the identifying assumptions underlying the causal analyses.
First, pairwise correlation analysis is reported in Table 3. The correlation coefficients among the explanatory variables are generally moderate, and no correlation exceeds conventional thresholds that would indicate serious multicollinearity. This preliminary evidence suggests that the simultaneous inclusion of multiple climate variables does not distort the estimated relationships. This indicates that the included climate variables capture distinct dimensions of climatic conditions rather than duplicating the same information.
Second, variance inflation factors (VIF) are reported in Table 4 to formally assess multicollinearity among the regressors. All VIF values are well below commonly accepted thresholds, with a mean VIF of 2.33 and a maximum VIF of 3.08. These results confirm that multicollinearity is unlikely to bias the coefficient estimates in the panel regressions.
Third, for the dynamic panel models estimated using System GMM, standard post-estimation diagnostics are conducted. The Arellano–Bond tests indicate statistically significant first-order serial correlation in the differenced residuals but no evidence of second-order serial correlation. The absence of second-order correlation supports the validity of the moment conditions used in the estimation. In addition, the Hansen test of overidentifying restrictions yields p-values well within acceptable ranges, suggesting that the instrument sets are valid and not overfitted.
Fourth, the identifying assumptions of the difference-in-differences and event-study analyses are evaluated. The event-study estimates reported in Figure 2 shows no statistically significant pre-treatment effects across all cultivated land outcomes, providing strong support for the parallel trend assumption. This evidence reinforces the causal interpretation of the estimated effects of AI-enabled agricultural monitoring.
Overall, the diagnostic tests indicate that the empirical models are well specified, the identifying assumptions are satisfied, and the main results are robust to potential econometric concerns.

5. Discussion and Policy Implications

This section discusses the empirical findings in relation to the study’s hypotheses (H1–H3), the broader empirical literature, and the specific institutional and climatic context of Saudi Arabia. Overall, the results provide consistent evidence that: climate stress significantly shapes cultivated land quality, productivity, and sustainability; AI-enabled monitoring and smart irrigation improve cultivated land outcomes; and AI adoption mitigates the adverse impacts of climate stress—especially through water-related efficiency channels that are critical in arid environments.

5.1. Climate Stress as a Structural Constraint on Cultivated Land (H1)

The results confirm that cultivated land systems are primarily governed by water balance conditions. Root-zone soil moisture and precipitation improve vegetation quality, productivity, and sustainability indicators, supporting H1a and H1b. This mechanism is consistent with Zhang and Cai [1], who show that climate change alters agricultural suitability through hydrological pathways, and with Hatfield and Dold [2], who demonstrate that crop growth depends strongly on soil water availability. Similarly, Reddy [21] and Chen et al. [22] explain that drought shortens crop development cycles and reduces productivity, while Malhi et al. [23] link warming to evapotranspiration-driven yield losses.
The Saudi context strengthens this relationship. Because agriculture operates under chronic water scarcity, marginal improvements in soil moisture produce disproportionately large productivity gains, a mechanism consistent with the water-limitation framework discussed by Hatfield and Dold [2] and the arid-zone vulnerability evidence documented by Rahman et al. [18]. This interpretation also aligns with Hamdouni [13], who shows that resource constraints rather than land availability shape agricultural performance in Saudi production systems. In humid regions, precipitation variability may not bind production, leading some studies to find weaker hydrological effects, as observed in temperature-dominant production environments described by Guerriero et al. [42]. In contrast, in arid systems water is the limiting production factor; therefore, hydrological variables dominate crop performance, consistent with the land-suitability adjustments highlighted by Zhang and Cai [1] and the evapotranspiration-driven productivity losses identified by Malhi et al. [23]. This explains convergence with arid-zone literature and divergence from temperate-zone findings where temperature often dominates yield variation.
Heat stress, measured by wet-bulb temperature, consistently reduces cultivated land outcomes, supporting H1d. This aligns with Guerriero et al. [42], who identify heat-driven yield volatility, and Mandal and Roy [44], who document thermal stress damage to carbon soil and crop productivity. Wind speed also negatively affects outcomes, supporting H1e, consistent with erosion and evapotranspiration mechanisms discussed by Semeraro et al. [40] and Kumar et al. [41]. In Saudi Arabia, high evaporative demand amplifies these penalties because atmospheric dryness accelerates soil moisture loss.
Overall, H1 is supported: climate stress influences land systems through water availability, atmospheric demand, and thermal pressure. Divergence across global studies arises because production functions differ geographically. Where energy limits production, temperature dominates; where water limits production, hydrology dominates. The Saudi agricultural system clearly belongs to the latter category.

5.2. AI-Enabled Monitoring and Smart Irrigation Effects (H2)

The findings show that AI adoption improves cultivated land performance across all indicators, particularly water-use efficiency and crop water productivity, supporting H2. This mechanism is consistent with Gupta and Kumar Pal [34], who demonstrate that AI optimizes irrigation decisions, and Abiri et al. [36], who show that digital agriculture enhances resource allocation. Wang et al. [33] further explain that AI-assisted sensing enables real-time environmental monitoring, while Demissie et al. [39] find improved yield prediction through machine learning integration with remote sensing.
The stronger impact on water-related indicators reveals the core mechanism: AI does not primarily increase input use but reallocates water more efficiently. This aligns with Safdar et al. [37], who describe climate-smart agriculture as efficiency-driven rather than input-intensive. Hadeed et al. [20] similarly shows that combining geospatial monitoring with management indicators improves sustainability performance. Comparable efficiency improvements in resource management are documented by Hamdouni [38], who finds that digital technologies enhance environmental performance primarily through operational optimization rather than scale expansion.
However, prior research sometimes reports weaker technology impacts. Many studies analyze pilot projects or short-term trials where learning effects are incomplete. As Mmbando [49] notes, predictive analytics benefits accumulate after calibration and user adaptation. The long multi-year regional panel used here captures institutional diffusion and behavioral adjustment, explaining why effects strengthen over time. This dynamic learning pattern is also consistent with Hamdouni [13], who reports gradual productivity gains following digital irrigation adoption in Saudi agricultural systems. In Saudi Arabia, irrigation dominates agricultural costs; therefore, efficiency gains immediately translate into measurable improvements, producing stronger observed effects than in rain-fed systems.
Thus, convergence occurs with digital agriculture literature demonstrating efficiency improvements, while divergence from weaker findings arises from differences in adoption maturity, scale, and water dependence.

5.3. AI as an Adaptation Technology: Mitigation of Climate Impacts (H3)

The combined evidence indicates that AI adoption mitigates climate damage, supporting H3. Monitoring systems detect stress early, predictive tools anticipate irrigation needs, and optimization reduces water loss. This mechanism matches Wang and Wang [31], who show AI improves vulnerability assessment, and Rahman et al. [18], who emphasize adaptive capacity as the key determinant of resilience. Lin et al. [46] further demonstrate that technological advancement increases green utilization efficiency of cultivated land.
In Saudi Arabia, adaptation benefits are particularly large because traditional adaptation options—rainfall diversification or land expansion—are limited. El-Rawy et al. [50] project rising irrigation demand under warming scenarios, implying efficiency improvements directly offset climate pressure. Therefore, AI weakens the link between climatic exposure and productivity decline. This mitigation channel is also consistent with Hamdouni [38], which shows that digital transformation strengthens resilience by reducing environmental sensitivity rather than only raising output levels.
Some global studies fail to find mitigation effects because technology increases productivity without altering climate sensitivity. In contrast, when water is the binding constraint, optimization directly reduces damage rather than only increasing output. Hence divergence reflects structural differences between input-limited and efficiency-limited agricultural systems.
The results support a unified framework. Climate exposure determines potential damage, while technological capability determines realized damage, consistent with the vulnerability–adaptive capacity framework described by Mohapatra et al. [17] and Safdar et al. [37]. Climate variables establish risk conditions, but AI converts environmental information into adaptive management decisions as shown by Abiri et al. [36] and Gupta and Kumar Pal [34]. Monitoring generates data, algorithms generate recommendations, and irrigation adjustments implement adaptation, aligning with AI-enabled sensing and predictive management mechanisms documented by Wang et al. [33] and Demissie et al. [39].
This integrated interpretation extends previous literature that examined climate impacts (Zhang and Cai [1]; Chen et al. [22]) separately from digital agriculture effects (Gupta and Kumar Pal [34]; Abiri et al. [36]). By combining both, the study demonstrates that technology does not replace environmental constraints but reshapes them into manageable variability.

5.4. Policy Implications for Saudi Vision 2030 and Sustainable Cultivated Land Governance

The empirical findings indicate that water-efficiency channels dominate both climate damages and technological benefits in the Saudi agricultural system. This suggests that adaptation in hyper-arid environments operates primarily through resource optimization rather than land expansion. Consistent with the adaptive-capacity framework of Mohapatra et al. [17] and the climate-smart agriculture perspective of Safdar et al. [37], technological capability determines how strongly climatic exposure translates into productivity loss. Because Saudi agriculture faces structural water scarcity rather than land scarcity, policies that enhance irrigation precision and monitoring generate larger marginal benefits than policies expanding cultivated area. Accordingly, the results translate into the following policy priorities aligned with Saudi Vision 2030 (food security, water-use efficiency, climate adaptation, and digital transformation):
-
Prioritize AI investments where water-efficiency returns are highest: Because AI impacts are strongest on WUE, CWP, and NDWI, policies should prioritize scaling AI-enabled irrigation scheduling, leakage detection, and monitoring tools in high-water-demand crops and regions with the largest evapotranspiration burdens.
-
Integrate climate monitoring with AI decision support at the regional level: The significant climate coefficients suggest that adaptation benefits will be maximized when AI platforms incorporate high-resolution climate information (soil moisture, drought severity, heat stress, wind). Regional dashboards linking MERRA-2–type climate indicators to irrigation decisions can institutionalize proactive management.
-
Shift from adoption targets to intensity/quality targets: The stronger AI_Index effects imply that “depth of integration” matters more than binary adoption. Policy design should move beyond adoption counts toward performance benchmarks (e.g., percent area covered by smart irrigation, frequency of AI-driven irrigation adjustments, water saved per hectare).
-
Complement AI expansion with irrigation infrastructure and governance: Irrigation intensity remains consistently positive, indicating that AI benefits are amplified when basic irrigation capacity exists. Investment in infrastructure maintenance, metering, and governance mechanisms can strengthen the returns to digital technologies.
-
Target heat-stress adaptation as a parallel priority: Because T 2 M W E T is consistently negative, adaptation strategies should not rely on water-efficiency alone. Heat-resilient cropping calendars, shade/greenhouse technologies where feasible, and microclimate management should complement AI-driven irrigation.

6. Conclusions

This study investigates how climate stress and AI-enabled agricultural technologies jointly influence cultivated-land performance in Saudi Arabia over the period 2010–2024 using a regional multi-crop panel and complementary causal estimators. The empirical results provide consistent evidence that climate conditions constitute the primary structural constraint on agricultural outcomes in arid environments. Water-availability indicators improve vegetation and productivity, whereas heat and wind reduce performance, confirming that agricultural systems in water-scarce regions are governed mainly by hydrological limitations rather than energy availability.
Beyond environmental constraints, the findings demonstrate that AI-enabled monitoring and smart irrigation significantly enhance cultivated-land outcomes. The strongest improvements occur in water-use efficiency and crop water productivity, indicating that digital technologies operate primarily through water reallocation and loss reduction rather than increased input use. Causal analyses further show persistent post-adoption gains with no pre-trend differences, implying that AI adoption mitigates climate damage and represents a structural improvement in land management. Overall, the evidence suggests a clear mechanism: climate exposure determines potential damage, while technological capability determines realized damage.
The study contributes to the cultivated-land sustainability and digital agriculture literature by providing one of the first dynamic, multi-crop empirical assessments of cultivated-land outcomes under climate stress in Saudi Arabia. It integrates remote-sensing indicators of land quality and productivity with climate variables and AI-enabled monitoring measures within a unified econometric framework and strengthens causal interpretation by combining System GMM with difference-in-differences and event-study approaches. The results also demonstrate that digital monitoring improves vegetation conditions, water sustainability, and realized output, highlighting the central role of digital water management in arid agriculture.
These findings carry direct implications for Saudi Vision 2030 priorities related to food security, water-use efficiency, climate adaptation, and digital transformation. Policies should prioritize scaling AI-enabled irrigation in regions with the highest water returns, shift from simple adoption targets toward measurable performance benchmarks, and integrate climate monitoring into digital decision systems. At the same time, digital tools should be complemented by irrigation infrastructure and governance improvements, while heat-stress adaptation strategies remain necessary alongside water-efficiency measures.
Some limitations remain. Regional adoption indicators may not capture farm-level heterogeneity, and the analysis focuses on major crops with consistent data availability. Future research could employ farm-level datasets, expand to additional agricultural activities, and link AI adoption to groundwater depletion trajectories. Overall, the evidence indicates that AI-enabled monitoring and smart irrigation strengthen cultivated-land resilience by improving productivity and, most importantly, the efficiency of scarce water resources, supporting digital transformation as a practical pathway for sustainable land governance in arid economies.

Funding

This work was supported and funded by the Deanship of Scientific Research at Imam Mohammad Ibn Saud Islamic University (IMSIU) (Grant Number: IMSIU-DDRSP2602).

Data Availability Statement

The datasets presented in this article are not readily available because the data are part of an ongoing study. Requests to access the datasets should be directed to the corresponding author.

Conflicts of Interest

The author declares no conflicts of interest.

References

  1. Zhang, X.; Cai, X. Climate change impacts on global agricultural land availability. Environ. Res. Lett. 2011, 6, 014014. [Google Scholar] [CrossRef] [Scilit]
  2. Hatfield, J.L.; Dold, C. Climate variability effects on agricultural land use and soil services. In Soil Health and Intensification of Agroecosystems; Academic Press: Cambridge, MA, USA, 2017; pp. 25–50. [Google Scholar] [CrossRef] [Scilit]
  3. Yang, Y.; Tilman, D.; Jin, Z.; Smith, P.; Barrett, C.B.; Zhu, Y.-G.; Burney, J.; D’Odorico, P.; Fantke, P.; Fargione, J.; et al. Climate change exacerbates the environmental impacts of agriculture. Science 2024, 385, eadn3747. [Google Scholar] [CrossRef] [Scilit]
  4. Amin, H.; Ahsan, M.; Niaz, A.; Gul, R.; Nawaz, S.; Shah, S.; Ali, S.; Ahmad, F.; Munir, A.; Ahmad, H. Climate change impacts on soil properties and agricultural productivity. Biol. Clin. Sci. Res. J. 2023, 2023, 618. [Google Scholar] [CrossRef] [Scilit]
  5. Anjum, S.; Mustaq, Z.; Sarwar, M.; Anees, M.; Abbas, T.; Maqsood, S.; Ashraf, M.I.; Abbas, M.T.; Talha, M. Climate change and its impact on agriculture. J. Agric. Biol. 2024, 2, 199–218. [Google Scholar] [CrossRef] [Scilit]
  6. Vijai, C.; Wisetsri, W.; Elayaraja, M. Climate change and its impact on agriculture. Int. J. Agric. Sci. Vet. Med. 2023, 11, 1–8. [Google Scholar] [CrossRef] [Scilit]
  7. John, M.; Pannell, D.; Kingwell, R. Climate change and the economics of farm management. Can. J. Agric. Econ. 2005, 53, 443–459. [Google Scholar] [CrossRef] [Scilit]
  8. FAO. The State of the World’s Land and Water Resources for Food and Agriculture 2025—The Potential to Produce More and Better; Food and Agriculture Organization of the United Nations: Rome, Italy, 2025. [Google Scholar] [CrossRef] [Scilit]
  9. FAO. AQUASTAT Country Profile—Saudi Arabia; Food and Agriculture Organization of the United Nations: Rome, Italy, 2021; Available online: https://www.fao.org/aquastat/en/countries-and-basins/country-profiles/country/SAU (accessed on 26 February 2026).
  10. World Bank. Climate Risk Country Profile: Saudi Arabia. World Bank Group. 2020. Available online: https://climateknowledgeportal.worldbank.org/country/saudi-arabia (accessed on 26 February 2026).
  11. NASAGMAO MERRA-2 Reanalysis. Available online: https://gmao.gsfc.nasa.gov/reanalysis/MERRA-2/ (accessed on 26 February 2026).
  12. MEWA. Statistical Yearbook; Ministry of Environment, Water and Agriculture, Saudi Arabia: Riyadh, Saudi Arabia, 2022. Available online: https://www.mewa.gov.sa (accessed on 26 February 2026).
  13. Hamdouni, A. Artificial Intelligence-Driven Integrated Water Management and Agricultural Sustainability: Evidence from Saudi Arabia. Resources 2026, 15, 38. [Google Scholar] [CrossRef] [Scilit]
  14. FAO AQUASTAT Database. Available online: https://www.fao.org/aquastat/ (accessed on 26 February 2026).
  15. UN-Water. World Water Development Report 2022: Groundwater—Making the Invisible Visible; U.N.E.S.C.O.: Paris, France, 2022; Available online: https://unesdoc.unesco.org/ark:/48223/pf0000380721 (accessed on 26 February 2026).
  16. IPCC. Climate Change 2022: Impacts, Adaptation and Vulnerability. Intergovernmental Panel on Climate Change; Cambridge University Press: Cambridge, UK, 2023. [Google Scholar] [CrossRef] [Scilit]
  17. Mohapatra, S.; Mohapatra, S.; Han, H.; Ariza-Montes, A.; López-Martín, M.C. Climate change and vulnerability of agribusiness. Front. Psychol. 2022, 13, 955622. [Google Scholar] [CrossRef] [Scilit] [PubMed]
  18. Rahman, M.M.; Akter, R.; Abdul Bari, J.B.; Hasan, M.A.; Rahman, M.S.; Abu Shoaib, S.; Shatnawi, Z.N.; Alshayeb, A.F.; Shalabi, F.I.; Rahman, A.; et al. Analysis of Climate Change Impacts on the Food System Security of Saudi Arabia. Sustainability 2022, 14, 14482. [Google Scholar] [CrossRef] [Scilit]
  19. Hamdouni, A. AI, sustainability and value creation: Empirical insights from Saudi banks (2015–2024). Int. J. Financ. Stud. 2025, 13, 202. [Google Scholar] [CrossRef] [Scilit]
  20. Hadeed, M.Z.; Ali, A.; Malik, A.; Raza, A.; Shoaib, M. Harnessing AI and GIS Technologies for Climate-Resilient Agriculture and Environmental Sustainability; IGI Global: Hershey, PA, USA, 2024. [Google Scholar] [CrossRef] [Scilit]
  21. Reddy, P.P. Impacts of climate change on agriculture. In Climate Resilient Agriculture for Ensuring Food Security; Springer: Pune, India, 2015; pp. 43–90. [Google Scholar] [CrossRef] [Scilit]
  22. Chen, Y.; Zhang, Z.; Tao, F. Impacts of climate change and climate extremes on major crop productivity in China at 1.5 and 2.0 °C global warming. Earth Syst. Dyn. 2018, 9, 543–562. [Google Scholar] [CrossRef] [Scilit]
  23. Malhi, G.S.; Kaur, M.; Kaushik, P. Impact of climate change on agriculture and its mitigation strategies: A review. Sustainability 2021, 13, 1318. [Google Scholar] [CrossRef] [Scilit]
  24. Mu, J.E.; Sleeter, B.M.; Abatzoglou, J.T.; Antle, J.M. Climate impacts on agricultural land use in the USA: The role of socio-economic scenarios. Clim. Change 2017, 144, 329–345. [Google Scholar] [CrossRef] [Scilit]
  25. Britto, S.; Bijale, M.; Prashant. Impact of climate variability on agricultural land use: Case studies from vulnerable regions. J. Appl. Bioanal. 2024, 10, 125–133. [Google Scholar] [CrossRef] [Scilit]
  26. Hamdouni, A. From ESG to financial stability: Unpacking the multidimensional impact of AI-driven FinTech-related technology adoption on bank performance. Int. J. Financ. Stud. 2025, 13, 234. [Google Scholar] [CrossRef] [Scilit]
  27. Duan, D.; Sun, X.; Liang, S.; Sun, J.; Fan, L.; Chen, H.; Xia, L.; Zhao, F.; Yang, W.; Yang, P. Spatiotemporal patterns of cultivated land quality integrated with multi-source remote sensing: A case study of Guangzhou, China. Remote Sens. 2022, 14, 1250. [Google Scholar] [CrossRef] [Scilit]
  28. Kingra, P.K.; Majumder, D.; Singh, S.P. Application of remote sensing and GIS in agriculture and natural resource management under changing climatic conditions. Agric. Res. J. 2016, 53, 295–302. [Google Scholar] [CrossRef] [Scilit]
  29. Swami, P.; Anusha, M.; David, K.M.; Saivamsireddy, G.; Upadhyay, L.; Panigrahi, C.K. Innovations in remote sensing techniques for monitoring agricultural crops and environmental stress conditions: A review. J. Sci. Res. Rep. 2025, 31, 178–194. [Google Scholar] [CrossRef] [Scilit]
  30. Duan, D.; Li, X.; Liu, Y.; Meng, Q.; Li, C.; Lin, G.; Guo, L.; Guo, P.; Tang, T.; Su, H.; et al. County-level cultivated land quality evaluation using multi-temporal remote sensing and machine learning models. Remote Sens. 2024, 16, 3427. [Google Scholar] [CrossRef] [Scilit]
  31. Wang, W.; Wang, Y. Research on image capture technology of intelligent terminals and multi-exposure fusion to improve agricultural production system resilience. J. Commer. Biotechnol. 2022, 27, 46–56. [Google Scholar] [CrossRef] [Scilit]
  32. Gu, Z.; Zeng, M. The use of artificial intelligence and satellite remote sensing in land cover change detection: Review and perspectives. Sustainability 2024, 16, 274. [Google Scholar] [CrossRef] [Scilit]
  33. Wang, S.; Guan, K.; Olesen, J.E.; Zhou, R.; Lu, Z.; Lin, Z.; Feng, S.; Gislum, R.; Treat, C.; Butterbach-Bahl, K. Cross-scale sensing of field-level essential agroecosystem variables for climate-smart agriculture. In Proceedings of the EGU General Assembly, Vienna, Austria, 27 April–2 May 2025. [Google Scholar] [CrossRef] [Scilit]
  34. Gupta, G.; Kumar Pal, S. Applications of AI in precision agriculture. Discov. Agric. 2025, 3, 61. [Google Scholar] [CrossRef] [Scilit]
  35. Sunarko. Satellite-guided decision support systems for sustainable land management. Agric. Power, J. 2024, 1, 39–50. [Google Scholar] [CrossRef] [Scilit]
  36. Abiri, R.; Rizan, N.; Balasundram, S.K.; Shahbazi, A.B.; Abdul-Hamid, H. Application of digital technologies for ensuring agricultural productivity. Heliyon 2023, 9, e22601. [Google Scholar] [CrossRef] [Scilit] [PubMed]
  37. Safdar, M.; Shahid, M.A.; Yang, C.; Rasul, F.; Tahir, M.; Raza, A.; Sabir, R.M. Climate-Smart Agriculture and Resilience; IGI Global: Hershey, PA, USA, 2024. [Google Scholar] [CrossRef] [Scilit]
  38. Hamdouni, A. The role of artificial intelligence in enhancing ESG outcomes: Insights from Saudi Arabia. J. Risk Financ. Manag. 2025, 18, 572. [Google Scholar] [CrossRef] [Scilit]
  39. Demissie, W.A.; Sebastiani, L.; Rossetto, R. Integration of artificial intelligence and remote sensing for crop yield prediction in Mediterranean agroecosystems. Eur. J. Agron. 2026, 173, 127894. [Google Scholar] [CrossRef] [Scilit]
  40. Semeraro, T.; Scarano, A.; Leggieri, A.; Calisi, A.; De Caroli, M. Impact of climate change on agroecosystems and potential adaptation strategies. Land 2023, 12, 1117. [Google Scholar] [CrossRef] [Scilit]
  41. Kumar, N.; Yadav, H.S.; Bag, A.G. Physical consequences of climate change on agriculture. Int. J. Plant Soil Sci. 2024, 36, 213–229. [Google Scholar] [CrossRef] [Scilit]
  42. Guerriero, V.; Scorzini, A.R.; Di Lena, B.; Iulianella, S.; Di Bacco, M.; Tallini, M. Impact of climate change on crop yields. Sustainability 2023, 15, 14235. [Google Scholar] [CrossRef] [Scilit]
  43. Ding, Y.; Xu, J. Global vulnerability of agricultural commodities to climate risk. Econ. Anal. Policy 2023, 80, 669–687. [Google Scholar] [CrossRef] [Scilit]
  44. Mandal, D.; Roy, T. Climate change impact on soil erosion and land degradation. In Climate Change Impacts on Soil-Plant-Atmosphere Continuum; Springer Nature: Berlin/Heidelberg, Germany, 2024; pp. 139–161. [Google Scholar] [CrossRef] [Scilit]
  45. Fenta, A.A.; Tsunekawa, A.; Haregeweyn, N.; Tsubo, M.; Yasuda, H.; Shimizu, K.; Kawai, T.; Ebabu, K.; Berihun, M.L.; Sultan, D.; et al. Cropland expansion and ecosystem services in sub-Saharan Africa. Ecosyst. Serv. 2020, 45, 101154. [Google Scholar] [CrossRef] [Scilit]
  46. Lin, Q.; Bai, S.; Qi, R. Cultivated land green use efficiency. Sustainability 2024, 16, 29. [Google Scholar] [CrossRef] [Scilit]
  47. Kshatriya, T.T.; Vendan, T.R. Remote sensing-based assessment of soil degradation under climate change. Int. J. Environ. Clim. Change 2025, 15, 1–8. [Google Scholar] [CrossRef] [Scilit]
  48. Gafsi, N.; Hamdouni, A.; Smaoui, A. Digital Technologies and Sustainable Development: Evidence from FinTech, AI, and Blockchain Adoption in G20 Economies. Sustainability 2026, 18, 2484. [Google Scholar] [CrossRef] [Scilit]
  49. Mmbando, G.S. Harnessing artificial intelligence and remote sensing in climate-smart agriculture. Cogent Food Agric. 2025, 11, 2454354. [Google Scholar] [CrossRef] [Scilit]
  50. El-Rawy, M.; Fathi, H.; Zijl, W.; Alshehri, F.; Almadani, S.; Zaidi, F.K.; Aldawsri, M.; Gabr, M.E. Potential Effects of Climate Change on Agricultural Water Resources in Riyadh Region, Saudi Arabia. Sustainability 2023, 15, 9513. [Google Scholar] [CrossRef] [Scilit]
  51. Hamdouni, A. Sustainability disclosure and its impact on firm’s value creation for energy, materials and healthcare industries. Sci. Cult. 2026, 12, 2079–2090. [Google Scholar] [CrossRef]
  52. Hamdouni, A. Value creation through environmental, social, and governance disclosures. J. Risk Financ. Manag. 2025, 18, 415. [Google Scholar] [CrossRef] [Scilit]
  53. Duan, C. Impacts of climate change on sustainable agricultural development. E3S Web Conf. 2024, 553, 03006. [Google Scholar] [CrossRef] [Scilit]
  54. Chowdhury, S.; Al-Zahrani, M.; Abbas, A. Implications of Climate Change on Crop Water Requirements in Arid Region: An Example of Al-Jouf, Saudi Arabia. J. King Saud Univ.-Eng. Sci. 2016, 28, 21–31. [Google Scholar] [CrossRef] [Scilit]
  55. Jolánkai, M.; Birkás, M.; Tarnawa, Á.; Kassai, K.M. Agriculture and Climate Change; Springer: Cham, Switzerland, 2019; pp. 65–71. [Google Scholar] [CrossRef] [Scilit]
  56. Verma, S.; Singh, A.; Pradhan, S.S.; Kushuwaha, M. Impact of Climate Change on Agriculture: A Review. Int. J. Enviornment Clim. Change 2024, 4, 615–620. [Google Scholar] [CrossRef] [Scilit]
  57. Duan, D.; Sun, X.; Wang, C.; Zha, Y.; Yu, Q.; Yang, P. Remote sensing approach to estimating cropland sustainability. Remote Sens. 2024, 16, 1069. [Google Scholar] [CrossRef] [Scilit]
Figure 1. Overview of Empirical Methodology.
Resources 15 00044 g001
Figure 2. Event-study estimates of AI adoption effects (multi-outcome).
Resources 15 00044 g002
Table 1. Variables, Definitions, and Data Sources.
CategoryVariable NameVariableDefinition/MeasurementExpected SignData Source
DependentNDVICultivated Land QualityAverage normalized difference vegetation index over cultivated landModerate Resolution Imaging Spectroradiometer (MODIS) and Sentinel Earth Observation satellite products (Sentinel)
DependentEVICultivated Land QualityEnhanced vegetation index adjusted for soil and atmospheric effectsMODIS/Sentinel
DependentNPPLand ProductivityNet primary productivity of cultivated landMODIS
DependentWUELand SustainabilityCrop output divided by agricultural water useMinistry of Environment; FAO
DependentCWPLand SustainabilityCrop yield per unit of irrigation waterMinistry of Environment
Dependent (Robustness)NDWILand Water ConditionNormalized Difference Water Index averaged over cultivated land (captures vegetation water content/irrigation signal)MODIS/Sentinel
Dependent (Robustness)YieldCrop ProductivityCrop yield (e.g., tons/hectare) for region–crop–yearMinistry of Environment; FAO
IndependentGWETPROFClimate StressRoot-zone soil moisture+NASA MERRA-2
IndependentPREClimate StressAnnual precipitation+NASA MERRA-2
IndependentQV2MClimate StressSpecific humidity at 2 m+NASA MERRA-2
IndependentRH2MClimate StressRelative humidity at 2 m+NASA MERRA-2
IndependentT2MWETClimate StressWet-bulb temperature (heat stress)NASA MERRA-2
IndependentWS2MClimate StressWind speed at 2 mNASA MERRA-2
Independent (Robustness)SPEIDrought SeverityStandardized Precipitation–Evapotranspiration Index (drought intensity)+Global SPEI database/Author construction
IndependentAI_AdoptAI MonitoringDummy = 1 if AI-enabled monitoring/irrigation adopted+Government reports
IndependentAI_IndexAI MonitoringIntensity index of AI-based agricultural technologies+Author construction
ControlAreaCultivated AreaTotal cultivated land area (hectares)+National statistics
ControlIrrigIrrigation IntensityShare of irrigated cultivated land+Ministry of Environment
ControlCrop FECrop Fixed EffectsCrop-specific technological and biological differences
ControlRegion FERegion Fixed EffectsTime-invariant regional characteristics
ControlYear FEYear Fixed EffectsCommon temporal shocks
Note: The signs “+” and “−” indicate the expected direction of the relationship between independent variables and the dependent variable.
Table 2. Descriptive Statistics.
VariableObs.MeanStd. Dev.MinMax
NDVI11700.410.120.150.72
EVI11700.290.090.100.58
NPP (kg C/m2)1170612.4155.8310.6945.2
WUE (kg/m3)11701.870.540.623.42
CWP (kg/m3)11702.110.610.753.88
NDWI (Robustness)11700.190.08−0.030.41
Yield (t/ha, Robustness)11704.261.481.128.94
GWETPROF11700.340.090.180.56
PRE (mm/year)117094.761.312.4312.6
QV2M (kg/kg)11700.00910.00180.00540.0136
RH2M (%)117038.69.718.267.4
T2MWET (°C)117023.93.117.630.8
WS2M (m/s)11703.420.911.386.21
SPEI (Robustness)1170−0.120.94−2.612.14
AI_Adopt11700.370.4801
AI_Index11700.460.270.001.00
Area (1000 ha)117086.341.912.4201.7
Irrig (%)117071.514.834.696.8
Table 3. Pearson Correlation Matrix.
No.Variables(1)(2)(3)(4)(5)(6)(7)(8)(9)(10)(11)(12)(13)(14)
1NDVI1.00
2EVI0.74 ***1.00
3NPP0.62 ***0.58 ***1.00
4WUE0.40 ***0.37 ***0.46 ***1.00
5CWP0.43 ***0.39 ***0.48 ***0.71 ***1.00
6NDWI0.56 ***0.52 ***0.49 ***0.40 ***0.42 ***1.00
7Yield0.47 ***0.44 ***0.60 ***0.55 ***0.63 ***0.43 ***1.00
8GWETPROF0.32 ***0.30 ***0.34 ***0.28 ***0.30 ***0.34 ***0.31 ***1.00
9PRE0.29 ***0.27 ***0.29 ***0.22 ***0.24 ***0.31 ***0.26 ***0.46 ***1.00
10T2MWET−0.35 ***−0.33 ***−0.39 ***−0.30 ***−0.31 ***−0.34 ***−0.37 ***−0.25 ***−0.20 ***1.00
11WS2M−0.18 ***−0.17 ***−0.21 ***−0.14 ***−0.16 ***−0.19 ***−0.20 ***−0.12 ***−0.10 ***0.34 ***1.00
12SPEI0.33 ***0.32 ***0.35 ***0.27 ***0.28 ***0.34 ***0.32 ***0.47 ***0.52 ***−0.29 ***−0.10 ***1.00
13AI_Adopt0.26 ***0.25 ***0.30 ***0.31 ***0.33 ***0.29 ***0.34 ***0.12 ***0.10 ***−0.14 ***−0.06 **0.13 ***1.00
14AI_Index0.30 ***0.29 ***0.34 ***0.36 ***0.38 ***0.32 ***0.40 ***0.14 ***0.11 ***−0.17 ***−0.07 ***0.16 ***0.67 ***1.00
Notes: ** and *** denote significance at the 5% and 1% levels, respectively.
Table 4. Variance Inflation Factor (VIF) Results.
VariableVIF
GWETPROF2.31
PRE2.64
QV2M2.47
RH2M2.22
T2MWET3.08
WS2M1.86
SPEI (Robustness)2.79
AI_Adopt1.94
AI_Index2.51
Cultivated Area1.68
Irrigation Intensity2.14
Mean VIF2.33
Maximum VIF3.08
Table 5. Baseline Dynamic Panel Results (System GMM).
Variables(1) NDVI(2) EVI(3) NPP(4) WUE(5) CWP
L.Dependent0.612 *** (0.041)0.584 *** (0.038)0.667 *** (0.045)0.541 *** (0.052)0.569 *** (0.049)
GWETPROF0.084 *** (0.019)0.071 *** (0.017)0.112 *** (0.028)0.093 *** (0.025)0.101 *** (0.027)
PRE0.063 *** (0.021)0.052 ** (0.020)0.078 *** (0.026)0.061 ** (0.024)0.067 *** (0.025)
QV2M0.041 ** (0.019)0.036 ** (0.017)0.059 *** (0.021)0.048 ** (0.020)0.051 ** (0.021)
RH2M0.028 * (0.015)0.024 * (0.014)0.036 ** (0.018)0.031 * (0.017)0.034 * (0.018)
T2MWET−0.097 *** (0.026)−0.084 *** (0.024)−0.121 *** (0.031)−0.109 *** (0.029)−0.114 *** (0.030)
WS2M−0.043 ** (0.018)−0.039 ** (0.017)−0.056 *** (0.020)−0.048 ** (0.019)−0.051 ** (0.020)
AI_Adopt0.056 *** (0.018)0.049 *** (0.017)0.083 *** (0.023)0.091 *** (0.026)0.095 *** (0.027)
Area0.019 (0.014)0.017 (0.013)0.022 (0.018)0.024 * (0.014)0.026 * (0.015)
Irrig0.062 *** (0.020)0.057 *** (0.019)0.071 *** (0.024)0.089 *** (0.028)0.094 *** (0.029)
Region FEYesYesYesYesYes
Crop FEYesYesYesYesYes
Year FEYesYesYesYesYes
Observations11701170117011701170
Instruments3232343131
AR(1) p-value0.0000.0000.0000.0000.000
AR(2) p-value0.2840.3170.2610.2980.274
Hansen p-value0.4210.4630.3890.4470.432
Notes: Robust standard errors in parentheses. ***, **, * denote significance at the 1%, 5%, and 10% levels, respectively.
Table 6. Difference-in-Differences (DID) Results.
Variables(1) NDVI(2) EVI(3) NPP(4) WUE(5) CWP
AI × Post0.041 *** (0.012)0.036 *** (0.011)0.067 *** (0.019)0.083 *** (0.024)0.088 *** (0.025)
GWETPROF0.052 *** (0.016)0.046 *** (0.015)0.071 *** (0.022)0.064 *** (0.020)0.069 *** (0.021)
PRE0.039 ** (0.017)0.033 ** (0.016)0.051 *** (0.018)0.044 ** (0.019)0.048 ** (0.020)
T2MWET−0.074 *** (0.021)−0.068 *** (0.020)−0.091 *** (0.027)−0.087 *** (0.026)−0.092 *** (0.027)
WS2M−0.031 ** (0.015)−0.028 * (0.015)−0.043 ** (0.018)−0.039 ** (0.017)−0.041 ** (0.018)
Area0.012 (0.010)0.011 (0.010)0.016 (0.014)0.019 * (0.011)0.021 * (0.012)
Irrig0.048 *** (0.016)0.044 *** (0.015)0.057 *** (0.019)0.072 *** (0.023)0.076 *** (0.024)
Region FEYesYesYesYesYes
Crop FEYesYesYesYesYes
Year FEYesYesYesYesYes
Observations11701170117011701170
R2 (within)0.480.460.520.490.51
Notes: Robust standard errors clustered at the regional level are reported in parentheses. ***, **, * denote significance at the 1%, 5%, and 10% levels, respectively.
Table 7. Alternative Cultivated Land Outcome Measures.
Variables(1) NDWI(2) Yield
L.Dependent0.576 *** (0.044)0.621 *** (0.047)
GWETPROF0.091 *** (0.023)0.108 *** (0.029)
PRE0.069 *** (0.024)0.083 *** (0.027)
QV2M0.038 ** (0.018)0.047 ** (0.021)
RH2M0.026 * (0.014)0.031 * (0.016)
T2MWET−0.113 *** (0.031)−0.128 *** (0.034)
WS2M−0.049 ** (0.020)−0.058 *** (0.022)
AI_Adopt0.087 *** (0.026)0.094 *** (0.028)
Cultivated Area0.021 (0.015)0.026 * (0.016)
Irrigation Intensity0.082 *** (0.027)0.089 *** (0.029)
Region FEYesYes
Crop FEYesYes
Year FEYesYes
Observations11701170
Instruments3031
AR(2) p-value0.3010.276
Hansen p-value0.4370.412
Notes: Robust standard errors in parentheses. ***, **, * denote significance at the 1%, 5%, and 10% levels, respectively.
Table 8. Alternative Climate and AI Specifications.
Variables(1) NDVI(2) EVI(3) NPP(4) WUE(5) CWP(6) NDWI(7) Yield
L.Dependent0.598 *** (0.042)0.571 *** (0.039)0.651 *** (0.046)0.529 *** (0.051)0.553 *** (0.048)0.563 *** (0.045)0.619 *** (0.049)
SPEI0.072 *** (0.018)0.066 *** (0.017)0.089 *** (0.024)0.076 *** (0.022)0.081 *** (0.023)0.074 *** (0.020)0.092 *** (0.026)
AI_Index0.061 *** (0.017)0.056 *** (0.016)0.084 *** (0.023)0.097 *** (0.026)0.101 *** (0.027)0.088 *** (0.024)0.096 *** (0.028)
Area0.018 (0.013)0.016 (0.012)0.021 (0.017)0.023 * (0.014)0.025 * (0.015)0.020 (0.014)0.027 * (0.016)
Irrig0.064 *** (0.021)0.059 *** (0.020)0.069 *** (0.025)0.091 *** (0.028)0.095 *** (0.029)0.083 *** (0.026)0.089 *** (0.030)
Region FEYesYesYesYesYesYesYes
Crop FEYesYesYesYesYesYesYes
Year FEYesYesYesYesYesYesYes
Observations1170117011701170117011701170
Instruments29293130302931
AR(2) p-value0.3120.3250.2840.2970.2890.3010.271
Hansen p-value0.4590.4720.4260.4410.4330.4470.418
Notes: Robust standard errors in parentheses. *** and * denote significance at the 1% and 10% levels, respectively.
Disclaimer/Publisher’s Note: The statements, opinions and data contained in all publications are solely those of the individual author(s) and contributor(s) and not of MDPI and/or the editor(s). MDPI and/or the editor(s) disclaim responsibility for any injury to people or property resulting from any ideas, methods, instructions or products referred to in the content.