Article

The Nexus Between Natural Resources, Renewable Energy and Economic Growth in the Gulf Cooperation Council Countries

by
Jamal Alnsour
1,* and
Farah Mohammad AlNsour
2
1
Department of Logistics Sciences, Business School, German Jordanian University, Amman 11180, Jordan
2
Department of Banking and Financial Sciences, The Faculty of Business, Jerash University, Jerash 26150, Jordan
*
Author to whom correspondence should be addressed.
Resources 2025, 14(8), 124; https://doi.org/10.3390/resources14080124
Submission received: 8 June 2025 / Revised: 18 July 2025 / Accepted: 25 July 2025 / Published: 30 July 2025

Abstract

In sustainable development studies, a key question is how the abundance of natural resources influences long-run economic growth. However, there is no consensus on this issue. Some literature suggests a negative impact, while other studies find no effect at all, and other research indicates a positive impact. This study aims to examine the relationship between natural resource rents, renewable energy, and economic growth in the Gulf Cooperation Council (GCC) countries over the period from 1990 to 2023. The study utilizes the Method of Moments Quantile Regression (MMQR) to provide reliable findings across different quantiles. We also incorporate a series of control variables, including capital, labor force participation, non-renewable energy, and trade openness. The findings indicate that natural resources rent enhances economic growth in GCC countries, supporting the Rostow hypothesis. Although renewable energy has a positive impact on economic growth, it does not have an effect on natural resource rents. Additionally, capital, labor force participation, non-renewable energy, and trade openness play a critical role in raising economic growth in these countries. Based on the empirical results, this study provides several valuable recommendations for policymakers to enhance the management of natural resources in GCC countries.

1. Introduction

Since the time of classical economists, it has been recognized that countries with abundant natural resources are more likely to achieve socioeconomic progress and thus have a powerful instrument over the other countries. From this viewpoint, countries endowed with abundant natural resources are believed to have a greater potential for economic growth compared to those with limited natural resources. However, this prevailing idea has faced criticism by the “Resource Curse” and “Dutch Disease” theories. These hypotheses suggest that natural resources can hinder economic growth, making them a curse for the resource-rich economies. As a result of these theories, research on natural resources and their effect on economic growth has garnered significant interest, yielding mixed results regarding the relationship between natural resources and economic growth worldwide.
Many economists, such as Nurkse [1] and Rostow [2], emphasize the positive effect of natural resources on economic growth. They contend that natural resources serve as a vital source of income, with certain resources being convertible into capital to promote economic development. For example, natural resource rents can be used to develop physical infrastructure and provide essential social services, such as education and healthcare facilities [3,4]. In this context, the Gulf Cooperation Council (GCC) countries—including Saudi Arabia, Kuwait, Oman, Qatar, the United Arab Emirates (UAE), and Bahrain—have significantly benefited from their natural wealth in driving economic development. In contrast, other economists, such as Sachs and Warner [5], Leite and Weidmann [6], Zhao et al. [7], and Destek et al. [8], demonstrate that economies rich in natural resources often experience slower growth rates, as seen in countries like Russia, Venezuela, and Nigeria. However, countries with limited natural resources, such as Switzerland, Japan, Singapore, Hong Kong, and South Korea, have achieved high economic growth rates. The literature presents contradictory findings; therefore, a question arises regarding the acceptable influence of natural resources on economic growth in studies that yield opposing results. Consequently, it may not be feasible to make a universal claim about the effects of natural resources on economic growth being positive, negative, or neutral.
The rapid depletion of natural resources primarily drives global warming due to economic growth. Since 2007, the extraction of natural resources has increased from 7 billion tons to 16 billion tons [9]. Biomass production has risen from 10 billion to 25 billion metric tons, while mineral resource extraction has nearly sextupled during the same timeframe [9]. In response to this increase and its contribution to greenhouse gas emissions and climate change, the use of renewable energy has become one of the best options to achieve environmental sustainability. However, the difficulty lies in the fact that GCC countries seek to expand and diversify their economies, raising the question of whether the use of renewable energy will improve or impede their economic growth. Several researchers have suggested that renewable energy plays a crucial role in enhancing economic growth by increasing gross domestic product (GDP) (e.g., [10,11,12,13,14]). This underscores the importance of renewable energy in production. In contrast, a body of literature shows that renewable energy does not improve economic growth (e.g., [15,16,17,18]). Different economic conditions and the availability of natural resources across various countries may contribute to these contradictory findings. In this context, the cost of renewable energy is higher than that of non-renewable energy [19,20]. On the other hand, industrial activities in GCC countries are heavily based on non-renewable energy sources and are critical because they are a key driver of economic growth. Therefore, it is imperative to determine the effect of renewable energy use on economic growth in GCC countries.
The current study significantly enhances the literature by solving this contradiction and providing valuable insights that are critical for optimizing economic sustainability. Selecting GCC economies that possess a massive wealth of natural resources as a case study can ensure reliable findings. Countries with a scarcity of natural resources may exhibit higher rents due to their limited availability, which can complicate researchers’ ability to accurately evaluate the impact of natural resource rents on economic growth. However, conducting studies in countries with limited natural resources is valuable to compare with the results of this study. This study is, therefore, significant in determining whether natural resources and renewable energy are enhancing or hindering economic growth, helping to resolve the contradiction presented in the literature. Additionally, research on this topic in GCC countries is limited. Hence, this study aims to examine the effect of natural resources and renewable energy on economic growth in GCC countries over the period from 1990 to 2023. The study also utilizes a series of control variables, such as capital, labor force, non-renewable energy, and trade openness, that affect economic growth. Understanding the dynamics that enhance natural resource rent is essential for providing valuable insights to the widely believed notion that natural resources impede economic growth in developing countries. To this end, this research employs the Method of Moments Quantile Regression (MMQR) with fixed effects, which shows heterogeneous findings across different quantiles [21]. To the best of our knowledge, no prior research has assessed the impact that natural resources have had on economic growth in recent decades utilizing the most updated data and the MMQR.

2. Literature Review

2.1. Nexus Between Natural Resources and Economic Growth

There is no consensus among economists and researchers regarding the effect of natural resources on economic growth. Many economists argue that natural resources are a crucial factor in promoting economic growth [1,2]. Nevertheless, a substantial body of literature shows that an abundance of natural resources does not ensure economic growth [5,22]. No consensus is also supported by Havranek et al. [23], who reviewed 43 empirical studies and reported that 20% of the studies have found a positive effect of natural resources on economic growth, while 40% confirmed the negative effect, and 40% showed no effect.
The link between natural resources and economic growth is complex [24]. Kangning and Jian [25] argue that abundant natural resources can impede economic growth. Several researchers have supported the negative nexus between natural resources and economic growth [26,27]. A recent study by Singh et al. [28] demonstrated that natural resources reduce economic growth in the P5+1 economies, including the United Kingdom, the US, Germany, Russia, France, and China. Zhang and Khan [29] observed that natural resources negatively impact the economies of OECD countries, confirming that these resources lower economic growth in these countries. Similar findings were reported by Aslan and Altinoz [26] regarding the economic situation in Africa. In addition, Sha [30] and Khan et al. [31] indicated that natural resource rent negatively impacts economic growth in the G7 countries. Before the late 1980s, natural resources were mainly viewed as advantageous; however, the rise of theories, such as the resource curse and Dutch disease, has led to a contradictory perspective [27]. Furthermore, the lack of natural resources also adversely affects the economy [32]. Collectively, these studies support the curse theory.
A body of research has indicated the positive effect of natural resources on economic growth. Aslan and Altinoz [26] observed that natural resources positively affect economic growth in Europe, America, and Asia. Asiedu [33] found a positive relationship between economic growth and natural resources in the economies of West Africa. Ahmad et al. [34] argue that developing countries often maximize the utilization of natural resources to enhance their economic performance. In the pursuit of socioeconomic development, a substantial amount of natural resources is consumed [35]. In the same vein, when the use of natural resources leads to favorable economic growth, it is referred to as a resource blessing. Conversely, if there is an inverse relationship between growth and resources, this phenomenon is known as the resource curse [36]. Further, Aljarallah [37] found that natural resource rents increase GDP and total factor productivity in the long run in Saudi Arabia, emphasizing that natural resources are considered a blessing for the country. According to a study by Erdoğan et al. [38] involving eleven countries, an increase in oil exports can result in a rise in economic production. Similarly, Adabor et al. [36] reported that an increase in oil resource rent leads to a rise in long-term economic growth in Ghana. Given the lack of research on the link between natural resources and economic growth in GCC economies, we suggest the following hypothesis to address this gap:
H1. 
Natural resources significantly increase economic growth in GCC economies.
Table 1 summarizes recent studies on the relationship between natural resources and economic growth.

2.2. Nexus Between Renewable Energy and Economic Growth

The literature has widely assessed the relationship between renewable energy and economic growth over the last two decades (e.g., [55,56,57,58,59,60]). In line with broader research on energy use and economic growth, many studies have examined the causal relationship between the two. The literature proposes four hypotheses regarding the renewable energy–growth nexus. The first hypothesis, known as the growth hypothesis, posits a unidirectional causal impact of renewable energy use on economic growth. The second hypothesis, referred to as the “conservative hypothesis,” suggests a one-way relationship between economic growth and renewable energy consumption, indicating that economic growth drives energy consumption. The third hypothesis, termed the feedback hypothesis, illustrates a bidirectional causal relationship between renewable energy use and economic growth. Finally, the neutrality hypothesis asserts that there is no causal relationship between renewable energy use and economic growth.
The empirical findings from previous studies confirm all four hypotheses. Inglesi-Lotz [14] indicated that the use of renewable energy is a key driver of GDP growth. Kadir et al. [10] demonstrated that renewable energy contributes to the economic growth of emerging economies. Zafar et al. [12] found that both non-renewable and renewable energy consumption enhance economic growth in the Asia-Pacific Economic Cooperation (APEC) countries. Gozgor et al. [13] assessed the effects of renewable and non-renewable energy in 29 OECD countries from 1990 to 2013 and found that renewable energy consumption promotes economic growth. Deka et al. [11] showed that renewable energy is crucial for raising GDP growth across EU countries. All of these studies validate the growth hypothesis. In light of the empirical evidence reviewed to date, it is evident that renewable energy plays a significant role in promoting a country’s economic growth.
Other researchers have confirmed the feedback hypothesis. Keshavarzian and Tabatabaienasab [61] illustrated that the United Arab Emirates (UAE) and Saudi Arabia exhibit a significant bidirectional relationship between renewable energy use and economic growth. This result indicates that the economic growth of Saudi Arabia and the UAE incentivizes the renewable energy sector, thereby contributing to sustainable development. Lin and Moubarak [62] identified a long-run bidirectional relationship between renewable energy use and economic growth in China. The bidirectional relationship between renewable energy use and economic growth is also highlighted in the study by Gyimah et al. [63], which confirms that renewable energy and GDP growth have a strong feedback impact. Another study by Rafindadi and Ozturk [64] demonstrated a feedback relationship between economic growth and renewable energy usage in Germany over the 1971–2013 period. These conclusions are further supported by several authors, such as Mukhtarov et al. [65] and Akpanke et al. [66]. Therefore, renewable energy and economic growth mutually influence each other.
Other researchers have confirmed the feedback hypothesis. Keshavarzian and Tabatabaienasab [61] illustrated that the United Arab Emirates (UAE) and Saudi Arabia exhibit a significant bidirectional relationship between renewable energy use and economic growth. This result indicates that the economic growth of Saudi Arabia and the UAE incentivizes the renewable energy sector, thereby contributing to sustainable development. Lin and Moubarak [62] identified a long-run bidirectional relationship between renewable energy use and economic growth in China. The bidirectional relationship between renewable energy use and economic growth is also highlighted in the study by Gyimah et al. [63], which confirms that renewable energy and GDP growth have a strong feedback impact. Another study by Rafindadi and Ozturk [64] demonstrated a feedback relationship between economic growth and renewable energy usage in Germany over the 1971–2013 period. Further, these conclusions are supported by several authors, such as Mukhtarov et al. [65] and Akpanke et al. [66]. Therefore, there is a mutual influence between renewable energy and economic growth.
Furthermore, some researchers, such as Khan et al. [15], conclude that renewable energy hinders economic growth. Although there is empirical evidence in the literature that contradicts the notion of renewable energy as a catalyst for national growth, the number of studies presenting these opposing views is quite limited. Furthermore, some researchers, such as Khan et al. [15], conclude that renewable energy hinders economic growth. Although there is empirical evidence in the literature that contradicts the notion of renewable energy as a catalyst for national growth, the number of studies presenting these opposing views is quite limited. Numerous studies have examined the effect of renewable energy on economic growth across various countries, yet there is limited research focusing specifically on GCC countries. To address this gap, we propose the following hypothesis:
H2. 
Renewable energy significantly optimizes economic growth in GCC countries.

2.3. Summarizing Gaps in the Literature

Reviewing the literature reveals a lack of research in this area within the GCC countries. These countries possess some of the world’s most significant natural resources and are all classified as high-income countries. Therefore, this study contributes to the existing literature by exploring the relationship between natural resources and economic growth in a novel context, providing valuable empirical findings that facilitate comparative studies among various world regions. Additionally, the aforementioned literature depicted an unresolved connection between renewable energy and economic growth, making it difficult to develop cohesive policy measures aimed at boosting economic growth. Moreover, existing literature does not thoroughly address the various factors that influence the relationship between renewable energy and economic growth, including capital, non-renewable energy, labor force, and trade openness, especially in the context of GCC countries. Our study incorporates all of these control variables. Therefore, this research represents a sincere effort to fill the existing gaps in the literature, with the aim of providing valuable policy recommendations for both economic growth and environmental quality.

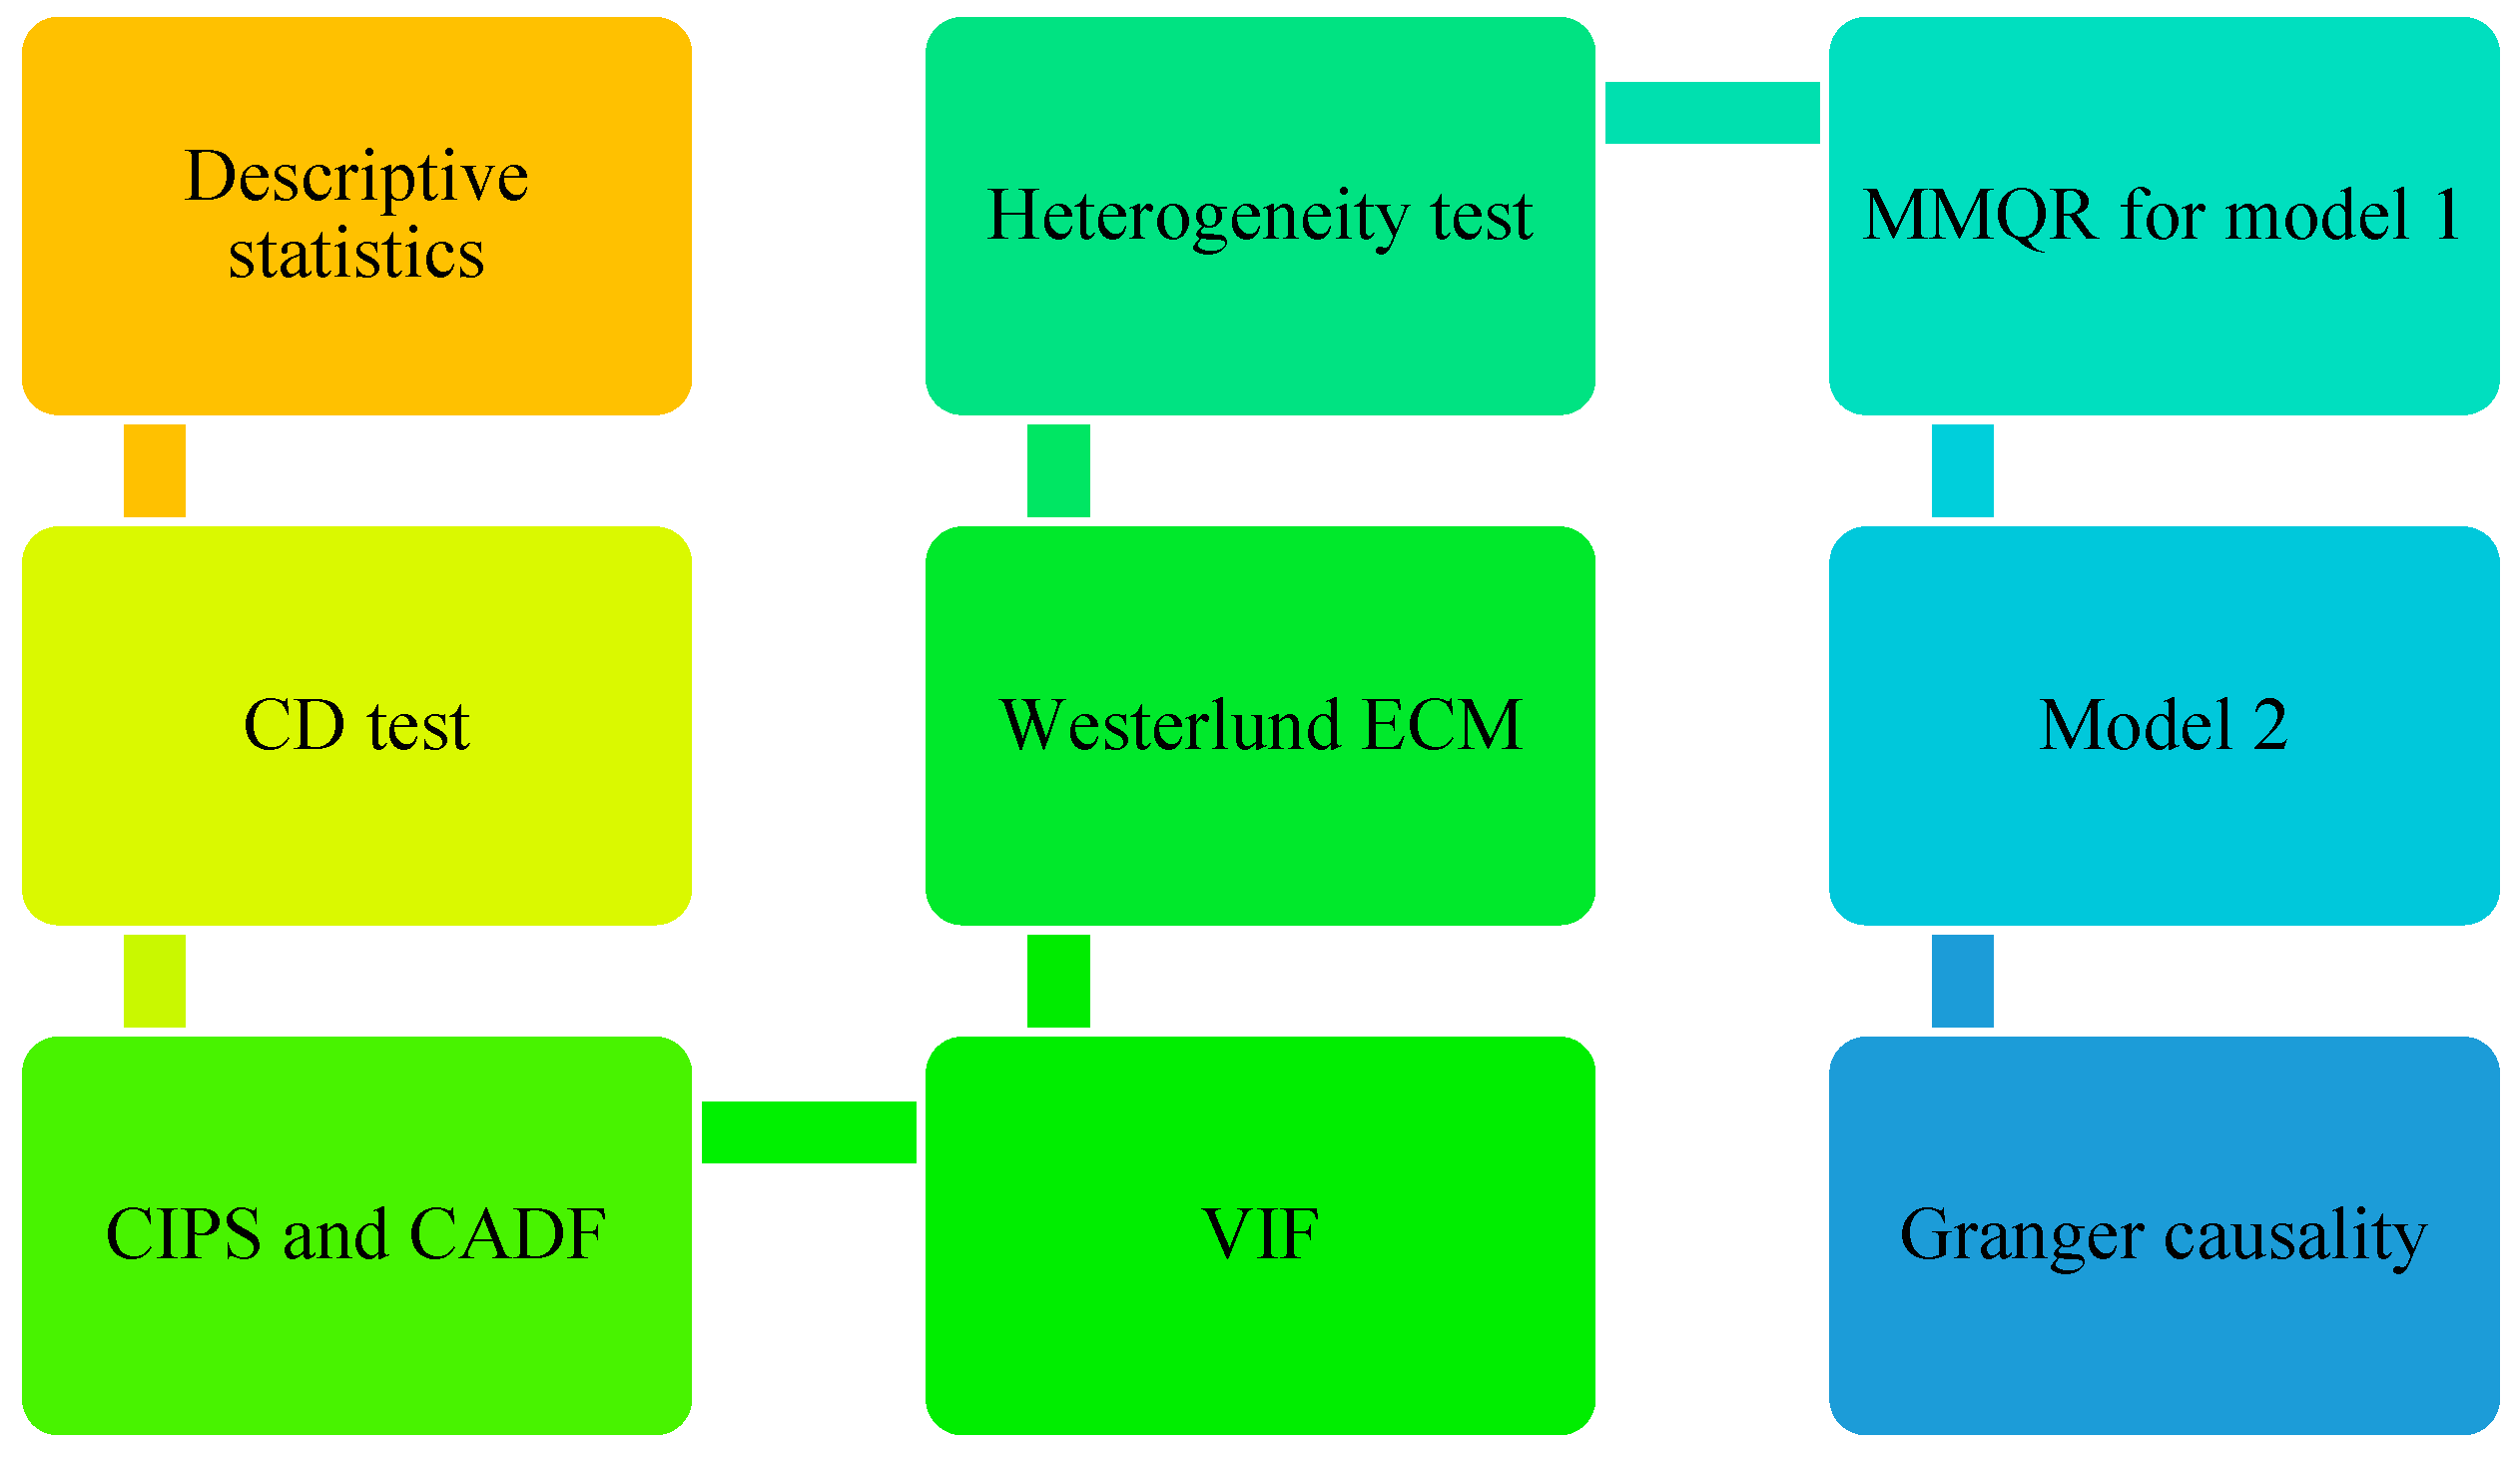
3. Material and Methods

3.1. Model Construction

This study is based on the model developed by Zweifel et al. [67], which identifies capital, labor, materials, and energy as key factors of production. Historically, labor and capital have been widely recognized as the primary inputs influencing a country’s production output, as highlighted by Solow [68] and Romer [69]. Zweifel et al.’s [67] model represents a modification of traditional production models by emphasizing the importance of capital and labor while also incorporating materials and energy into the model. According to Zweifel et al. [67], the production function is expressed as follows:
Y = K + L + E + M ,                    
where Y represents the output level in an economy, K denotes the capital level, L refers to the labor force, E is a proxy for energy, and M is materials.
Previous research has established the importance of renewable and non-renewable energy in enhancing economic growth (e.g., [70,71]). Non-renewable and renewable resource rents have recently been used as proxies for materials in the production models; however, limited research has been undertaken to comprehensively explore this relationship. Among the limited studies examining the impact of natural resources or their rents, mixed results have been reported [29,30,31,72].
We use several control variables, such as technological innovation and trade openness, to strengthen the empirical models in this study. Additionally, the study investigates the impact of economic growth on non-renewable resources. Consequently, the current study contributes to the growing body of literature by examining this relationship. The models used in this research are shown in the second and third equations. The second equation shows economic growth as the dependent variable, while the third equation shows natural resource rents as the dependent variable to assess the reverse impact of economic growth on materials.
Model 1
E G it = α it + β 1 × C P A it + β 2 × L B R it + β 3 × R E it + β 4 × N R E it + β 5 × N R R it + β 6 × T R D it + μ it
Model 2
N R R it = α it + β 1 × C P A it + β 2 × L B R it + β 3 × R E it + β 4 × N R E it + β 5 × E G it + β 6 × T R D it + μ it
where EG is a proxy for economic growth and is the output variable. CAP represents the growth rate of gross capital formation (GCF). LBR denotes the rate of labor force participation. RE refers to the renewable energy consumption. NRE is the non-renewable energy. NRR stands for the natural resource rents. TRD represents trade openness. αit represents the constant parameter, βi (i = 1, …, 6) denotes fixedly the parameters of the model, while μit indicates the white noise error term.

3.2. Data and Methods

The data was obtained from various public sources, including the World Development Indicators (WDI) developed by the World Bank [73] and the US Energy Information Administration (EIA) [74]. It covers the period from 1990 to 2023. Many researchers have utilized these reliable global sources, such as [39,40,41,42,43,44,45,46,47,48,49,50,51,52,53,54,55,56,57,58,59], among others. Table 2 provides an overview of the data sources and the measurement of variables.
We utilize the Pesaran [75] test to assess cross-sectional dependence. This test is crucial, as it informs the selection of appropriate methods for employing in assessing unit roots. Panel variables with robust cross-sectional dependence require second-generation (SG) techniques to assess the existence of unit roots in the variables. Conversely, if the panel variables do not exhibit robust cross-sectional dependence, first-generation (FG) techniques may be employed. The variables identified in the study model are checked for unit roots using SG techniques, specifically the CADF and CIPS techniques [76,77]. The purpose of testing for unit roots is to ascertain cointegration orders of the variables, which is critical for ascertaining the suitable data analysis methods to be utilized.
We utilize several tests to assess multicollinearity, cointegration, heterogeneity, and cross-sectional dependence in the empirical model. Multicollinearity among the independent variables is assessed using the variance inflation factor (VIF) test [78]. The independent variables exhibiting substantial multicollinearity cannot be included simultaneously within the same model. Consequently, when multicollinearity exists among two or more independent variables, it is necessary to re-specify the model by excluding the other independent variables.
The error correction model (ECM), proposed by Westerlund [79], is utilized for assessing cointegration, whereas the variables of the study exhibit mixed orders of cointegration [68]. The slope heterogeneity test developed by Pesaran and Yamagata [80] is utilized to assess heterogeneity. In the existence of significant heterogeneity, the SG techniques are employed, otherwise FG techniques can be utilized [81].
Furthermore, we examine weak cross-sectional dependence by applying the scaled Lagrange Multiplier (LM) test, developed by Pesaran [82], the Friedman [83] test, and the Frees [84] test. Models exhibiting weak cross-sectional dependence can be evaluated using SG techniques specifically designed to address this challenge. The relationships in the empirical model are examined using MMQR with the fixed-effects method. MMQR assesses non-normal distributions and outliers, which helps ensure robust findings. It also takes into account the asymmetric and non-linear relationships among the variables [21]. MMQR is one of the few approaches that enables the estimation of conditional quantiles while addressing endogeneity [85]. Even in small samples, the focus on distributional effects beyond the mean supports the use of MMQR, particularly when other methods are unable to capture this heterogeneity [86]. MMQR remains consistent as the sample size increases [86]. However, in small samples, bias can be a concern, despite the estimator still targeting the correct object asymptotically [87]. Scholars often accept this small-sample bias as a trade-off for consistency and asymptotic validity [87]. Therefore, many researchers have utilized MMQR in small sample contexts. For example, Ojekemi et al. [88] and Asif et al. [89] for BRICS countries, Omar et al. [90] and Ayad et al. [91] for GCC countries, Fatima et al. [92] and Luo et al. [93] for G7 countries, and Benaini et al. [94] for OAPEC countries. According to An et al. [87], if data is influenced by possible outliers, MMQR remains better than other approaches [87]. It might offer robust results even when conditional means have no or minimal impact [86].
Following Machado and Silva [21], the location-scale variant of various quantile estimates Qy(τ|X) is formulated by the fourth equation below:
Y it = α it + X it   β + δ + Z it γ U it
The coefficients of the probability {δi + Zit γ > 0} = 1. (αit, β′, δi, γ′) are parameters. The I denotes discrete, (αi, δi′). i = 1, …, n is the fixed effect, and Z is K-vector tested elements of X, which are differentiable transformations obtained from both cross-sectional and time data following An et al. [87], as depicted in the following equation.
Z I = Z I X ,   i = 1,2 , , k                                    
Xit is identically and independently distributed across both fixed (i) and time (t). Uit indicates standardized orthogonal moment conditions Xit, it is also standardized to attain the moment conditions. Based on Machado and Silva [21], this can be formulated as follows:
Q y τ X = α i + δ i τ + X i t β + Z i t γ q τ                                                    
X i t signifies vectors of the variables that augmented the explanatory variables. Qy(τ|X) indicates the quantile allocation of Yit, which is the dependent variable. i and τ point out the parameters of scaler determined as α i + δ i τ . q(τ) is the sample quantile, which can be computed by the below equation, following Based on Machado and Silva [21].
p τ Q = τ 1 Q I Q 0 + τ Q I Q > 0
Figure 1 presents the methodological steps followed by this research.
Table 3 outlines the variables of the study. The mean value for renewable energy is 0.032, suggesting a relatively low level of usage. This average indicates the need to enhance renewable energy practices to increase its contribution to total energy consumption. However, non-renewable energy consumption is high, with a mean value of 2.335 quadrillion Btu. Figure 2 illustrates the significant economic growth experienced across GCC countries from 1990 to 2023. Additionally, Figure 3 provides a comparison of economic growth rates among these countries, revealing that Qatar has the highest average growth rate at 7.195%, while Oman has the lowest average at 3.345%. The abundance of natural resources has contributed significantly to optimizing economic growth in these countries. Figure 4 indicates a decline in natural resource rents over the past ten years in GCC economies, suggesting that these countries have started to alter their approaches to natural resource extraction during this period. Figure 5 shows that Kuwait has the highest average at 42.19%, while Bahrain has the lowest average at 20.08%. Table 3 indicates that labor force participation in GCC countries is at a reasonable level, with a rate of 65%. Additionally, Table 3 shows an upward trend in trade openness across all GCC economies. The table also includes standard deviations, kurtosis, skewness, and the Jarque–Bera test to assess data distribution and normality.

4. Empirical Results and Discussion

Table 4 indicates that the study’s variables exhibit significant cross-sectional dependence, making it appropriate to use the SG methods for testing unit roots. Table 5 presents the results of the CIPS and CADF techniques used to check for unit roots. The findings indicate that economic growth is stationary at the level, yet it does not exhibit a unit root at level. Additionally, capital and natural resources are stationary at level, while the CADF technique illustrates that capital, trade openness, and natural resources are stationary at first difference.
It can be observed that capital, natural resources, and trade openness are integrated of order zero. According to the results of the CIPS and CADF methods, renewable energy, labor force participation rate, and non-renewable energy are found to be stationary at first difference and are therefore integrated of order 1.
Multicollinearity can affect the parameters of an empirical model. The results of VIF, presented in Table 6, illustrate that no values have exceeded the generally accepted maximum level of 10 (an indication of high levels of multicollinearity). Thus, no support was found for the existence of multicollinearity problems.
Table 7 shows the outcomes of Westerlund ECM cointegration test. The table reveals that the models specified have significant cointegration. Consequently, the models of the study have a significant long-run relationship.
Table 8 confirms the existence of heterogeneity in the empirical models. Accordingly, it is necessary to use a technique that is robust in the existence of heterogeneity to assess the relationship illustrated in the present model. Additionally, Table 8 shows that the study models have a significant weak CD of the empirical model using the scaled LM method, Friedman [73], and Frees [74]. As a result of the presence of weak CD in the models, we utilize the SG approaches of assessing the relationship shown in the models. SG approaches offer robust outcomes in the existence of CD.
Table 9 shows that all explanatory variables affect economic growth. Capital has a positive effect on economic growth. Capital is one of the main inputs of economic growth, as indicated by previous studies (e.g., [10,11]). Furthermore, covenantal production models, such as the Romer endogenous growth model [69] and the Cobb–Douglas PF, have considered capital as a primary input of output level in an economy. Moreover, GCC countries exhibit substantial levels of capital, which positively influences economic growth.
The labor force has a positive impact on economic growth at a significance level of 0.10 in the 0.10 quantile and a significance level of 0.05 across all other quantiles. The role of the labor force in driving economic growth is well-supported by production theories. One potential reason for the positive influence of the labor force on economic growth in GCC countries is the contrast between their high employment rates and low unemployment rates. A growing labor force raises household consumption, which stimulates demand for goods and services. This, in turn, drives domestic economic activity and enhances economic growth. Additionally, GCC countries possess a large number of skilled labor forces from outside their borders, which improves productivity, enabling these countries to diversify their economies and increase economic output. This calls for these countries to increase their local labor force and develop their skills to foster economic growth.
Non-renewable and renewable energy positively affect economic growth at a significance level of 0.05 across all quantiles. Renewable energy plays an important role in enhancing the economy due to its substantial benefits. By lowering dependence on non-renewable sources, renewable energy improves innovation, ensures energy efficiency, and increases business activities. This transformation strengthens economic sectors by reducing carbon emissions, leading to sustainable economic growth. Our results are consistent with those of Kasperowicz et al. [95], Koengkan and Fuinhas [96], Aydin [97], and Soava [98], who confirmed that renewable energy enhances growth.
Non-renewable energy improves economic growth in GCC economies. The countries of the GCC possess substantial reserves of petroleum and natural gas. These resources have established for GCC countries a distinct competitive edge in the world’s energy markets, which allows them to access significant export revenue streams. These countries, which are major oil exporters, have leveraged their energy resources to create substantial foreign exchange returns, which have improved their balance of payments and given the government a sizable stream of income. The production and utilization of non-renewable energy resources have supported significant downstream sectors in the GCC countries. For example, the petrochemical industry has expanded alongside the energy sector, using feedstocks produced from oil to produce a wide range of goods, including fertilizer and plastics. The countries’ general economic growth has been aided by this change into value-added businesses, which has optimized investment, encouraged innovations, and improved the overall economy. Additionally, the GCC countries have been able to invest in different economic sectors and execute smart infrastructure through the revenue received from the export of non-renewable energy. To shift from an oil-based economy to a knowledge-based economy, the governments of the GCC region have redirected these revenues into sectors, such as technology, banking, and tourism, facilitating efforts for economic diversification. Nevertheless, non-renewable energy has many negative effects on environmental quality. Our empirical results are consistent with most studies that confirmed that non-renewable energy improves economic growth (e.g., [12,99,100,101]).
Natural resources positively affect economic growth at a significance level of 0.05 in the 0.10 quantile and a 0.01 significance level in all other quantiles. Natural resources, particularly oil and gas, are key drivers of economic growth in GCC countries. For example, oil constitutes approximately 70% of government revenues. Natural resource abundance has enabled GCC countries to implement substantial investments in public facilities, such as highways, airports, ports, and public facilities. These investments have facilitated business, tourism, and overall economic growth. Additionally, oil wealth has prompted economic activity in services, construction, and industrialization. However, as global energy markets shift towards renewable energy sources, the long-term economic stability of GCC countries will depend on their capacity to diversify their economies. Our findings are aligned with those of Singh et al. [28], Razzaq [39], Zhang et al. [40], Chen et al. [41], Khan et al. [42], Jiao et al. [43], and Manigandan et al. [44], who indicated that natural resources improve economic growth.
Trade openness has a positive influence across all quantiles, with a significance level of 0.10 in each quantile. Economic growth is optimized by increasing trade openness. As GDP expands, it generates a greater demand for exports from a nation while simultaneously increasing the supply of imports [102]. A nation’s standard of living is typically measured by per capita GDP. When economic growth occurs, exports may increase due to higher production capacity but could also decline due to greater domestic absorption driven by population pressures, particularly in countries like China and India. This finding aligns with the conclusions of Liu and Nath [103]. Trade openness reduces barriers, facilitates the import of capital, improves access to advanced technology, and promotes the development of human capital, all of which contribute to economic growth. Consequently, trade openness and FDI are widely regarded as key drivers of economic growth.
Table 10 shows the outcomes of the second model, which illustrate that economic growth, capital, labor participation, non-renewable energy, and trade openness significantly increase natural resource rent in GCC countries. Economic growth positively affects natural resources at a significance level of 0.05 in the 0.1, the 0.75, and the 0.90 quantiles, while its effect is in the 0.025 and the 0.50 at a significance level of 0.01. Capital and labor force participation positively affect natural resource rent at a significance level of 0.05 in all quantiles. Renewable energy does not have an impact on natural resource rent, while non-renewable energy improves natural resource rent at a significance level of 0.05 across all quantiles. Trade openness enhances natural resource rent at a significance level of 0.01 across all quantiles.
Finally, this study employs the Granger causality test to examine the causal relationships among the variables under investigation. Table 11 illustrates a unidirectional relationship from capital, labor force participation, renewable energy, non-renewable energy, natural resources, and trade openness to economic growth, suggesting that these variables are drivers of economic growth. Moreover, the results show a unidirectional link from non-renewable energy to capital, labor force participation, and trade openness, indicating that these factors help increase the use of non-renewable energy. The findings also show significant positive bidirectional causality between non-renewable energy and natural resource rent, as well as between labor force participation and non-renewable energy. Furthermore, there is significant positive bidirectional causality between natural resource rent on capital, labor force participation, and trade openness, indicating that these factors influence the consumption of natural resources. Lastly, the results reveal significant positive unidirectional causality of trade openness on capital.

5. Conclusions and Policy Implications

This study concludes that natural resources contribute significantly to the economic growth of GCC countries. The findings align with Rostow’s hypothesis [2], which suggests that the presence of natural resources promotes economic growth. This is evident in the fact that a substantial portion of the goods exported by these countries is derived from natural resources, whereas manufacturing exports constitute only a small share of total goods exports. The potential decline in manufacturing exports, which is linked to the expansion of the natural resources sector, seems to be minimal. The results contradict the resource curse hypothesis, which suggests that natural resources hinder economic growth in developing countries. Consequently, GCC countries appear to have avoided the resource curse issue.
Despite Saudi Arabia and the UAE having achieved significant progress in shifting toward a knowledge-based economy, prioritizing economic diversification is essential for all other GCC countries. Diversification can enhance their growth performance while significantly reducing reliance on natural resources. Lower reliance on natural resources can also decrease resource depletion, contributing to enhanced environmental quality. Additionally, investment in renewable energy should be considered, as it enhances economic growth and preserves both natural resources and environmental quality.
This study has assessed natural resources using the inflow of resource rents. Consequently, fluctuations in export volumes and price shocks for these resources could negatively impact economic growth. To mitigate the adverse effects of such shocks and the volatility of resource rent, GCC economies should establish innovative policy instruments to increase economic diversification, with a strong emphasis on developing human resources and fostering technological innovations.
Future studies should focus on examining the effect of natural resources on economic growth in other Middle Eastern countries, such as Turkey, Iraq, and Egypt, among others. Such studies can contribute to comparative research, which improves knowledge considerably.

Author Contributions

Conceptualization, J.A.; methodology, F.M.A.; software, F.M.A.; formal analysis, F.M.A.; writing—original draft preparation, J.A.; writing—review and editing, J.A.; supervision, J.A. All authors have read and agreed to the published version of the manuscript.

Funding

This research received no external funding.

Data Availability Statement

Data used for this study is available upon request by contacting the corresponding author.

Conflicts of Interest

The authors declare no conflicts of interest.

Abbreviations

GCCGulf Cooperation Council Countries
MMQRMethod of Moments Quantile Regression
GDPGross Domestic Product
EGEconomic growth
CAPCapital
LBRLabor Force Participation
RERenewable Energy
NRENon-renewable Energy
NRRNatural Resources Rent
TRDTrade Openness
CDCross-sectional Dependence
SGSecond-generation
FGFirst-generation
VIFVariance Inflation Factor
ECMError Correction Model
CADFCross-sectionally Augmented Dickey–Fuller
CIPS Cross-sectionally of Pesaran

References

  1. Nurkse, R. Problems of Capital Formation in Undeveloped Countries; Oxford University Press: Oxford, UK, 1953. [Google Scholar]
  2. Rostow, W.W. The Stages of Economic Growth: A Non-Communist Manifesto; Cambridge University Press: Cambridge, UK, 1990. [Google Scholar]
  3. Aldegheishem, A. Urban growth Management in Riyadh, Saudi Arabia: An assessment of technical policy instruments and institutional practices. Sustainability 2023, 15, 10616. [Google Scholar] [CrossRef]
  4. Aldegheishem, A. Assessing the progress of smart cities in Saudi Arabia. Smart Cities 2023, 6, 1958–1972. [Google Scholar] [CrossRef]
  5. Sachs, J.D.; Warner, A.M. Fundamental sources of long-run growth. Am. Econ. Rev. 1997, 87, 184–188. [Google Scholar]
  6. Leite, M.C.; Weidmann, J. Does Mother Nature Corrupt? Natural Resources, Corruption, and Economic Growth; International Monetary Fund: Washington, DC, USA, 1999. [Google Scholar]
  7. Zhao, X.; Shang, Y.; Magazzino, C.; Madaleno, M.; Mallek, S. Multi-step impacts of environmental regulations on green economic growth: Evidence in the lens of natural resource dependence. Resour. Policy 2023, 85, 103919. [Google Scholar] [CrossRef]
  8. Destek, M.A.; Hossain, M.R.; Aydın, S.; Shakib, M.; Destek, G. Investigating the role of economic complexity in evading the resource curse. Resour. Policy 2023, 86, 104131. [Google Scholar] [CrossRef]
  9. Yu, C.; Moslehpour, M.; Tran, T.K.; Trung, L.M.; Ou, J.P.; Tien, N.H. Impact of non-renewable energy and natural resources on economic recovery: Empirical evidence from selected developing economies. Resour. Policy 2023, 80, 103221. [Google Scholar] [CrossRef]
  10. Kadir, M.O.; Deka, A.; Seraj, M.; Ozdeser, H. Capitalizing on natural resources rent and renewable energy in enhancing economic growth—New evidence with MMQR method. In Natural Resources Forum; Blackwell Publishing, Ltd.: Oxford, UK, 2024. [Google Scholar]
  11. Deka, A.; Ozdeser, H.; Seraj, M. The effect of GDP, renewable energy and total energy supply on carbon emissions in the EU-27: New evidence from panel GMM. Environ. Sci. Pollut. Res. 2023, 30, 28206–28216. [Google Scholar] [CrossRef] [PubMed]
  12. Zafar, M.W.; Shahbaz, M.; Hou, F.; Sinha, A. From nonrenewable to renewable energy and its impact on economic growth: The role of research & development expenditures in Asia-Pacific Economic Cooperation countries. J. Clean. Prod. 2019, 212, 1166–1178. [Google Scholar] [CrossRef]
  13. Gozgor, G.; Lau, C.K.M.; Lu, Z. Energy consumption and economic growth: New evidence from the OECD countries. Energy 2018, 153, 27–34. [Google Scholar] [CrossRef]
  14. Inglesi-Lotz, R. The impact of renewable energy consumption to economic growth: A panel data application. Energy Econ. 2016, 53, 58–63. [Google Scholar] [CrossRef]
  15. Khan, I.; Zakari, A.; Dagar, V.; Singh, S. World energy trilemma and transformative energy developments as determinants of economic growth amid environmental sustainability. Energy Econ. 2022, 108, 105884. [Google Scholar] [CrossRef]
  16. Ivanovski, K.; Hailemariam, A.; Smyth, R. The effect of renewable and non-renewable energy consumption on economic growth: Non-parametric evidence. J. Clean. Prod. 2021, 286, 124956. [Google Scholar] [CrossRef]
  17. Bulut, U.; Muratoglu, G. Renewable energy in Turkey: Great potential, low but increasing utilization, and an empirical analysis on renewable energy-growth nexus. Energy Policy 2018, 123, 240–250. [Google Scholar] [CrossRef]
  18. Ocal, O.; Aslan, A. Renewable energy consumption–economic growth nexus in Turkey. Renew. Sustain. Energy Rev. 2018, 28, 494–499. [Google Scholar] [CrossRef]
  19. Arabeyyat, A.R.; Alnsour, J.A.; L-Bazaiah, S.A.; AL-Habees, M.A. Managing Urban Environment: Assessing the Role of Planning and Governance in Controlling Urbanization in the City of Amman, Jordan. J. Environ. Manag. Tour. 2024, 15, 263–271. [Google Scholar] [CrossRef]
  20. Becker, B.; Fischer, D. Promoting renewable electricity generation in emerging economies. Energy Policy 2013, 56, 446–455. [Google Scholar] [CrossRef]
  21. Machado, J.A.; Silva, J.S. Quantiles via moments. J. Econom. 2019, 213, 145–173. [Google Scholar] [CrossRef]
  22. Auty, R.M. Industrial policy reform in six large newly industrializing countries: The resource curse thesis. World Dev. 1994, 22, 11–26. [Google Scholar] [CrossRef]
  23. Havranek, T.; Horvath, R.; Zeynalov, A. Natural resources and economic growth: A meta-analysis. World Dev. 2016, 88, 134–151. [Google Scholar] [CrossRef]
  24. Ofori, P.E.; Grechyna, D. Remittances, natural resource rent and economic growth in Sub-Saharan Africa. Cogent Econ. Financ. 2021, 9, 1979305. [Google Scholar] [CrossRef]
  25. Kangning, X.; Jian, W. The relationship between Natural resource abundance and the level of economic development. Econ. Res. J. 2006, 1, 78–89. [Google Scholar]
  26. Aslan, A.; Altinoz, B. The impact of natural resources and gross capital formation on economic growth in the context of globalization: Evidence from developing countries on the continent of Europe, Asia, Africa, and America. Environ. Sci. Pollut. Res. 2021, 28, 33794–33805. [Google Scholar] [CrossRef]
  27. Gerelmaa, L.; Kotani, K. Further investigation of natural resources and economic growth: Do natural resources depress economic growth? Resour. Policy 2016, 50, 312–321. [Google Scholar] [CrossRef]
  28. Singh, S.; Sharma, G.D.; Radulescu, M.; Balsalobre-Lorente, D.; Bansal, P. Do natural resources impact economic growth: An investigation of P5+ 1 countries under sustainable management. Geosci. Front. 2024, 15, 101595. [Google Scholar] [CrossRef]
  29. Zhang, Y.; Khan, S.U.D. The role of energy poverty in the linkage between natural resources and economic performance: Resource curse or resource blessing? Resour. Policy 2023, 85, 103838. [Google Scholar] [CrossRef]
  30. Sha, Z. The effect of globalisation, foreign direct investment, and natural resource rent on economic recovery: Evidence from G7 economies. Resour. Policy 2023, 82, 103474. [Google Scholar] [CrossRef]
  31. Khan, Z.; Hossain, M.R.; Badeeb, R.A.; Zhang, C. Aggregate and disaggregate impact of natural resources on economic performance: Role of green growth and human capital. Resour. Policy 2023, 80, 103103. [Google Scholar] [CrossRef]
  32. Uri, N.D. An empirical re-examination of natural resource scarcity and economic growth. Appl. Stoch. Models Data Anal. 1996, 12, 45–61. [Google Scholar] [CrossRef]
  33. Asiedu, M.; Yeboah, E.N.; Boakye, D.O. Natural resources and the economic growth of West Africa economies. Appl. Econ. Financ. 2021, 8, 20–32. [Google Scholar] [CrossRef]
  34. Ahmad, M.; Jiang, P.; Majeed, A.; Umar, M.; Khan, Z.; Muhammad, S. The dynamic impact of natural resources, technological innovations and economic growth on ecological footprint: An advanced panel data estimation. Resour. Policy 2020, 69, 101817. [Google Scholar] [CrossRef]
  35. Meaton, J.; Alnsour, J. Spatial & Environmental Planning Challenges in Amman, Jordan. Plan. Pract. Res. 2012, 27, 376–386. [Google Scholar]
  36. Yasmeen, H.; Tan, Q.; Zameer, H.; Vo, X.V.; Shahbaz, M. Discovering the relationship between natural resources, energy consumption, gross capital formation with economic growth: Can lower financial openness change the curse into blessing. Resour. Policy 2021, 71, 102013. [Google Scholar] [CrossRef]
  37. Aljarallah, R.A. An assessment of the economic impact of natural resource rents in kingdom of Saudi Arabia. Resour. Policy 2021, 72, 102070. [Google Scholar] [CrossRef]
  38. Erdoğan, S.; Yıldırım, D.Ç.; Gedikli, A. Natural resource abundance, financial development and economic growth: An investigation on Next-11 countries. Resour. Policy 2020, 65, 101559. [Google Scholar] [CrossRef]
  39. Razzaq, A. Impact of fintech readiness, natural resources, and business freedom on economic growth in the CAREC region. Resour. Policy 2024, 90, 104846. [Google Scholar] [CrossRef]
  40. Zhang, C.; Waris, U.; Qian, L.; Irfan, M.; Rehman, M.A. Unleashing the dynamic linkages among natural resources, economic complexity, and sustainable economic growth: Evidence from G-20 countries. Sustain. Dev. 2024, 32, 3736–3752. [Google Scholar] [CrossRef]
  41. Chen, J.; Ma, W.; Kchouri, B.; Ribeiro-Navarrete, S. Resource rich yet debt ridden: The role of natural resources and debt servicing in sustainable economic growth. Resour. Policy 2024, 89, 104565. [Google Scholar] [CrossRef]
  42. Khan, I.; Muhammad, I.; Sharif, A.; Khan, I.; Ji, X. Unlocking the potential of renewable energy and natural resources for sustainable economic growth and carbon neutrality: A novel panel quantile regression approach. Renew. Energy 2024, 221, 119779. [Google Scholar] [CrossRef]
  43. Jiao, L.; Zhou, D.; Xu, R. Resource dynamics and economic expansion: Unveiling the asymmetric effects of natural resources and FDI on economic growth with a lens on energy efficiency. Resour. Policy 2024, 89, 104611. [Google Scholar] [CrossRef]
  44. Manigandan, P.; Alam, M.S.; Murshed, M.; Ozturk, I.; Altuntas, S.; Alam, M.M. Promoting sustainable economic growth through natural resources management, green innovations, environmental policy deployment, and financial development: Fresh evidence from India. Resour. Policy 2024, 90, 104681. [Google Scholar] [CrossRef]
  45. Xie, T.; Xu, Y.; Li, Y. Nonlinear relationship between natural resources and economic growth: The role of frontier technology. Resour. Policy 2024, 90, 104831. [Google Scholar] [CrossRef]
  46. Ze, F.; Yu, W.; Ali, A.; Hishan, S.S.; Muda, I.; Khudoykulov, K. Influence of natural resources, ICT, and financial globalization on economic growth: Evidence from G10 countries. Resour. Policy 2023, 81, 103254. [Google Scholar] [CrossRef]
  47. Tabash, M.I.; Mesagan, E.P.; Farooq, U. Dynamic linkage between natural resources, economic complexity, and economic growth: Empirical evidence from Africa. Resour. Policy 2022, 78, 102865. [Google Scholar] [CrossRef]
  48. Haseeb, M.; Kot, S.; Hussain, H.I.; Kamarudin, F. The natural resources curse-economic growth hypotheses: Quantile–on–Quantile evidence from top Asian economies. J. Clean. Prod. 2021, 279, 123596. [Google Scholar] [CrossRef]
  49. Hayat, A.; Tahir, M. Natural resources volatility and economic growth: Evidence from the resource-rich region. J. Risk Financ. Manag. 2021, 14, 84. [Google Scholar] [CrossRef]
  50. Imran, M.; Alam, M.S.; Jijian, Z.; Ozturk, I.; Wahab, S.; Doğan, M. From resource curse to green growth: Exploring the role of energy utilization and natural resource abundance in economic development. Nat. Resour. Forum 2025, 49, 2025–2047. [Google Scholar] [CrossRef]
  51. Osabohien, R.; Zogbassé, S.; Jaaffar, A.H.; Idowu, O.O.; Al-Faryan, M.A.S. Renewable energy, carbon footprints, natural resources depletion and economic growth in Africa. Int. J. Energy Sect. Manag. 2025, 19, 667–690. [Google Scholar] [CrossRef]
  52. Shuchun, B.; Alola, A.A. Role of education and natural resources in achieving green economic growth in China: A wavelet quantile correlation approach. Nat. Resour. Forum 2025, 49, 445–460. [Google Scholar] [CrossRef]
  53. Dai, Y.; Ding, Y.; Fu, S.; Zhang, L.; Cheng, J.; Zhu, D. Analyzing the impact of natural capital on socio-economic objectives under the framework of sustainable development goals. Environ. Impact. Assess. Rev. 2024, 2, 107322. [Google Scholar] [CrossRef]
  54. Ge, X.; Imran, M.; Ali, K. Natural resource-driven prosperity: Unveiling the catalysts of sustainable economic development in the United States. Nat. Resour. Forum 2025, 49, 1823–1841. [Google Scholar] [CrossRef]
  55. Raifu, I.A.; Obaniyi, F.A.; Nnamani, G.; Salihu, A.A. Revisiting causal relationship between renewable energy and economic growth in OECD countries: Evidence from a novel JKS’s Granger non-causality test. Renew. Energy 2025, 244, 122559. [Google Scholar] [CrossRef]
  56. Raihan, A.; Ibrahim, S.; Ridwan, M.; Rahman, M.S.; Bari, A.M.; Atasoy, F.G. Role of renewable energy and foreign direct investment toward economic growth in Egypt. Innov. Green Dev. 2025, 4, 100185. [Google Scholar] [CrossRef]
  57. Okunevičiūtė Neverauskienė, L.; Dirma, V.; Tvaronavičienė, M.; Danilevičienė, I. Assessing the Role of Renewable Energy in the Sustainable Economic Growth of the European Union. Energies 2025, 18, 760. [Google Scholar] [CrossRef]
  58. Fang, D.; Li, X.; Yu, B.; Han, Z. Refined decomposition analysis of renewable energy penetration and its nexus with economic growth in emerging industrialized economies: Evidence from China. J. Clean. Prod. 2025, 499, 145252. [Google Scholar] [CrossRef]
  59. Manal, A. The role of renewable energy in driving economic transformation and sustainable development in Saudi Arabia. Int. J. Energy Econ. Policy 2025, 15, 364. [Google Scholar] [CrossRef]
  60. Pea-Assounga, J.B.B.; Bambi, P.D.R.; Jafarzadeh, E.; Ngapey, J.D.N. Investigating the impact of crude oil prices, CO2 emissions, renewable energy, population growth, trade openness, and FDI on sustainable economic growth. Renew. Energy 2025, 241, 122353. [Google Scholar] [CrossRef]
  61. Keshavarzian, M.; Tabatabaienasab, Z. Application of bootstrap panel Granger causality test in Determining the relationship between renewable and non-renewable energy consumption and economic growth: A case study of OPEC countries. Technol. Econ. Smart Grids Sustain. Energy 2021, 6, 10. [Google Scholar] [CrossRef]
  62. Lin, B.; Moubarak, M. Renewable energy consumption–economic growth nexus for China. Renew. Sustain. Energy Rev. 2014, 40, 111–117. [Google Scholar] [CrossRef]
  63. Gyimah, J.; Yao, X.; Tachega, M.A.; Hayford, I.S.; Opoku-Mensah, E. Renewable energy consumption and economic growth: New evidence from Ghana. Energy 2022, 248, 123559. [Google Scholar] [CrossRef]
  64. Rafindadi, A.A.; Ozturk, I. Impacts of renewable energy consumption on the German economic growth: Evidence from combined cointegration test. Renew. Sustain. Energy Rev. 2017, 75, 1130–1141. [Google Scholar] [CrossRef]
  65. Mukhtarov, S.; Yüksel, S.; Dinçer, H. The impact of financial development on renewable energy consumption: Evidence from Turkey. Renew. Energy 2022, 187, 169–176. [Google Scholar] [CrossRef]
  66. Akpanke, T.A.; Deka, A.; Ozdeser, H.; Seraj, M. The role forest resources, energy efficiency, and renewable energy in promoting environmental quality. Environ. Monit. Assess. 2023, 195, 1071. [Google Scholar] [CrossRef] [PubMed]
  67. Zweifel, P.; Praktiknjo, A.; Erdmann, G. Energy Economics: Theory and Applications; Springer: Berlin/Heidelberg, Germany, 2017. [Google Scholar]
  68. Solow, R.M. A contribution to the theory of economic growth. Q. J. Econ. 1956, 70, 65–94. [Google Scholar] [CrossRef]
  69. Romer, P.M. Endogenous technological change. J. Political Econ. 1990, 98 Pt 2, S71–S102. [Google Scholar] [CrossRef]
  70. Asif, M.; Bashir, S.; Khan, S. Impact of non-renewable and renewable energy consumption on economic growth: Evidence from income and regional groups of countries. Environ. Sci. Pollut. Res. 2021, 28, 38764–38773. [Google Scholar] [CrossRef]
  71. Asiedu, B.A.; Hassan, A.A.; Bein, M.A. Renewable energy, non-renewable energy, and economic growth: Evidence from 26 European countries. Environ. Sci. Pollut. Res. 2021, 28, 11119–11128. [Google Scholar] [CrossRef]
  72. Fang, Y. Economic welfare impacts from renewable energy consumption: The China experience. Renew. Sustain. Energy Rev. 2011, 15, 5120–5128. [Google Scholar] [CrossRef]
  73. World Bank. World Development Indicators. 2023. Available online: https://databank.worldbank.org/source/world-development-indicators (accessed on 4 November 2024).
  74. US Energy Information Administration. Total Energy. 2023. Available online: https://www.eia.gov/totalenergy/data/browser/ (accessed on 22 December 2024).
  75. Pesaran, M.H. General diagnostic tests for cross section dependence in panels. Cambridge Working Papers. Economics 2004, 1240, 1. [Google Scholar]
  76. Pesaran, M.H. A simple panel unit root test in the presence of cross-section dependence. J. Appl. Econom. 2007, 22, 265–312. [Google Scholar] [CrossRef]
  77. Im, K.S.; Pesaran, M.H.; Shin, Y. Testing for unit roots in heterogeneous panels. J. Econom. 2003, 115, 53–74. [Google Scholar] [CrossRef]
  78. Shuayb, A.S.S.; Dube, S.; Khalifa, W.; Deka, A.; Kareem, P.H.; Cavusoglu, B. The impact of natural resources rent, renewable energy, and governance on the environmental sustainability—Evidence from resource-rich countries. Nat. Resour. Forum 2025, 49, 1842–1858. [Google Scholar] [CrossRef]
  79. Westerlund, J. Testing for error correction in panel data. Oxf. Bull. Econ. Stat. 2007, 69, 709–748. [Google Scholar] [CrossRef]
  80. Pesaran, M.H.; Yamagata, T. Testing slope homogeneity in large panels. J. Econom. 2008, 142, 50–93. [Google Scholar] [CrossRef]
  81. Akpanke, T.A.; Deka, A.; Ozdeser, H.; Seraj, M. Ecological footprint in the OECD countries: Do energy efficiency and renewable energy matter? Environ. Sci. Pollut. Res. 2024, 31, 15289–15301. [Google Scholar] [CrossRef]
  82. Pesaran, M.H. Testing weak cross-sectional dependence in large panels. Econom. Rev. 2015, 34, 1089–1117. [Google Scholar] [CrossRef]
  83. Friedman, M. The use of ranks to avoid the assumption of normality implicit in the analysis of variance. J. Am. Stat. Assoc. 1937, 32, 675–701. [Google Scholar] [CrossRef]
  84. Frees, E.W. Assessing cross-sectional correlation in panel data. J. Econom. 1995, 69, 393–414. [Google Scholar] [CrossRef]
  85. Koenker, R.; Hallock, K.F. Quantile regression. J. Econ. Perspect. 2001, 15, 143–156. [Google Scholar] [CrossRef]
  86. Binder, M.; Coad, A. From Average Joe’s happiness to Miserable Jane and Cheerful John: Using quantile regressions to analyze the full subjective well-being distribution. J. Econ. Behav. Organ. 2011, 79, 275–290. [Google Scholar] [CrossRef]
  87. An, H.; Razzaq, A.; Haseeb, M.; Mihardjo, L.W.W. The role of technology innovation and people’s connectivity in testing environmental Kuznets curve and pollution heaven hypotheses across the Belt and Road host countries: New evidence from method of moments quantile regression. Environ. Sci. Pollut. Res. 2021, 28, 5254–5270. [Google Scholar] [CrossRef]
  88. Ojekemi, O.S.; Ağa, M.; Magazzino, C. Towards Achieving Sustainability in the BRICS Economies: The Role of Renewable Energy Consumption and Economic Risk. Energies 2023, 16, 5287. [Google Scholar] [CrossRef]
  89. Asif, M.; Li, J.Q.; Zia, M.A.; Hashim, M.; Bhatti, U.A.; Bhatti, M.A.; Hasnain, A. Environmental sustainability in BRICS economies: The nexus of technology innovation, economic growth, financial development, and renewable energy consumption. Sustainability 2024, 16, 6934. [Google Scholar] [CrossRef]
  90. Omar, S.A.; Khalifa, W.M.; Kareem, P.H. The Influence of Trade, Technology and Economic Growth on Environmental Sustainability in the Gulf Cooperation Countries—New Evidence with the MMQR Method. Sustainability 2025, 17, 419. [Google Scholar] [CrossRef]
  91. Ayad, H.; Ben-Salha, O.; Djellouli, N. Toward maritime sustainability in GCC countries: What role do economic freedom and human capital play? Mar. Pollut. Bull. 2024, 206, 116774. [Google Scholar] [CrossRef]
  92. Fatima, N.; Xuhua, H.; Alnafisah, H.; Akhtar, M.R. Synergy for climate actions in G7 countries: Unraveling the role of environmental policy stringency between technological innovation and CO2 emission interplay with DOLS, FMOLS and MMQR approaches. Energy Rep. 2024, 12, 1344–1359. [Google Scholar] [CrossRef]
  93. Luo, B.; Khan, A.A.; Wu, X.; Li, H. Navigating carbon emissions in G-7 economies: A quantile regression analysis of environmental-economic interplay. Environ. Sci. Pollut. Res. 2023, 30, 104697–104712. [Google Scholar] [CrossRef] [PubMed]
  94. Benaini, R.; Ayad, H.; Selka, B. Unveiling new insights about the influence of oil prices on GDP in OAPEC nations: MMQR investigation. Glob. Bus. 2025, 10, 125–135. [Google Scholar] [CrossRef]
  95. Kasperowicz, R.; Bilan, Y.; Štreimikienė, D. The renewable energy and economic growth nexus in European countries. Sustain. Dev. 2021, 28, 1086–1093. [Google Scholar] [CrossRef]
  96. Koengkan, M.; Fuinhas, J.A. The interactions between renewable energy consumption and economic growth in the Mercosur countries. Int. J. Sustain. Energy 2020, 39, 594–614. [Google Scholar] [CrossRef]
  97. Aydin, M. Renewable and non-renewable electricity consumption–economic growth nexus: Evidence from OECD countries. Renew. Energy 2019, 136, 599–606. [Google Scholar] [CrossRef]
  98. Soava, G.; Mehedintu, A.; Sterpu, M.; Raduteanu, M. Impact of renewable energy consumption on economic growth: Evidence from European Union countries. Technol. Econ. Dev. Econ. 2018, 24, 914–932. [Google Scholar] [CrossRef]
  99. Rahman, M.M.; Velayutham, E. Renewable and non-renewable energy consumption-economic growth nexus: New evidence from South Asia. Renew. Energy 2020, 147, 399–408. [Google Scholar] [CrossRef]
  100. Kahia, M.; Aïssa, M.S.B.; Lanouar, C. Renewable and non-renewable energy use-economic growth nexus: The case of MENA Net Oil Importing Countries. Renew. Sustain. Energy Rev. 2017, 71, 127–140. [Google Scholar] [CrossRef]
  101. Al-Mulali, U.; Fereidouni, H.G.; Lee, J.Y. Electricity consumption from renewable and non-renewable sources and economic growth: Evidence from Latin American countries. Renew. Sustain. Energy Rev. 2014, 30, 290–298. [Google Scholar] [CrossRef]
  102. Keho, Y. The impact of trade openness on economic growth: The case of Cote d’Ivoire. Cogent Econ. Financ. 2017, 5, 1332820. [Google Scholar] [CrossRef]
  103. Liu, L.; Nath, H.K. Information and communications technology and trade in emerging market economies. Emerg. Mark. Financ. Trade 2013, 49, 67–87. [Google Scholar] [CrossRef]
Figure 1. Methodological Framework.
Resources 14 00124 g001
Figure 2. GDP growth (annual%) in GCC countries.
Resources 14 00124 g002
Figure 3. Average of economic growth in GCC countries.
Resources 14 00124 g003
Figure 4. Natural resources rents in GCC countries.
Resources 14 00124 g004
Figure 5. Average of natural resources rents in GCC countries.
Resources 14 00124 g005
Table 1. Studies on the relationship between natural resources and economic growth.
AuthorCountry/TimeMethodsResults
Razzaq [39]CAREC region
2000–2020
Method of moment quantile regression (MMQR)Natural resources enhance economic growth
Zhang et al. [40]G-20 countries
1990–2021
CS-ARDL Natural resources decrease economic growth
Chen et al. [41]Highly indebted poor economies
1988–2021
FMOLS
DOLS
CCR
Natural resources increase economic growth
Khan et al. [42]Afghanistan, Bhutan, Nepal, Bangladesh, Pakistan, Sri Lanka, the Maldives, India
1990–2019
Panel quantile regressionNatural resources improve economic growth
Jiao et al. [43]USA
1990–2020
Bootstrap quantile regression
FMOLS, DOLS, and CCR
Natural gas rents increase economic growth, while mineral resources reduce growth
Manigandan et al. [44]India
1990–2019
Fourier-ARDL
Fourier Toda-Yamamoto
Natural resources decrease economic growth
Xie et al. [45]57 developing countries 2008–2019GMM modelInverse-U-shaped relationship
Ze et al. [46]G10 economies
1992–2022
CS-ARDLNatural resources lower economic growth
Tabash et al. [47]24 African economies 1995–2017GMMNatural resources decrease economic growth
Haseeb et al. [48]China, India, Malaysia, Indonesia and Thailand
1970–2018
Quantile-on-quantile regressionNatural resources increase economic growth, except India
Hayat and Tahir [49]UAE, Saudi Arabia, Oman
1970–2016
ARDLNatural resources increase economic growth
Imran et al. [50]BRICS
1991–2022
ARDLNatural resources improve economic growth
Osabohien et al. [51]Africa
2000–2023
GMMNatural resources declines economic growth
Shuchun and Alola [52]ChinaA-ARDL
Wavelet quantile correlation
Natural resources hinder economic growth
Dai et al. [53] 131 countries
2000–2018
Baseline RegressionThe link between natural resources and the economy is changing
Ge et al. [54]United States
1991–2022
FMOLS
DOLS
Natural resources enhance economic growth
Table 2. Data sources and measurement.
VariableMeasurementSource
EGGDP growth (annual%)WDI
CAPGCF as a percentage of GDPWDI
LBRLabor force participation rate, total (% of total population ages 15+)WDI
REConsumption in quadrillion BtuEIA
NREConsumption in quadrillion BtuEIA
NRRPercentage of GDP WDI
TRDPercentage of GDP WDI
Table 3. Descriptive statistics.
VariableObs.MeanStd. dev.MinMaxKurtosisSkewnessJarque–Berap-Value
EG1954.4905.390−7.07633.9907.7901.9520.9830.000
CAP19525.7338.1426.95248.869−0.3010.3481.0530.000
LBR19565.01011.68740.32088.87−0.7850.3702.9310.000
RE1950.0320.0980.0010.2229.4323.0860.7870.000
NRE1952.3352.8050.18312.273.5852.0391.2450.000
NRR19530.71011.5489.64859.069−0.6920.3394.5670.000
TRD19584.44836.25016.962202.3321.3290.6351.4750.000
Table 4. Results of CD test.
VariablesStatistic CD Testp-Value
EG9.984 ***0.000
CAP--
LBR7.042 ***0.000
RE16.560 ***0.000
NRE--
NRR10.041 ***0.000
TRD7.895 ***0.000
*** represents significance at 1% level.
Table 5. Results of CIPS and CADF.
VariableCIPS
Level
First DifferenceCADF
Level
First Difference
EG4.124 *** 2.681 ***
CAP3.758 *** 2.224 *3.224 ***
LBR1.6003.528 ***1.3621.894 *
RE2.1355.344 ***1.8042.953 ***
NRE1.7024.673 ***1.6052.597 ***
NRR2.614 *** 1.9113.112 ***
TRD2.298 ** 2.1053.726 ***
*, **, *** represent significance at 10%, 5%, and 1% levels.
Table 6. Results of VIF.
VariableVIF1/VIFVIF1/VIF
Model 1 Model 2
RE5.5340.1805.3020.188
NRE5.1140.1954.4230.226
LBR2.0180.4951.7980.556
TRD1.5600.6411.6020.624
EG 1.0800.925
NRR1.4210.703
CAP1.0320.9681.0340.967
Mean VIF2.78 2.54
Table 7. Westerlund (2007) ECM panel cointegration tests.
StatisticValueZ-Statisticp-ValueRobust p-ValueValueZ-Statisticp-ValueRobust p-Value
Model 1 Model 2
Gt1.9113.7480.9860.0811.8991.8170.9720.087
Ga1.4976.8160.9980.3781.1126.0440.9870.298
Pt10.2360.4080.3650.0323.2244.1290.9900.039
Pa5.5863.4200.9850.0571.1054.0020.9920.068
Table 8. Heterogeneity assessment and CD.
Statisticp-ValueStatisticp-Value
Model 1 Model 2
Δ3.798 ***0.0005.778 ***0.000
Δ adj.4.386 ***0.0006.739 ***0.000
Pesaran6.344 ***0.0000.9860.318
Friedman67.002 ***0.00039.218 ***0.000
Frees0.306 ***0.0000.523 ***0.000
*** represents significance at 1% level.
Table 9. The outcomes of MMQR for model 1.
Quantiles
0.10 0.25 0.50 0.75 0.90
CAP2.231 **
(0.016)
2.436 **
(0.016)
2.548 ***
(0.014)
2.553 ***
(0.015)
2.561 ***
(0.018)
LBR 1.935 *
(0.066)
2.243 **
(0.046)
2.333 **
(0.041)
2.373 **
(0.040)
2.447 **
(0.044)
RE 1.635 *
(0.056)
1.785 *
(0.062
1.849 *
(0.068)
1.973 *
(0.064)
1.968 *
(0.059)
NRE 2.434 **
(0.044)
2.591 ***
(0.041)
2.625 ***
(0.033)
2.717 ***
(0.034)
2.802 ***
(0.044)
NRR2.375 **
(0.038)
2.451 **
(0.036)
2.567 ***
(0.037)
2.604 ***
(0.041)
2.658 ***
(0.042)
TRD1.842 *
(0.080)
1.873 *
(0.075)
1.886 *
(0.078)
1.891 *
(0.076)
1.198 *
(0.068)
*** denotes the 1% significance level, ** indicates the 5% significance level and * indicates the 10% significance level.
Table 10. Model 2.
Table 10. Model 2.
Quantiles
0.10 0.25 0.50 0.75 0.90
EG0.4240.3940.3800.3680.365
(2.450 **)(2.921 ***)(3.472 ***)(2.334 **)(2.302 **)
CAP0.6310.6680.6850.6710.694
LBR(3.55 **)(3.624 **)(2.668 **)(2.716 **)(0.773 **)
0.3460.3690.3780.3830.394
(3.831 ***)(5.403 ***)(7.413 ***)(5.62 ***)(4.292 ***)
RE0.1690.1220.01240.0890.179
(1.044)(0.836)(0.147)(0.565)(0.75)
NRE0.7490.7720.8140.2230.253
(3.942 **)(4.365 **)(0.484 **)(0.534 **)(0.721 **)
TRD0.1620.1850.2290.2780.321
(3.572 ***)(5.412 ***)(7.125 ***)(6.723 ***)(5.351 ***)
**, *** represent significance at 5%, and 1% levels.
Table 11. Results of Granger causality.
VariablesF-Statisticp-ValueVariablesF-Statisticp-Value
CAP→EG4.3240.025 **CAP→TRD0.7330.318
EG→CAP0.0270.857RE→LBR0.3260.659
LBR→EG3.6350.037 **LBR→RE0.1820.564
EG→LBR0.42430.6544NRE→LBR3.3460.035 **
RE→EG3.0940.041 **LBR→NRE4.8440.006 ***
EG→RE11.2181.876NRR→LBR3.6780.033
NRE→EG7.8440.000 ***LBR→NRR0.5250.782
EG→NRE0.6830.0381TRD→LBR0.3470.571
NRR→EG7.1480.000 ***LBR→TRD0.1890.738
EG→NRR2.1870.243NRE→RE0.4290.183
TRD→EG4.1730.002 ***RE→NRE0.3980.285
EG→TRD1.6880.196NRR→RE0.3230.317
LBR→CAP1.3220.452RE→NRR0.6930.242
CAP→LBR1.7560.326TRD→RE0.2940.164
RE→CAP0.8560.325RE→TRD0.3360.633
CAP→RE0.1530.871NRR→NRE8.4260.000 ***
NRE→CAP4.2140.001 ***NRE→NRR7.3590.002 ***
CAP→NRE1.6840.145TRD→ NRE2.1130.197
NRR→CAP2.7450.041 **NRE→TRD5.7420.007 ***
CAP→NRR0.6490.239TRD→NRR0.4460.528
TRD→CAP2.7680.038 **NRR→TRD3.6140.029 **
**, *** represent significance at 5%, and 1% levels, respectively.
Disclaimer/Publisher’s Note: The statements, opinions and data contained in all publications are solely those of the individual author(s) and contributor(s) and not of MDPI and/or the editor(s). MDPI and/or the editor(s) disclaim responsibility for any injury to people or property resulting from any ideas, methods, instructions or products referred to in the content.

