Article

Life Cycle Sustainability Assessment of Greywater Treatment and Rainwater Harvesting for Decentralized Water Reuse in Brazil and Germany

by
Hugo Henrique de Simone Souza
1,2,
Carlo Gottardo Morandi
2,*,
Marc Árpád Boncz
1,
Paula Loureiro Paulo
1 and
Heidrun Steinmetz
2
1
Faculty of Engineering, Architecture and Urbanism, and Geography (FAENG), Federal University of Mato Grosso do Sul (UFMS), Cidade Universitária, Campo Grande 79070-900, Brazil
2
Department for Resource-Efficient Wastewater Technology, RPTU University of Kaiserslautern-Landau, Paul-Ehrlich-Straße 14, 67663 Kaiserslautern, Germany
*
Author to whom correspondence should be addressed.
Resources 2025, 14(6), 96; https://doi.org/10.3390/resources14060096
Submission received: 9 April 2025 / Revised: 14 May 2025 / Accepted: 27 May 2025 / Published: 4 June 2025

Abstract

:
Urban water management faces growing pressure from population growth, pollution, and climate variability, demanding innovative strategies to ensure long-term sustainability. This study applies the Life Cycle Sustainability Assessment (LCSA) across four case studies in Brazil and Germany, evaluating integrated systems that combine constructed wetlands for greywater treatment with rainwater harvesting for non-potable use. The scenarios include a single-family household, a high-rise residential building, a rural residence, and worker housing. A multi-criteria analysis was conducted to derive consolidated sustainability indicators, and sensitivity analysis explored the influence of dimension weighting. Results showed that water reuse scenarios consistently outperformed conventional counterparts across environmental, economic, and social dimensions. Life Cycle Assessment (LCA) revealed notable reductions in global warming potential, terrestrial acidification, and eutrophication. Life Cycle Costing (LCC) confirmed financial feasibility when externalities were considered, especially in large-scale systems. Social Life Cycle Assessment (S-LCA) highlighted the perceived benefits in terms of health, safety, and sustainability engagement. Integrated water reuse systems achieved overall sustainability scores up to 4.8 times higher than their baseline equivalents. These findings underscore the effectiveness of decentralized water reuse as a complementary and robust alternative to conventional supply and treatment models, supporting climate resilience and sustainable development goals.

1. Introduction

As urban populations continue to expand worldwide, the pressure on water resources remains a concern [1]. Coupled with the increasing unpredictability of weather patterns due to climate change, it is imperative to seek alternative water sources to complement conventional water supplies [2,3]. Greywater (GW) reuse, referring to the use of domestic wastewater that excludes toilet flows and typically originates from showers, sinks, laundry, kitchen activities, and rainwater (RW) harvesting, has been identified as a promising alternative, offering the potential to mitigate the strain on freshwater resources and enhance urban resilience in light of climate-related uncertainties [4].
Constructed wetlands (CW) are an effective and sustainable means for treating and reusing GW [5]. Characterized as a form of green infrastructure, CW harness natural processes to treat GW, so it can be safely reused for non-potable purposes [6]. Additionally, their integration with RW harvesting systems, also referred to as hybrid systems [7], can significantly augment the water supply in urban settings. Also recognized as nature-based solutions (NBSs), these multifunctional systems align with the broader goals of urban sustainability and resilience, providing alternative water sources, enhancing biodiversity, contributing to climate change mitigation and adaptation, as well as improving urban esthetics [8].
CW have been shown to emit lower levels of greenhouse gases (GHGs) and to exert less environmental impact than conventional wastewater treatment plants (WWTPs) [9]. Additionally, CW can combine landscape planning and design to improve environmental quality and public health at local and regional levels. Similarly, RW harvesting systems also contribute significantly to reducing urban water demand, further mitigating GHG emissions by decreasing the need for water transportation and treatment [10]. Moreover, the scalability of both systems allows them to be implemented in various contexts, from individual residential buildings to larger community spaces, offering a high degree of flexibility [11]. This adaptability, combined with their minimal operational and maintenance requirements, makes them particularly suitable for deployment in regions with limited resources or infrastructural constraints [12].
Implementing such systems brings benefits aligned with several Sustainable Development Goals (SDGs), including SDG 3 (good health and well-being), SDG 6 (clean water and sanitation), SDG 7 (affordable and clean energy), SDG 8 (decent work and economic growth), SDG 9 (industry, innovation, and infrastructure), SDG 11 (sustainable cities and communities), and SDG 13 (climate action), among others [13]. However, ensuring the efficiency and effectiveness of water reuse systems requires a systemic, comprehensive, and transdisciplinary approach [14]. Neglecting this by solely prioritizing the economic dimension in public policies leads to the deterioration of natural resources, disregarding society and exacerbating poverty and hardship in economically disadvantaged countries [15]. In addition to the financial analysis, a comprehensive economic evaluation of water reuse systems must account for externalities to fully capture their broader performance and societal benefits [16].
To systematically quantify and assess the impacts of both CW and RW harvesting systems across environmental, economic, and social dimensions, sustainability assessments are essential tools. These assessments provide a structured framework to evaluate the long-term implications of water reuse systems and their alignment with broader sustainability goals. Life Cycle Sustainability Assessment (LCSA) emerges as a valuable tool in this context [17], incorporating multi-criteria decision analysis (MCDA) to weigh and integrate diverse criteria effectively [18].
While most studies primarily focus on environmental LCA or economic feasibility when comparing alternatives, research addressing the three dimensions of LCSA regarding decentralized water reuse systems remains limited. Even though there are some notable exceptions, such as the studies by [19,20], their focus primarily remains on advanced wastewater treatment systems and centralized systems, respectively. In addition, other relevant studies [21,22,23] have analyzed decentralized GW treatment systems using LCA methodology; however, these works have focused predominantly on the environmental dimension and have not assessed hybrid systems combining GW treatment and RW harvesting. Therefore, the present study aims to evaluate the environmental, social, and economic impacts associated with water reuse scenarios in different contexts and scales in Brazil and Germany, specifically focusing on hybrid systems involving GW treatment and reuse as well as RW harvesting.

2. Materials and Methods

2.1. Description of Scenarios

Four case studies in Brazil and Germany were analyzed, investigating the implementation of RW harvesting and GW treatment in both multi-dwelling and single-dwelling buildings. Comparing German and Brazilian scenarios allows for an assessment of potential climatic and socioeconomic effects on the performance of decentralized water reuse systems. The main objectives of this study are to simulate a benchmark for each case study based on the performance of conventional systems and to investigate the potential impacts of decentralized water reuse systems in comparison with traditional systems of urban water management practices—and not to conduct direct comparisons among all the scenarios.
The benchmark scenarios (1b, 2b, 3b, and 4b) are based on the existing conventional drinking water supply systems and wastewater treatment plants (WWTPs) available in the respective locations, which serve significantly larger populations than the decentralized alternatives. However, in this study, a person-equivalent functional unit (FU) is applied across all scenarios. Accordingly, the environmental, economic, and social impacts attributed to centralized systems are proportionally allocated on a per capita basis, following the common practice in LCA. For instance, the WWTP models used in the environmental LCA reflect facilities with capacities of approximately 70,000 person-equivalents. Table 1 provides an overview of the key characteristics of the case studies and scenarios addressed, including the population served and a description of the GW treatment and RW harvesting systems.
It is important to clarify that this study focuses specifically on the reuse potential of GW and RW, excluding blackwater and urine from the system boundaries. This assumption ensures methodological consistency across all scenarios. In scenario 2a, for instance, the real system includes the separate management of urine and feces through struvite precipitation and composting, respectively [26]. However, for the purpose of this study, only the treated greywater conveyed to the evaporation pond is considered and hypothetically assumed to be reused. Similarly, in the centralized benchmark scenarios (1b, 2b, 3b, 4b), although combined domestic wastewater (greywater + blackwater) is treated in practice, our analysis only isolates the greywater volume fraction that corresponds to the portion treated separately in the decentralized alternatives. This approach enables a focused evaluation of partial wastewater reuse, without implying a complete substitution of centralized systems. This study does not aim to disqualify centralized WWTPs, but rather to demonstrate the potential sustainability gains of reusing a portion of domestic wastewater prior to its collection and treatment.
In addition, we adopt a methodological assumption that the GW and RW harvesting systems will meet 40% of the total annual household water demand, based on estimates from [29,30]. However, the actual reuse rates in our case studies may not reach this potential. Limitations due to user behavior, regulatory restrictions, and system inefficiencies are common challenges that can hinder the full system utilization.

2.2. LCSA Framework

The LCSA was conducted, integrating the environmental (LCA), economic (LCC), and social (S-LCA) dimensions of sustainability, and following the principles established by [31]. The primary function of the systems evaluated was to provide non-potable water for reuse, ensuring human health protection and reducing environmental impacts associated with wastewater discharge and RW drainage, thereby safeguarding ecosystems from pollution. The system boundaries and descriptions of the evaluated scenarios are presented in the Supplementary Materials (Section S1, Figure S1—System boundaries of scenarios).
The LCSA adopted a cradle-to-gate boundary, covering the construction, operation, and maintenance phases of both centralized and decentralized water systems. The FU of this study was defined as the water consumption per person equivalent and year. Therefore, in each scenario, a water balance was established, considering the demand and supply for high-quality drinking water, treated GW, and RW harvesting. Given the various functions associated with water reuse systems due to the management of different water flows (GW, RW), the system boundary was expanded to include water supply, wastewater treatment, and RW harvesting. Consequently, the amount of water saved through the use of RW or treated GW was deducted from the total water consumption that would have occurred in the absence of these systems.
To estimate the supply and demand of water, our analysis took into account the population equivalent for each scenario, along with a daily average water consumption of 152 L per person in Brazil and 127 L per person in Germany [32]. Furthermore, in alignment with the findings by [33], it was considered that approximately 70% of the wastewater generated in a household was GW, highlighting the substantial reuse potential of water systems.

2.3. Environmental LCA

The LCA method was applied using the SimaPro 9.2 software, in alignment with ISO 14040 (2006) standards [34]. Background data in the LCI was based on the ecoinvent™ database [35], version 3.7.1 [36], with allocation at the point of substitution (Alloc Def), while foreground data were based on primary sources and the representative literature. When available, background data from the German and Brazilian datasets were prioritized, particularly for aspects such as electricity supply. In cases where such data were unavailable, global or rest-of-the-world datasets were used instead.
Data related to the construction of the systems were primarily sourced from manufacturers’ manuals and industry websites, considering the materials used in assembly, such as concrete, PVC, pumps, etc. Operational parameters for the system were estimated using Santiago v1.2 [37], a freely available sanitation planning tool developed in Dübendorf, Zurich, Switzerland. The software has been tested in diverse settings, including cities in Ethiopia, Peru, and Nepal, and was used in this study to calculate mass flows and emissions for each scenario, including phosphorus, nitrogen, water, and total solids, following [38].
The impact assessment method selected was the ReCiPe 2016 Midpoint method (Hierarchist—H), version 1.13, with global coverage [39], which is among the most recommended methods for conducting LCA studies related to wastewater treatment [40].

2.4. Life Cycle Costing

For the LCC, future cash flows were discounted to convert all costs and benefits into their present value, ensuring that the LCC calculation reflected their current worth. Thus, the present value (PV) was calculated according to Equation (1).
P V = F t ( 1 + d ) t  
where
PV = present value;
Ft = future value as net cash flow over the indicated period (EUR);
d = discount rate (%);
t = year.
All costs were accounted for in this manner, excluding the initial capital expenditure (CAPEX) incurred in the base year, for which the present value was already up-to-date. The assessment incorporated the calculation of the net present value (NPV) to determine the system’s profitability over time. The NPV represented the present value of all cash flows generated by a project over a specific period, including the project’s operational expenditure (OPEX) and the savings obtained from water reuse.
In the baseline scenarios, users incurred only standard tariffs for water and wastewater services, with no additional investments. Exceptionally, scenario 2b incorporated an additional cost due to the local government restrictions on wastewater infiltration in sensitive areas. Consequently, we accounted for the expenses of sewage collection and transportation to a nearby wastewater treatment plant by truck, which amounted to an added charge of EUR 7.5 per cubic meter [41].
Equation (2) shows the calculation of NPV. Detailed information about the calculations of CAPEX and OPEX is presented in the Supplementary Materials (Section S2, Equations (S1) to (S5)).
N P V = C F t ( 1 + d ) t I
where
NPV = net present value;
CFt = net cash flow during the period t, primarily consisting of OPEX (EUR);
d = discount rate (%);
t = number of time periods;
I = investment costs, primarily consisting of CAPEX (EUR).
All future cash flows were expressed in 2023 euros and discounted to their present value to maintain consistent purchasing power. This study was performed considering the constant price approach, which implies the use of a real interest rate, that is, an interest rate that excludes the rate of inflation. Thus, a discount rate of 12% was used. The expenditure was collected during the installation of systems or estimated according to local sources.
The present cost assessment considered both internal and external costs. To estimate external costs, we accessed LCA results using the Environmental Prices method, based on EU28 emissions in 2018 [42].

2.5. Social-LCA

The S-LCA was conducted following the guidelines provided by [43]. The assessment included the evaluation of social impacts using a qualitative approach, as recommended by [44], which supports the application of reference scale methods when direct cause–effect modeling is not feasible, enabling the use of expert judgment and context-specific knowledge to assess social performance. To assess the social performance, a five-point reference scale was adopted, as shown in Table 2. Details about the selected impact categories and stakeholder groups for the S-LCA are presented in Table 3. Each point on the scale represented a specific performance level, ranging from ideal performance (+2) to non-compliant situations (−2). Positive impacts were associated with surpassing minimum requirements and providing advantages to stakeholders, while negative impacts indicated non-compliance with local laws or international norms. This scale allowed for a comprehensive evaluation of social indicators based on various performance levels.
The assignment of scale values was based on expert judgments collected from the application of 13 questionnaires administered to professionals in the sanitation sector, as detailed in the Supplementary Materials (Section S3, Tables S1–S7). The questionnaire survey was designed following the recommendations for primary data collection outlined in [43]. Respondents were selected among researchers affiliated with academic institutions and research groups focusing on sanitation, water reuse, and sustainable infrastructure in Brazil and Germany.
These questionnaires were distributed both digitally and in printed form between January and July 2024. Respondents were briefed on the objective of the study and the evaluation criteria used, and were instructed to assess each indicator according to their technical and contextual knowledge. After assigning a score to each indicator relative to the reference scale, the impact assessment involved normalizing and aggregating the scores, culminating in the composite index for the social dimension.

2.6. Multi-Criteria Decision Analysis

Within the LCSA framework, MCDA was used to integrate the indicators for each sustainability dimension, ensuring a comprehensive evaluation of their combined impact on decision-making. Table 3 provides the details of the indicators selected for each dimension. Each indicator was chosen to reflect critical aspects of sustainability within the environmental, economic, and social domains [16]. The inclusion of both qualitative and quantitative indicators enabled a balanced and inclusive assessment of different scenarios.
To ensure a standardized comparison across the environmental, economic, and social dimensions, selected indicators were first normalized using the min/max procedure as detailed by [45]. For each indicator i within a dimension D (where D can be environmental E, economic C, or social S), the normalized score NSi,D was calculated according to Equation (3).
N S i ,   D = V a l u e i ,   D M i n i ,   D M a x i ,   D M i n i ,   D
Subsequently, these normalized indicators were aggregated for each dimension to form a composite index score. For each dimension D, the composite index score CISD was the sum of all normalized indicators within that dimension, as shown in Equation (4).
C I S   D = i D N S i ,   D
The overall sustainability score OSS for each scenario was calculated by summing the weighted composite index scores across all dimensions, according to Equation (5).
O S S = ω E   x   C I S E + ω C   x   C I S C + ω S   x   C I S S
Initially, no weights were assigned to any of the dimensions or the indicators within each dimension. However, for the sensitivity analysis, weights were applied to each dimension separately to assess their impact on the results. This analysis varied the weights, where one dimension was assigned a weight of two while maintaining a weight of one for the others, as shown in Table 4, which presented three alternative weighting scenarios (i, ii, and iii).
This approach did not prioritize any specific dimension or technology for decision-making, as the choice of weighting method is subjective and can be contentious. The varying weightings in each scenario allowed for a comparative analysis of how placing different emphasis on each dimension can influence the overall sustainability assessment results.

2.7. Limitations

This study relies on a range of assumptions and estimations from the literature and responses of experts, which may introduce variations in the calculated results. While we have used the most reliable data available, there is always inherent uncertainty in the precision and completeness, especially regarding site-specific conditions. Although we incorporate several impact categories in our LCAs, there are further environmental, social, and economic impacts beyond the scope of this analysis, such as biodiversity loss and cultural impacts, among others. In addition, the methods and databases used, such as the Environmental Prices method for the EU28, are primarily oriented towards European impacts, not Brazilian.
In the context of our S-LCA, we apply a qualitative approach due to limitations in accessing comprehensive databases on social impacts. We are unable to distribute questionnaires to all stakeholders involved due to logistical challenges, underscoring the need for more comprehensive data collection in future research.

3. Results

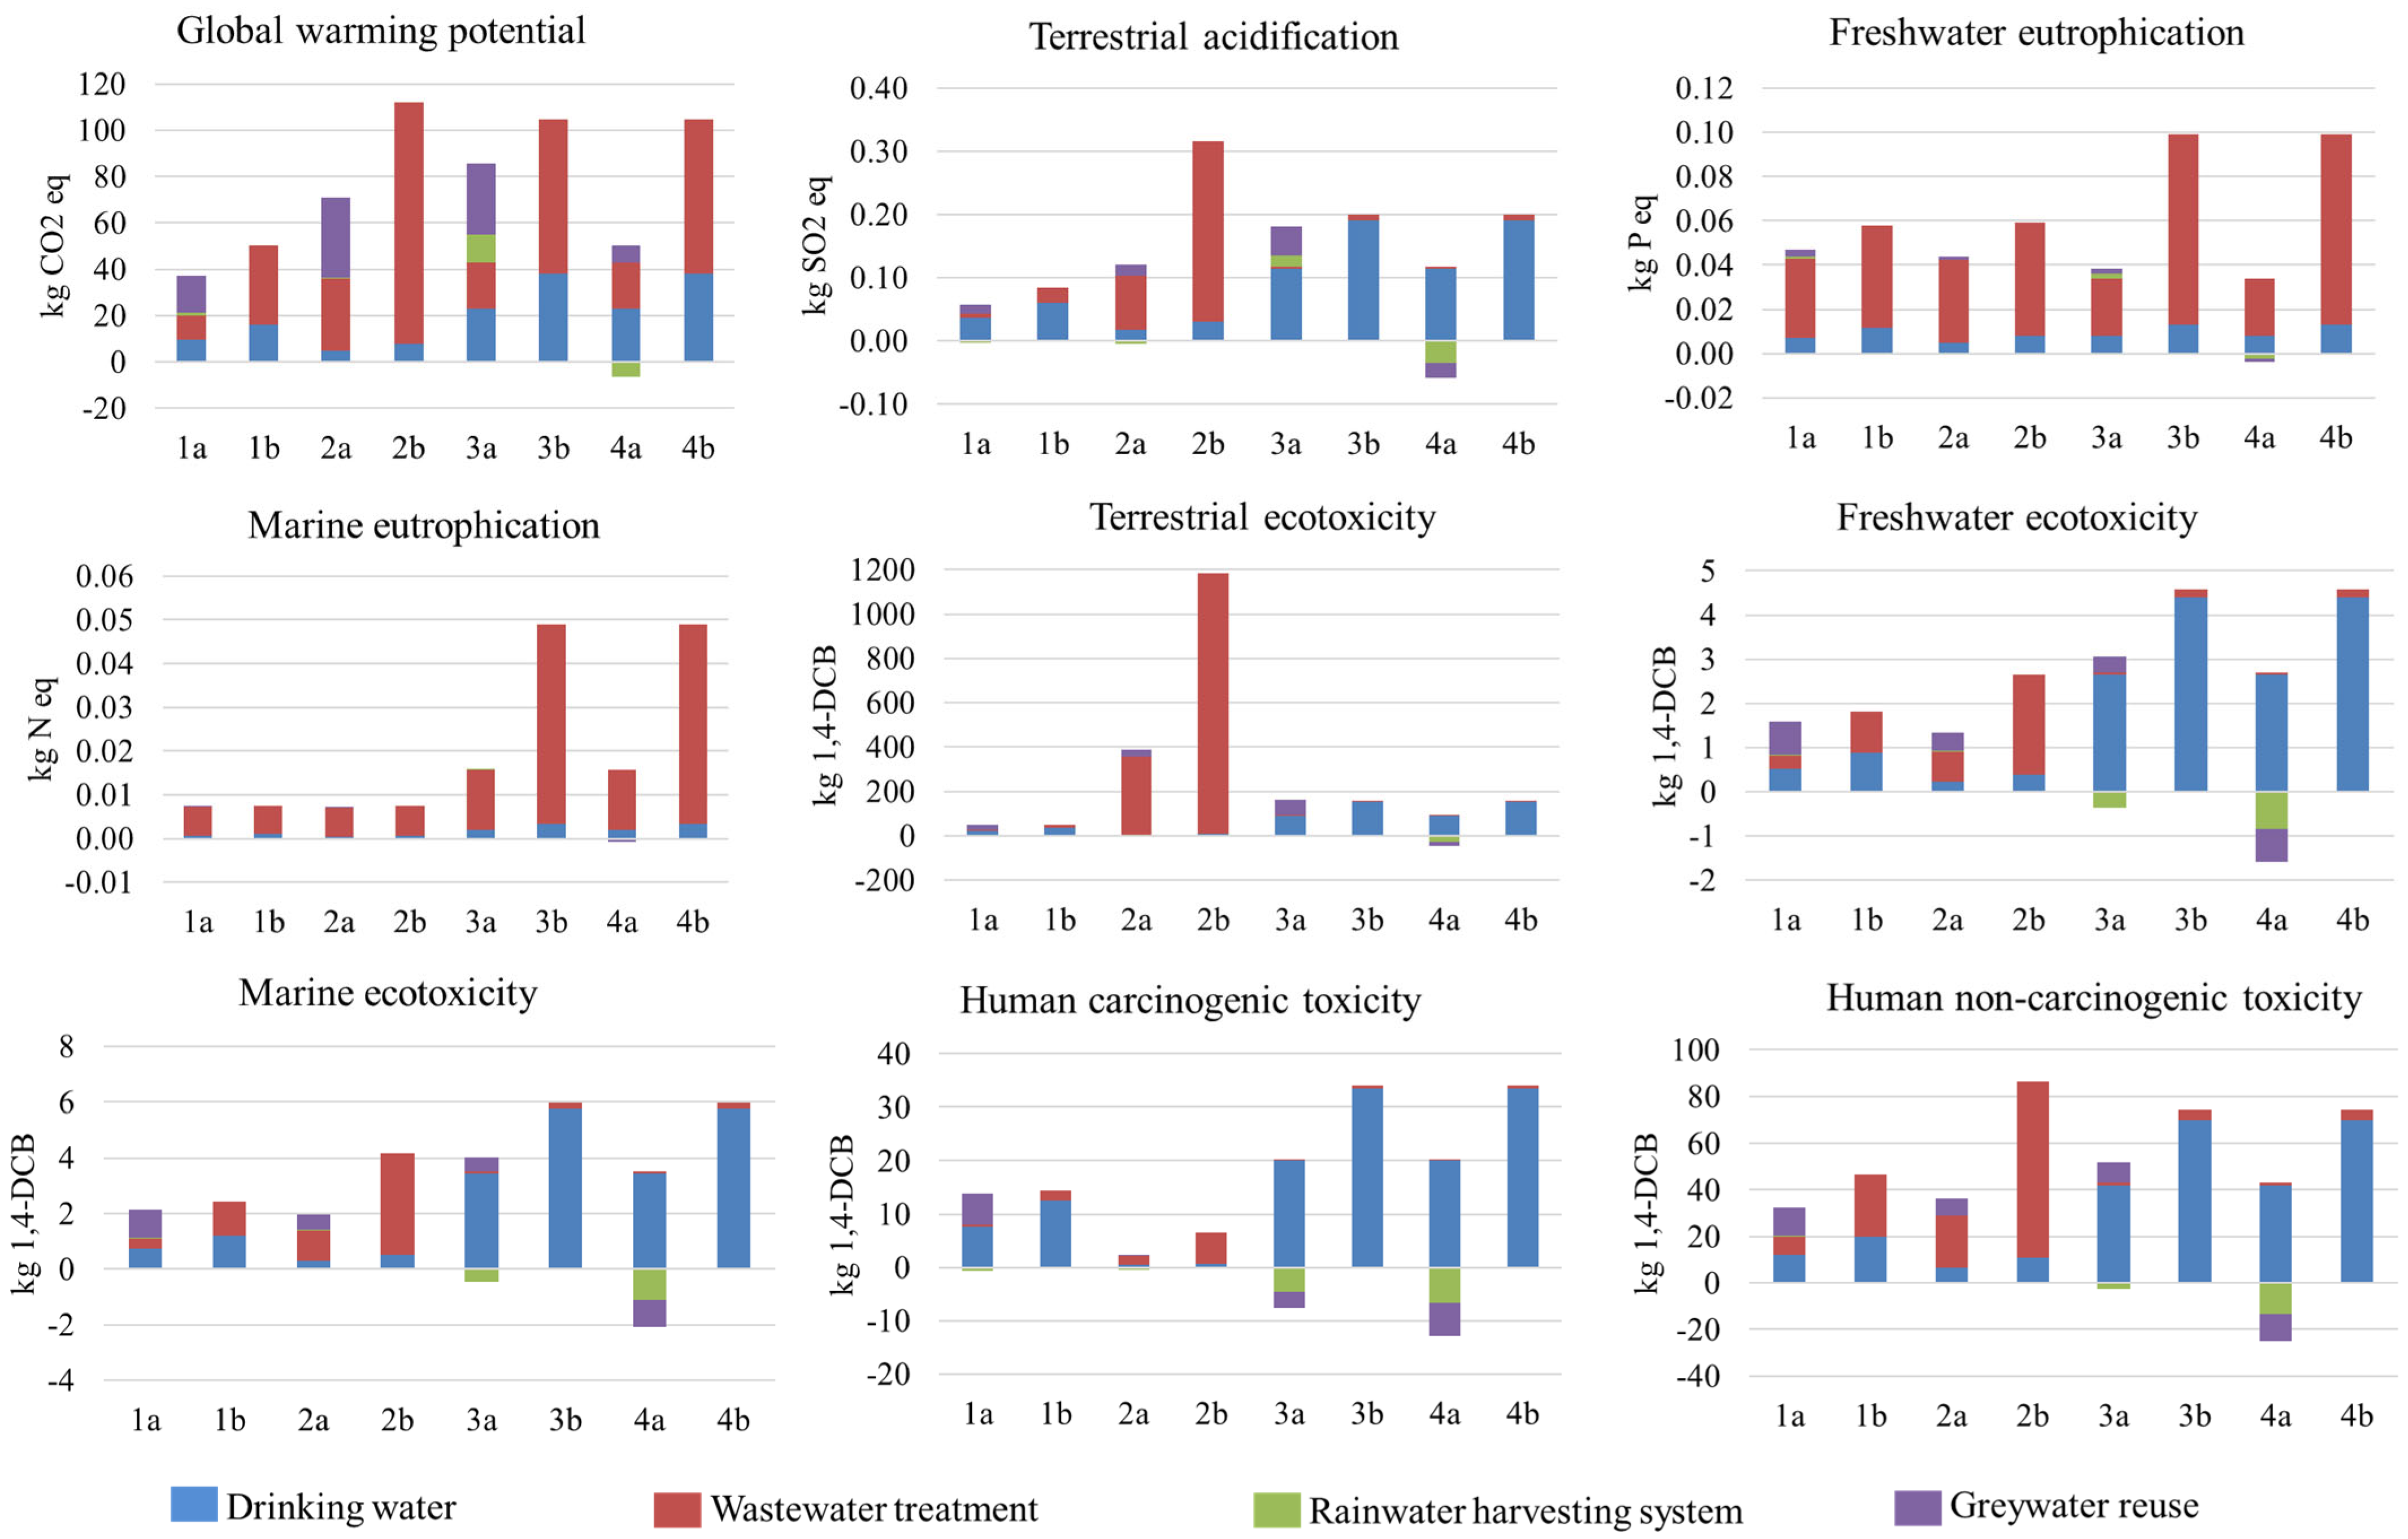
3.1. Environmental LCA Results

Figure 1 shows the LCIA results at the characterization level for each scenario, evaluated across multiple impact categories as selected from the Recipe 2016 method. It should be noted that the results at the normalization level were used to calculate the sustainability score for each scenario, with results being aggregated and weighted. For further details, refer to the Supplementary Materials (Section S4, Table S8—LCIA Results at the characterization level for each scenario, and Table S9—LCIA Results at the normalization level for each scenario).

3.2. Life Cycle Costing Results

Figure 2 illustrates the contribution of CAPEX components across the proposed scenarios and presents a Pareto chart depicting different items within the systems. This analysis allows us to identify the costliest aspects of the manufacturing and installation stages for different scenarios.
The cost breakdown for the water reuse systems across the different scenarios shows the variability in costs related to GW treatment and RW harvesting investments. Differences in expenditure between such systems are influenced by several factors, primarily the volume and dimensions of the systems, which dictate the extent of the materials and labor required. Through a Pareto analysis (as indicated by the orange line in Figure 2), the components that constitute 80% of the costs in the proposed water reuse systems are defined as follows: water storage, labor, and treatment infrastructure.
For the baseline scenarios, costs are limited to water and wastewater tariffs, as detailed in Table 5, except for scenario 2b, due to the transportation of wastewater by truck to a local WWTP. In the water reuse scenarios (1a, 2a, 3a, and 4a), the savings correspond to the avoided costs of their respective baseline counterparts. It is important to highlight that scenario 3a benefits from an additional financial incentive linked to water reuse systems. According to [46], Law No. 150 of 20 January 2010, establishes the IPTU Ecológico, which grants a 4% reduction in property tax (IPTU) for buildings equipped with RW harvesting or water reuse systems. Given that the IPTU tax rate is set at 1% of the property’s appraised market value, an estimated property value of €300,000.00 in scenario 3a results in an annual IPTU of €3000.00. With the implementation of the water reuse system, this tax reduction would amount to €120.00 per year under the IPTU Ecológico program. This benefit is not considered for scenario 4a, as it represents a multi-dwelling building where the IPTU is calculated under a different tax structure.
Figure 3 shows the NPV of the proposed scenarios considering both the initial capital expenditures (CAPEX) and the ongoing operational expenses (OPEX), including energy consumption, maintenance, and savings, contributing to the overall financial footprint of the systems.
Figure 4 illustrates a breakdown of the external costs associated with various environmental impact categories, as calculated using the Environmental Price method [42] from LCA data. Each bar represents one of the specific scenarios, showing the externalities measured in euros per person-year (EUR/p.y), thus providing a comparative view of the environmental costs across different scenarios.

3.3. Social-LCA Results

The results derived from the questionnaires applied to water reuse specialists provide valuable insights into the social ramifications of implementing water reuse systems. Figure 5 shows a comparative assessment of the social impact scores based on the questionnaire responses. Each value represents the average score obtained by respondents for each scenario on each indicator, reflecting the collective perception of social impacts.

3.4. Sustainability Score

Figure 6 presents the consolidated sustainability scores for each scenario, offering a multidimensional perspective that synthesizes the social, environmental, and economic impacts of water reuse systems.
Scenario 1a, a multi-dwelling building in Stuttgart, Germany, achieves a higher sustainability score compared to its baseline (1b). However, unlike larger scale systems, its capacity is limited to 10 residents, which restricts cost distribution. Additionally, the integration of a steel container to a house the CW system likely contributes to higher material-related impacts. Despite these challenges, the system successfully demonstrates the feasibility of decentralized solutions in urban settings, even where a compact and engineered design is required.
Scenario 2a, a self-sufficient single-dwelling in Reinighof, Germany, exhibits the highest sustainability score relative to its baseline (2b). This is largely due to the avoidance of wastewater transportation. In the baseline scenario 2b, sewage is collected by means of a septic tank and transported 10 km by truck for treatment, contributing significantly to environmental and economic burdens. Additionally, the small-scale design of scenario 2a allows for efficient treatment and water reuse, while the rural setting reduces infrastructure dependency.
Scenario 3a, a single-family-dwelling in Campo Grande, Brazil, illustrates both the potential and challenges of decentralized water reuse at a small scale. Its economic feasibility is constrained by serving only three residents, which extends the payback period compared to larger scale implementations like 4a. Additionally, the initial investment required for the EvaTAC system, combined with a lower per capita demand for reused water, negatively affects its cost-effectiveness. Nonetheless, its environmental benefits still surpass those of its benchmark (3b), reinforcing the viability of decentralized water reuse even in small residential settings.
Scenario 4a, a 19-story residential building in Brazil, also demonstrates significant improvements over its baseline (4b). This scenario achieves a high score, reinforcing the idea that large-scale systems tend to be more cost-effective due to economies of scale. Their ability to serve a greater number of users while distributing the initial investment across a larger population makes them more economically feasible in the long term.
Baseline scenarios (1b, 2b, 3b, 4b) consistently exhibit lower scores, indicating that conventional water supply systems impose higher environmental burdens and long-term economic costs. This underscores the potential of decentralized solutions to enhance sustainability, particularly in areas where infrastructure limitations reduce the efficiency of centralized systems.

3.5. Sensitivity Analysis

Figure 7 provides insights into the outcomes of our sensitivity analysis. The impact of altering weights across the three dimensions—environmental, social, and economic—is explored.
The sensitivity analysis confirms that decentralized water reuse systems consistently outperform their baselines in environmental, economic, and social terms. The results demonstrate that, regardless of the weighting scenario, these systems maintain strong sustainability scores, reinforcing their robustness across different evaluation perspectives. The analysis also highlights the impact of subjective weighting choices in sustainability assessments, emphasizing the importance of balanced decision-making approaches that integrate multiple perspectives while ensuring that economic feasibility, environmental performance, and social benefits are adequately addressed.

4. Discussion

In the environmental LCA, when analyzing the environmental impact categories across the scenarios at the characterization level, a clear trend emerges where the water reuse scenarios (1a,2a,3a and 4a) have lower environmental impacts compared to their corresponding benchmarks (1b, 2b, 3b, and 4b). The environmental impacts of decentralized water reuse systems are influenced by a range of factors, including operational energy demands, material used during construction, and the handling of emissions and nutrients.
Categories such as global warming potential (GWP) and terrestrial acidification (TAC) are strongly influenced by electricity consumption, emissions from transportation, and those generated during treatment processes. Decentralized systems generally demonstrate lower impacts in these categories due to their reduced reliance on energy-intensive centralized infrastructure [47]. In the case of terrestrial ecotoxicity (TEC), the reduction in transport-related emissions in decentralized systems plays a significant role in minimizing overall impacts.
For nutrient-related categories, such as freshwater eutrophication (FEU) and marine eutrophication (MEU), decentralized systems generally exhibit superior performance by enabling on-site treatment solutions, such as CW, which can partially retain nutrients or allow their uptake by vegetation [48]. However, this effect may vary depending on climate conditions and operational periods [49]. In countries like Germany, for instance, centralized wastewater treatment plants typically include nutrient removal processes [50], which can result in comparable or even lower eutrophication impacts, especially in colder seasons when CW performance is reduced. In contrast, in Brazil, wastewater treatment plants with nutrient removal capabilities are generally limited to major urban centers, with few exceptions [51].
Conversely, categories like human carcinogenic toxicity (HCT) are more affected by the materials used in the construction of decentralized systems. Components such as steel, aluminum, and copper significantly contribute to these impacts. A similar pattern is observed in the category of human non-carcinogenic toxicity (HNT), with additional contributions stemming from fossil fuel combustion. These results corroborate the findings by [20], emphasizing the role of material selection in toxicity impacts.
Despite these variations, decentralized systems consistently outperform their baseline counterparts across all selected impact categories, highlighting their potential to mitigate environmental burdens. Nevertheless, these findings underscore the critical need for thoughtful material selection and optimized system design to further enhance environmental performance [52].
The NPV results in Figure 3 indicate that scenarios 1a and 3a do not achieve a positive balance within the 15-year analysis period, suggesting that the initial capital expenditures (CAPEX) are not offset by the water savings within that timeframe. This outcome can be attributed to their smaller scale, serving only ten and three users, respectively, which limits the distribution of costs and reduces overall savings. Such evidence implies that, while there may be long-term benefits to these systems, their financial viability is not demonstrated by the NPV figures alone within the 15-year span. Thus, reducing the CAPEX or enhancing the savings could directly enhance the NPV, making water reuse systems more financially viable. Furthermore, imminent future increases in water tariffs would amplify the economic benefits of these systems, as greater water savings would improve NPV [53]. In line with this, Ref. [54] emphasize that local economic factors, such as energy and water tariffs, can significantly influence the perceived cost–benefit and adoption potential of decentralized water reuse systems.
On the other hand, scenario 4a outperforms the others, achieving a positive NPV within the fourth year due to its large-scale design, which serves a higher number of users. This outcome suggests that larger scale systems have greater potential to reach financial viability faster than smaller scale systems like 3a, even when considering the additional financial benefit included for scenario 3a. Similar trends have been observed in previous studies [55], which highlight the economic advantages of scaling up water reuse systems to enhance cost-effectiveness. Additionally, scenario 2a also reaches a positive NPV, but in the eighth year, driven by additional savings relative to its baseline counterpart (2b), which incurs higher costs due to the mandatory transport of sewage to a local WWTP imposed by local infiltration restrictions.
For the external costs, impact categories such as climate change, particulate matter formation, and human toxicity are notably significant. The higher values observed in scenarios 2b, 3b, and 4b indicate greater cumulative external costs. In scenario 2b, this is primarily due to the transportation of wastewater by truck to a WWTP, which contributes substantially to both climate change, particulate matter formation, human toxicity, and terrestrial acidification impacts. In scenarios 3b and 4b, part of the elevated climate change impact is associated with emissions from anaerobic treatment processes, where methane is partially converted to CO2, thus contributing to greenhouse gas emissions. Climate change impacts, represented by the largest share of external costs, are significantly reduced in scenarios where water reuse is applied, due to the lower energy demands and reduced dependence on fossil fuel-based infrastructure. Similarly, particulate matter formation, which is closely linked to emissions from fuel combustion and industrial processes, is mitigated in water reuse scenarios.
The analysis of social impacts reveals that scenarios with integrated water reuse systems tend to score equal to or higher than their counterparts in areas such as health and safety, suggesting that such measures do not inherently pose a perceived risk to end-users. However, public acceptance of water reuse remains a challenge, as knowledge gaps and trust in water authorities significantly influence perceptions. Studies indicate that, while the general concept of water reuse is supported, direct consumption faces significant resistance, with much higher acceptance for non-potable applications such as irrigation and toilet flushing [56].
Water reuse systems also appear to require more specialized expertise, highlighting the importance of skilled labor and the opportunity for professional development within this sector [57]. While the local employment indicator reveals that baseline scenarios, typified by conventional water and wastewater services, may provide a broader scope for job creation, this reflects the current market structure rather than the full potential of employment opportunities within alternative water reuse systems. Furthermore, these scenarios are often associated with enhanced public commitments to sustainability issues and technology development, indicating a societal appreciation for innovative environmental solutions [58].
According to the integrated sustainability scores that combine environmental, economic, and social dimensions, the proposed scenarios (1a, 2a, 3a, 4a) show better sustainability performance when compared to their baseline equivalents (1b, 2b, 3b, 4b), demonstrating the benefits of decentralized water reuse systems compared to conventional public services. These findings align with previous studies, which demonstrate that decentralized and semi-distributed water reuse systems achieve superior sustainability performance compared to conventional centralized approaches [20].
Additionally, while this sensitivity analysis applies varying weights to each dimension, further refinements could explore adjustments in key parameters, such as weighting at the indicator and impact category levels. For instance, incorporating the analytic hierarchy process (AHP) as a multi-criteria decision-making method could provide a more structured approach to evaluating different weighting scenarios [20,45].
Regarding the differences between the countries analyzed, Germany’s stringent environmental regulations and well-established water management policies support an advanced centralized infrastructure, allowing the country to focus on water reuse as a means of reducing environmental impacts and enhancing resilience to climate variability. The European Union Regulation 2020/741 [59] establishes minimum quality and monitoring requirements for treated wastewater reuse, creating a harmonized legal framework that encourages the safe and transparent uptake of water reuse practices while enhancing public confidence and setting clear quality benchmarks.
In contrast, Brazil, while making progress in sustainability policies (e.g., IPTU Ecológico), still faces challenges in policy enforcement and gaps in centralized wastewater treatment coverage. This makes water reuse systems a more necessary solution in certain contexts, particularly where conventional infrastructure is lacking or insufficient. Recent updates to the national legal framework, such as Law No. 14.026/2020 [60], have empowered the National Water and Basic Sanitation Agency (ANA) to set reference standards for regulation, including water reuse, which represents an important step forward.
Additional barriers to the widespread adoption of decentralized water reuse systems include limitations in operation and maintenance capacities, as well as the need for alignment with local risk management requirements, which are essential to ensure health protection, especially when nature-based solutions are involved [61,62]. These differences highlight the importance of adapting water reuse strategies to local conditions, ensuring that regulatory frameworks, infrastructure development, and economic feasibility are considered in the implementation of sustainable water management solutions.

5. Conclusions

This study aims to assess the sustainability performance of decentralized water reuse systems in comparison to conventional centralized approaches. The findings demonstrate that decentralized water reuse systems offer substantial sustainability advantages compared to conventional centralized approaches, which focus on water treatment for safe discharge rather than reuse. Across environmental, social, and economic dimensions, the proposed decentralized scenarios (1a, 2a, 3a, 4a) consistently outperform their baseline counterparts (1b, 2b, 3b, 4b), with improvements of up to 4.8 times in the overall score (e.g., 3a vs. 3b). In the economic dimension, scenario 4a performs nearly 4.7 times better than its counterpart 4b, while scenario 1a more than doubles the score of 1b. In the environmental dimension, scenario 2a achieves the highest score overall, performing approximately 1.2 times better than 2b, whereas scenario 4a scores over 3.6 times higher than 4b. The social dimension exhibits remarkable increases as well, with scenario 3a scoring more than three times higher than 3b.
These results contribute to the existing literature by quantifying, through a Life Cycle Sustainability Assessment (LCSA), the comparative performance of decentralized reuse systems in both urban and rural contexts in Brazil and Germany. These findings underscore the potential of integrated water reuse solutions to mitigate environmental burdens, enhance social benefits, and achieve financial viability, especially when externalities are considered.
From an environmental perspective, water reuse systems significantly reduce impacts across multiple categories, particularly global warming potential, terrestrial acidification, and eutrophication-related indicators. This is largely attributed to lower energy demands, reduced transportation emissions, and the ability to treat and reuse water on site, using NBSs such as CW. Nonetheless, certain categories such as human toxicity still require optimization, especially in the selection of construction materials, highlighting a limitation of current system configurations.
Economically, the inclusion of externalities in the LCC analysis demonstrates that water reuse systems can be financially feasible. While smaller scale systems may have longer payback periods, large-scale decentralized implementations, such as scenario 4a, benefit from economies of scale, making them more cost-effective in the long term. Nonetheless, NBSs can help bridge the economic gap for smaller scale applications, as they offer cost-effective alternatives in both construction and maintenance, thereby opening new opportunities for the broader adoption of decentralized water reuse strategies. These results highlight the importance of context-specific financial planning and policy incentives, such as tax reductions, to enhance economic feasibility and promote the implementation of decentralized solutions.
Socially, water reuse systems are perceived as being beneficial across multiple indicators, particularly in health and safety, public commitments to sustainability, and technology development. While public acceptance of water reuse remains challenging, the results suggest that well-designed and properly communicated reuse initiatives can foster societal support. Moreover, these systems contribute to workforce development by requiring specialized expertise and align with broader sustainability commitments, reinforcing the role of technology adoption in achieving water resilience.
Ultimately, water reuse systems present a viable and sustainable alternative and/or complementation to conventional wastewater treatment approaches that focus solely on discharge rather than reuse. Their successful implementation depends on optimizing material selection, addressing financial feasibility through policy incentives, and enhancing public awareness and acceptance. Future research should explore long-term performance monitoring and further refinements in decision-making frameworks to support the broader adoption of water reuse solutions in both urban and rural contexts. In addition, future studies could assess the break-even point for the environmental, economic, and social performance of decentralized reuse systems, particularly under lower reuse efficiency (as this study assumes a 40% reuse rate), to better inform implementation thresholds and policy development.

Supplementary Materials

The following supporting information can be downloaded at: https://figshare.com/s/a2d1f8ad29f1829809f0 (accessed on 28 May 2025), Figure S1: System boundaries for scenarios 1–4, each including a water reuse sub-scenario (a) and a benchmark sub-scenario (b); Table S1: Five-point reference scale adopted to assess the performance of the social indicators in each scenario; Table S2: Reference scale for the social indicator “health and safety” (stakeholder group: end-users); Table S3: Reference scale for the social indicator “expertise required” (stakeholder group: workers); Table S4: Reference scale for the social indicator “access to material resources” (stakeholder group: local community); Table S5: Reference scale for the social indicator “local employment” (stakeholder group: local community); Table S6: Reference scale for the social indicator “public commitments to sustainability issues” (stakeholder group: society); Table S7: Reference scale for the social indicator “technology development” (stakeholder group: society); Table S8: LCIA results at the characterization level for each scenario across selected environmental impact categories; Table S9: LCIA results at the normalization level for each scenario across selected environmental impact categories.

Author Contributions

Writing—original draft preparation, methodology, formal analysis, and data curation: H.H.d.S.S.; Investigation: H.H.d.S.S. and C.G.M.; Conceptualization, visualization, writing—review and editing, and funding acquisition: P.L.P., C.G.M., and H.S.; Validation: M.Á.B.; Supervision: H.S.; Project administration: P.L.P. All authors have read and agreed to the published version of the manuscript.

Funding

This research was funded by CAPES/DAAD under the PROBRAL Programme (project No. 88881.371339/2019-01) and DAAD PPP project IWA-II (Project-ID: 57597708).

Institutional Review Board Statement

Ethical review and approval were not applicable for this study, as it involved anonymous opinion surveys and did not fall under the scope of mandatory ethics review according to applicable national regulation (see Resolution CNS No. 510/2016, Article 1, item I—‘This Resolution does not apply to: I—public opinion research with unidentified participants.’).

Data Availability Statement

The original contributions presented in this study are included in the article/Supplementary Materials. Further inquiries can be directed to the corresponding author(s).

Acknowledgments

The authors acknowledge the support received from the following: National Council for Scientific and Technological Development—CNPq; Coordination for the Improvement of Higher Education Personnel—CAPES; University of Kaiserslautern-Landau, where part of this research was conducted; Federal University of Mato Grosso do Sul—UFMS; Fundação de Amparo à Pesquisa do Estado de Minas Gerais—FAPEMIG; National Institute of Science and Technology in Sustainable Sewage Treatment Plants—INCT Sustainable Sewage Treatment Plants; and Fundação de Apoio ao Desenvolvimento do Ensino, Ciência e Tecnologia de Mato Grosso do Sul—FUNDECT/MS.

Conflicts of Interest

The authors declare no conflicts of interest.

Abbreviations

The following abbreviations are used in this manuscript:
CAPEXCapital expenditure
CFtNet cash flow during the period t
CISComposite index score
CWConstructed wetlands
DCBDichlorobenzene (used in toxicity metrics)
EXTExternalities
FUFunctional unit
GWGreywater
GWPGlobal warming potential
HCTHuman carcinogenic toxicity
HNTHuman non-carcinogenic toxicity
IPTUImposto Predial e Territorial Urbano (Property Tax—Brazil)
LCALife Cycle Assessment
LCCLife Cycle Costing
LCIALife cycle impact assessment
LCSALife Cycle Sustainability Assessment
MCDAMulti-criteria decision analysis
MEUMarine eutrophication
NBSNature-based solution
NPVNet present value
OPEXOperational expenditure
OSSOverall sustainability score
RWRainwater
S-LCASocial Life Cycle Assessment
SDGSustainable Development Goal
TECTerrestrial ecotoxicity
TAC Terrestrial acidification
WWTP Wastewater treatment plant

References

  1. Lv, T.; Wang, L.; Xie, H.; Zhang, X.; Zhang, Y. Evolutionary overview of water resource management (1990–2019) based on a bibliometric analysis in Web of Science. Ecol. Inform. 2021, 61, 101218. [Google Scholar] [CrossRef]
  2. IPCC—Intergovernmental Panel on Climate Change. Global Warming of 1.5 °C. An IPCC Special Report on the Impacts of Global Warming of 1.5 °C Above Pre-Industrial Levels and Related Global Greenhouse Gas Emission Pathways, in the Context of Strengthening the Global Response to the Threat of Climate Change, Sustainable Development, and Efforts to Eradicate Poverty; Cambridge University Press: Cambridge, UK; New York, NY, USA, 2018. [Google Scholar]
  3. Oral, H.V.; Carvalho, P.; Gajewska, M.; Ursino, N.; Masi, F.; van Hullebusch, E.D.; Kazak, J.K.; Exposito, A.; Cipolletta, G.; Andersen, T.R.; et al. A review of nature-based solutions for urban water management in European circular cities: A critical assessment based on case studies and literature. Blue-Green Syst. 2020, 2, 112–136. [Google Scholar] [CrossRef]
  4. Leong, J.Y.C.; Balan, P.; Chong, M.N.; Poh, P.E. Life-cycle assessment and life-cycle cost analysis of decentralised rainwater harvesting, greywater recycling and hybrid rainwater-greywater systems. J. Clean. Prod. 2019, 229, 1211–1224. [Google Scholar] [CrossRef]
  5. Arden, S.; Ma, X. Constructed wetlands for greywater recycle and reuse: A review. Sci. Total Environ. 2018, 630, 587–599. [Google Scholar] [CrossRef]
  6. Zhao, Y.; Ji, B.; Liu, R.; Ren, B.; Wei, T. Constructed treatment wetland: Glance of development and future perspectives. Water Cycle 2020, 1, 104–112. [Google Scholar] [CrossRef]
  7. Gómez-Monsalve, M.; Domínguez, I.C.; Yan, X.; Ward, S.; Oviedo-Ocaña, E.R. Environmental performance of a hybrid rainwater harvesting and greywater reuse system: A case study on a high water consumption household in Colombia. J. Clean. Prod. 2022, 345, 131125. [Google Scholar] [CrossRef]
  8. Ferreira, C.S.S.; Kašanin-Grubin, M.; Solomun, M.K.; Sushkova, S.; Minkina, T.; Zhao, W.; Kalantari, Z. Wetlands as nature-based solutions for water management in different environments. Curr. Opin. Environ. Sci. Health 2023, 33, 100476. [Google Scholar] [CrossRef]
  9. Ingrao, C.; Failla, S.; Arcidiacono, C. A comprehensive review of environmental and operational issues of constructed wetland systems. Curr. Opin. Environ. Sci. Health 2020, 13, 35–45. [Google Scholar] [CrossRef]
  10. Teston, A.; Piccinini Scolaro, T.; Kuntz Maykot, J.; Ghisi, E. Comprehensive Environmental Assessment of Rainwater Harvesting Systems: A Literature Review. Water 2022, 14, 2716. [Google Scholar] [CrossRef]
  11. Boano, F.; Caruso, A.; Costamagna, E.; Ridolfi, L.; Fiore, S.; Demichelis, F.; Galvão, A.; Pisoeiro, J.; Rizzo, A.; Masi, F. A review of nature-based solutions for greywater treatment: Applications, hydraulic design, and environmental benefits. Sci. Total Environ. 2020, 711, 134731. [Google Scholar] [CrossRef]
  12. Hussain, M.I.; Muscolo, A.; Farooq, M.; Ahmad, W. Sustainable use and management of non-conventional water resources for rehabilitation of marginal lands in arid and semiarid environments. Agric. Water Manag. 2019, 221, 462–476. [Google Scholar] [CrossRef]
  13. Waly, M.M.; Mickovski, S.B.; Thomson, C.; Amadi, K. Impact of Implementing Constructed Wetlands on Supporting the Sustainable Development Goals. Land 2022, 11, 1963. [Google Scholar] [CrossRef]
  14. Hargreaves, A.J.; Farmani, R.; Ward, S.; Butler, D. Modelling the future impacts of urban spatial planning on the viability of alternative water supply. Water Res. 2019, 162, 200–213. [Google Scholar] [CrossRef] [PubMed]
  15. Woltersdorf, L.; Zimmermann, M.; Deffner, J.; Gerlach, M.; Liehr, S. Benefits of an integrated water and nutrient reuse system for urban areas in semi-arid developing countries. Resour. Conserv. Recycl. 2017, 128, 382–393. [Google Scholar] [CrossRef]
  16. Garayo Junior, F.H.; Souza, H.H.S.; do Amaral, K.G.C.; Gutierrez, K.G.; Lima, P.M.; Paulo, P.L. Sustainable management of sanitation: Technical Note 1—Sustainability assessment in sewage system. Cad. Técnicos Eng. Sanit. Ambient. 2022, 2, 5–21. [Google Scholar] [CrossRef]
  17. Guinée, J. Life Cycle Sustainability Assessment: What Is It and What Are Its Challenges? In Taking Stock of Industrial Ecology; Clift, R., Druckman, A., Eds.; Springer: Berlin/Heidelberg, Germany, 2016. [Google Scholar] [CrossRef]
  18. Hannouf, M.; Assefa, G. A life cycle sustainability assessment-based decision-analysis framework. Sustainability 2018, 10, 3863. [Google Scholar] [CrossRef]
  19. Tarpani, R.R.Z.; Azapagic, A. Life cycle sustainability assessment of advanced treatment techniques for urban wastewater reuse and sewage sludge resource recovery. Sci. Total Environ. 2023, 869, 161771. [Google Scholar] [CrossRef]
  20. Opher, T.; Friedler, E.; Shapira, A. Comparative life cycle sustainability assessment of urban water reuse at various centralization scales. Int. J. Life Cycle Assess. 2018, 24, 1319–1332. [Google Scholar] [CrossRef]
  21. Masmoudi Jabri, K.; Nolde, E.; Ciroth, A.; Bousselmi, L. Life cycle assessment of a decentralized greywater treatment alternative for non-potable reuse application. Int. J. Environ. Sci. Technol. 2020, 17, 433–444. [Google Scholar] [CrossRef]
  22. Kobayashi, Y.; Ashbolt, N.J.; Davies, E.G.R.; Liu, Y. Life cycle assessment of decentralized greywater treatment systems with reuse at different scales in cold regions. Environ. Int. 2020, 134, 105215. [Google Scholar] [CrossRef]
  23. Rodríguez, C.; Sánchez, R.; Rebolledo, N.; Schneider, N.; Serrano, J.; Leiva, E. Life cycle assessment of greywater treatment systems for water-reuse management in rural areas. Sci. Total Environ. 2021, 795, 148687. [Google Scholar] [CrossRef]
  24. Morandi, C.; Schreiner, G.; Moosmann, P.; Steinmetz, H. Elevated vertical-flow constructed wetlands for light greywater treatment. Water 2021, 13, 2510. [Google Scholar] [CrossRef]
  25. Eisenberg, B.; Morandi, C.; Richter, P.; Well, F.; Winker, M.; Minke, R.; Steinmetz, H.; Ludwig, F. The Impulse Project Stuttgart—Stimulating Resilient Urban Development Through Blue-Green Infrastructure. In Building Resilience to Natural Hazards in the Context of Climate Change; Hutter, G., Neubert, M., Ortlepp, R., Eds.; Studien zur Resilienzforschung; Springer: Wiesbaden, Germany, 2021. [Google Scholar] [CrossRef]
  26. Xiao, J.; Alewell, U.; Bruch, I.; Steinmetz, H. Development of a self-sustaining wastewater treatment with phosphorus recovery for small rural settlements. Sustainability 2021, 13, 1363. [Google Scholar] [CrossRef]
  27. da Silva, J.B.; de Oliveira, P.J.A.; Boncz, M.Á.; Paulo, P.L. A modified constructed wetland system for greywater treatment. Desalin. Water Treat. 2017, 91, 31–39. [Google Scholar] [CrossRef]
  28. Magalhães Filho, F.J.C.; Sobrinho, T.A.; Steffen, J.L.; Arias, C.A.; Paulo, P.L. Hydraulic and hydrological aspects of an evapotranspiration-constructed wetland combined system for household greywater treatment. J. Environ. Sci. Health Part A 2018, 53, 493–500. [Google Scholar] [CrossRef]
  29. Ghisi, E.; Ferreira, D.F. Potential for potable water savings by using rainwater and greywater in a multi-storey residential building in southern Brazil. Build. Environ. 2007, 42, 2512–2522. [Google Scholar] [CrossRef]
  30. Ghisi, E.; de Oliveira, M.S. Potential for potable water savings by combining the use of rainwater and greywater in houses in southern Brazil. Build. Environ. 2007, 42, 1731–1742. [Google Scholar] [CrossRef]
  31. Valdivia, S.; Backes, J.G.; Traverso, M.; Sonnemann, G.; Cucurachi, S.; Guinée, J.B.; Schaubroeck, T.; Finkbeiner, M.; Leroy-Parmentier, N.; Ugaya, C.; et al. Principles for the application of life cycle sustainability assessment. Int. J. Life Cycle Assess. 2021, 26, 1900–1905. [Google Scholar] [CrossRef]
  32. Statista. Daily Water Consumption Per Capita. Energy & Environment. Water & Wastewater. The Statistics Portal, 2021. Available online: https://www.statista.com (accessed on 4 December 2024).
  33. Edwin, G.A.; Gopalsamy, P.; Muthu, N. Characterization of domestic gray water from point source to determine the potential for urban residential reuse: A short review. Appl. Water Sci. 2014, 4, 39–49. [Google Scholar] [CrossRef]
  34. ISO—INTERNATIONAL STANDARD ORGANIZATION 14040; Environmental Management-Life Cycle Assessment-Principles and Framework. ISO: Geneva, Switzerland, 2006.
  35. Wernet, G.; Bauer, C.; Steubing, B.; Reinhard, J.; Moreno-Ruiz, E.; Weidema, B. The ecoinvent database version 3 (part I): Overview and methodology. Int. J. Life Cycle Assess. 2016, 21, 1218–1230. [Google Scholar] [CrossRef]
  36. Moreno-Ruiz, E.; Lévová, T.; Reinhard, J.; Valsasina, L.; Bourgault, G.; Wernet, G. Documentation of Changes Implemented in Ecoinvent Database v3.3; Ecoinvent: Zürich, Switzerland, 2016. [Google Scholar]
  37. Spuhler, D.; Scheidegger, A.; Maurer, M. Ex-ante quantification of nutrient, total solids, and water flows in sanitation systems. J. Environ. Manag. 2021, 280, 11785. [Google Scholar] [CrossRef] [PubMed]
  38. Lima Pde, M.; Lopes TAde, S.; Queiroz, L.M.; McConville, J.R. Resource-oriented sanitation: Identifying appropriate technologies and environmental gains by coupling Santiago software and life cycle assessment in a Brazilian case study. Sci. Total Environ. 2022, 837, 155777. [Google Scholar] [CrossRef] [PubMed]
  39. Huijbregts, M.A.J.; Steinmann, Z.J.N.; Elshout, P.M.F.; Stam, G.; Verones, F.; Vieira, M.; Zijp, M.; Hollander, A.; van Zelm, R. ReCiPe2016: A harmonised life cycle impact assessment method at midpoint and endpoint level. Int. J. Life Cycle Assess. 2017, 22, 138–147. [Google Scholar] [CrossRef]
  40. Corominas, L.; Byrne, D.; Guest, J.S.; Hospido, A.; Roux, P.; Shaw, A.; Short, M.D. The application of life cycle assessment (LCA) to wastewater treatment: A best practice guide and critical review. Water Res. 2020, 184, 116058. [Google Scholar] [CrossRef]
  41. Wiechmann, B.; Dienemann, C.; Kabbe, C.; Brandt, S.; Vogel, I.; Roskosch, A. Sewage Sludge Management in Germany; Umweltbundesamt (UBA): Bonn, Germany, 2013; Available online: https://www.umweltbundesamt.de/ (accessed on 19 September 2024).
  42. de Bruyn, S.M.; Bijleveld, M.; de Graaff, L.; Schep, E.; Schroten, A.; Vergeer, R.; Ahdour, S. Environmental Prices Handbook, EU28 version; CE Delft: Delft, The Netherlands, 2018. [Google Scholar]
  43. UNEP—United Nations Environment Programme. Guidelines for Social Life Cycle Assessment of Products and Organizations, 2020; Benoît Norris, C., Traverso, M., Neugebauer, S., Ekener, E., Schaubroeck, T., Russo Garrido, S., Berger, M., Valdivia, S., Lehmann, A., Finkbeiner, M., et al., Eds.; United Nations Environment Programme: Nairobi, Kenya, 2020; Available online: https://www.lifecycleinitiative.org/library/guidelines-for-social-life-cycle-assessment-of-products-and-organisations-2020/ (accessed on 13 June 2023).
  44. Goedkoop, M.J.; Indrane, D.; de Beer, I.M. Product Social Impact Assessment Handbook—2018; Roundtable for Product Social Metrics: Amersfoort, The Netherlands, 2018. [Google Scholar]
  45. Molinos-Senante, M.; Gómez, T.; Garrido-Baserba, M.; Caballero, R.; Sala-Garrido, R. Assessing the sustainability of small wastewater treatment systems: A composite indicator approach. Sci. Total Environ. 2014, 497–498, 607–617. [Google Scholar] [CrossRef]
  46. Lei Complementar Nº 153 DE 20/01/2010. Authorizes the Executive Branch to Create the Ecological Tax Program. Available online: https://www.legisweb.com.br/legislacao/?id=173502#:~:text=Autoriza%20o%20Poder%20Executivo%20a,Art (accessed on 4 April 2024).
  47. Garrido-Baserba, M.; Sedlak, D.L.; Molinos-Senante, M.; Barnosell, I.; Schraa, O.; Rosso, D.; Verdaguer, M.; Poch, M. Using water and wastewater decentralization to enhance the resilience and sustainability of cities. Nat. Water 2024, 2, 953–974. [Google Scholar] [CrossRef]
  48. Vymazal, J. Removal of nutrients in constructed wetlands for wastewater treatment through plant harvesting—Biomass and load matter the most. Ecol. Eng. 2020, 155, 105962. [Google Scholar] [CrossRef]
  49. Varma, M.; Gupta, A.K.; Ghosal, P.S.; Majumder, A. A review on performance of constructed wetlands in tropical and cold climate: Insights of mechanism, role of influencing factors, and system modification in low temperature. Sci. Total Environ. 2021, 755, 142540. [Google Scholar] [CrossRef]
  50. Rosenwinkel, K.-H.; Obenaus, F.; Wichern, M. Performance of the biological nitrogen and phosphorus removal in four large WWTPs in Germany. Water Sci. Technol. 2000, 41, 233–240. [Google Scholar] [CrossRef]
  51. von Sperling, M. Urban Wastewater Treatment in Brazil; Inter-American Development Bank: Washington, DC, USA, 2016; pp. 1–102. [Google Scholar]
  52. Sharma, K.; Nagabhooshanam, N.; Dasi, S.; Guntaj, J.; Srinivas, B.; Kaur, K.; Rajaram, A. Design and implementation of closed-loop water reuse systems in urban and industrial settings for maximizing resource recovery and minimizing waste. Desalin. Water Treat. 2024, 320, 100850. [Google Scholar] [CrossRef]
  53. Pinto, F.S.; de Carvalho, B.; Marques, R.C. Adapting water tariffs to climate change: Linking resource availability, costs, demand, and tariff design flexibility. J. Clean. Prod. 2021, 290, 125803. [Google Scholar] [CrossRef]
  54. Souza HHde, S.; Paulo, P.L.; Boncz, M.A. A constructed wetland system for residential greywater reuse: Economic feasibility of, and willingness to pay for. Desalin. Water Treat. 2017, 91, 336–348. [Google Scholar] [CrossRef]
  55. Gurung, T.R.; Sharma, A. Communal rainwater tank systems design and economies of scale. J. Clean. Prod. 2014, 67, 26–36. [Google Scholar] [CrossRef]
  56. Pathiranage, W.B.; Bray, L.; Jones, K.; Redwine, N.; Saralvarez, J.; D’Alessio, M. Perception and acceptance towards water reuse in the Southeast United States: A public survey. Sci. Total Environ. 2024, 15, 908–168224. [Google Scholar] [CrossRef]
  57. Makropoulos, C.; Rozos, E.; Tsoukalas, I.; Plevri, A.; Karakatsanis, G.; Karagiannidis, L.; Makri, E.; Lioumis, C.; Noutsopoulos, C.; Mamais, D.; et al. Sewer-mining: A water reuse option supporting circular economy, public service provision and entrepreneurship. J. Environ. Manag. 2018, 216, 285–298. [Google Scholar] [CrossRef]
  58. Tzanakakis, V.A.; Capodaglio, A.G.; Angelakis, A.N. Insights into Global Water Reuse Opportunities. Sustainability 2023, 15, 13007. [Google Scholar] [CrossRef]
  59. European Union. Regulation (EU) 2020/741 of the European Parliament and of the Council of 25 May 2020 on minimum requirements for water reuse. Off. J. Eur. Union 2020, 177, 32–55. Available online: https://eur-lex.europa.eu/eli/reg/2020/741/oj (accessed on 10 October 2024).
  60. Lei nº 14.026, de 15 de Julho de 2020. Diário Oficial da União, Brasília, DF, 16 July 2020. Available online: https://www.planalto.gov.br/ccivil_03/_ato2019-2022/2020/lei/L14026.htm (accessed on 4 March 2025).
  61. Marques, F.R.; Magri, M.E.; Amoah, I.D.; Stenström, T.A.; Paulo, P.L. Development of a semi-quantitative approach for the assessment of microbial health risk associated with wastewater reuse: A case study at the household level. Environ. Chall. 2021, 4, 100182. [Google Scholar] [CrossRef]
  62. Ribarova, I.; Vasilaki, V.; Katsou, E. Review of linear and circular approaches to on-site domestic wastewater treatment: Analysis of research achievements, trends and distance to target. J. Environ. Manag. 2024, 367, 121951. [Google Scholar] [CrossRef]
Figure 1. LCA results for each scenario across the selected impact categories from the Recipe (2016) method. Higher scores indicate worse performance—negative direction (1a: Multi-dwelling, Stuttgart; 1b: Benchmark, Stuttgart; 2a: Single-dwelling, Reinighof; 2b: Benchmark, Reinighof; 3a: Single-dwelling, Campo Grande; 3b: Benchmark, Campo Grande; 4a: Multi-dwelling, Campo Grande; 4b: Benchmark, Campo Grande).
Resources 14 00096 g001
Figure 2. Contribution analysis and pareto chart of the CAPEX components for scenarios 1a, 2a, 3a, and 4a (1a: Multi-dwelling, Stuttgart; 2a: Single-dwelling, Reinighof; 3a: Single-dwelling, Campo Grande; 4a: Multi-dwelling, Campo Grande). The solid orange line represents the cumulative percentage used in the Pareto analysis.
Resources 14 00096 g002
Figure 3. NPV projection over 15 years for the proposed scenarios (1a: Multi-dwelling, Stuttgart; 2a: Single-dwelling, Reinighof; 3a: Single-dwelling, Campo Grande; 4a: Multi-dwelling, Campo Grande).
Resources 14 00096 g003
Figure 4. Environmental costs by impact category for each scenario. Higher scores indicate worse performance—negative direction (1a: Multi-dwelling, Stuttgart; 1b: Benchmark, Stuttgart; 2a: Single-dwelling, Reinighof; 2b: Benchmark, Reinighof; 3a: Single-dwelling, Campo Grande; 3b: Benchmark, Campo Grande; 4a: Multi-dwelling, Campo Grande; 4b: Benchmark, Campo Grande).
Resources 14 00096 g004
Figure 5. Assessment of social impacts based on questionnaire responses evaluating six key indicators. Higher scores indicate better performance—positive direction (1a: Multi-dwelling, Stuttgart; 1b: Benchmark, Stuttgart; 2a: Single-dwelling, Reinighof; 2b: Benchmark, Reinighof; 3a: Single-dwelling, Campo Grande; 3b: Benchmark, Campo Grande; 4a: Multi-dwelling, Campo Grande; 4b: Benchmark, Campo Grande).
Resources 14 00096 g005
Figure 6. Sustainability score with contributions of social, environmental, and economic dimensions (cumulative normalized results). Higher scores indicate better performance—positive direction (1a: Multi-dwelling, Stuttgart; 1b: Benchmark, Stuttgart; 2a: Single-dwelling, Reinighof; 2b: Benchmark, Reinighof; 3a: Single-dwelling, Campo Grande; 3b: Benchmark, Campo Grande; 4a: Multi-dwelling, Campo Grande; 4b: Benchmark, Campo Grande). The blue line represents the final aggregated sustainability score for each scenario.
Resources 14 00096 g006
Figure 7. Sensitivity analysis results with weights doubled separately for each dimension. Higher scores indicate better performance—positive direction (1a: Multi-dwelling, Stuttgart; 1b: Benchmark, Stuttgart; 2a: Single-dwelling, Reinighof; 2b: Benchmark, Reinighof; 3a: Single-dwelling, Campo Grande; 3b: Benchmark, Campo Grande; 4a: Multi-dwelling, Campo Grande; 4b: Benchmark, Campo Grande).
Resources 14 00096 g007
Table 1. Overview of the scenarios selected in the analysis.
Case StudyScenarioDescription
11aMulti-dwelling building in Stuttgart, Germany, integrating a vertical-flow CW (VFCW) with an RW harvesting system that serves multiple reuse purposes, including the automated irrigation of a vertical garden. The VFCW spans 5 m2 and is divided into two parallel beds for efficient GW treatment. Additionally, a 7 m3 RW cistern is utilized for long-term storage, with an additional 4 m3 retention volume for temporary water storage. The CW is designed to attend 10 people [24,25].
1bBenchmark scenario assuming potable water is supplied through the public municipal piped system and GW is discharged together with blackwater into a centralized sewer network. The combined wastewater is conveyed to and treated at a centralized WWTP, with the final effluent released into receiving water bodies.
22aIn the German rural community of Reinighof, a self-sufficient single-dwelling includes a CW for GW treatment and an RW harvesting cistern repurposed from a deactivated septic tank system, with a storage volume of 25 m3 for irrigation purposes. Treated GW is conveyed into an evaporation pond due to local restrictions [26]. This system serves a population of max. 16 people.
2bBenchmark scenario representing groundwater abstraction via a well, with raw sewage temporarily collected in a holding tank and transported 10 km by truck to a centralized WWTP, where it is treated and discharged. This setup reflects rural baseline practices in the absence of local treatment infrastructure and is also constrained by local discharge restrictions that prohibit direct release into the environment.
33aBrazilian single-dwelling with 204 m2 built area. The EvaTAC system [27,28], a modified CW with an anaerobic chamber, has been operating for over 10 years, treating about 250 L of GW per day. The system also includes a 5 m3 cistern for water storage, enabling water reuse for toilet flushing, cleaning, and irrigation purposes. This system attends three people.
3bBenchmark scenario assuming potable water is supplied through the public municipal piped system and GW is discharged together with blackwater into a centralized sewer network. The combined wastewater is conveyed to and treated at a centralized WWTP, with the final effluent released into receiving water bodies.
44aA 19-story residential building in Brazil which features RW harvesting from a 520 m2 roof, stored in a 20 m3 cistern. GW is treated using the EvaTAC system, with a projected daily flow of 16 m3. The estimated population served by this system comprises 152 people.
4bBenchmark scenario assuming potable water is supplied through the public municipal piped system and GW is discharged together with blackwater into a centralized sewer network. The combined wastewater is conveyed to and treated at a centralized WWTP, with the final effluent released into receiving water bodies.
Table 2. Five-point reference scale adopted to assess the performance of the social indicators.
DescriptionScale Level
Ideal performance+2
Progress beyond compliance+1
Compliance with local laws0
Non-compliant situation, improving−1
No data, or non-compliant situation−2
Table 3. Detailed indicators selected for each sustainability dimension.
DimensionIndicatorAcronymDirectionData TypeUnit
EnvironmentalGlobal warming potentialGWPNegativeQuantitativekg CO2 eq.
Terrestrial acidificationTACNegativeQuantitativekg SO2 eq.
Freshwater eutrophicationFEUNegativeQuantitativekg P eq.
Marine eutrophicationMEUNegativeQuantitativekg N eq.
Terrestrial ecotoxicityTECNegativeQuantitativekg 1,4-DCB
Freshwater ecotoxicityFECNegativeQuantitativekg 1,4-DCB
Marine ecotoxicityMECNegativeQuantitativekg 1,4-DCB
Human carcinogenic toxicityHCTNegativeQuantitativekg 1,4-DCB
Human non-carcinogenic toxicityHNTNegativeQuantitativekg 1,4-DCB
EconomicNet present valueNPVPositiveQuantitativeEuro (EUR)
ExternalitiesEXTNegativeQuantitativeEuro (EUR)
SocialHealth and safety (end-user)HSAPositiveQualitative-
Expertise required (workers)COMPositiveQualitative-
Access to material resources (local community)AMRPositiveQualitative-
Local employment (local community)LEMPositiveQualitative-
Public commitments to sustainability issues (society)PCSPositiveQualitative-
Technology development (society)TDEPositiveQualitative-
Table 4. Weights assigned to each dimension in the sensitivity analysis.
Sensitivity Analysis AlternativeEnvironmentalSocialEconomic
Baseline comparison111
i211
ii121
iii112
Table 5. Direct costs for baseline scenarios per functional unit, including water and wastewater tariffs, expressed in EUR/p.y (1b: Benchmark, Stuttgart; 2b: Benchmark, Reinighof; 3b and 4b: Benchmark, Campo Grande).
ScenarioCosts with Water and Wastewater Tariffs (EUR/p.y)
1b887.23
2b *1628.91
3b761.76
4b761.76
Source: Own calculations based on local water and wastewater tariffs. * Scenario 2b has an additional cost of wastewater collection and transport by truck to a local WWTP.
Disclaimer/Publisher’s Note: The statements, opinions and data contained in all publications are solely those of the individual author(s) and contributor(s) and not of MDPI and/or the editor(s). MDPI and/or the editor(s) disclaim responsibility for any injury to people or property resulting from any ideas, methods, instructions or products referred to in the content.

