Article

High Field Strength Element (HFSE) and Rare Earth Element (REE) Enrichment in Laterite Deposit of High Background Natural Radiation Area (HBNRA) of Mamuju, West Sulawesi, Indonesia

1
Research Center for Nuclear Material and Radioactive Waste Technology, Research Organization for Nuclear Energy, National Research and Innovation Agency (BRIN), South Tangerang 15314, Indonesia
2
Center for Mineral, Coal, and Geothermal Resources, Geological Agency, Ministry of Energy and Mineral Resources, Bandung 40254, Indonesia
3
Faculty of Geological Engineering, Padjadjaran University, Bandung 45363, Indonesia
4
Geological Engineering Department, Trisakti University, Jakarta 11440, Indonesia
5
Directorate for Policy Formulation of Research, Technology, and Innovation, Deputy for Research and Innovation Policy, National Research and Innovation Agency (BRIN), South Tangerang 15314, Indonesia
6
Research Center for Nuclear Beam Analysis Technology, National Research and Innovation Agency (BRIN), South Tangerang 15314, Indonesia
7
Research Center for Safety, Metrology, and Nuclear Quality Technology, Research Organization for Nuclear Energy, National Research and Innovation Agency (BRIN), South Tangerang 15314, Indonesia
*
Author to whom correspondence should be addressed.
Resources 2025, 14(5), 84; https://doi.org/10.3390/resources14050084
Submission received: 21 March 2025 / Revised: 14 May 2025 / Accepted: 15 May 2025 / Published: 20 May 2025

Abstract

:
The Mamuju region in West Sulawesi, Indonesia, is a High Background Natural Radiation Area (HBNRA) characterized by a significant enrichment of high field strength elements (HFSEs) and rare earth elements (REEs) within its lateritic deposits. This study investigates the geochemical behavior, mineralogical distribution, and enrichment processes of HFSEs and REEs in lateritic profiles of drill cores and surface samples derived from alkaline volcanic rocks. The mineralogy and geochemical content of HFSEs and REEs in the alkaline bedrocks indicate its potential to become a source of lateritic enrichment. An intense lateritic weathering process leads to the residual accumulation of HFSEs and REEs, particularly in B-horizon soils, where clay minerals and Fe–Al oxides are crucial in element precipitation. Moreover, groundwater redox conditions are a key factor for uranium precipitation in the lateritic profile. The findings provide insight into the potential of lateritic weathering as a natural mechanism for HFSE and REE concentration, contributing to the broader understanding of critical metal resources in Indonesia. These insights have implications for sustainable resource exploration and environmental management in areas with high natural radiation exposure.
Keywords:
HFSE; REE; laterite; Mamuju; HBNRA

1. Introduction

High field strength elements (HFSEs), including niobium (Nb), tantalum (Ta), zirconium (Zr), and hafnium (Hf), are critical for future industries due to their high strength, thermal stability, and corrosion resistance [1]. With the rise of Industry 4.0, HFSEs are essential for smart manufacturing, automation, and superconducting materials [1]. They play a huge role in aerospace, renewable energy, electronics, and advanced manufacturing, particularly in micro-alloyed steels, next-generation batteries, and high-performance capacitors [2]. In addition, their use in nuclear energy and electric vehicle (EV) components underscores their importance in transitioning to a low-carbon economy. However, the concentrated supply in a few countries and environmental concerns related to extraction and processing necessitate exploring new sources to secure sustainable production, including the lateritic weathering of alkaline volcanic rocks [3].
High Background Natural Radiation Areas (HBNRAs) are regions worldwide where natural radiation levels are significantly higher than the global average due to the presence of naturally occurring radioactive materials (NORMs) [4]. Notable HBNRAs include Ramsar in Iran, Guarapari in Brazil, Kerala and Orissa in India, and Yangjiang in China [4,5,6]. These areas have been the focus of extensive research to understand the health implications of chronic low-dose radiation exposure as earlier epidemiological studies have not reported substantial increases in cancer incidence, raising questions about the linear no-threshold hypothesis [4]. The geological characteristics of HBNRAs vary widely; for instance, in Ramsar, this is mainly due to hot springs, which contain high 226Ra; in Guarapari, due to the location on the monazite sand belt; in Kerala and Orissa, due to the abundance of heavy mineral with high monazite content; in Yangjiang, due to higher concentration of thorium than uranium in soil [4,5,6,7]. These geological features play a crucial role in determining the distribution and concentration of radionuclides, influencing both the environmental and health impacts of HBNRAs.
Mamuju is recognized as a unique HBNRA in Indonesia, with an average annual effective dose of 32 mSv and a geometric mean of 29.7 mSv. This value exceeds the global mean of 2.4 mSv, and the highest value exceeds the upper value of the reference level for existing exposure situations [8]. In addition to external radiation from terrestrial sources, Mamuju also exhibits high indoor and outdoor radon concentrations, ranging from 124 Bq m−3 to 1015 Bq m−3, which is higher than the internal dose at the other HNBRAs in Yangjiang, China, and Kerala, India. It also significantly exceeds the World Health Organization’s reference level of 100 Bq m−3 [9]. The high radiation levels from NORMs in Mamuju are related to volcanic rocks from the Adang volcanic complex, which contains elevated concentrations of 238U and 232Th, contributing to both external and internal radiation exposures [9,10,11,12,13].
Both the naturally occurring radioactive materials (NORMs), notably uranium (U) and thorium (Th), and other high field strength elements (HFSEs) such as niobium (Nb), zirconium (Zr), and tantalum (Ta) exhibit similar geochemical affinities, characterized by large ionic radii and high charge, which render them relatively immobile and resistant to leaching during chemical weathering [14]. In Mamuju, the intense tropical lateritic weathering enhances the residual enrichment of these elements by selectively removing more mobile species while retaining NORMs and HFSEs. This concurrent enrichment underlines Mamuju’s promising repository of critical HFSE resources that also hosts significant enrichments of Th, U, and REEs [11,15,16].
Previous studies have also documented significant REE and HFSE occurrences in lateritic profiles developed over granitoid and volcanic rocks in West Sulawesi, suggesting the presence of economically significant mineralization [10,17]. Anomalous radiometric signatures of thorium (Th), a representative immobile HFSE, were detected in several locations, with equivalent thorium (eTh) concentrations surpassing 222 ppm located in Pasabu, Takandeang, Rantedoda, Hulu Mamuju, Taan, Bebanga, and Lebani, indicating potential zones of geochemical enrichment [18]. Several studies have identified HFSE-bearing minerals such as zircon, monazite, and aeschynite within weathered volcanic rocks in this region [19]. Nevertheless, while research has focused on Th and REE mineralization, there is a lack of comprehensive studies specifically characterizing HFSE enrichments in lateritic profiles derived from alkaline volcanic rocks. Recent work on the uranium isotope ratio of 234U/238U highlights magmatic, hydrothermal, and diagenetic processes, including lateritization, as key factors influencing mineralization [10]. Their findings suggest that similar processes may also affect HFSE enrichment, yet no study has directly examined HFSE behavior during lateritization. Although weathering significantly contributes to these elements’ redistribution [20], the extent and mechanisms of their mobilization and retention remain poorly understood.
Characterizing HFSE enrichments in laterite-derived alkaline volcanic rocks will provide insights into their mobility, retention mechanisms, and potential recovery methods [3]. This study aims to fill the existing research gap by analyzing the distribution, mineralogy, and enrichment processes of HFSEs in lateritic profiles developed over alkaline volcanic rocks in Mamuju. Furthermore, this research provides insight into the relevance between HFSE resource potential and environmental risk due to HBNRA. Takandeang area, a radiometric anomalous area with the development of lateritic profiles [10,18], is selected as the study location (Figure 1).

2. Geological Background

West Sulawesi region was part of the East Java–West Sulawesi block that accreted to the Sundaland margin in the Late Cretaceous. This attachment was followed by the development of a west-dipping subduction zone whose rollback led to the rifting of the Makassar Strait Basin in the Early Eocene, detaching West Sulawesi from Borneo [21,22,23,24]. Subduction-related magmatism persisted from the Paleocene to the Early Miocene, transitioning to extensional magmatism from the Middle Miocene to the Late Pliocene, coinciding with Pliocene metamorphism and culminating in a major Plio–Pleistocene tectonic uplift that formed a fold-thrust belt [22,25,26,27,28,29,30].
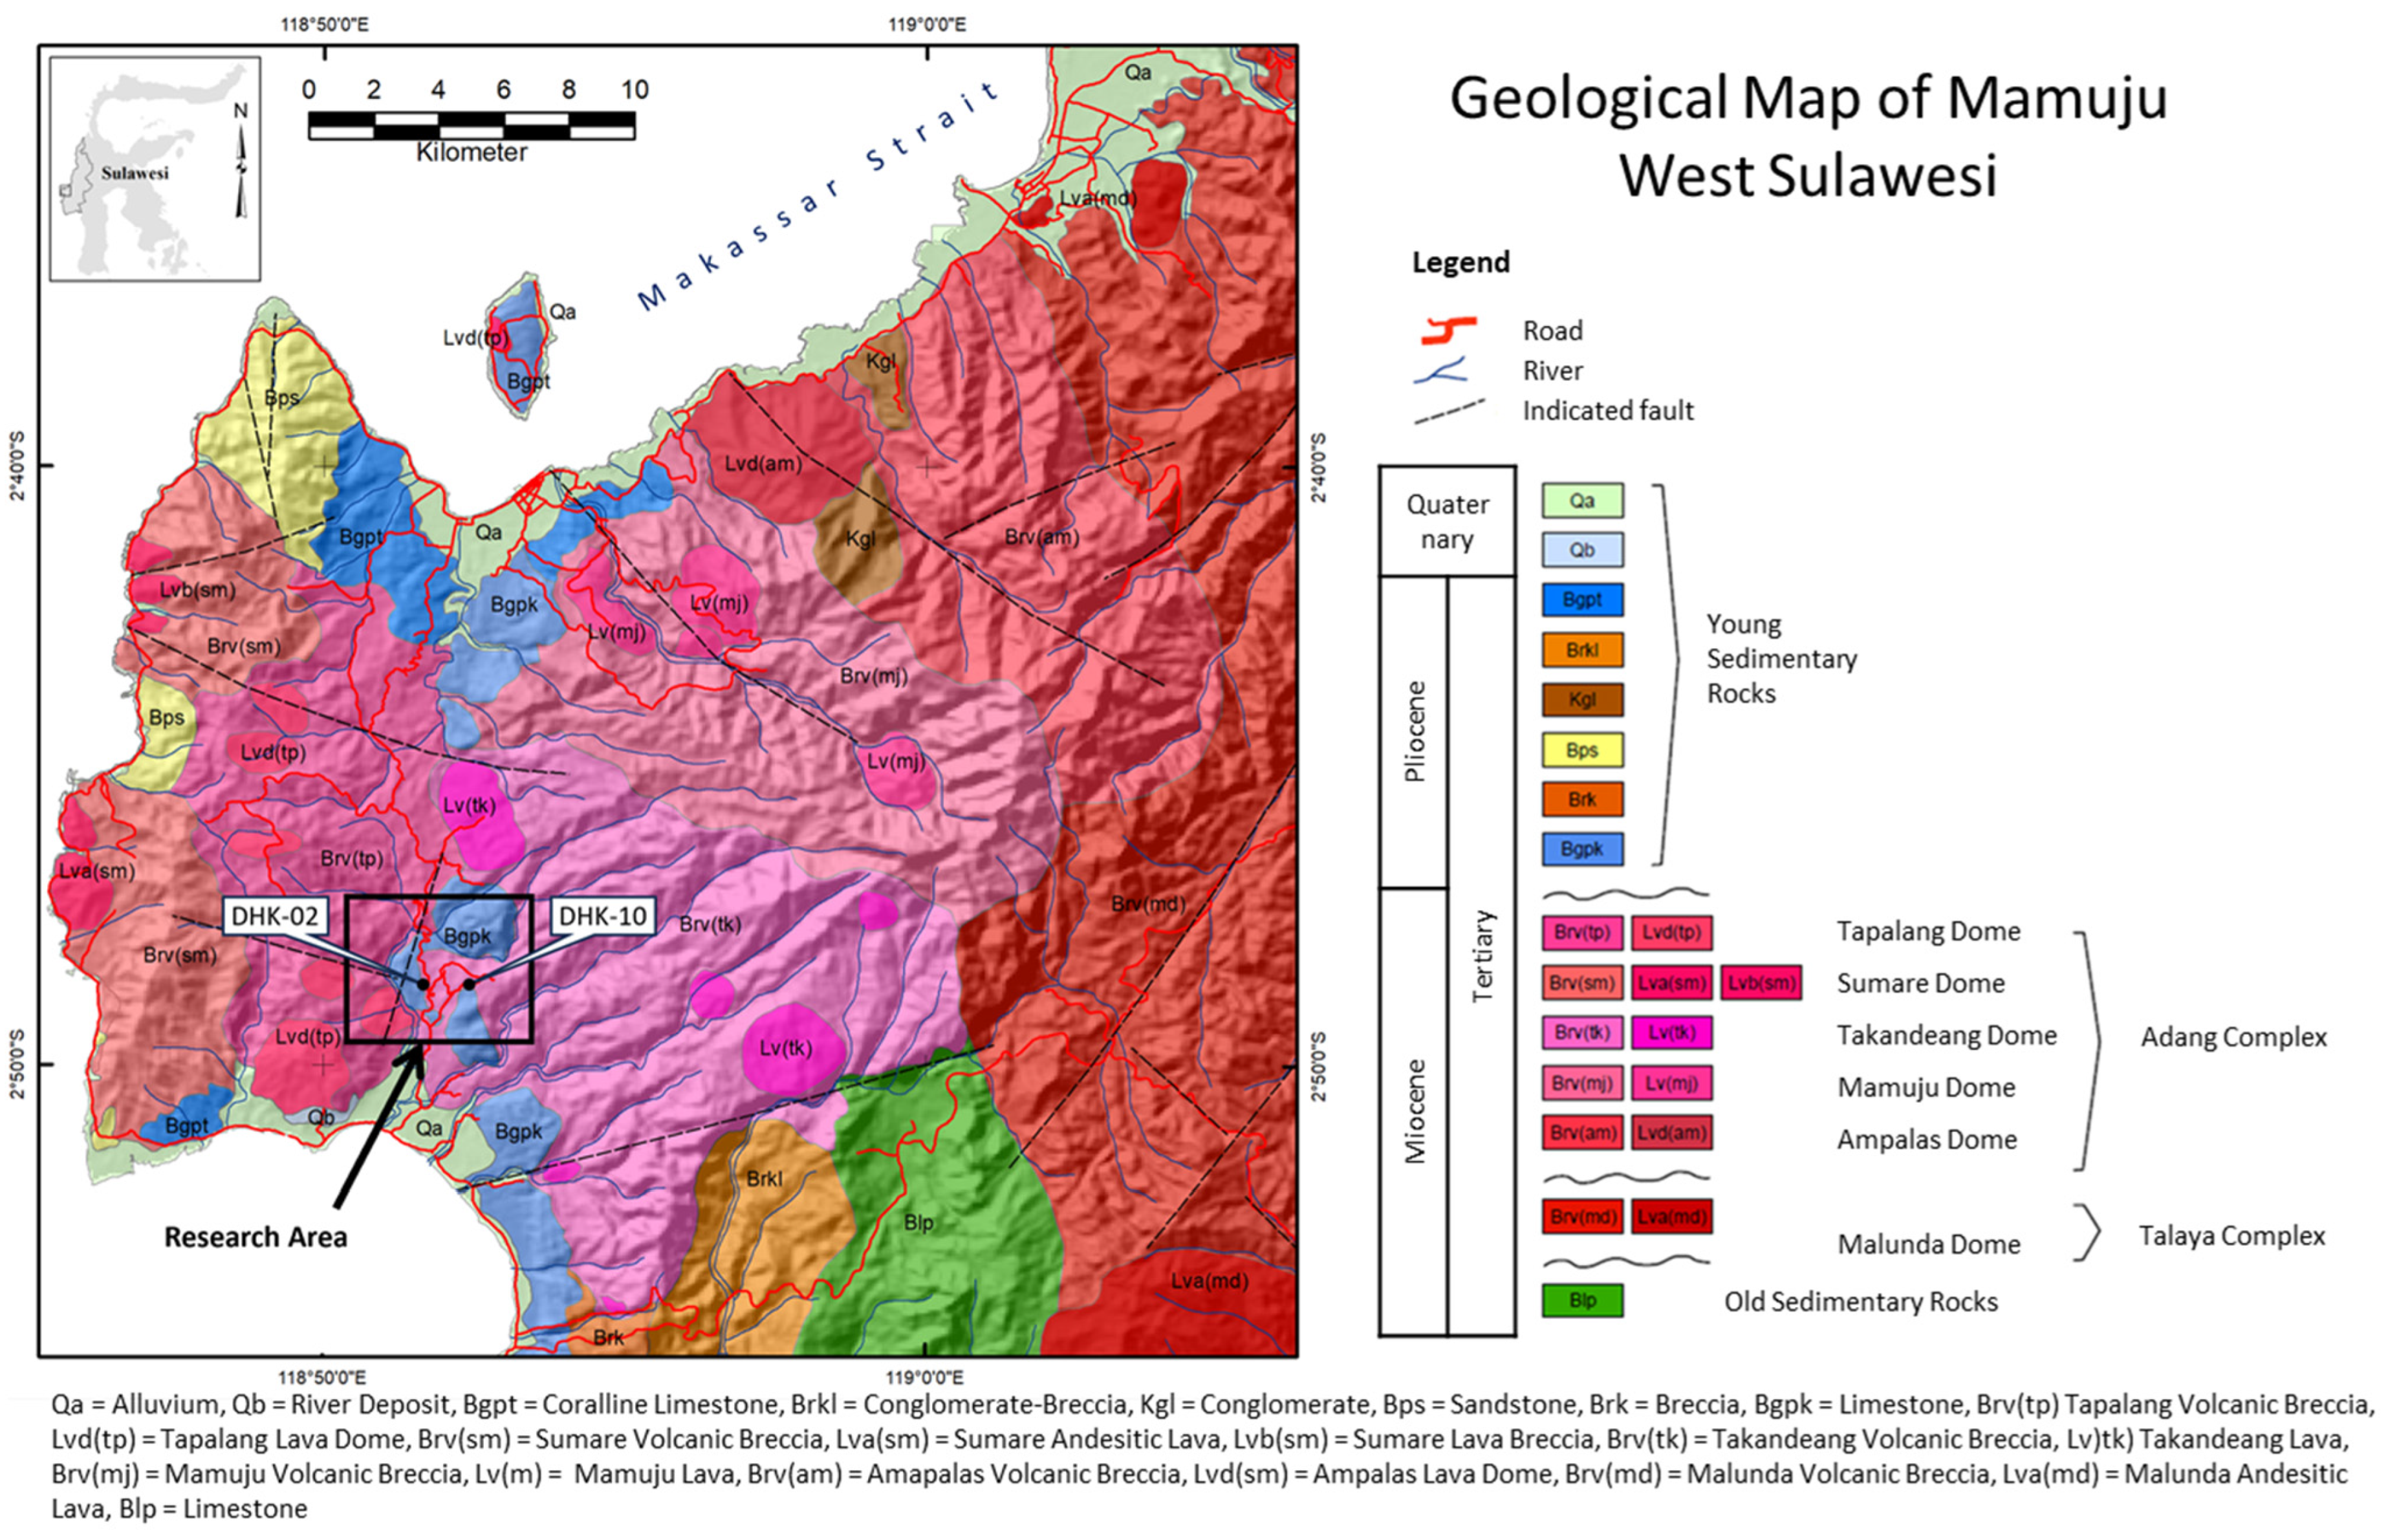
Most of the Mamuju region was composed by the Late Miocene Adang Volcanic Rocks, interfingering with the Mamuju Formation and Tapalang Member of the Mamuju Formation [31]. The Adang volcanic rocks consist of the ultrapotassic trachyte–phonolite [13]. The volcano stratigraphy of the Adang Volcanic Rocks based on geomorphology and lithology, as depicted in Figure 2, distinguished several lava domes, volcanic breccias, and lavas [10,32]. The non-volcanic units formed in the Pliocene include limestone, breccia, sandstone, conglomerate, and alluvium deposit. The research area is located within the Takandeang Volcanic Breccia, which is predominantly composed by volcanic breccia intercalated with lava. The lateritic profile was developed in several areas in Mamuju, such as Rante Dunia, Ahu, and Takandeang [33].

3. Materials and Methods

A total of two drill holes, DHK–02 and DHK–10 (see Figure 2), and surface samples were collected from the Takandeang surrounding area, Mamuju Regency, West Sulawesi. The collected sample encompassed the various weathering and alteration stages, from the fresh bedrock to the mature lateritic soil horizons. Sixteen (16) samples were collected from DHK–02, and nine (9) samples were collected from DHK–10, with an additional four (4) samples from the outcrop adjacent to the drill hole location.
Petrographic analysis using an Olympus BX-51 polarization microscope (Olympus Corporation, Hachioji, Tokyo, Japan) was performed at the Research Center for Nuclear Material and Radioactive Waste Technology, National Research and Innovation Agency (BRIN), Indonesia. X-ray diffraction (XRD) analysis was conducted at the Geological Engineering Department, Universitas Gadjah Mada (UGM), Indonesia. Major oxide analyses of 25 samples from the two drill holes were conducted using X-ray fluorescence (XRF) at the tekMIRA laboratory in Indonesia. Trace element analyses with the same samples as XRF were performed at Intertek laboratory using Inductively Coupled Plasma Mass Spectrometry (ICP–MS).
Micro-XRF analysis of selected surface samples was conducted in BRIN using Bruker M4 Tornado Plus (Bruker Nano GmbH, Berlin, Germany). This machine has poly-capillary optics, which create an X-ray beam with a diameter of 20 µm. The equipment operated at 50 kV and 600 µA with 30 µm pixel spacing and 12 ms/pixel acquisition time. The micro-XRF analysis produces element distribution along the samples. Then, Advanced Mineral Identification and Characterization System (AMICS) software ver. 3.0.0.237 was utilized to determine mineral distribution in the sample based on its mineral spectrum database provided by the software.
Scanning Electron Microscope (SEM) analyses were conducted on polished blocks from surface outcrop samples using Thermo Scientific Phenom Pharos SEM (Thermo Fisher Scientific, Waltham, MA, USA) complete with energy dispersive X-ray spectrometer (EDS). This analysis was performed at BRIN, with operating conditions of 15 kV, a working distance of 10 mm, and a vacuum condition of 0.1 Pa.
Radionuclide analysis was carried out in the Laboratory of Safety and Radiation Metrology Technology (LTKMR), BRIN, Indonesia. Radionuclide activity was performed using an HPGe detector (GEM, ORTEC, Oak Ridge, TN, USA). Then, the specific activity of a nuclide is calculated using Equations (1) and (2):
A = n   E   Y   W   f c  
L D = L c + K σ D
where n is net count per second, E is the counting efficiency, Y is the energy yield, W is the sample weight (kg), and f c is the correction factor (including summing in, summing out, decay factor, recovery factor, attenuation factor, branching ratio, and growth factor). L D is the detection limit, L c is the critical level below which no signal can be detected, σ D is the standard deviation, and K is the error probability [33,34,35].
Mass balance calculation is generally used to illustrate the elemental mobilization and redistribution during the weathering process [36,37]. The mass balance of a particular element relative to the fresh bedrock can be expressed as in Equation (3),
τ i , j = C j , w   C j , p × C i , p C i , w 1 ,
where C j , w and C j , p are the concentration of particular element j in weathered soil ( w ) and fresh parent rock ( p ). On the other hand, C i , w and C i , p are concentrations of relatively immobile element ( i ) in weathered soil and parent rock. τ i was chosen as a reference for immobile elements in the mass balance calculation in this study because of the abundance of its concentration in this area. Moreover, in a nearly neutral dilute solution, titanium oxy-hydroxide is the least soluble of the major and minor element hydroxides and carbonates [36,38]. The deepest Ti concentration in each borehole was adopted for the C j , p and C i , p of the fresh parent rocks.

4. Results

4.1. Radionuclide Activity

The radionuclide activity results for 226Ra, 232Th, and 40K from surface soil samples TKD-02, TKD-01, Rantedunia, and Palada deliver strong evidence supporting the classification of the research area as a high natural background radiation area (HNBRA). The extremely high 226Ra concentrations in TKD-02 (2766.14 ± 61.31 Bq/kg) and TKD-01 (2883.85 ± 63.95 Bq/kg) far exceed global average crustal values, indicating significant uranium-series radionuclide enrichment. Similarly, the 232Th activity in these samples, especially in TKD-01 (1529.18 ± 33.35 Bq/kg), is considerably elevated, suggesting the presence of thorium-rich minerals. The relatively moderate 40K levels across all samples indicate that potassium-bearing minerals have not undergone significant fractionation compared to the extreme mobilization and residual concentration of U and Th-series elements.
In comparison to the Rantedunia and Palada samples, which also show elevated 232Th activity (1236.54 ± 26.90 Bq/kg and 1136.75 ± 24.78 Bq/kg, respectively), but significantly lower 226Ra levels (502.75 ± 11.31 Bq/kg and 729.54 ± 16.32 Bq/kg), it is evident that spatial variation exists in radionuclide distribution. This suggests localized enrichment processes influenced by lithology, lateritic weathering intensity, and groundwater interactions. The elevated radiation levels observed in the TKD samples, particularly from the phonolite laterite profile, reinforce the notion that alkaline igneous rocks can serve as natural radiogenic sources due to their geochemical affinity for HFSEs, U, and Th. These data are crucial for understanding the geochemical evolution of the lateritic weathering profile and the potential radiological implications for environmental and occupational exposure in the region (Table 1).

4.2. Lateritic Profile Characteristics

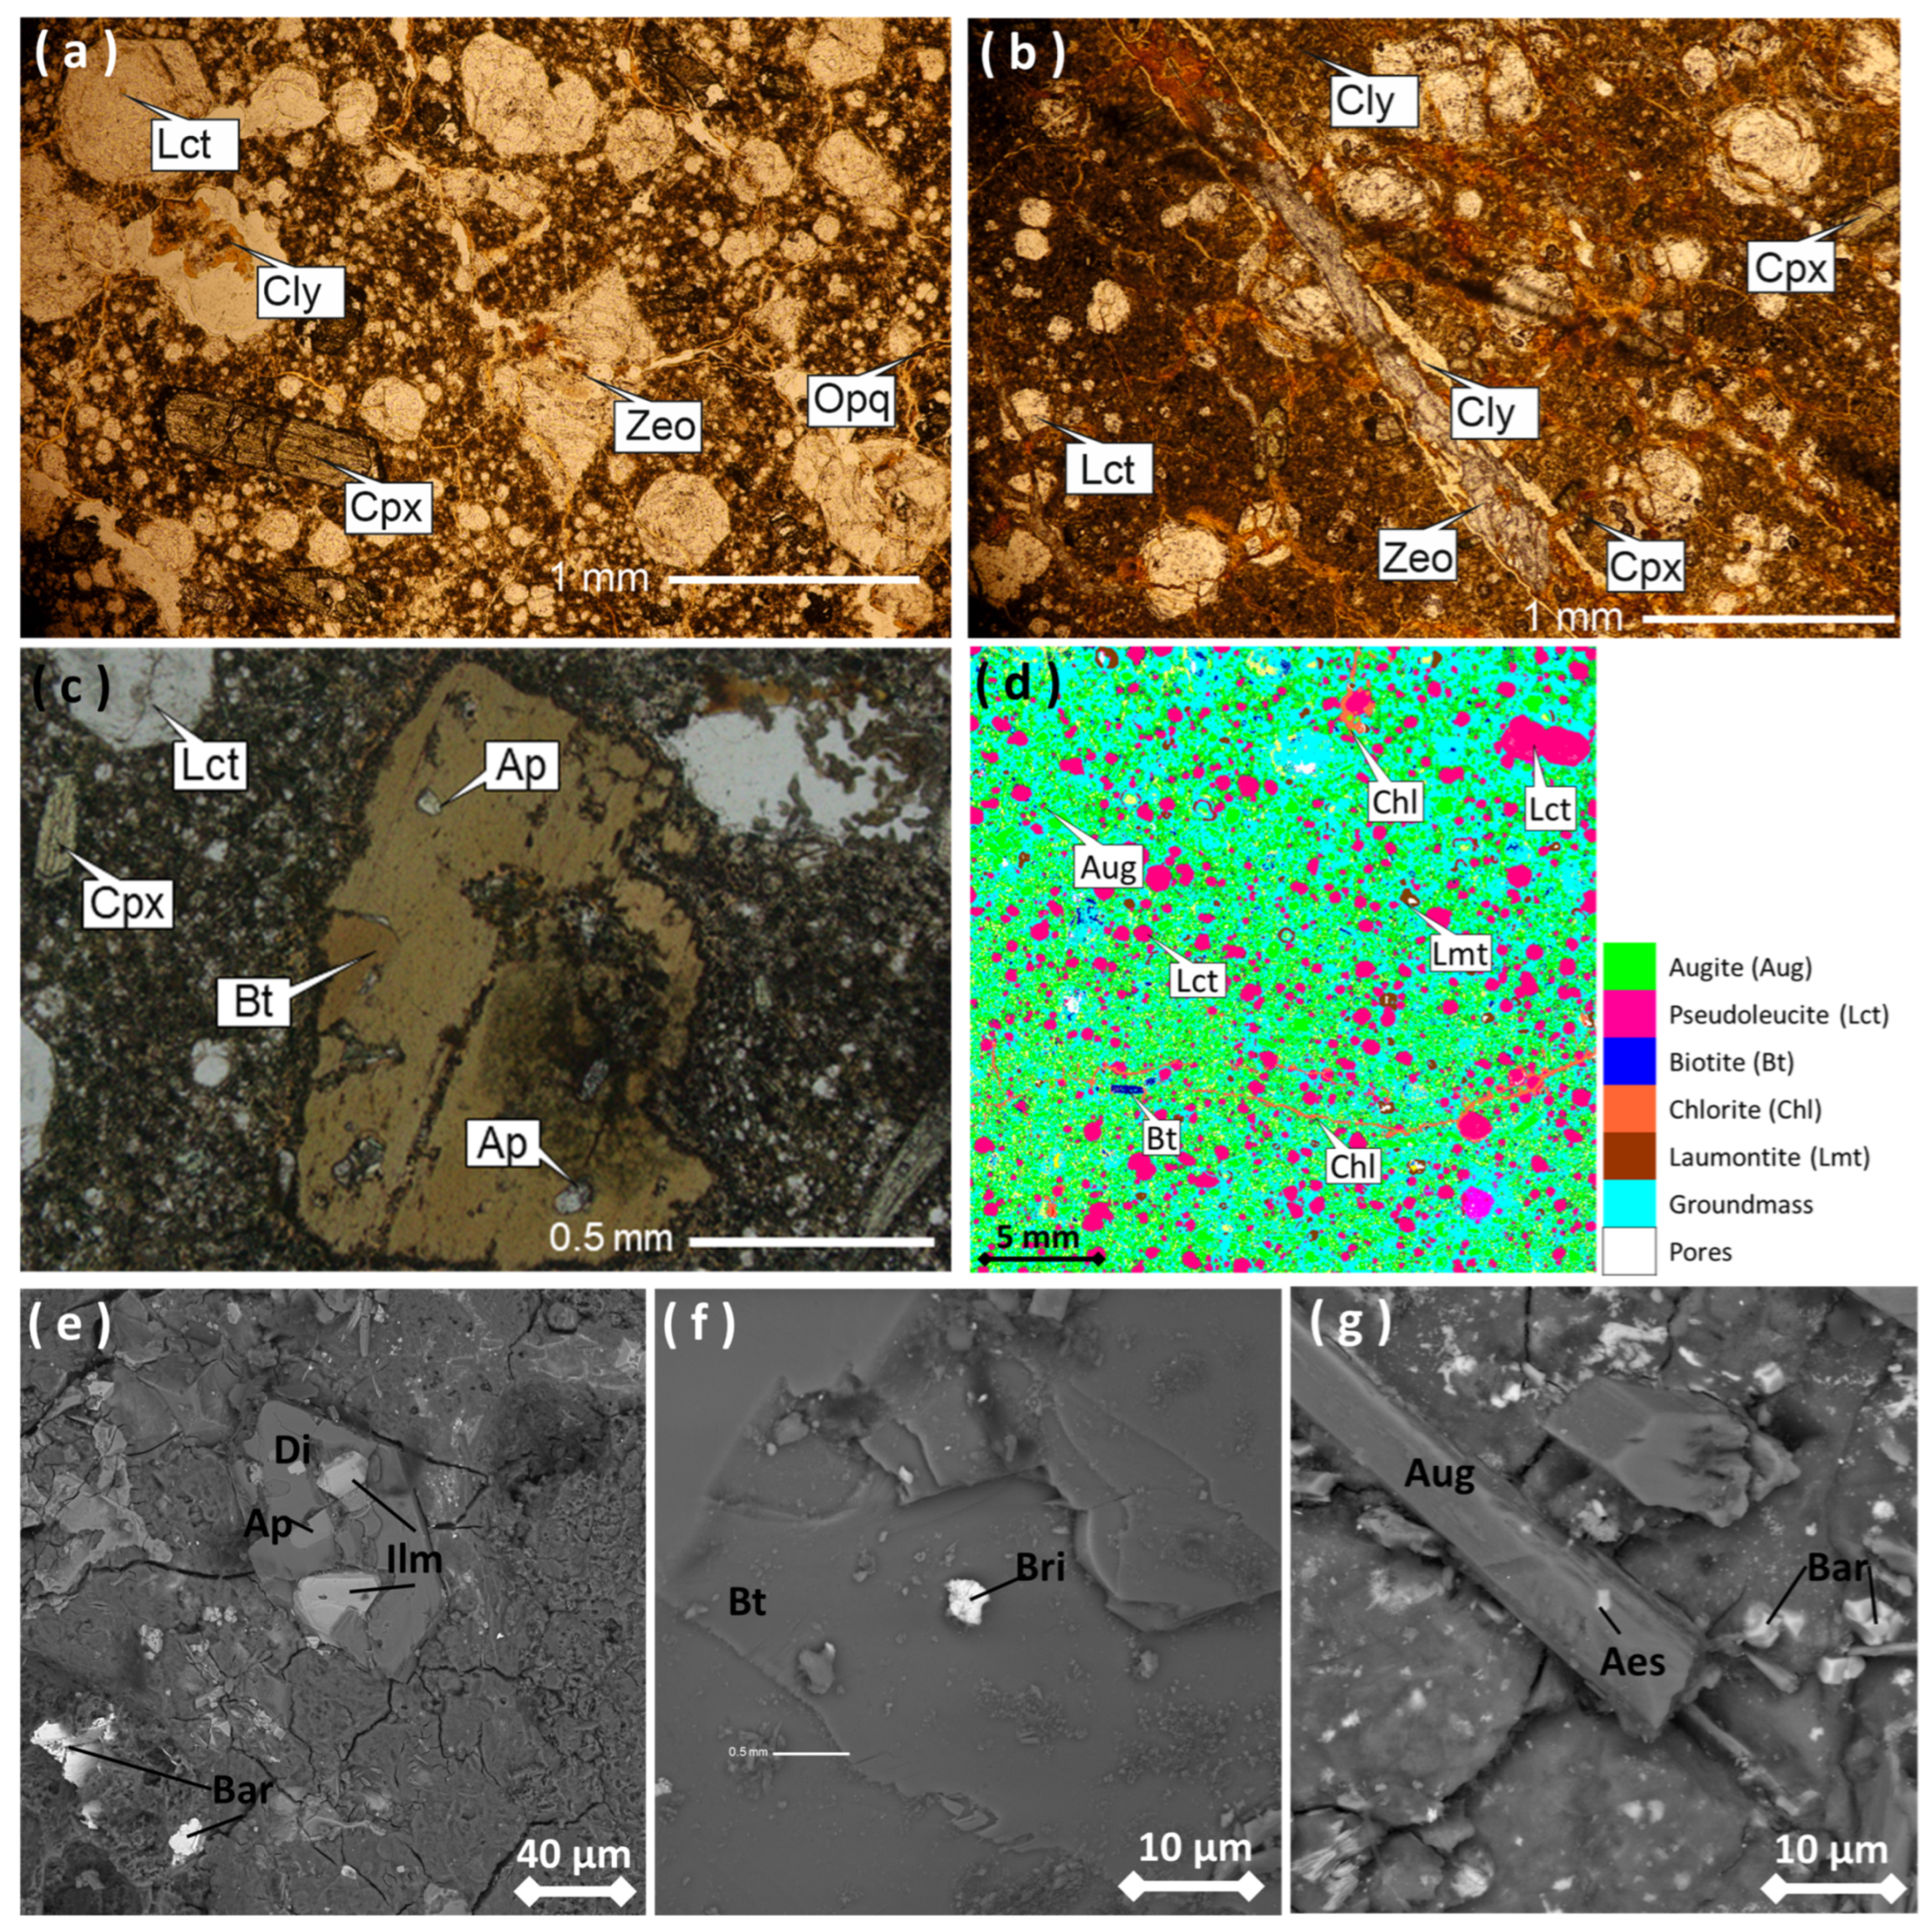
The fresh alkaline rocks in the Takandeang area are light to dark grey, consisting of leucite, clinopyroxene, and biotite as phenocrysts. Leucite phenocrysts typically exhibit a euhedral to subhedral morphology, 0.1 to 2 mm in size, characterized by their high relief and octagonal shape under polarized light (Figure 3a,b). Clinopyroxene phenocrysts appear as thick, prismatic crystals with noticeable cleavage and pleochroism, 0.1 to 0.4 mm in size (Figure 3a,b). Biotite is brown with opacitic rims and subhedral morphology and is 0.2 to 1 mm in size (Figure 3c). These phenocrysts are embedded within a finer-grained groundmass composed of clay minerals, zeolites, and opaque minerals. Apatite was also found as an accessory mineral. Apatite occurs as an inclusion among biotite crystals, measured from 0.05 to 0.2 mm in size (Figure 3c). The fracture-filling minerals found in the sample are zeolite, oxide minerals, and opaque minerals. Micro-XRF analysis displays porphyritic texture with phenocrysts composed of augite, pseudoleucite, and biotite (Figure 3d). Pseudoleucite phenocryst was geochemically analcime mineral, but it preserved the morphology of leucite. Several pseudoleucite crystals were altered into laumontite, a species of zeolite group minerals. The fractures in the sample were dominantly filled by chlorite. The groundmass cannot be determined specifically by micro-XRF equipment because of its limitation in analysis of less than 20 µm crystal size.
Mineral observation using SEM–EDS revealed HFSE and REE-bearing minerals in surface samples. The observed HFSE-bearing mineral was ilmenite, which occurs as an inclusion in diopside (Figure 3e). Apatite inclusion is also in the same diopside crystal (Figure 3e). The observed REE-bearing minerals in the sample were britholite, which is found as an inclusion in biotite (Figure 3f). The REE-bearing aeschynite is also found in augite (Figure 3g).
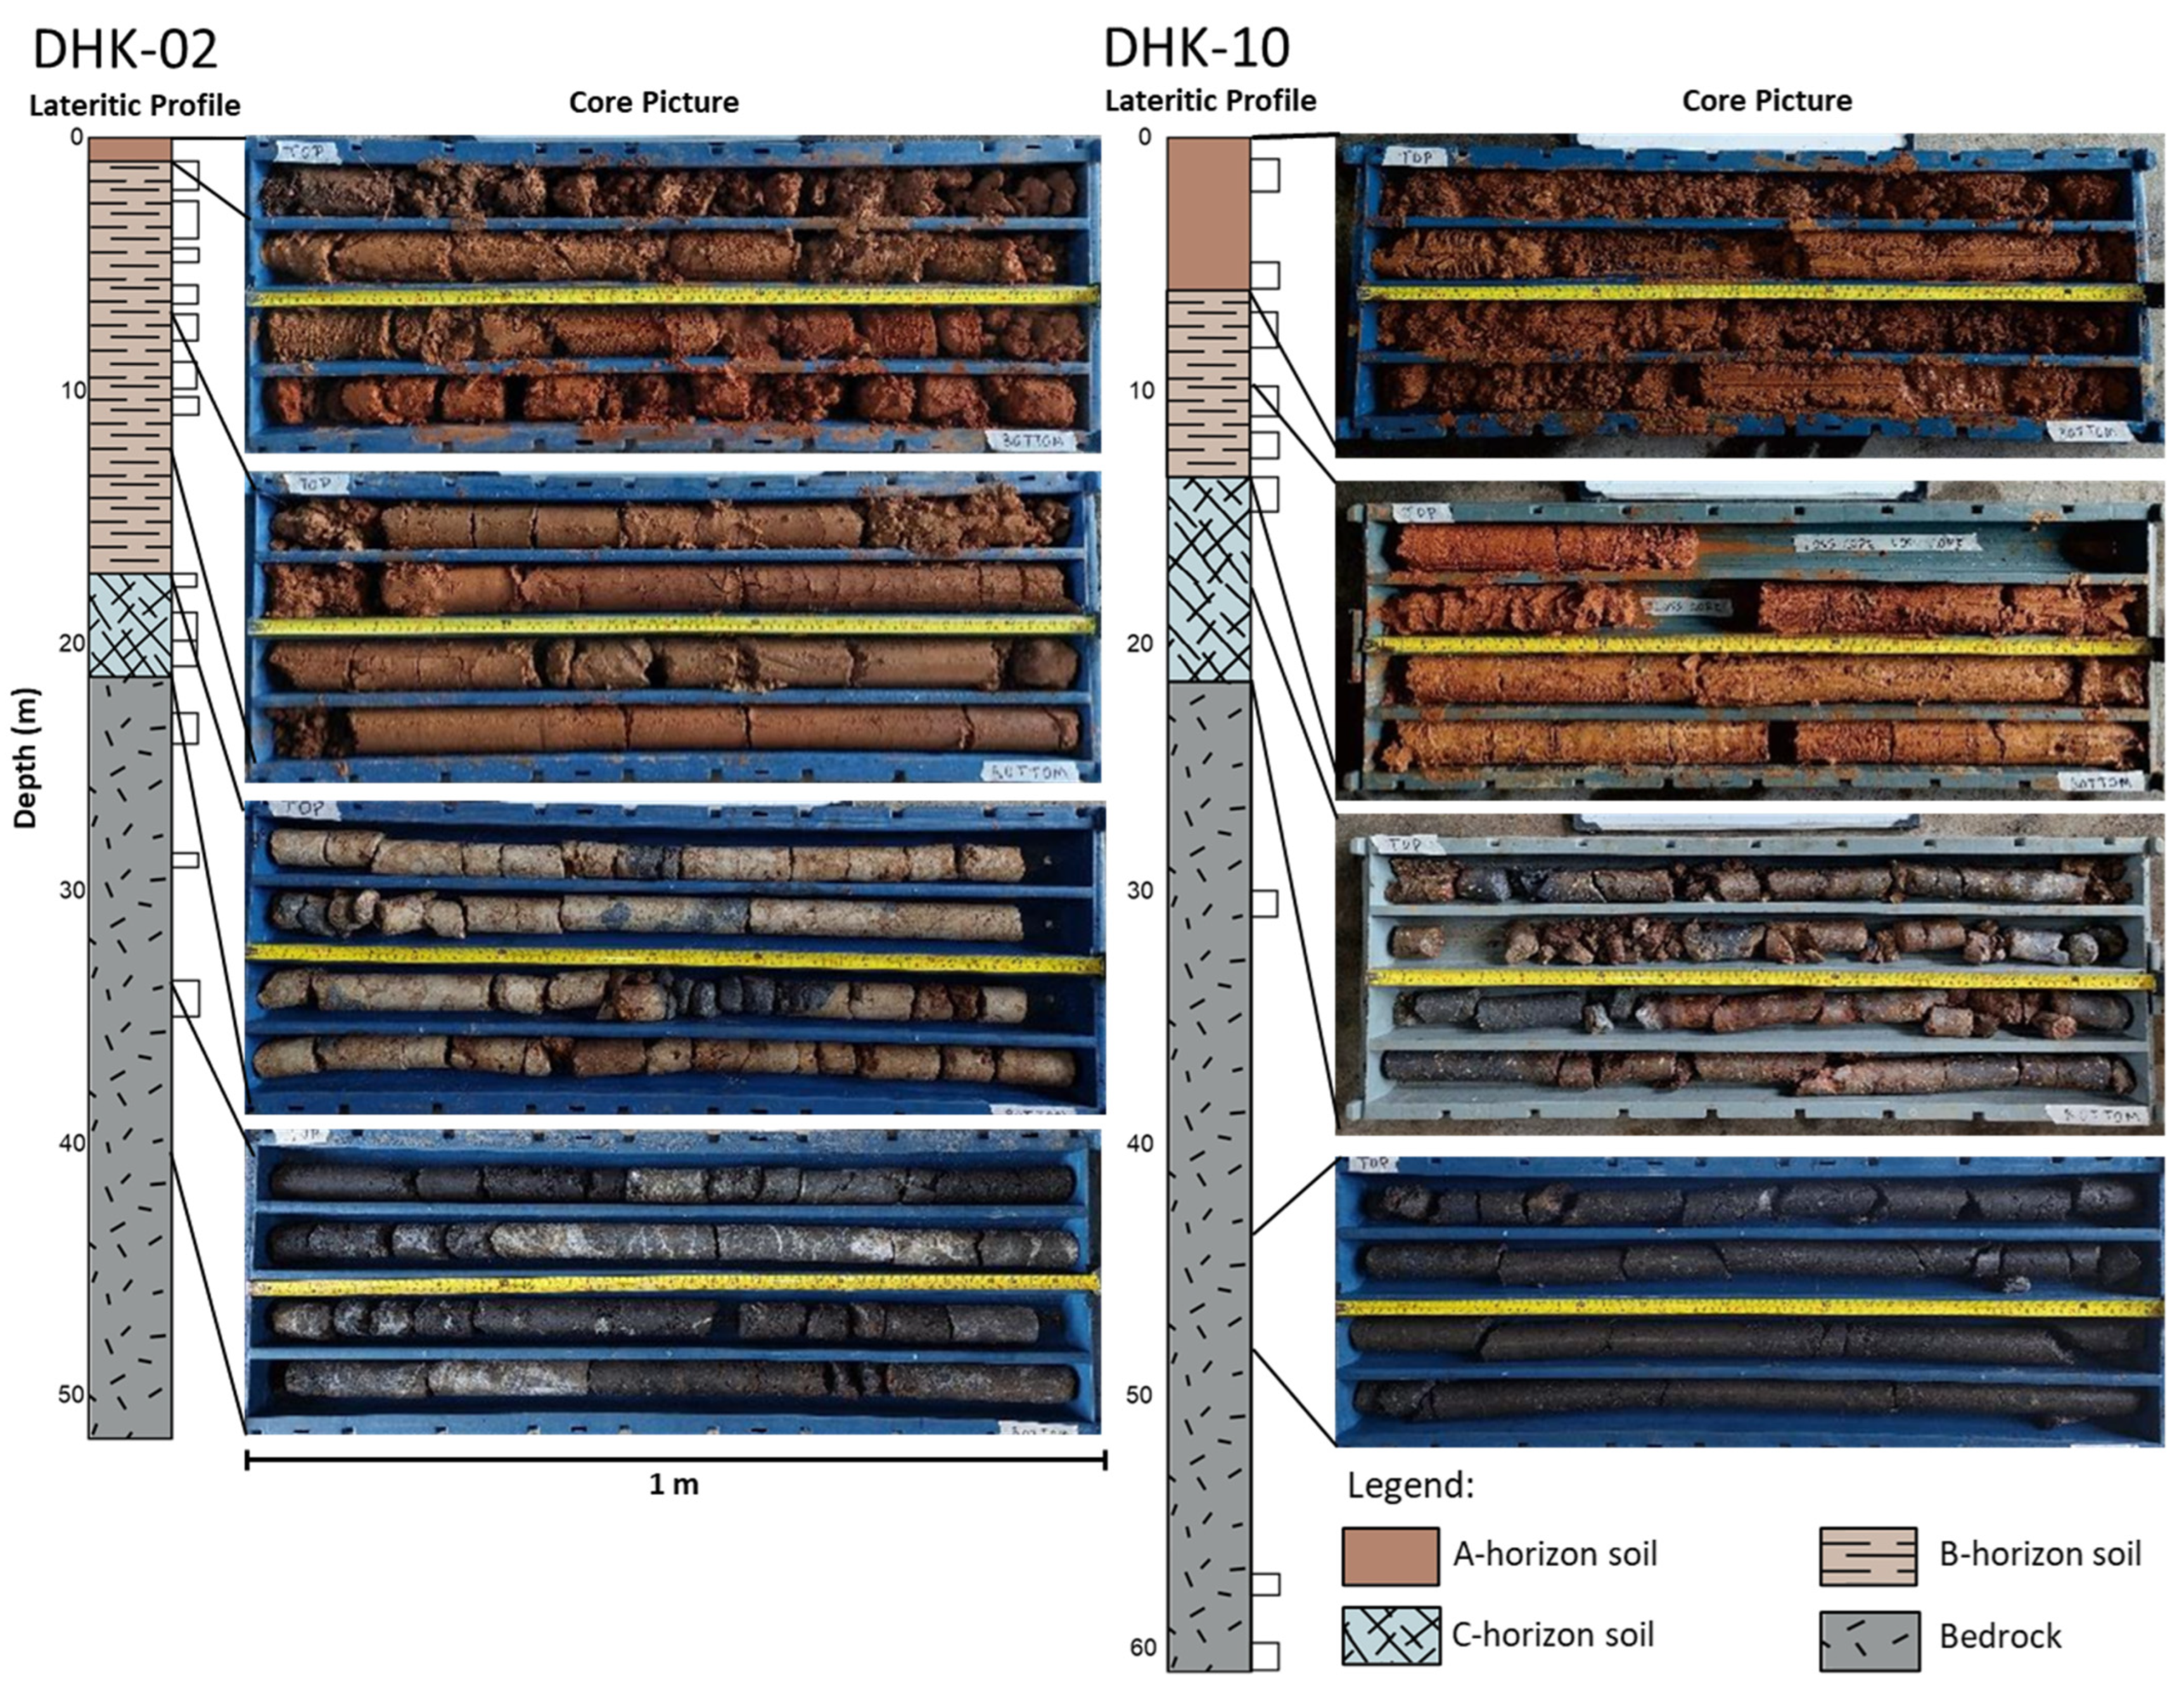
The lateritic profiles of the drill cores in Takandeang were divided further into three soil types, the A, B, and C-horizon soil, which is determined based on their physical characteristics (Figure 4). The C-horizon forms a whitish-brown layer, preserving the remaining bedrock texture. This C-horizon layer is found in the 17.5–22.5 m depth of DHK-02 and the 13–21 m depth of DHK-10. Above the C-horizon forms a thick layer of yellowish-brown B-horizon soil. The textures of this layer are plastic and dominantly consist of clay minerals and Fe oxides. The B-horizon layer is found in the 1–17.5 m depth of DHK-02 and the 6–13 m depth of DHK-10. The A-horizon forms a dark to reddish brown, completely weathered soil layer in contact with the B-horizon. The texture is highly porous and consists of Fe oxides and clay minerals. The thickness of the A-horizon layer is reaching 1 m in DHK-02 and 6 m in DHK-10.
The X-ray diffraction (XRD) spectra of the sample from the Tapalang area are presented in Figure 5. The XRD analysis results of clay minerals reveal a mineralogical composition that includes a variety of secondary and accessory phases. Across the four XRD spectra, dominant peaks correspond to the presence of clays such as halloysite, kaolinite, and smectite. The rock-forming minerals observed using XRD were leucite, nepheline, augite, diopside, and amphibole. Boehmite, gibbsite, and diaspore occur as aluminum hydroxide minerals. Oxide minerals that were observed were hematite and pyrolusite. Possible HFSE and REE-bearing minerals were apatite, anatase, rutile, uraninite, and thorianite.

4.3. Geochemical Characteristics

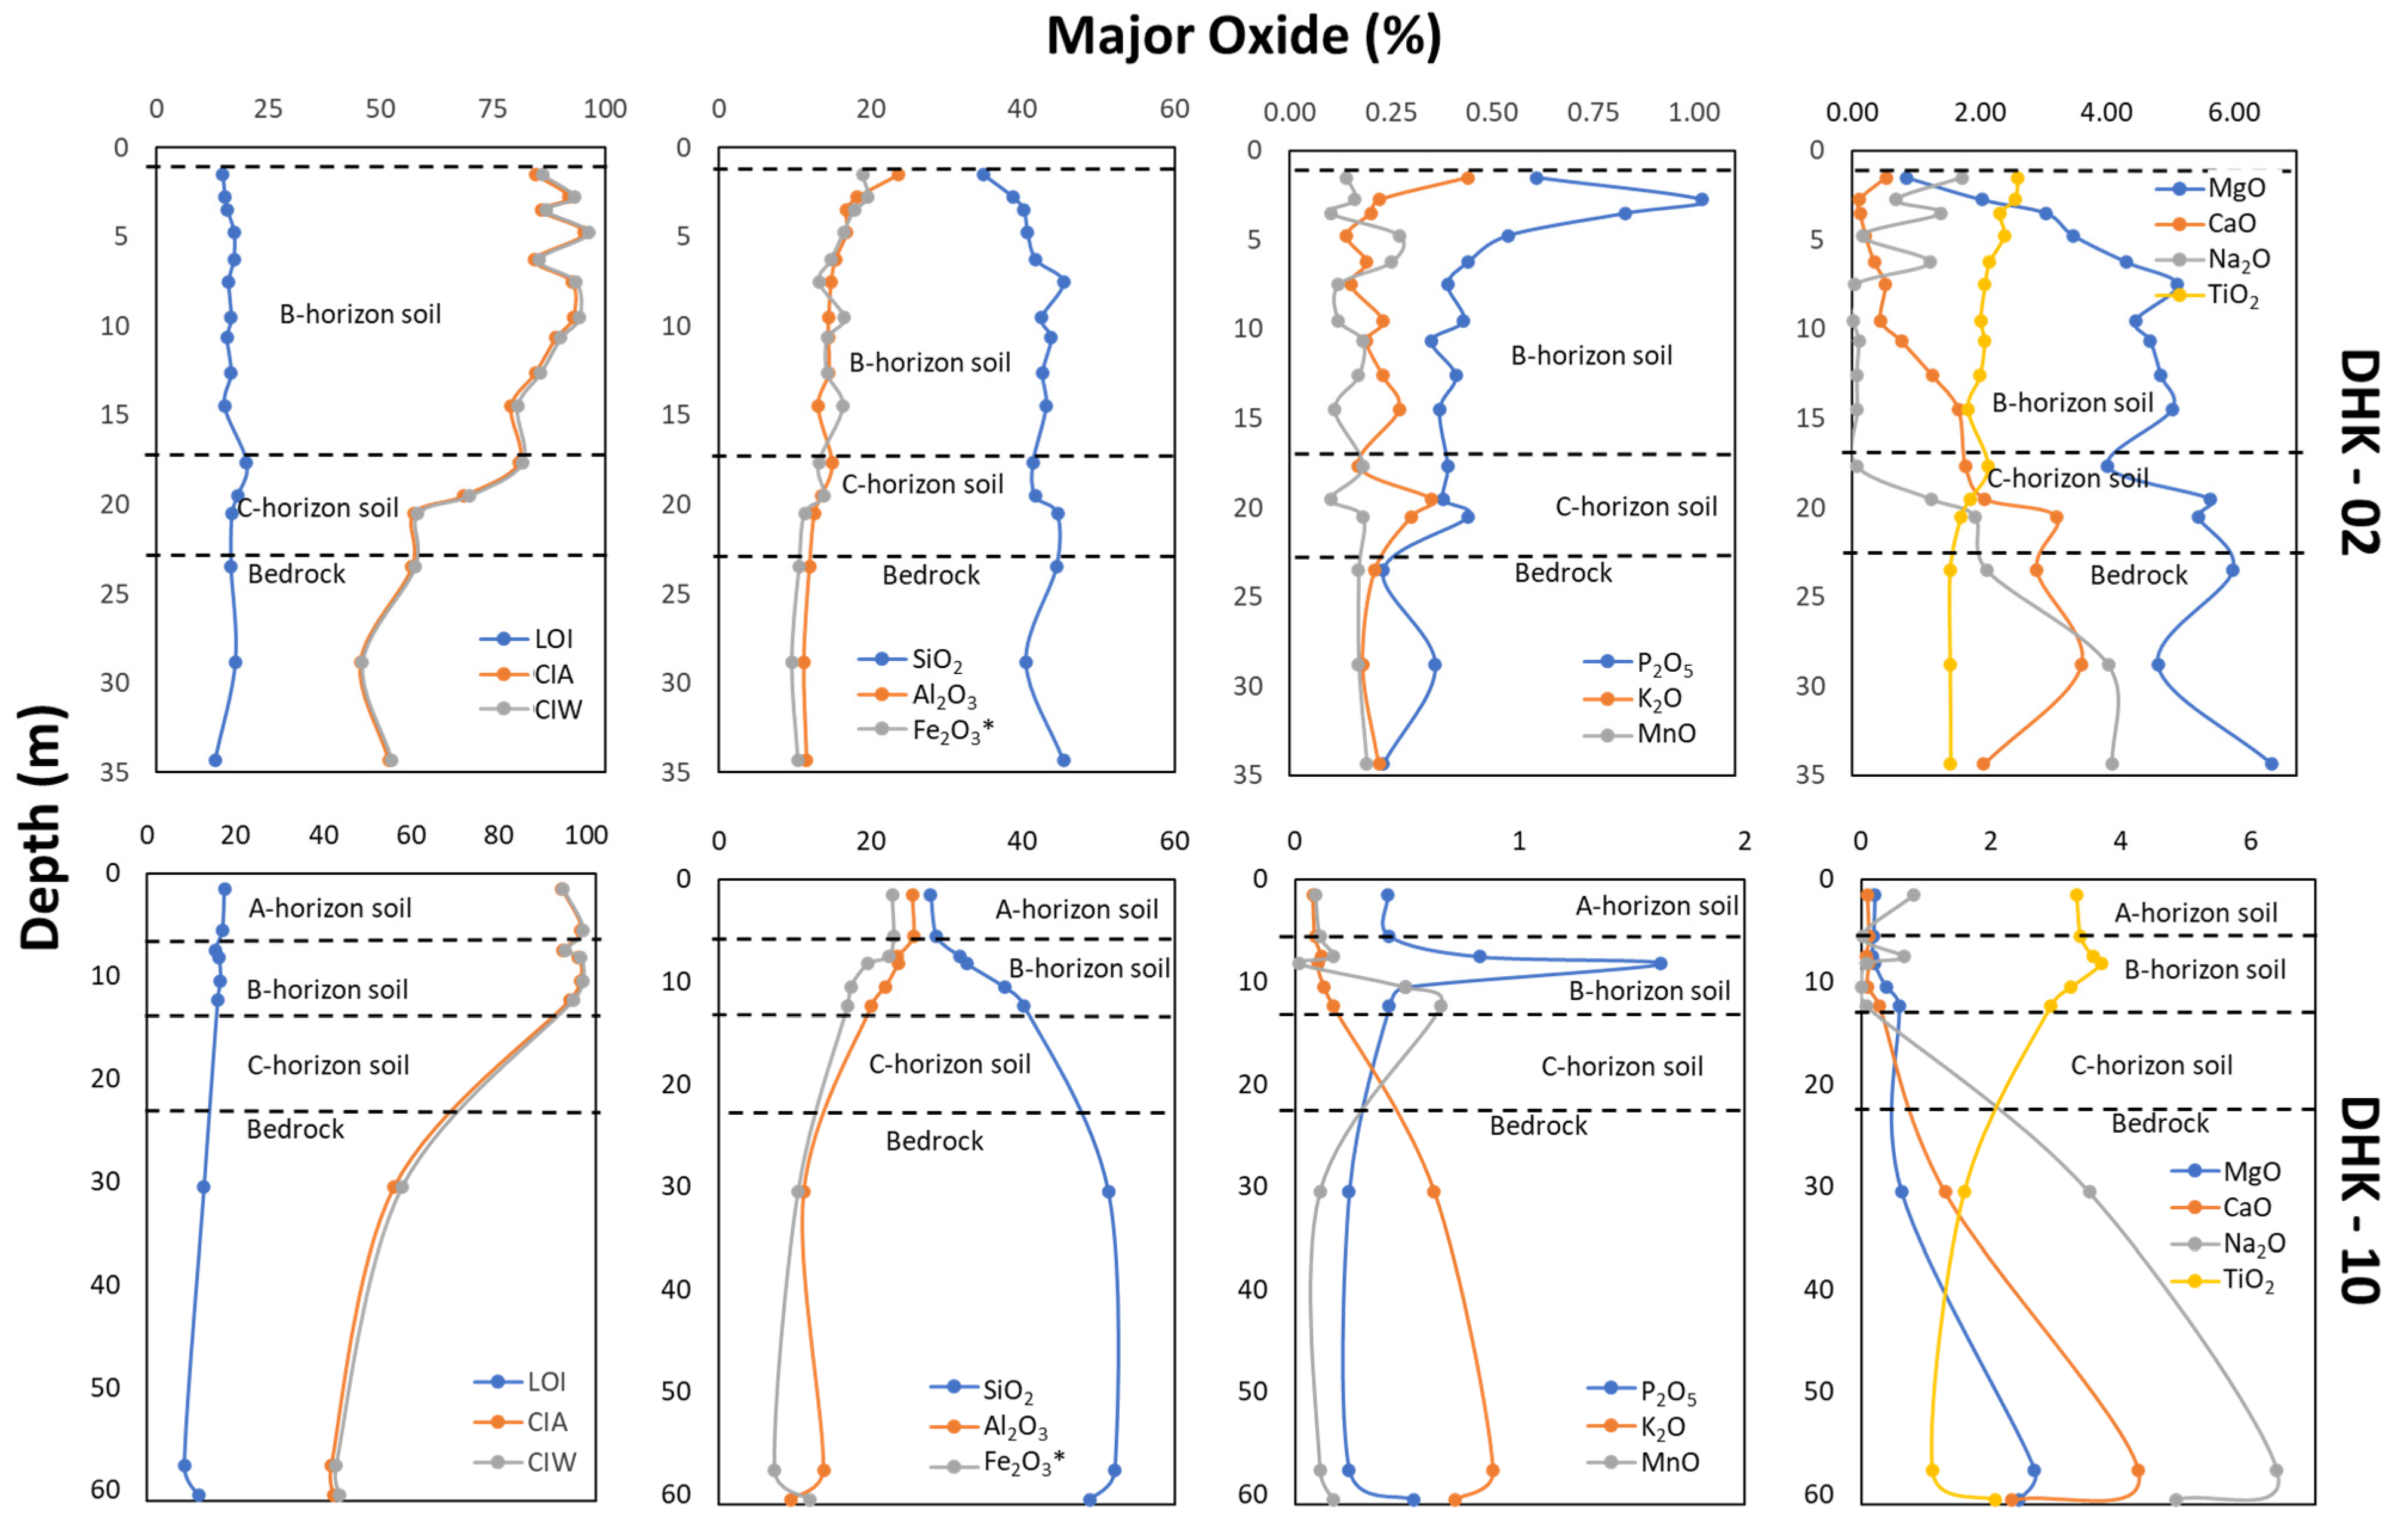
The geochemistry of major elements from XRF is depicted in Table 2. Geochemically, the bedrock is classified as alkaline rocks that fall in foidite, basalt, trachybasalt, and basaltic trachyandesite fields (Figure 6). Moreover, the major oxide evolution in the lateritic profiles of the drill cores is presented in Figure 7. SiO2 concentrations are decreasing over the laterite horizon depth. Al2O3 shows enrichment in the B-horizon, reflecting the accumulation of secondary clay minerals. Fe2O3 is significantly enriched in the B and C-horizons, with DHK-10 displaying a higher level, indicating iron mobilization and subsequent precipitation [39,40]. P2O5 enrichment in the A-horizon of DHK-02 may result from biological activity or secondary phosphate formation [41]. Due to leaching, K2O is relatively depleted in the upper horizons but remains more stable in the lower sections [42]. CaO, Na2O, and MgO exhibit strong depletion throughout the profile, indicating the leaching of these mobile elements. TiO2, being more immobile, is enriched in the residual horizons, particularly in the B-horizon, due to its resistance to weathering processes [43]. The Chemical Index of Alteration (CIA) and the Chemical Index of Weathering (CIW) exhibit elevated values in the A and B-horizons, indicating intense weathering processes, especially in DHK-02. Conversely, the lower value of CIA and CIW indices in the C-horizon and bedrock suggest minimal alteration.
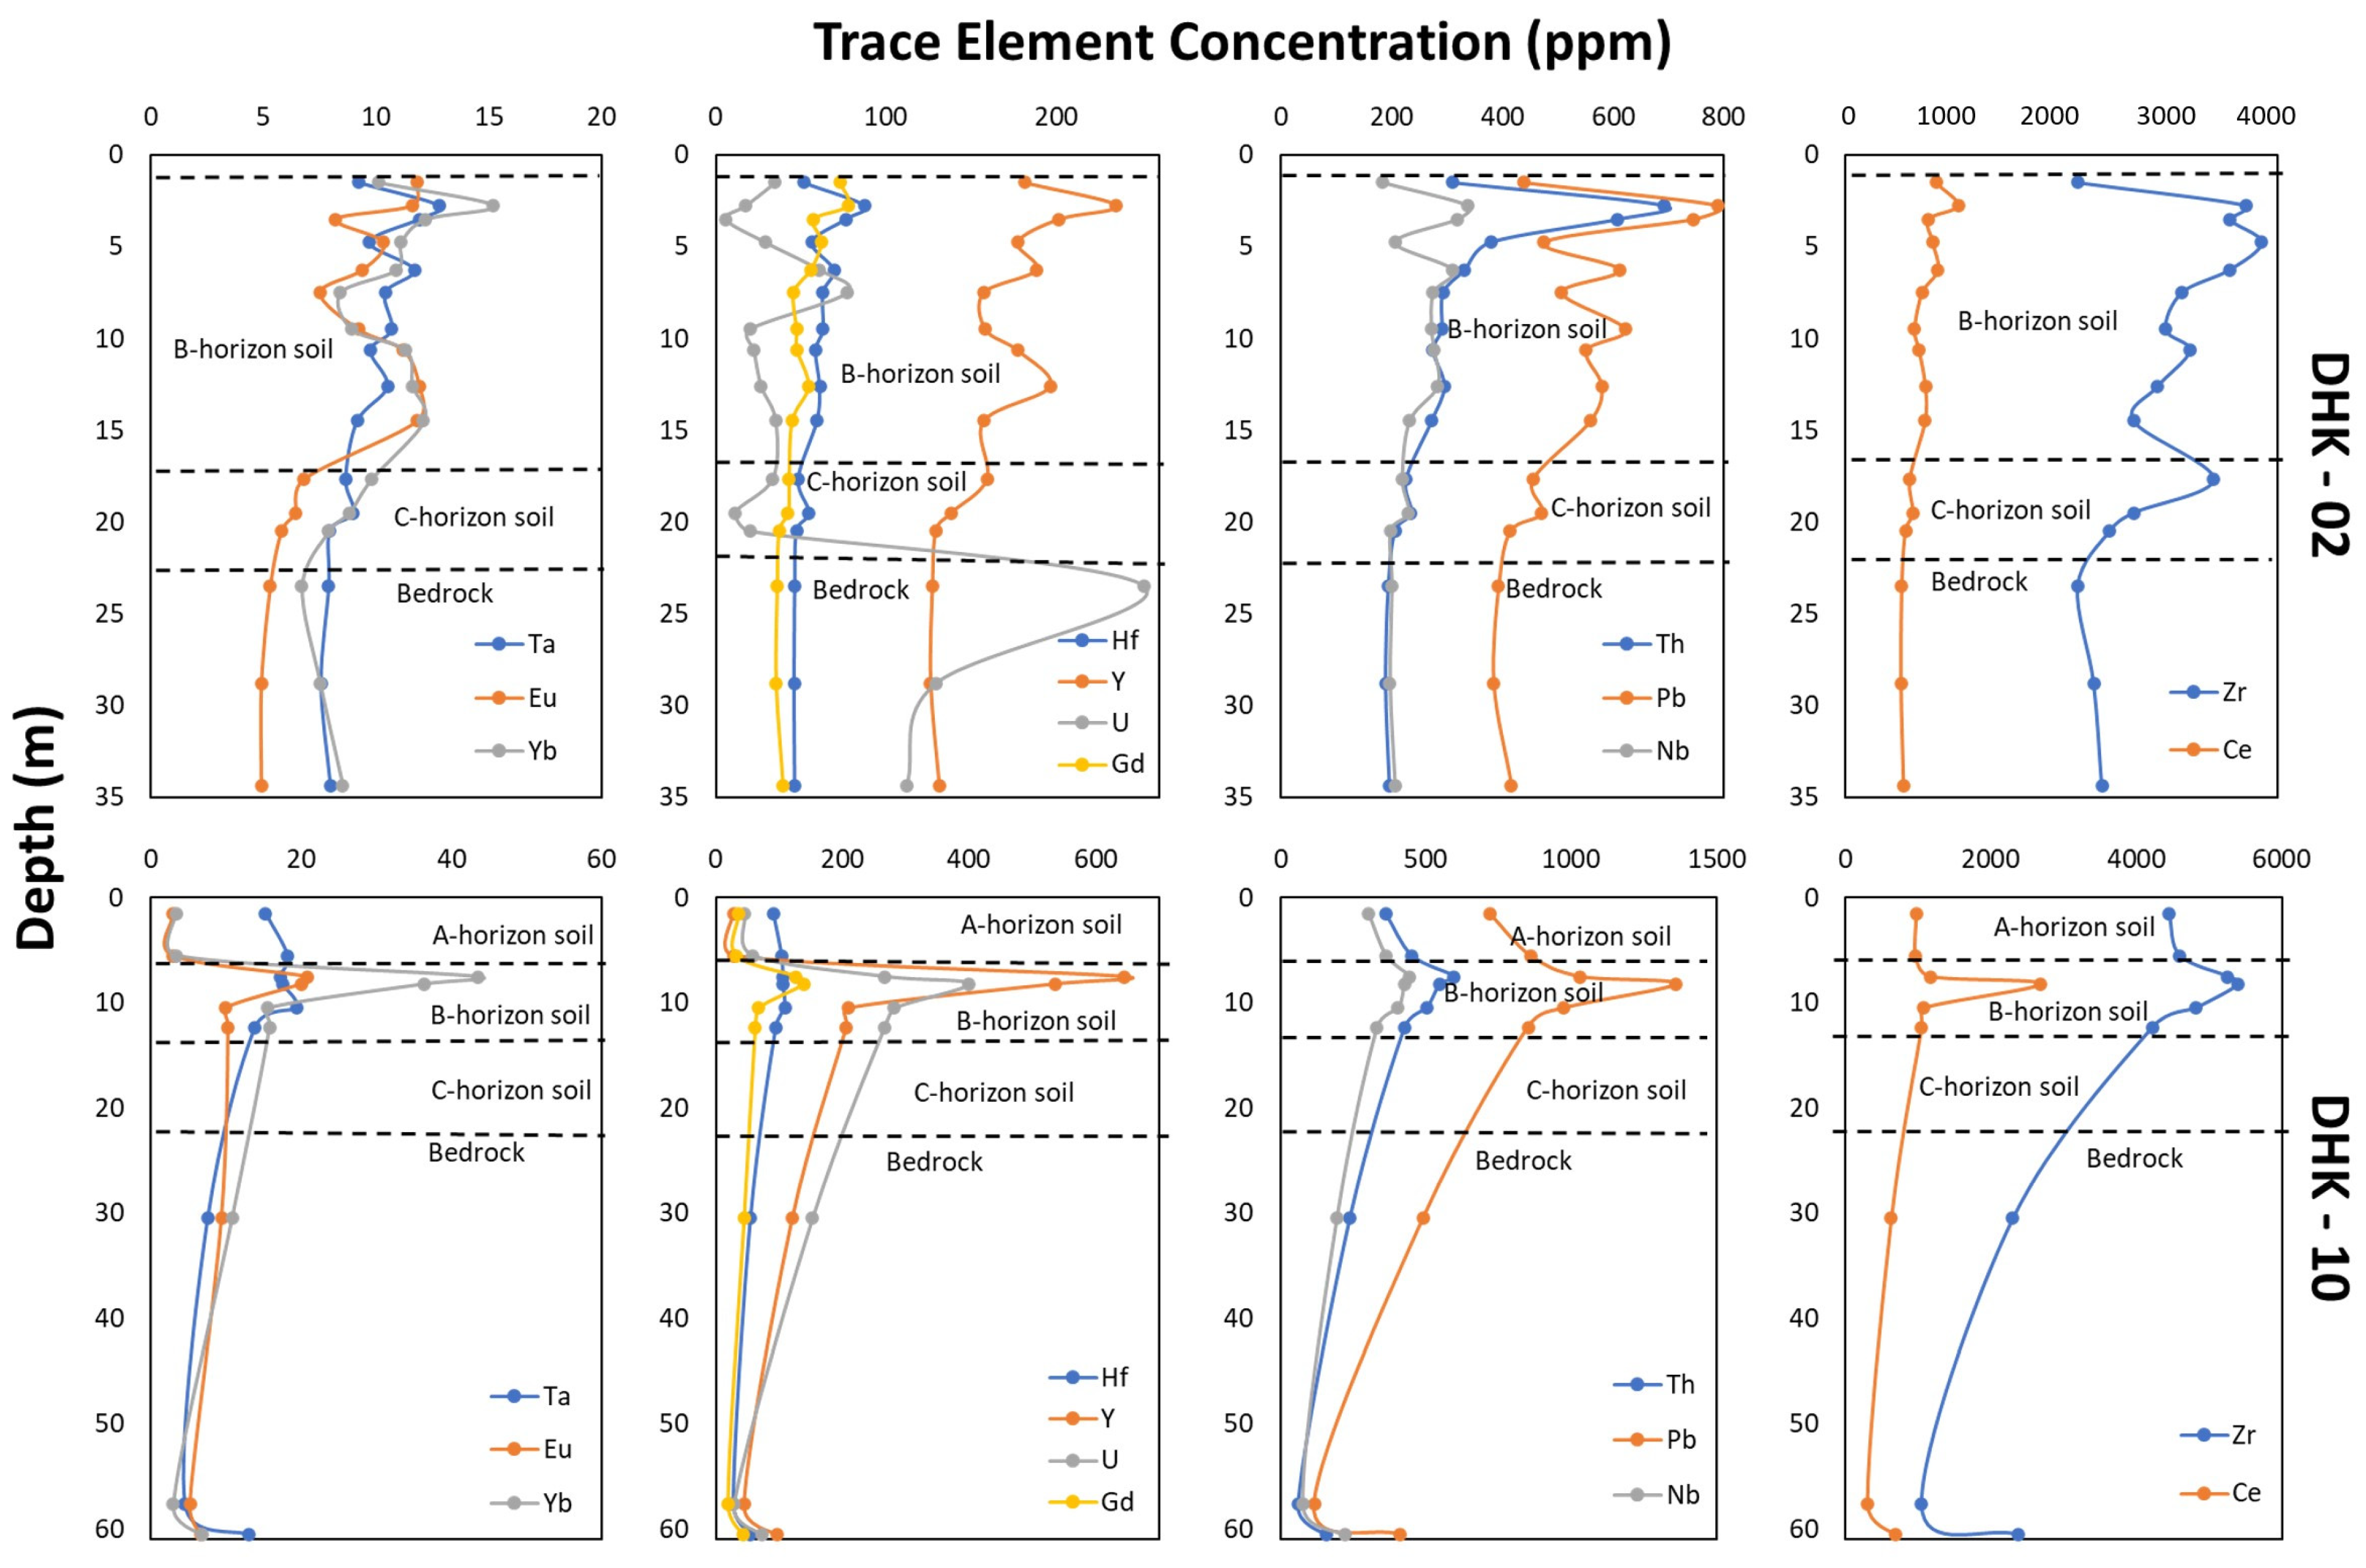
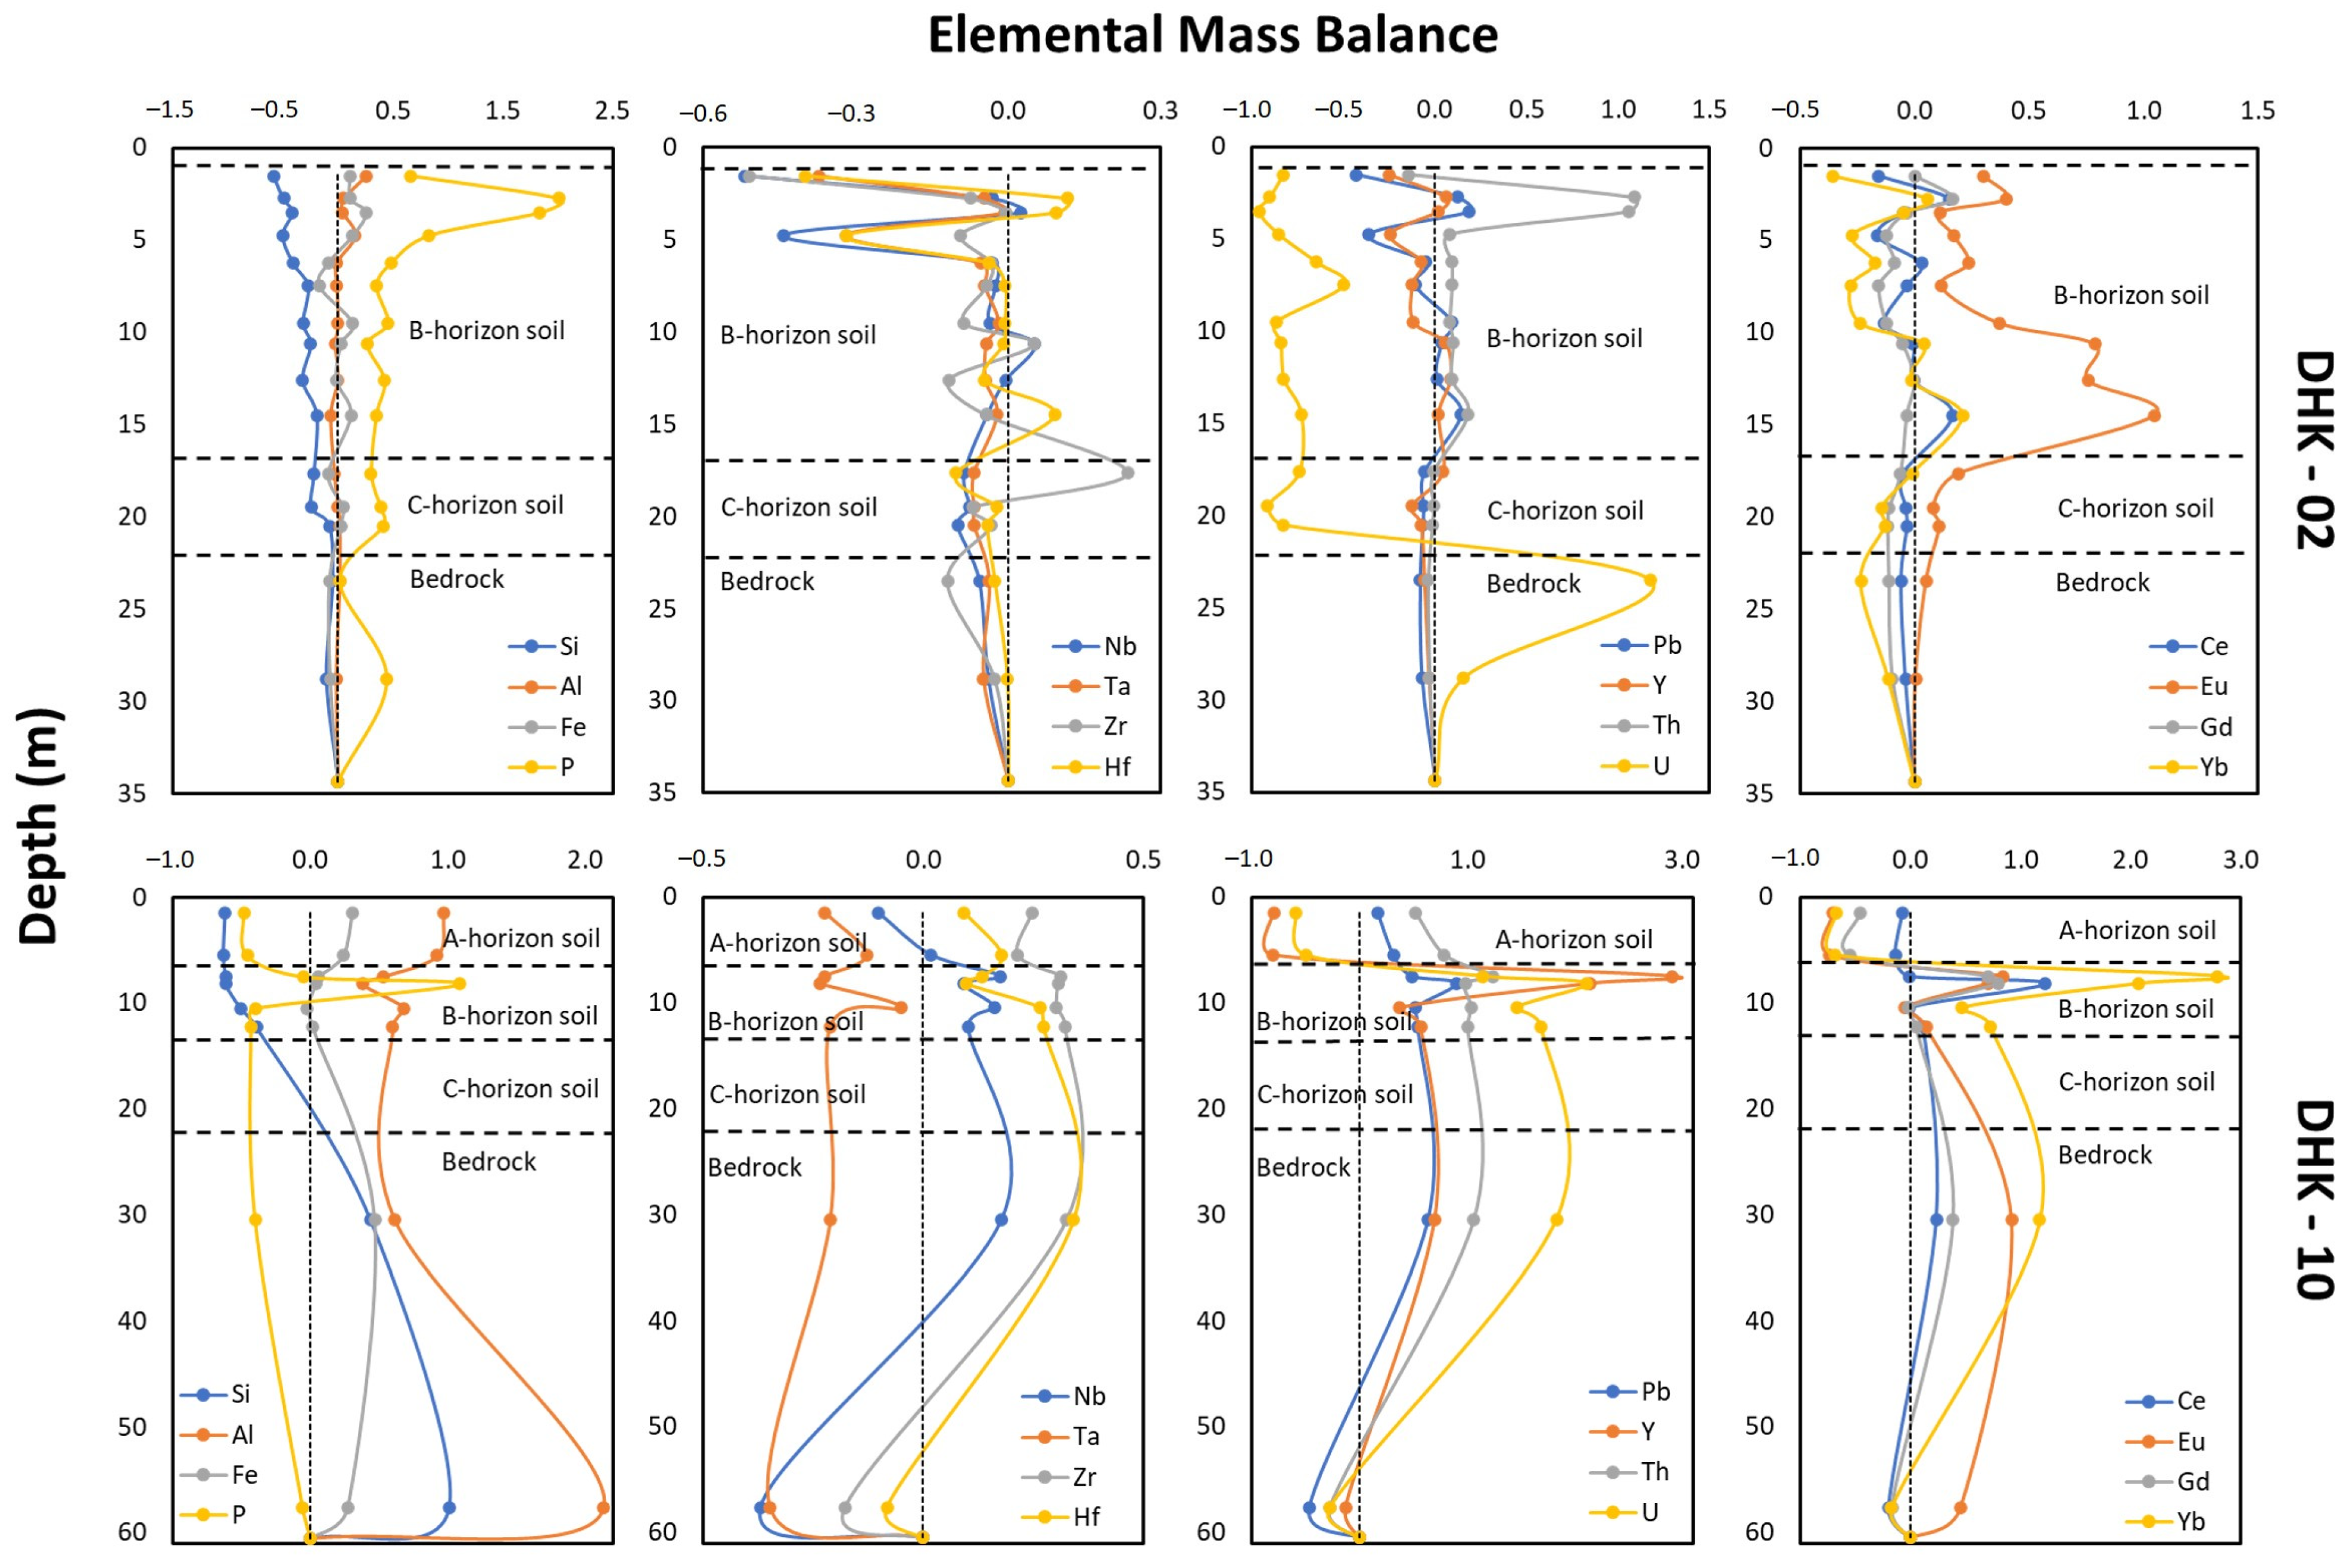
The geochemistry of trace elements from ICP-MS can be seen in Table 3, while Figure 8 displays its profile in the laterite horizon. Ta, Nb, and Zr show notable enrichment in the B-horizon, indicating residual accumulation due to their immobility during intense weathering. Y, Yb, and Gd exhibit higher concentrations in the B and C-horizons, particularly in DHK-10, suggesting preferential retention in secondary minerals. Hf follows a similar trend, with enrichment in the middle horizons. Ce shows strong enrichment in the B-horizon, a characteristic of lateritic profiles due to Ce4+ precipitation under oxidative conditions. This condition might create an adsorption process of Ce4+ onto oxide minerals such as hematite and pyrolusite. Eu exhibits a depletion trend across the profile, consistent with its mobility in tropical weathering environments [44,45]. The Eu’s mobility in a weathering environment is attributed to the decomposition of feldspar in the bedrock. Pb shows enrichment in the upper profile, particularly in DHK-02, possibly due to adsorption onto iron oxides [46,47]. Th’s immobility might cause the enrichment of Th in the upper B-horizon due to the weathering process and Th’s adsorption into the apatite crystal lattice. Uranium displays slightly different enrichment patterns between DHK-02 and DHK-10, with DHK-10 showing a more definite accumulation in the B-horizon, while DHK-02 is at the top of the bedrock.
Figure 6. Total alkali versus silica diagram showing the bedrock in the Takandeang area (diagram after [48]).
Resources 14 00084 g006
Figure 7. Major oxide profile in laterite horizon. The x-axis represents the major oxide composition in wt. %.
Resources 14 00084 g007
Figure 8. Trace element profile in laterite horizon. The x-axis represents trace element composition in ppm.
Resources 14 00084 g008
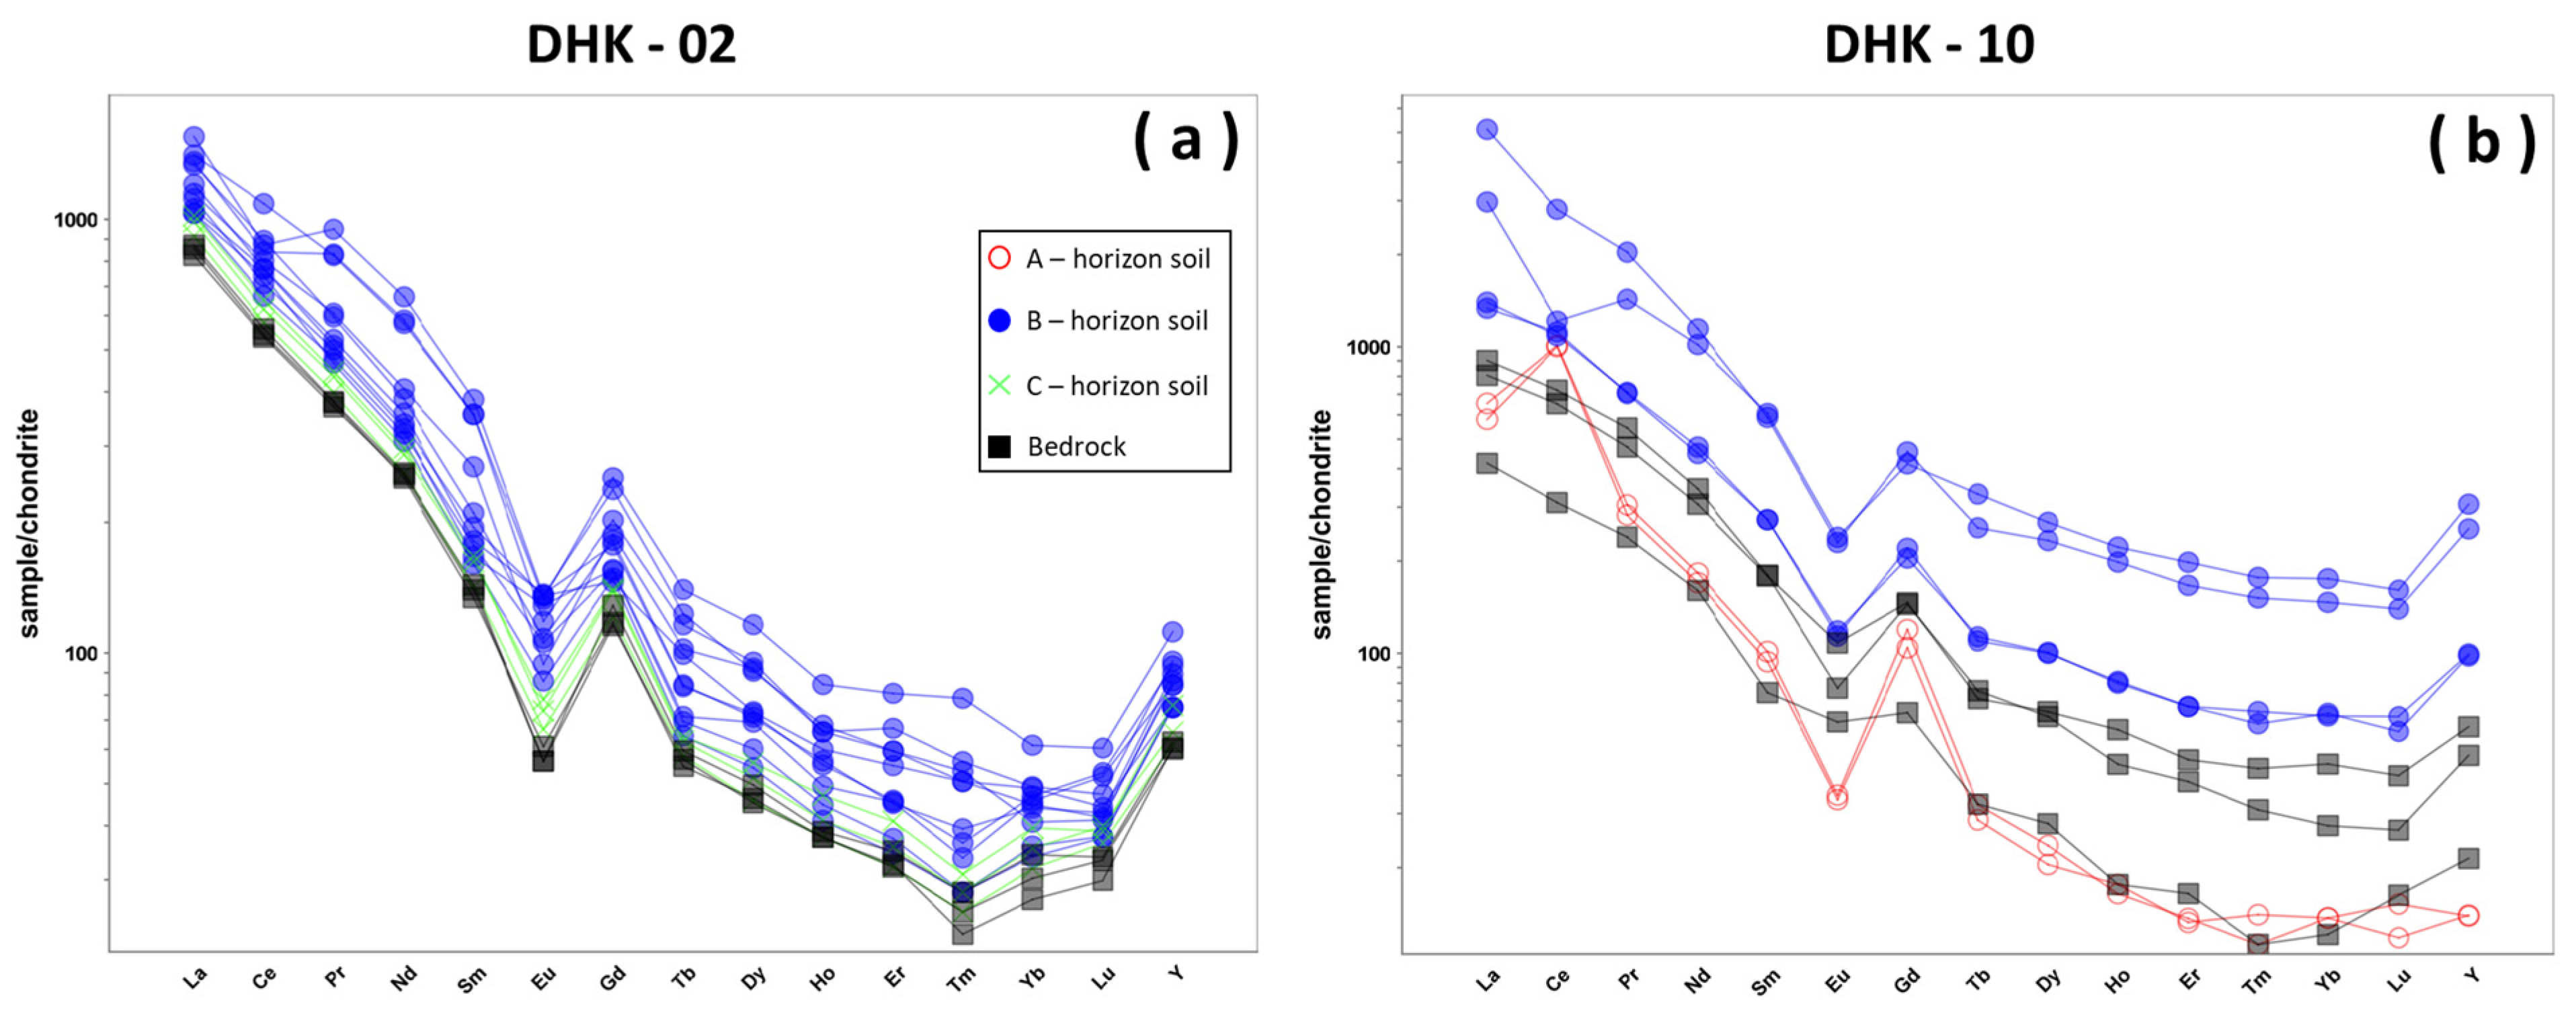
The chondrite-normalized rare earth element (REEs) patterns of the laterite profile, as seen in Figure 9, reveal distinct variations across horizons (A, B, and C) and the underlying bedrock. The A-horizon soil typically shows a more pronounced depletion of heavy rare earth elements (HREEs) + Y, including Gd, Tb, Dy, Ho, Er, Tm, Yb, and Lu, than light rare earth elements (LREEs), which is La, Ce, Pr, Nd, and Sm, relative to the bedrocks. The B-horizon displays an obvious enrichment of REEs relative to the bedrock due to the presence of insoluble REEs minerals or their absorption into clay or oxide minerals. The Eu anomaly in this horizon may still be present but is typically less pronounced than in the A-horizon. The C-horizon soil and the bedrock show patterns closer to the original composition of the parent material, with minimal LREE enrichment and a more uniform distribution of REEs. The Eu anomaly in these layers is usually less evident, indicating limited weathering. The laterite profile generally shows higher REE concentrations, particularly in the B-horizon, due to the accumulation of REEs during weathering.
The chondrite-normalized HFSE patterns of the laterite profiles in DHK-02 and DHK-10 show distinct fractionation trends across different soil horizons (A, B, and C) compared to the bedrock (Figure 10). In both profiles, the B-horizon shows the highest enrichment of HFSEs, particularly in elements such as Nb, Ta, Zr, and Hf, indicating their residual concentration due to intense weathering and the leaching of more mobile elements. The A-horizon exhibits a relatively lower enrichment, suggesting partial depletion and leaching through surface processes. The C-horizon retains an intermediate pattern, reflecting a transition between the highly weathered upper horizons and the less-altered bedrock. The bedrocks on both profiles are characterized by strongly negative anomalies of Tl, W, Mo, and P and negative anomalies of Th, Nb, Sm, Eu, Sn, Sb, Ti, and Li, as well as the depletion of HREEs + Y compared to other elements (Figure 10).
The mass balance trends in the lateritic profiles of DHK-02 and DHK-10 (Figure 11) reveal distinct behaviors among the studied elements. In both drill holes, Si is depleted in the weathered horizons, while P shows a moderate enrichment in the B-horizons. In the DHK-10 profile, the high field strength elements—Nb, Ta, Zr, and Hf—exhibit marked enrichment in the B-horizon. Meanwhile, both drill holes display contrasting behavior for U and Th. U is variably enriched, with its mobility strongly influenced by redox conditions, resulting in greater accumulation in more oxidized upper horizons. In contrast, Th remains consistently enriched across the profiles due to immobility. The REEs further underscore these complex processes as Eu is generally depleted, Ce is enriched under oxidizing conditions, and Yb shows a moderate residual enrichment in both drill holes.

5. Discussion

5.1. Parent Rock Influences on HFSE and REE Enrichment

In laterite deposits, the geochemistry of soils is dominantly inherited from their parent rocks and mineralogical composition. The phonolitic lavas in the Takandeang area were derived from silica-undersaturated alkaline magmatism of the Adang volcanic [10,13,32]. This alkaline magmatism is usually associated with the HSFE and REE mineral system [3,11]. The geochemical content of HSFEs and REEs in bedrocks ranged from 1036 to 2294 ppm Zr, 27 to 55 ppm Hf, 74 to 223 ppm Nb, 60 to 196 ppm Th, 28 to 251 ppm U, and 660 to 1484 ppm total REEs. Those contents were noticeably higher than HSFEs and REEs in several lateritic deposits. Ion-adsorption-type REE mineralization in Southwest China shows that HFSE and REE content in the bedrocks ranged from 212 to 255 ppm Zr, 6.17 to 9.40 ppm Hf, 12.6 to 25.2 ppm Nb, 1.43 to 2.36 ppm Ta, and 419 to 574 ppm total REEs [50,51].
The mineralogical analysis (Figure 3) and XRD diffractograms (Figure 5) show HFSE-bearing minerals, including anatase as a Ti-bearing mineral, britholite and aeschynite as REE-bearing minerals, thorianite as a Th-bearing mineral, and uraninite as a U-bearing mineral. As a major Ti-bearing mineral, rutile and ilmenite could also contain a minor amount of Nb and Ta. Notably, the occurrence of those heavy minerals suggests the presence of residual and detrital phases, which can act as sinks for HFSEs and REEs. Leucite and K-feldspar indicate that the primary silicate phases might partially decompose, contributing to the secondary clay mineral formation. Due to their high cation exchange capacity, these clays play a crucial role in element retention, potentially influencing the enrichment of HFSE and REE-bearing minerals [52,53,54,55].

5.2. Lateritization Process

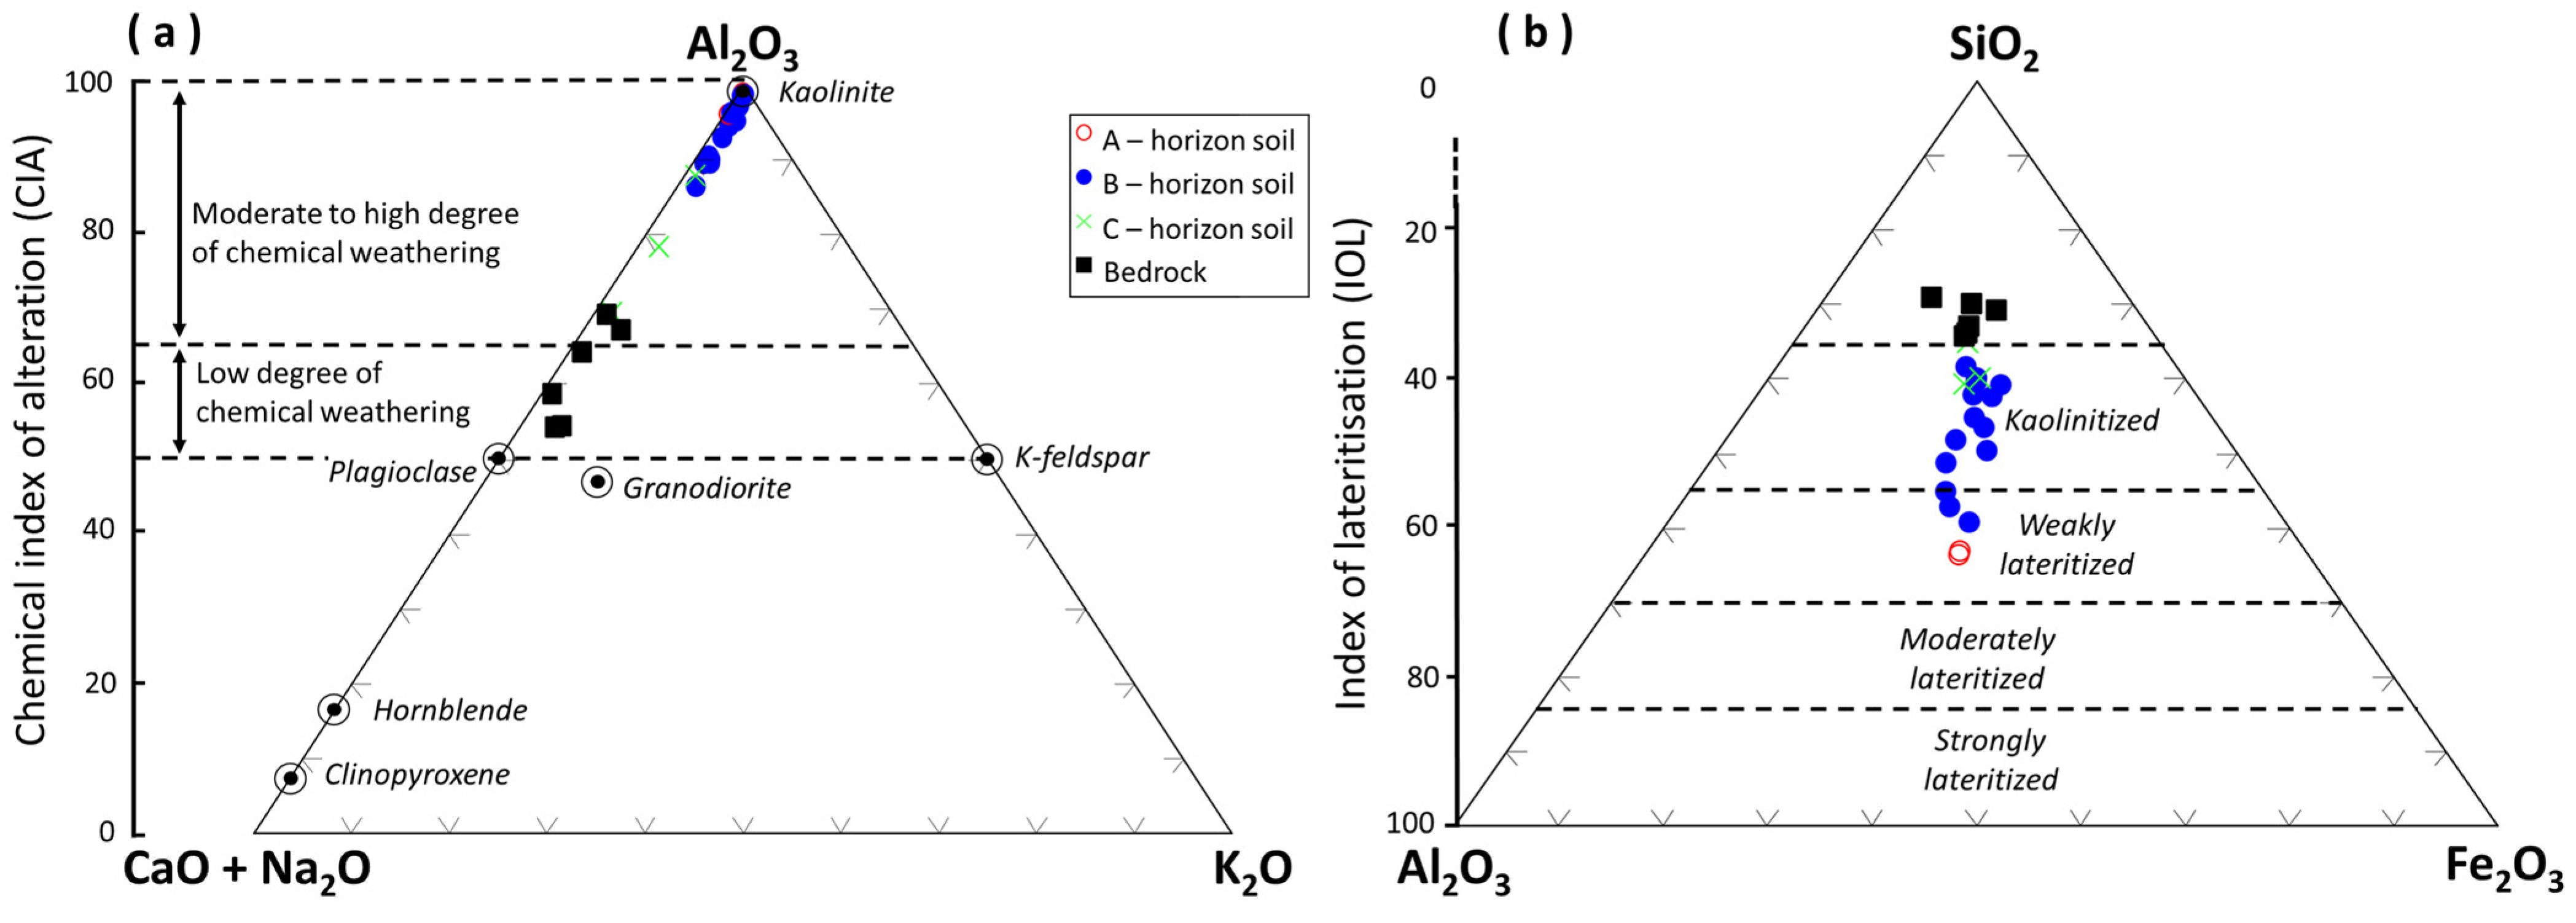
The Chemical Index of Alteration (CIA) and Index of Lateritization (IOL) diagrams based on [56] illustrate the progressive weathering and lateritization trends within the laterite profiles (Figure 12). The CIA plot shows a strong trend from the bedrock towards kaolinite, indicating intense chemical weathering, with most of the B-horizon soil samples clustering near the kaolinite. This suggests the advanced breakdown of feldspar minerals and depletion of mobile elements such as Ca, Na, and K, consistent with a humid tropical weathering environment. The IOL diagram further supports this interpretation, showing a transition of B to A-horizon from kaolinized to weakly lateritized zones, while the bedrock remains at low IOL values.
Weathering profiles are not enclosed systems. Rain and groundwater carry massive amounts of material to and from the soil horizon and cause considerable chemical changes. As weathering progresses, elements are removed from primary minerals and either leached or confined in the secondary minerals [57]. Weathered rocks are substantially more porous than the underlying unaltered crystalline rock, thus allowing water–rock interactions to cause considerable chemical changes. Chemical weathering strongly affects the mineralogy and geochemistry of major elements of rocks. The composite profile displays weathering indices and major element vertical changes (Figure 7). The chemical compositions show that with increasing weathering indices, SiO2, MgO, CaO, Na2O, and K2O content are decreasing and Al2O3, Fe2O3(t), and TiO2 are increasing. The remarkable depletion of the alkaline and alkaline earth elements indicates the breakdown of primary minerals such as feldspathoid, pyroxene, and amphibole.
In the A-CN-K diagram (Figure 12a), the soil profile indicated that high chemical weathering is typical for warm and humid regions. During the weathering of bedrocks, the soil gains an A component along the CN-A line, an increase from C-horizon to A-horizon, and no meaningful change in the K component. This shows that during weathering, Ca and Na are released from feldspathoid and Al gains, resulting in the formation of clay minerals (such as kaolinite, smectite, and illite) and alumina hydroxide minerals (such as gibbsite and boehmite). Meanwhile, K is still retained in the weathered rocks as illite. In the SAF diagram (Figure 12b), with the loss of the SiO2, the soil gains the alkaline and iron oxide components, and the trends do not show a tendency to move toward the A or F peak. The soil formation correlates with the kaolinization process in C-horizon, which then increases and is weakly laterized in B and A-horizons.

5.3. Enrichment of REE

In the soil horizon, the observation shows that most REEs increase in concentration from A-horizon to B-horizon, which indicates leaching from surface layers and accumulation in lower layers [58,59]. At the A-horizon, HREEs + Y shows a more depleted pattern than LREEs (Figure 9), which means HREEs are more easily migrated than LREEs during initial weathering. Meanwhile, LREEs are particularly absorbed in the surface of secondary minerals, such as kaolinite and gibbsite. LREEs can later be released from secondary minerals under harsher weathering and then re-adsorbed by clay minerals in lower horizons [36,57,59,60]. Ce behaves slightly differently than other LREE at A-horizon, and it displays an increase in concentration relative to bedrock. High Fe oxide, Al oxide, and clay content in A-horizon are thought to be the reasons. The oxidation of Ce from Ce3+ to Ce4+ makes it easily trapped in Fe oxide, Al oxide, and clay [57,59]. The enrichment of REEs appears obvious at the B-horizon. The REE that leached from the upper layer accumulated in this horizon and was trapped by clay minerals. The REE does not change much at the C-horizon compared to the bedrock. The weathering process at this level did not significantly affect the increase in REE.
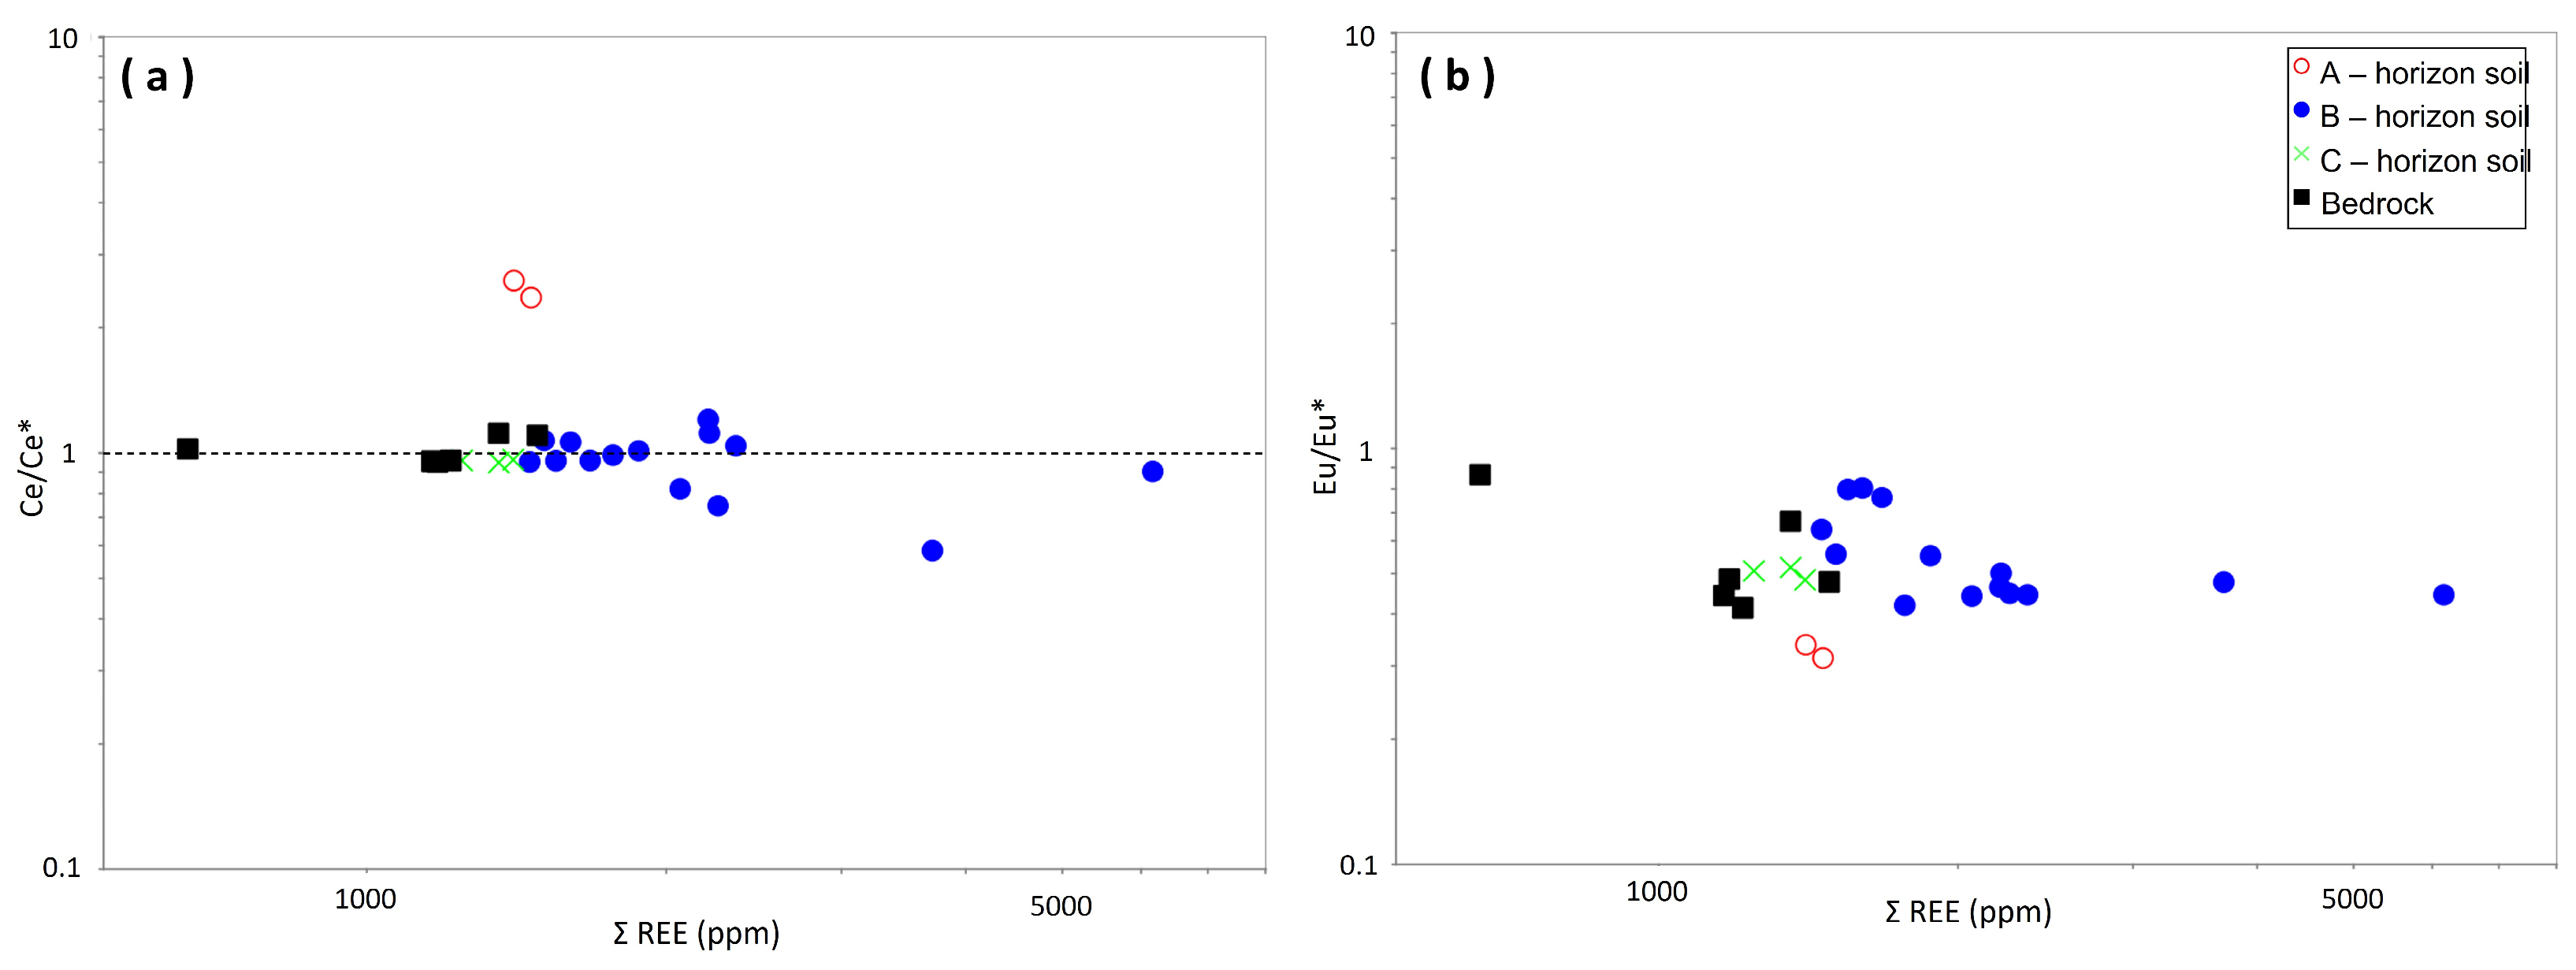
Ce anomalies generally occur when there is a difference in mobility between Ce4+ and trivalent ions from other LREE, including Ce3+. In the samples studied, weakly negative Ce-anomalies were shown in fresh rock samples, soil B and C-horizon (Figure 13a). In addition, there were also positive Ce anomalies in soil A-horizon. Negative Ce anomalies seen in fresh rocks to the B-horizon soil layer are possible due to the enrichment of elements by Ti, Fe, P, and REE due to the weathering process. Meanwhile, positive anomalies in A-horizon are caused by high Ce mineral precipitation due to the change of Ce3+ to Ce4+ [59] during the supply of oxygen-rich rainfall in clay-rich weathered rocks [61].
The weathering process from bedrock to the C-horizon soil did not significantly show changes in the Eu anomalies (Figure 13b). The weathering process at this level did not significantly affect the increase in REE or Eu elements. On the other hand, the weathering process towards the B-horizon soil showed a very significant increase in REEs. REEs may be released from the rock and bound to clay minerals [59,62]. However, the Eu anomaly appears to decrease as REEs increase. This is because other REEs gradually replace the Eu element during weathering [63]. Furthermore, the weathering process to the A-horizon soil decreases REE levels. This is because the weathering process dissolves almost all clay and REEs in the soil. The remaining REE levels will likely come from insoluble minerals such as apatite.

5.4. Enrichment of HFSE

The weathering process dominantly controlled the HFSE enrichment, especially in the B-horizon soil. The evolution of the HFSE content in the lateritic profile started from 1036 to 5404 ppm for Zr, 27 to 109 ppm for Hf, 74 to 443 ppm for Nb, and 4.5 to 19.4 ppm for Ta. Their strong immobility and resistance properties dominantly controlled those HSFE enrichments during weathering. The occurrence of hematite, gibbsite, and boehmite in the surface samples could also adsorb Nb and Ta, which are released from weathering profiles [64].
The elevated radionuclide activity, particularly in Th-232 from the surface samples, clearly stated that Th is resistant to weathering and oxidation processes. These weathering resistance properties of Th are reflected in the elevated concentration from 61 ppm in the bedrock to 611 ppm in the B-horizon soil. In contrast, the other radioactive element, U, shows different properties in DHK-02 and DHK-10 boreholes. The geochemical profile of U in DHK-02 shows a high concentration in the transition between bedrock and C-horizon soil. In DHK-10, the enrichment of U was observed in the transition between bedrock and C-horizon soil and in the upper part of B-horizon soil. The redox-sensitive properties of U cause the different characteristics in both boreholes. Uranium has varying degrees of oxidation, the U4+, which is generally insoluble and forms solid phase minerals such as uraninite, and U6+, the more soluble phase that forms uranyl UO22+ [65]. In oxidizing conditions, U4+ from uraninite in the fresh rock oxidized to U6+ form, which enhance leaching. On the other hand, reducing conditions that occur in the B-horizon soil favor the precipitation of U4+ in iron and manganese compounds. It can be attributed to the topographic position of the boreholes. DHK-02 is located in more stepped terrain. On the contrary, DHK-10 is located in flatter terrain. The terrain morphology will affect the ability of the groundwater to oxidize and move uranium from rocks. Groundwater in stepped terrain will increase the mobility of uranium. Meanwhile, in flat terrain, uranium will have more time to be deposited in the lower horizon; thus, enrichment is observed in DHK-10. Furthermore, other HFSEs also show greater enrichment in DHK-10 compared to DHK-02.

5.5. HFSE–REE Potential in HBNRA

The correlation between U–Th and selected HFSE–REE in the B-horizon soil and bedrock is depicted in Table 4. Uranium in the B-horizon soil exhibits strong correlations with HFSEs and REEs. A similar condition is observed in thorium, though a weaker correlation is seen with REEs. A reversed phenomenon is observed in the bedrock, where thorium displays strong correlations with most HFSEs and REEs, while uranium shows weaker correlations. The correlation between U–Th as elements causing HBNRA in Takandeang confirms the consistency between HFSE–REE and U–Th content in the laterite profile (Figure 8).
Laterite-type REE deposits are one of the promising types of REE deposits because they have large resources and relatively low mining and processing costs [50,66]. Currently, there are more than 170 laterite-type REE deposits that have been exploited in China [67]. Those lateritic types occupy almost 35% of total REEs production in China [50]. One of the laterite REE mines in southern China has a total REE content range between 0.05–0.2 wt.% total REE [50,68,69]. Thus, the Takandeang area has a quite promising HFSE and REE mining potential, with a total REE content in the laterite profile ranging from 600 to 6000 ppm.
The development of HFSE and REE mining in HBNRAs, such as Takandeang, could generate byproducts, waste, and residue containing U, Th, and REEs, inevitably leading to increasing environmental impacts. This study shows the measurement of Th-232 radionuclide activity ranging from 1134 to 1529 Bq/kg and Ra-226 ranging from 502 to 2883 Bq/kg. In addition, the activity of the U-238 radionuclide has also been reported, which ranges from 565 to 2230 Bq/kg [33]. Several publications have also measured the environmental radiation dose in Takandeang, with it ranging from 800 to 2700 nSv/h or equivalent to 7 to 15.5 mSv/yr [12,18,70].
Mining and extraction could release radioactive dust, chemicals, and other toxic metals into the air, soil, and surrounding waters, including groundwater. This activity could affect humans, wildlife, and plants [47,71]. Good practice and waste management are required to minimize the environmental and radiological issues in HFSE and REE mining. The implementation could include radiation exposure and environmental monitoring, solid and liquid waste management, the decontamination and decommissioning of equipment and building used, public communication, and transparency [72].

6. Conclusions

The HFSE and REE initial concentrations in the bedrock were fairly high due to their alkaline affinity characteristics. The mineralogical and geochemical composition in the bedrock provides a potential source for lateritic enrichment. The weathering process leads to the loss of alkaline, alkaline earth, and silica, enriches the concentration of Fe and Al, and verifies the formation of Fe oxide, Al oxide, and clay minerals as laterization progresses. The leaching process on A-horizon soil mobilizes most of HFSEs and REEs. The occurrences of Fe–Al oxide, such as gibbsite and boehmite and clay minerals, such as halloysite, kaolinite, and smectite, allow the adsorption of REEs and HFSEs to the upper B-horizon. The immobility of HFSEs and REEs also affects the enrichment in B-horizon soil. Reduction–oxidation conditions in the groundwater control uranium mobilization and precipitation. Morphological features affect groundwater behavior, which also affects the mobility and precipitation of U in the lateritic profile.
This study confirmed consistency between the rise of HFSE–REE concentrations in the laterite profile with the U–Th contents, which causes HBNRA in Takandeang. The laterite profile in Takandeang presents a unique interplay between valuable resource potential and environmental risk. The enrichment of HFSEs and REEs within the lateritic profile suggests a promising economic resource, particularly in heavily weathered terrains where these elements accumulate due to residual enrichment. However, the concurrent presence of U and Th in these soils raises environmental and health concerns due to their radiological hazards. The strong laterization may enhance the mobility of radionuclides under certain geochemical conditions. This necessitates careful resource management and environmental monitoring to balance economic exploitation with sustainable land use and radiation safety measures.

Author Contributions

Conceptualization, I.G.S., H.S., T.B.A. and F.P.; methodology, I.G.S., F.D.I., S. and F.P.; validation, H.S., F.D.I. and A.S.; formal analysis, S., T.B.A., F.P., R.C.C., D.M., R.A.P.R. and S.W.; investigation, I.G.S., S., F.D.I., T.B.A., A.S. and D.M.; resources, I.G.S., S., F.D.I., M.B. and S.W.; data curation, T.B.A., F.P., A.S., R.A.P.R., P.S. and S.W.; writing—original draft preparation, I.G.S., T.B.A., F.P., P.S. and R.C.C.; writing—review and editing, H.S., F.D.I., M.B., R.A.P.R. and S.W.; visualization, T.B.A., F.P. and R.C.C.; supervision, A.S., D.M., M.B. and S.W.; project administration, F.D.I., M.B., P.S. and A.S.; funding acquisition, I.G.S., F.D.I., R.C.C. and H.S. All authors have read and agreed to the published version of the manuscript.

Funding

This research was supported by the RIIM LPDP (Lembaga Pengelola Dana Pendidikan), Grant Contract B-3846/II.7.5/FR.06.00/11/2023, and BRIN (Badan Riset dan Inovasi Nasional), Grant Contract B-7416/III.2/KU.06.04/11/2023 number 55.

Data Availability Statement

All relevant data are in this paper.

Acknowledgments

We thank the Centre for Nuclear Material and Radioactive Waste Technology and the National Research and Innovation Agency for providing the research facilities. We also thank the Center for Mineral, Coal, and Geothermal Resources for providing support in fieldwork and laboratory analysis. We are grateful for Juan Carlos Sihotang’s aid during the SEM–EDS laboratory analysis.

Conflicts of Interest

The authors declare no conflicts of interest.

References

  1. Hofmann, E.; Rüsch, M. Industry 4.0 and the Current Status as Well as Future Prospects on Logistics. Comput. Ind. 2017, 89, 23–34. [Google Scholar] [CrossRef]
  2. Zhang, Y.; Ma, Y. Research Progress on Titanium–Niobium Micro-Alloyed High-Strength Steel. Materials 2025, 18, 325. [Google Scholar] [CrossRef] [PubMed]
  3. Beard, C.D.; Goodenough, K.M.; Borst, A.M.; Wall, F.; Siegfried, P.R.; Deady, E.A.; Pohl, C.; Hutchison, W.; Finch, A.A.; Walter, B.F.; et al. Alkaline-Silicate REE-HFSE Systems. Econ. Geol. 2023, 118, 177–208. [Google Scholar] [CrossRef]
  4. Aliyu, A.S.; Ramli, A.T. The World’s High Background Natural Radiation Areas (HBNRAs) Revisited: A Broad Overview of the Dosimetric, Epidemiological and Radiobiological Issues. Radiat. Meas. 2015, 73, 51–59. [Google Scholar] [CrossRef]
  5. Fathabadi, N.; Salehi, A.A.; Nadda, K.; Kardan, M.R. Public Ingestion Exposure to 226Ra in Ramsar, Iran. J. Environ. Radioact. 2019, 198, 11–17. [Google Scholar] [CrossRef]
  6. Yang, B.; Tuo, F.; Zhou, Q.; Zhang, J.; Li, Z.; Pang, C. Dietary Exposure of Radionuclides and Heavy Metals in Adult Residents in a High Background Natural Radiation Area Using Duplicate Diet Method. Sci. Rep. 2022, 12, 16676. [Google Scholar] [CrossRef]
  7. Daling, L.; Chunxiang, Z.; Zujie, G.; Xian, L.; Guorong, H. Gamma-Spectrometric Measurements of Natural-Radionuclide Contents in Soil and Gamma Dose Rates in Yangjiang, PR China. Nucl. Instrum. Methods Phys. Res. A 1990, 299, 687–689. [Google Scholar] [CrossRef]
  8. Nugraha, E.D.; Hosoda, M.; Kusdiana; Untara; Mellawati, J.; Nurokhim; Tamakuma, Y.; Ikram, A.; Syaifudin, M.; Yamada, R.; et al. Comprehensive Exposure Assessments from the Viewpoint of Health in a Unique High Natural Background Radiation Area, Mamuju, Indonesia. Sci. Rep. 2021, 11, 14578. [Google Scholar] [CrossRef]
  9. Hosoda, M.; Nugraha, E.D.; Akata, N.; Yamada, R.; Tamakuma, Y.; Sasaki, M.; Kelleher, K.; Yoshinaga, S.; Suzuki, T.; Rattanapongs, C.P.; et al. A Unique High Natural Background Radiation Area–Dose Assessment and Perspectives. Sci. Total Environ. 2021, 750, 142346. [Google Scholar] [CrossRef]
  10. Rosianna, I.; Nugraha, E.D.; Tazoe, H.; Syaeful, H.; Muhammad, A.G.; Sukadana, I.G.; Indrastomo, F.D.; Ngadenin; Pratiwi, F.; Sumaryanto, A.; et al. Uranium Isotope Characterization in Volcanic Deposits in a High Natural Background Radiation Area, Mamuju, Indonesia. Geosciences 2023, 13, 388. [Google Scholar] [CrossRef]
  11. Sukadana, I.G.; Warmada, I.W.; Pratiwi, F.; Harijoko, A.; Adimedha, T.B.; Yogatama, A.W. Elemental Mapping for Characterizing of Thorium and Rare Earth Elements (REE) Bearing Minerals Using ΜXRF. Atom Indones. 2022, 48, 87–98. [Google Scholar] [CrossRef]
  12. Syaeful, H.; Sukadana, I.G.; Sumaryanto, A. Radiometric Mapping for Naturally Occurring Radioactive Materials (NORM) Assessment in Mamuju, West Sulawesi. Atom Indones. 2014, 40, 33–39. [Google Scholar] [CrossRef]
  13. Sukadana, I.G.; Harijoko, A.; Setijadji, L.D. Tataan Tektonika Batuan Gunung Api di Komplek Adang Kabupaten Mamuju Provinsi Sulawesi Barat. Eksplorium 2015, 36, 31. [Google Scholar] [CrossRef]
  14. Lan, T.; Hao, L.; Lu, J.; Yin, Y.; Chen, X.; Fan, Y.; Zhao, W.; Hou, Y. Geochemical Behavior of Different Chemical Elements during Weathering of the Basalts in Changbai Mountain, Northeast China. Sustainability 2021, 13, 12796. [Google Scholar] [CrossRef]
  15. Cakrabuana, W.; Ciputra, R.C.; Syaeful, H. Assessing the Undiscovered Resources of Uranium and Thorium in Mamuju, West Sulawesi. IOP Conf. Ser. Earth Environ. Sci. 2021, 851, 012041. [Google Scholar] [CrossRef]
  16. Syaeful, H.; Muhammad, A.G.; Rachael, Y.; Pratiwi, F.; Rosianna, I.; Ngadenin, N.; Indrastomo, F.D.; Ciputra, R.C.; Sukadana, I.G. Delineation of Permissive Tract for 3-Part Quantitative Undiscovered Resources Assessment of Uranium and Thorium in Mamuju, West Sulawesi. AIP Conf. Proc. 2024, 2967, 110013. [Google Scholar]
  17. Alvionita, A.F.; Syafrizal, S.; Al Hakim, A.Y. Mineralogi Dan Pengayaan REE Tipe Ion-Adsorption Pada Profil Lapukan Granitoid di Sulawesi Barat; Implikasi Terhadap Eksplorasi. J. GEOSAPTA 2023, 9, 95. [Google Scholar] [CrossRef]
  18. Sukadana, I.G.; Warmada, I.W.; Harijoko, A.; Indrastomo, F.D.; Syaeful, H. The Application of Geostatistical Analysis on Radiometric Mapping Data to Recognized the Uranium and Thorium Anomaly in West Sulawesi, Indonesia. IOP Conf. Ser. Earth Environ. Sci. 2021, 819, 012030. [Google Scholar] [CrossRef]
  19. Pratiwi, F.; Rachael, Y.; Syaeful, H.; Sukadana, I.G.; Indrastomo, F.D. Elemental Mapping Micro-XRF (EMMX) Analysis for Identifying Uranium and Thorium Bearing Minerals in Rantedoda Area, Mamuju, West Sulawesi. AIP Conf. Proc. 2024, 2967, 170004. [Google Scholar]
  20. Ritonga, R.; Maulana, A.; Tonggiroh, A. Rare Earth Elements Distribution in Weathered Volcanic Rock from Mamuju Area, West Sulawesi. IOP Conf. Ser. Earth Environ. Sci. 2021, 921, 012039. [Google Scholar] [CrossRef]
  21. Hall, R.; Sevastjanova, I. Australian Crust in Indonesia. Aust. J. Earth Sci. 2012, 59, 827–844. [Google Scholar] [CrossRef]
  22. Elburg, M.; van Leeuwen, T.; Foden, J. Muhardjo Spatial and Temporal Isotopic Domains of Contrasting Igneous Suites in Western and Northern Sulawesi, Indonesia. Chem. Geol. 2003, 199, 243–276. [Google Scholar] [CrossRef]
  23. Simandjuntak, T.O. Sedimentology and Tectonics of the Collision Complex in the East Arm of Sulawesi. Ph.D. Thesis, University of London, London, UK, 1986. [Google Scholar]
  24. Guntoro, A. The Formation of the Makassar Strait and the Separation between SE Kalimantan and SW Sulawesi. J. Asian Earth Sci. 1999, 17, 79–98. [Google Scholar] [CrossRef]
  25. Polvé, M.; Maury, R.C.; Bellon, H.; Rangin, C.; Priadi, B.; Yuwono, S.; Joron, J.L.; Atmadja, R.S. Magmatic Evolution of Sulawesi (Indonesia): Constraints on the Cenozoic Geodynamic History of the Sundaland Active Margin. Tectonophysics 1997, 272, 69–92. [Google Scholar] [CrossRef]
  26. van Leeuwen, T.M. Muhardjo Stratigraphy and Tectonic Setting of the Cretaceous and Paleogene Volcanic-Sedimentary Successions in Northwest Sulawesi, Indonesia: Implications for the Cenozoic Evolution of Western and Northern Sulawesi. J. Asian Earth Sci. 2005, 25, 481–511. [Google Scholar] [CrossRef]
  27. Hennig, J.; Hall, R.; Armstrong, R.A. U-Pb Zircon Geochronology of Rocks from West Central Sulawesi, Indonesia: Extension-Related Metamorphism and Magmatism during the Early Stages of Mountain Building. Gondwana Res. 2016, 32, 41–63. [Google Scholar] [CrossRef]
  28. Hennig, J.; Hall, R.; Forster, M.A.; Kohn, B.P.; Lister, G.S. Rapid Cooling and Exhumation as a Consequence of Extension and Crustal Thinning: Inferences from the Late Miocene to Pliocene Palu Metamorphic Complex, Sulawesi, Indonesia. Tectonophysics 2017, 712–713, 600–622. [Google Scholar] [CrossRef]
  29. Coffield, D.Q.; Bergman, S.C.; Garrard, R.A.; Guritno, N.; Robinson, N.M.; Talbot, J. Tectonic and Stratigraphic Evolution of the Kalosi PSC Area and Associated Development of a Tertiary Petroleum System, South Sulawesi, Indonesia. In Proceedings of the Indonesian Petroleum Association 22nd Annual Convention, Jakarta, Indonesia, 13–14 October 1993; pp. 679–706. [Google Scholar]
  30. Calvert, S.J.; Hall, R. Cenozoic Evolution of the Lariang and Karama Regions, North Makassar Basin Western Sulawesi, Indonesia. Pet. Geosci. 2007, 13, 353–368. [Google Scholar] [CrossRef]
  31. Ratman, N.; Atmawinata, S. Geological Map of The Mamuju Quadrangle, Sulawesi; Geological Research and Development Centre: Bandung, Indonesia, 1993. [Google Scholar]
  32. Sukadana, I.G. Magma Evolution and Radioactive Minerals Enrichment in Adang Volcanic Rocks in Mamuju, West Sulawesi. Ph.D. Thesis, Universitas Gadjah Mada, Sleman, Indonesia, 2023. [Google Scholar]
  33. Rosianna, I.; Nugraha, E.D.; Syaeful, H.; Putra, S.; Hosoda, M.; Akata, N.; Tokonami, S. Natural Radioactivity of Laterite and Volcanic Rock Sample for Radioactive Mineral Exploration in Mamuju, Indonesia. Geosciences 2020, 10, 376. [Google Scholar] [CrossRef]
  34. El-Gamal, A.A.; Saleh, I.H. Radiological and Mineralogical Investigation of Accretion and Erosion Coastal Sediments in Nile Delta Region, Egypt. J. Oceanogr. Mar. Sci. 2012, 3, 41–55. [Google Scholar] [CrossRef]
  35. Reguigui, N. Gamma Ray Spectrometry Practical Information; Center National des science et Technology Nuclearies: Tunis, Tunisia, 2014. [Google Scholar]
  36. Nesbitt, H.W. Mobility and Fractionation of Rare Earth Elements during Weathering of a Granodiorite. Nature 1979, 279, 206–210. [Google Scholar] [CrossRef]
  37. Jiang, K.; Qi, H.W.; Hu, R.Z. Element Mobilization and Redistribution under Extreme Tropical Weathering of Basalts from the Hainan Island, South China. J. Asian Earth Sci. 2018, 158, 80–102. [Google Scholar] [CrossRef]
  38. Yousefifard, M.; Ayoubi, S.; Jalalian, A.; Khademi, H.; Makkizadeh, M.A. Mass Balance of Major Elements in Relation to Weathering in Soils Developed on Igneous Rocks in a Semiarid Region, Northwestern Iran. J. Mt. Sci. 2012, 9, 41–58. [Google Scholar] [CrossRef]
  39. Hong, H.; Wang, J.; Wang, C.; Liu, C.; Algeo, T.J.; Zhao, L.; Zhou, L.; Zhang, D.; Fang, Q. Clay and Fe (Oxyhydr)Oxide Mineralogy in the Basalt Weathering Profile in Hainan (Southern China): Implications for Pedogenesis Process. Clays Clay Miner. 2024, 72, e8. [Google Scholar] [CrossRef]
  40. Lima, A.P.B.; Inda, A.V.; Zinn, Y.L.; do Nascimento, P.C. Weathering Sequence of Soils along a Basalt-Sandstone Toposequence in the Brazilian Cerrado. Geoderma 2021, 394, 115009. [Google Scholar] [CrossRef]
  41. Dzombak, R.M.; Sheldon, N.D. Weathering Intensity and Presence of Vegetation Are Key Controls on Soil Phosphorus Concentrations: Implications for Past and Future Terrestrial Ecosystems. Soil Syst. 2020, 4, 73. [Google Scholar] [CrossRef]
  42. Guagliardi, I.; Zuzolo, D.; Albanese, S.; Lima, A.; Cerino, P.; Pizzolante, A.; Thiombane, M.; De Vivo, B.; Cicchella, D. Uranium, Thorium and Potassium Insights on Campania Region (Italy) Soils: Sources Patterns Based on Compositional Data Analysis and Fractal Model. J. Geochemical Explor. 2020, 212, 106508. [Google Scholar] [CrossRef]
  43. Godang, S.; Idrus, A.; Fadlin, B.P.; Basuki, N.I. Saprolitization Characteristics of Rare Earth Elements in Volcanic Regolith on Drill Core #65 in Western Sulawesi, Indonesia. Asian J. Appl. Sci. 2019, 7, 435–450. [Google Scholar] [CrossRef]
  44. Tiomo, I.F.; Tematio, P.; Momo, M.N.; Happi, F.D.; Guimapi, N.T.; Tchaptchet, W.C. Mineralogical and Geochemical Evolution of Pre-Lateritic Soil Profiles over Schist Basement of the Lom Series (Bétaré-Oya, East Cameroon): Implication to Rock Weathering and Lithologic Constraints on Trace Elements Fractionation. J. Afr. Earth Sci. 2021, 176, 104133. [Google Scholar] [CrossRef]
  45. Saputro, S.P.; Godang, S.; Priadi, B.; Basuki, N.I.; Himawan, B. Geochemical Study of Al–Fe–Ti Enrichment in Rock Weathering: Implications for the Recognizing of Igneous Protolith and the Enrichment of REE in Soil Profile. Appl. Geochem. 2022, 140, 105259. [Google Scholar] [CrossRef]
  46. Yin, H.; Tan, N.; Liu, C.; Wang, J.; Liang, X.; Qu, M.; Feng, X.; Qiu, G.; Tan, W.; Liu, F. The Associations of Heavy Metals with Crystalline Iron Oxides in the Polluted Soils around the Mining Areas in Guangdong Province, China. Chemosphere 2016, 161, 181–189. [Google Scholar] [CrossRef]
  47. Patel, K.S.; Sharma, S.; Maity, J.P.; Martín-Ramos, P.; Fiket, Ž.; Bhattacharya, P.; Zhu, Y. Occurrence of Uranium, Thorium and Rare Earth Elements in the Environment: A Review. Front. Environ. Sci. 2023, 10, 1058053. [Google Scholar] [CrossRef]
  48. Le Bas, M.J.; Le Maitre, R.W.; Streckeisen, A.; Zanettin, B. A Chemical Classification of Volcanic Rocks Based on the Total Alkali-Silica Diagram. J. Petrol. 1986, 27, 745–750. [Google Scholar] [CrossRef]
  49. McDonough, W.F.; Sun, S.S. The Composition of the Earth. Chem. Geol. 1995, 120, 223–253. [Google Scholar] [CrossRef]
  50. Li, Y.H.M.; Zhao, W.W.; Zhou, M.F. Nature of Parent Rocks, Mineralization Styles and Ore Genesis of Regolith-Hosted REE Deposits in South China: An Integrated Genetic Model. J. Asian Earth Sci. 2017, 148, 65–95. [Google Scholar] [CrossRef]
  51. Gan, L.; Yan, B.; Liu, Y.; Gao, Y.; Yin, C.; Zhu, L.; Tan, S.; Ding, D.; Jiang, H. Geochemical and Mineralogical Characteristics of Ion-Adsorption Type REE Mineralization in the Mosuoying Granite, Panxi Area, Southwest China. Minerals 2023, 13, 1449. [Google Scholar] [CrossRef]
  52. Singh, B.K.; Um, W. Application of Clay Materials for Sorption of Radionuclides from Waste Solutions. Minerals 2023, 13, 239. [Google Scholar] [CrossRef]
  53. Norris, S. Multiple Roles of Clays in Radioactive Waste Confinement–Introduction. Geol. Soc. Spec. Publ. 2019, 482, 1–9. [Google Scholar] [CrossRef]
  54. Zhu, Q.; Li, J.; Li, G.; Wen, S.; Yu, R.; Tang, C.; Feng, X.; Liu, X. Characteristics of Sandstone-Type Uranium Mineralization in the Hangjinqi Region of the Northeastern Ordos Basin: Clues from Clay Mineral Studies. Ore Geol. Rev. 2022, 141, 104642. [Google Scholar] [CrossRef]
  55. Grangeon, S.; Roux, C.; Lerouge, C.; Chardon, P.; Beuzeval, R.; Montavon, G.; Claret, F.; Grangeon, T. Geochemical and Mineralogical Characterization of Streams and Wetlands Downstream a Former Uranium Mine (Rophin, France). Appl. Geochem. 2023, 150, 105586. [Google Scholar] [CrossRef]
  56. Nesbitt, H.W.; Young, G.M. Prediction of Some Weathering Trends of Plutonic and Volcanic Rocks Based on Thermodynamic and Kinetic Considerations. Geochim. Cosmochim. Acta 1984, 48, 1523–1534. [Google Scholar] [CrossRef]
  57. Lara, M.C.; Buss, H.L.; Pett-Ridge, J.C. The Effects of Lithology on Trace Element and REE Behavior during Tropical Weathering. Chem. Geol. 2018, 500, 88–102. [Google Scholar] [CrossRef]
  58. Yusoff, Z.M.; Ngwenya, B.T.; Parsons, I. Mobility and Fractionation of REEs during Deep Weathering of Geochemically Contrasting Granites in a Tropical Setting, Malaysia. Chem. Geol. 2013, 349–350, 71–86. [Google Scholar] [CrossRef]
  59. Bao, Z.; Zhao, Z. Geochemistry of Mineralization with Exchangeable REY in the Weathering Crusts of Granitic Rocks in South China. Ore Geol. Rev. 2008, 33, 519–535. [Google Scholar] [CrossRef]
  60. Laveuf, C.; Cornu, S. A Review on the Potentiality of Rare Earth Elements to Trace Pedogenetic Processes. Geoderma 2009, 154, 1–12. [Google Scholar] [CrossRef]
  61. Braun, J.J.; Muller, J.P.; Bilong, P.; Michard, A.; Guillet, B. Cerium Anomalies in Laterites. Geochim. Cosmochim. Acta. 1990, 54, 781–795. [Google Scholar] [CrossRef]
  62. Dinali, G.S.; Root, R.A.; Amistadi, M.K.; Chorover, J.; Lopes, G.; Guilherme, L.R.G. Rare Earth Elements (REY) Sorption on Soils of Contrasting Mineralogy and Texture. Environ. Int. 2019, 128, 279–291. [Google Scholar] [CrossRef]
  63. Jo, J.; Shin, D. Geochemical Characteristics of REE-Enriched Weathered Anorthosite Complex in Hadong District, South Korea. Geochem. J. 2023, 57, 13–27. [Google Scholar] [CrossRef]
  64. Ghosh, M.; Swain, K.K.; Verma, R. Interaction of Niobium with Iron-Oxide Colloids and the Role of Humic Acid. J. Environ. Radioact. 2017, 178–179, 101–109. [Google Scholar] [CrossRef]
  65. Vodyanitskii, Y.N. Chemical Aspects of Uranium Behavior in Soils: A Review. Eurasian Soil Sci. 2011, 44, 862–873. [Google Scholar] [CrossRef]
  66. Jun, T.; Jingqun, Y.; Ruan, C.; Guohua, R.; Mintao, J.; Kexian, O. Kinetics on Leaching Rare Earth from the Weathered Crust Elution-Deposited Rare Earth Ores with Ammonium Sulfate Solution. Hydrometallurgy 2010, 101, 166–170. [Google Scholar] [CrossRef]
  67. Xie, Y.; Hou, Z.; Goldfarb, R.J.; Guo, X.; Wang, L. Rare Earth Element Deposits in China. Rare Earth Crit. Elem. Ore Depos. 2016, 18, 115–136. [Google Scholar]
  68. Kanazawa, Y.; Kamitani, M. Rare Earth Minerals and Resources in the World. J. Alloys Compd. 2006, 408–412, 1339–1343. [Google Scholar] [CrossRef]
  69. Simandl, G.J. Geology and Market-Dependent Significance of Rare Earth Element Resources. Miner. Depos. 2014, 49, 889–904. [Google Scholar] [CrossRef]
  70. Omega, R.L.; Abdullah, A.R.A.; Permana, S.; Srigutomo, W.; Maulana, A.; Seno, H.; Humolungo, I.; Nasyidiyah, F.I.; Zulfahmi; Rejeki, F.; et al. Examining External Dose Rates in Mamuju Regency, Indonesia: A Personal Radiation Dosimetry Approach. J. Eng. Technol. Sci. 2023, 55, 681–688. [Google Scholar] [CrossRef]
  71. Balaram, V. Rare Earth Elements: A Review of Applications, Occurrence, Exploration, Analysis, Recycling, and Environmental Impact. Geosci. Front. 2019, 10, 1285–1303. [Google Scholar] [CrossRef]
  72. Ault, T.; Krahn, S.; Croff, A. Radiological Impacts and Regulation of Rare Earth Elements in Non-Nuclear Energy Production. Energies 2015, 8, 2066–2081. [Google Scholar] [CrossRef]
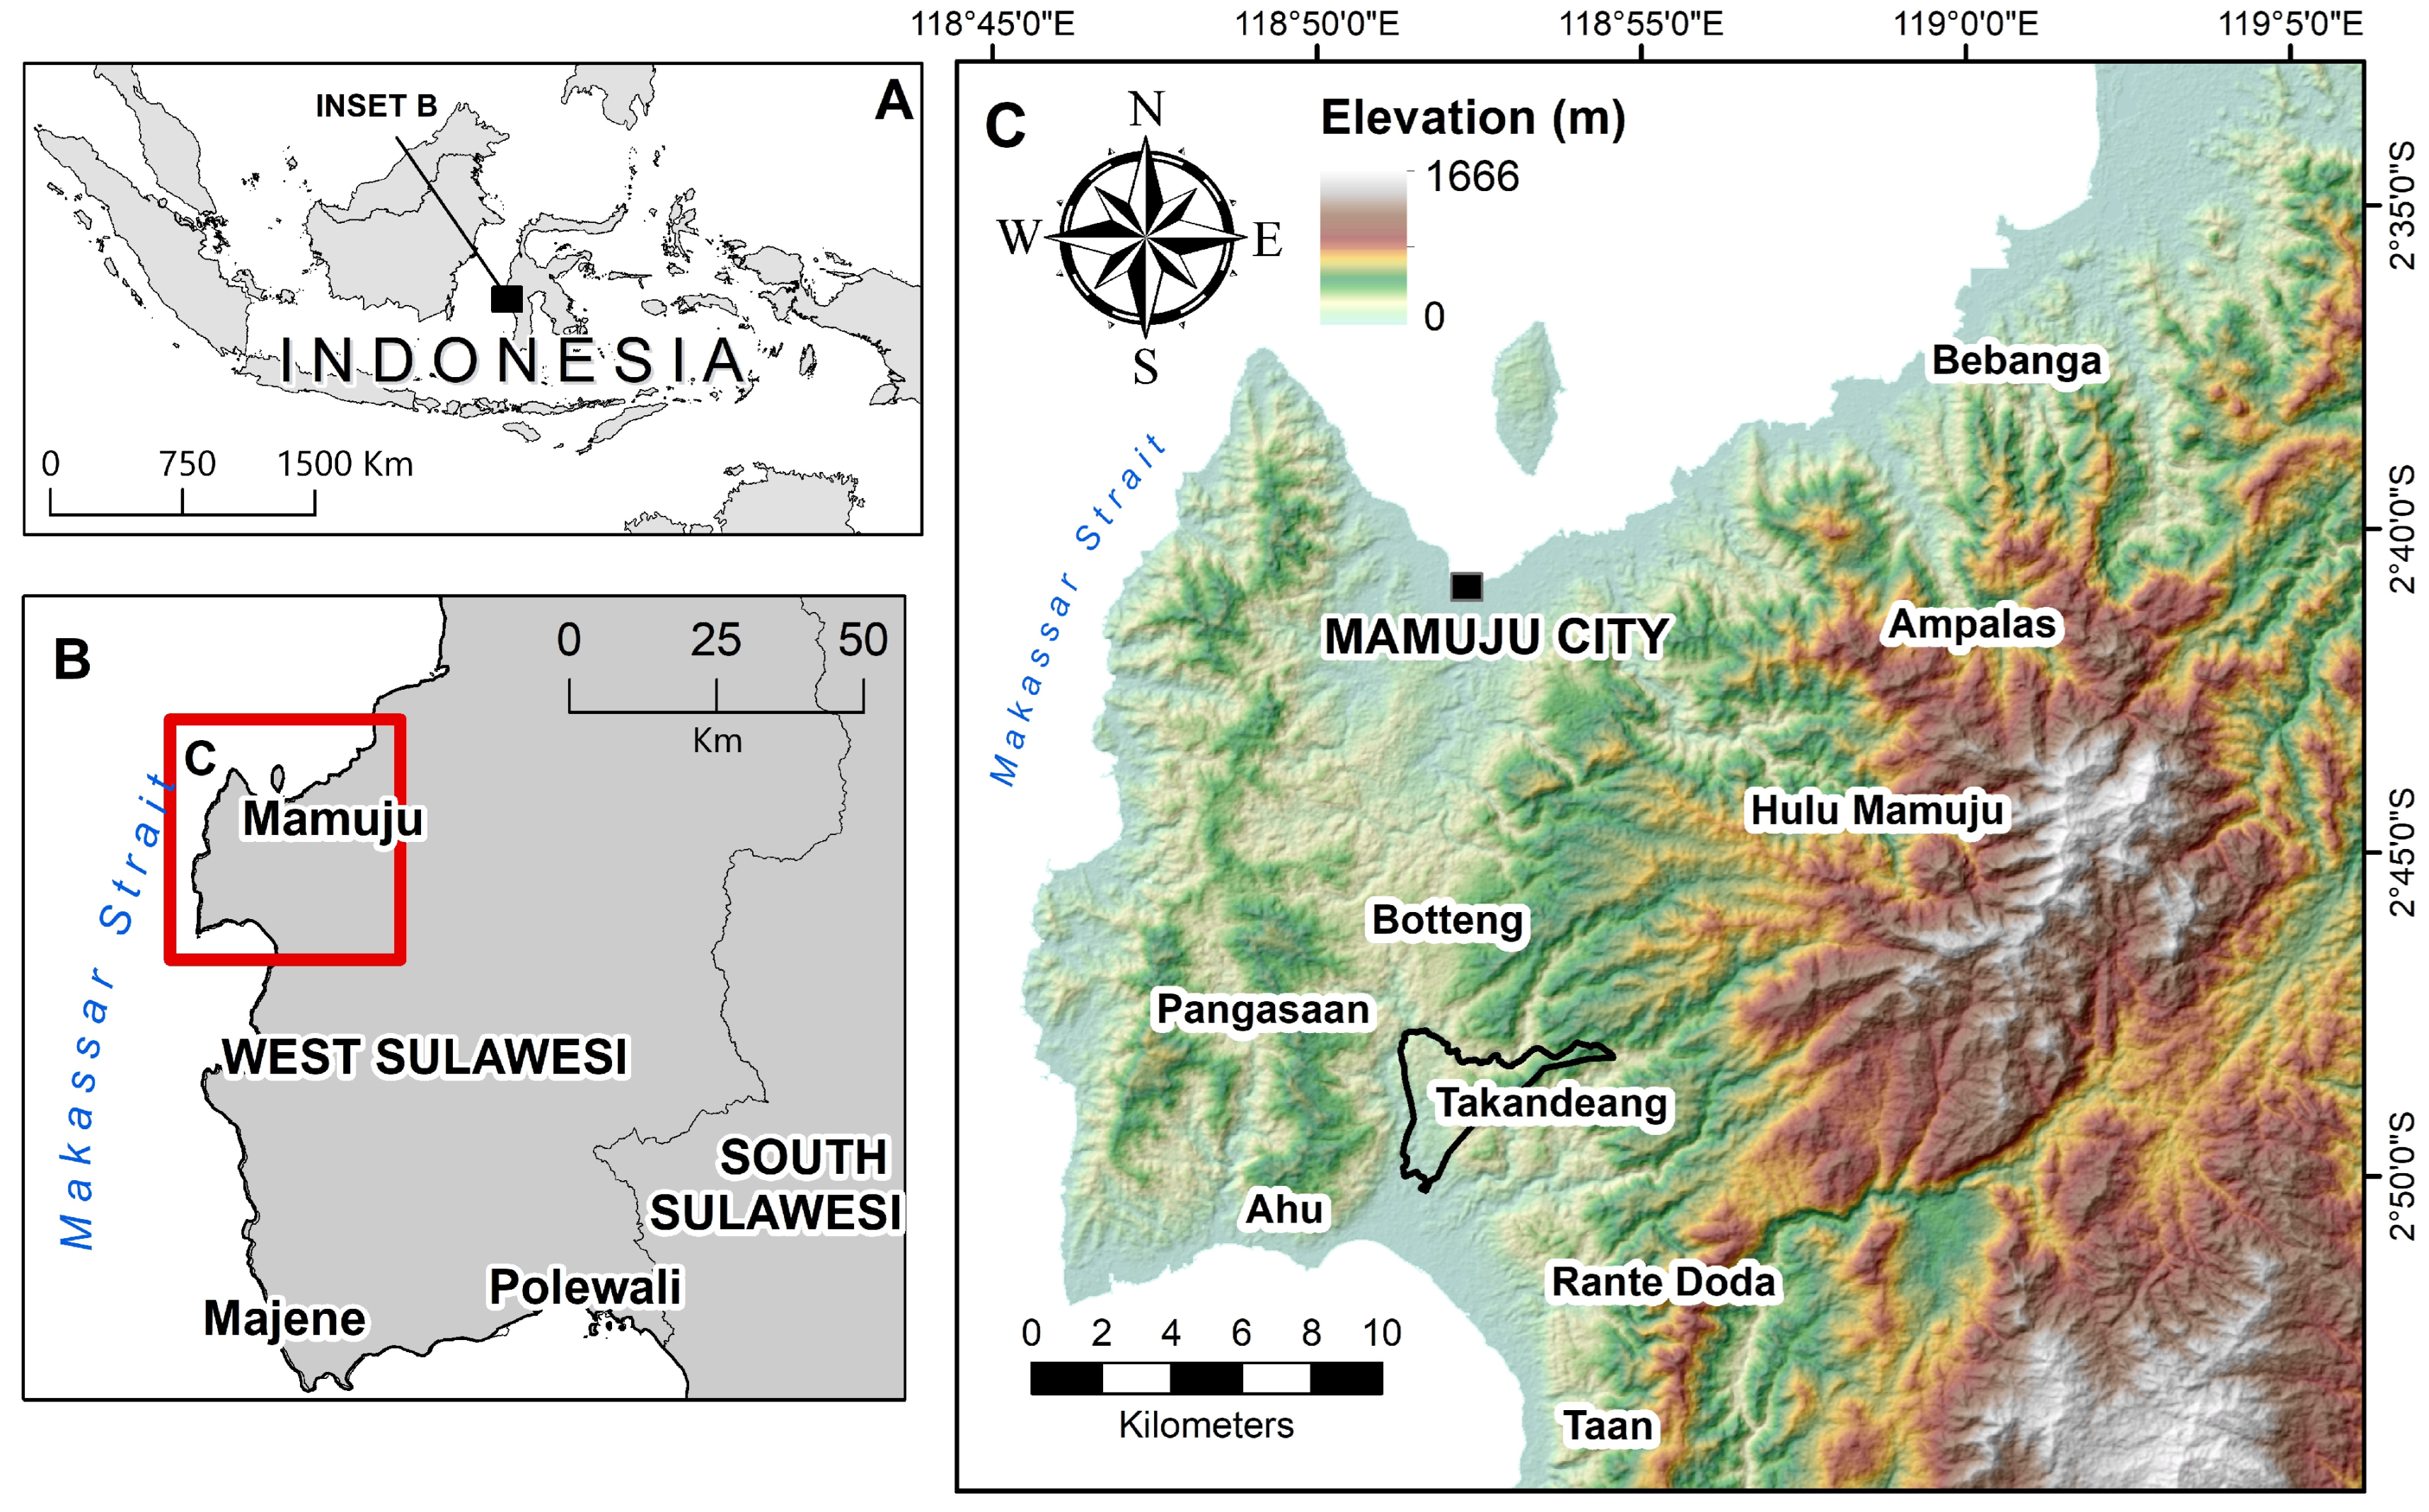
Figure 1. Map showing Takandeang area relative to West Sulawesi and Indonesia; (A) Sulawesi Island as a part of the Indonesian archipelago; (B) Mamuju region in the western part of Sulawesi; and (C) Takandeang area in the southern part of Mamuju.
Resources 14 00084 g001
Figure 2. Geological map of Mamuju area with the location of research area and plots of 2 boreholes location (modified from [32]).
Resources 14 00084 g002
Figure 3. Mineralogical analysis of surface samples using petrography, micro-XRF, and SEM imaging. (a,b) Photomicrograph of surface sample showing porphyritic textures with rich leucite phenocrysts. (c) Apatite inclusion inside biotite crystal. (d) Mineral mapping using micro-XRF analysis. (e) BSE images show apatite and ilmenite inclusions inside the diopside. (f) Britholite inclusion in biotite. (g) Aeschynite in augite crystal. Mineral abbreviations Lct: leucite, Cpx: clinopyroxene, Bt: biotite, Ap: apatite, Di: diopside, Ilm: ilmenite, Bar: barite, Bri: britholite, Aug: augite, Aes: aeschynite, Zeo: zeolite, Opq: opaque minerals, and Cly: clay minerals.
Resources 14 00084 g003
Figure 4. Lateritic profile of DHK-02 and DHK-10 boreholes showing weathering evolution from fresh rocks to A-horizon soil. The core drilling samples in the core box represent each layer.
Resources 14 00084 g004
Figure 5. XRD spectra of surface samples from the Tapalang area. (a) The presence of uraninite associated with haloysite; (b) apatite associated with leucite; (c) gibbsite, hematite, and anatas associated with leucite; (d) thorianite, gibbsite, hematite, and diopside associated with leucite. Mineral abbreviation Hal: halloysite, Kln: kaolinite, Lct: leucite, Urn: uraninite, Ap: apatite, Pyr: pyrolusite, Hem: hemite, Gbs: gibbsite, Kfs: k-feldspar, Bar: barite, Ant: anatase, Aug: augite, Dsp: diaspore, Bhm: boehmite, Sme: smectite, Nph: nepheline, Rt: rutile, Amp: amphibole, Ntr: natrolite, Di: diopside, Chm: chamosite, Thrn: thorianite.
Resources 14 00084 g005
Figure 9. The chondrite normalized the REEs pattern of (a) DHK-02 and (b) DHK-10. Chondrite normalized based on McDonough and Sun, 1995 [49].
Resources 14 00084 g009
Figure 10. The chondrite normalized HFSE pattern of (a) DHK-02 and (b) DHK-10 show distinct variation across horizons. Chondrite normalized based on McDonough and Sun, 1995 [49].
Resources 14 00084 g010
Figure 11. The mass balance calculation of the laterite profile for major and trace elements using Ti as an immobile constituent.
Resources 14 00084 g011
Figure 12. Ternary plots for (a) the chemical index of alteration in the A-CN-K diagram and (b) index of laterization of lateritic profile in the SAF diagram in the study area. Diagrams are after [56].
Resources 14 00084 g012
Figure 13. The plot diagram for Ce/Ce* and Eu/Eu* versus ΣREE. (a) Bedrock, soil B and C-horizon show weakly negative Ce-anomalies, while the A-horizon shows positive anomalies; (b) bedrock to C-horizon soil did not significantly change in the Eu anomalies in the weathering process.
Resources 14 00084 g013
Table 1. Radionuclide activity measurement result of Takandeang soil.
Sample CodeRadionuclide Activity (Bq/kg)
Ra-226Th-232K-40
TKD-022766.14 ± 61.311134.20 ± 24.8175.93 ± 4.09
TKD-012883.85 ± 63.951529.18 ± 33.35105.19 ± 4.77
Rantedunia502.75 ± 11.311236.54 ± 26.9078.19 ± 2.91
Palada729.54 ± 16.321136.75 ± 24.7879.74 ± 3.08
Table 2. Geochemistry of major oxide from XRF analysis.
NoDrill HoleHorizonDepth (m)SiO2
(%)
Al2O3
(%)
Fe2O3
(%)
MnO
(%)
MgO
(%)
CaO
(%)
Na2O
(%)
K2O
(%)
TiO2
(%)
P2O5
(%)
LOITotal Oxide
(%)
1DHK-02B-horizon soil1.534.8723.6118.940.140.850.531.720.442.610.6114.8799.19
22.7538.7818.2619.690.162.040.110.690.222.561.0215.3698.89
33.540.1716.8617.830.103.050.131.400.202.320.8315.9298.81
44.7540.6616.8516.440.273.480.210.160.142.390.5417.3698.50
56.2541.7515.3614.820.254.320.351.220.192.160.4417.2598.11
67.545.4114.8113.250.125.120.520.040.152.090.3916.1798.07
79.542.5314.4816.570.124.460.450.020.232.020.4316.6998.00
810.6543.7514.4414.360.184.690.770.100.192.080.3515.8096.71
912.642.6414.4714.310.174.861.260.070.232.010.4116.6597.08
1014.543.0913.1016.380.115.031.670.080.271.820.3715.2697.18
11C-horizon soil17.6541.3414.9413.190.184.021.780.070.172.140.3920.1498.36
1219.541.6313.5013.900.105.642.091.240.351.850.3818.0798.75
1320.544.5912.5811.340.185.453.211.940.301.710.4416.8498.58
14Bedrock23.544.4611.9310.620.175.992.902.120.211.540.2316.6696.83
1528.840.4211.209.680.174.813.604.030.181.540.3617.6093.59
1634.3545.4111.5910.500.196.612.074.090.221.550.2313.0995.55
17DHK-10A-horizon soil1.527.9025.5622.870.090.210.100.800.083.320.4117.5298.86
185.528.6725.6523.080.110.190.120.020.093.380.4217.0898.81
19B-horizon soil7.531.7923.5422.360.170.160.080.660.123.580.8215.3898.66
208.232.6423.6319.630.020.200.120.080.103.701.6316.3298.07
2110.537.6321.9617.360.490.380.100.010.133.230.4916.6898.46
2212.340.1920.1516.980.650.580.280.070.172.920.4216.0398.44
23Bedrock30.551.3111.2310.450.110.621.293.510.621.580.2412.8993.85
2457.652.1713.797.370.112.674.266.400.881.090.248.3797.35
2560.548.829.4712.040.172.432.314.850.712.060.5311.7695.15
Table 3. Geochemistry trace element from ICP-MS analysis.
NoDrillholeHorizonDepth (m)Zr
(ppm)
Hf
(ppm)
Nb
(ppm)
Pb
(ppm)
Ta
(ppm)
Th
(ppm)
U
(ppm)
Y
(ppm)
Ce
(ppm)
Dy
(ppm)
Er
(ppm)
Eu
(ppm)
Gd
(ppm)
Ho
(ppm)
La
(ppm)
Lu
(ppm)
Nd
(ppm)
Pr
(ppm)
Sm
(ppm)
Tb
(ppm)
Tm
(ppm)
Yb
(ppm)
1DHK-02B1.502146511844389.231034.918183534.614.811.872.95.85691.547113088.87.11.910.1
22.7537018733778812.869217.8235104044.320.111.677.67.25162.340911381.98.12.815.2
33.5035537631874411.96085.920176835.116.78.257.45.64211.82898362.15.92.012.2
44.753849562064759.737928.917780536.314.810.361.95.64981.641611482.16.71.811.1
56.2535536931061111.733260.618885527.111.29.455.74.84901.627481248.64.91.410.9
67.5031096327550710.429377.015770820.78.67.545.63.53791.42196437.13.71.08.4
79.5029616327262110.729019.915863722.99.39.247.33.83791.42286541.04.01.08.9
810.653183582775519.727522.317768026.411.311.247.74.24092.02346938.64.11.211.3
912.6028876128357910.529526.619673727.611.411.954.34.74422.02547241.94.91.311.6
1014.502665592325589.227235.215773527.913.711.844.75.13881.72407045.05.81.812.1
11C17.653405482194558.622633.415959321.310.26.843.04.03621.52045937.53.71.19.8
1219.502665542304719.023511.213862319.68.96.442.43.53741.52116138.73.61.08.8
1320.502443471984147.920620.112955317.48.05.837.13.23361.41855532.93.40.97.9
14Bedrock23.502146462003938.0194251.012751917.68.15.336.03.23141.11805231.03.20.86.7
1528.802294461973847.5189129.012651217.28.04.935.43.23031.31835132.33.30.97.5
1634.352368462064168.0196112.013153518.98.74.939.43.33201.31855233.23.51.08.5
17DHK-10A1.5044419130171915.336144.5299689.03.43.036.61.42400.61304223.41.90.43.4
185.50458910436285918.245158.0299587.83.32.931.91.52130.51213921.71.70.53.4
19B7.505256106443103017.2597267.06441160102.049.420.8127.018.910906.1723196140.019.26.343.5
208.205404106425136017.5547399.0535268688.941.520.0139.016.918805.3814279136.014.95.436.4
2110.50481110940497419.4502282.0209107038.116.79.967.46.94902.43199663.16.42.315.5
2212.3042199533185113.9427266.0206104038.416.710.362.66.85132.13359763.06.62.115.8
23Bedrock30.502294541924907.6238152.012162424.611.29.444.84.82961.52186541.34.11.510.8
2457.60103627741164.56128.24529710.64.15.219.61.51530.61143317.21.90.43.0
2560.5023685522341013.115873.59869123.79.56.744.23.73311.02457541.64.31.16.8
Table 4. Pearson’s correlation between U–Th and selected HFSE–REE.
B-Horizon SoilZrTiHfNbTaYCeEuGdYb
Th0.670.610.750.690.660.560.470.400.620.58
U0.850.860.860.780.870.700.790.640.740.76
BedrockZrTiHfNbTaYCeEuGdYb
Th0.880.350.830.820.330.930.730.460.850.95
U0.490.050.420.520.040.730.300.080.390.46
Disclaimer/Publisher’s Note: The statements, opinions and data contained in all publications are solely those of the individual author(s) and contributor(s) and not of MDPI and/or the editor(s). MDPI and/or the editor(s) disclaim responsibility for any injury to people or property resulting from any ideas, methods, instructions or products referred to in the content.