
Spatial Analysis of Water Conservation and Its Driving Factors in an Urban Citarum Tropical Watershed: Geospatial Approach

 ,
,  , ,
, ,  ,
,  , , ,
, , ,  , and
, and
Abstract
1. Introduction
2. Materials and Methods
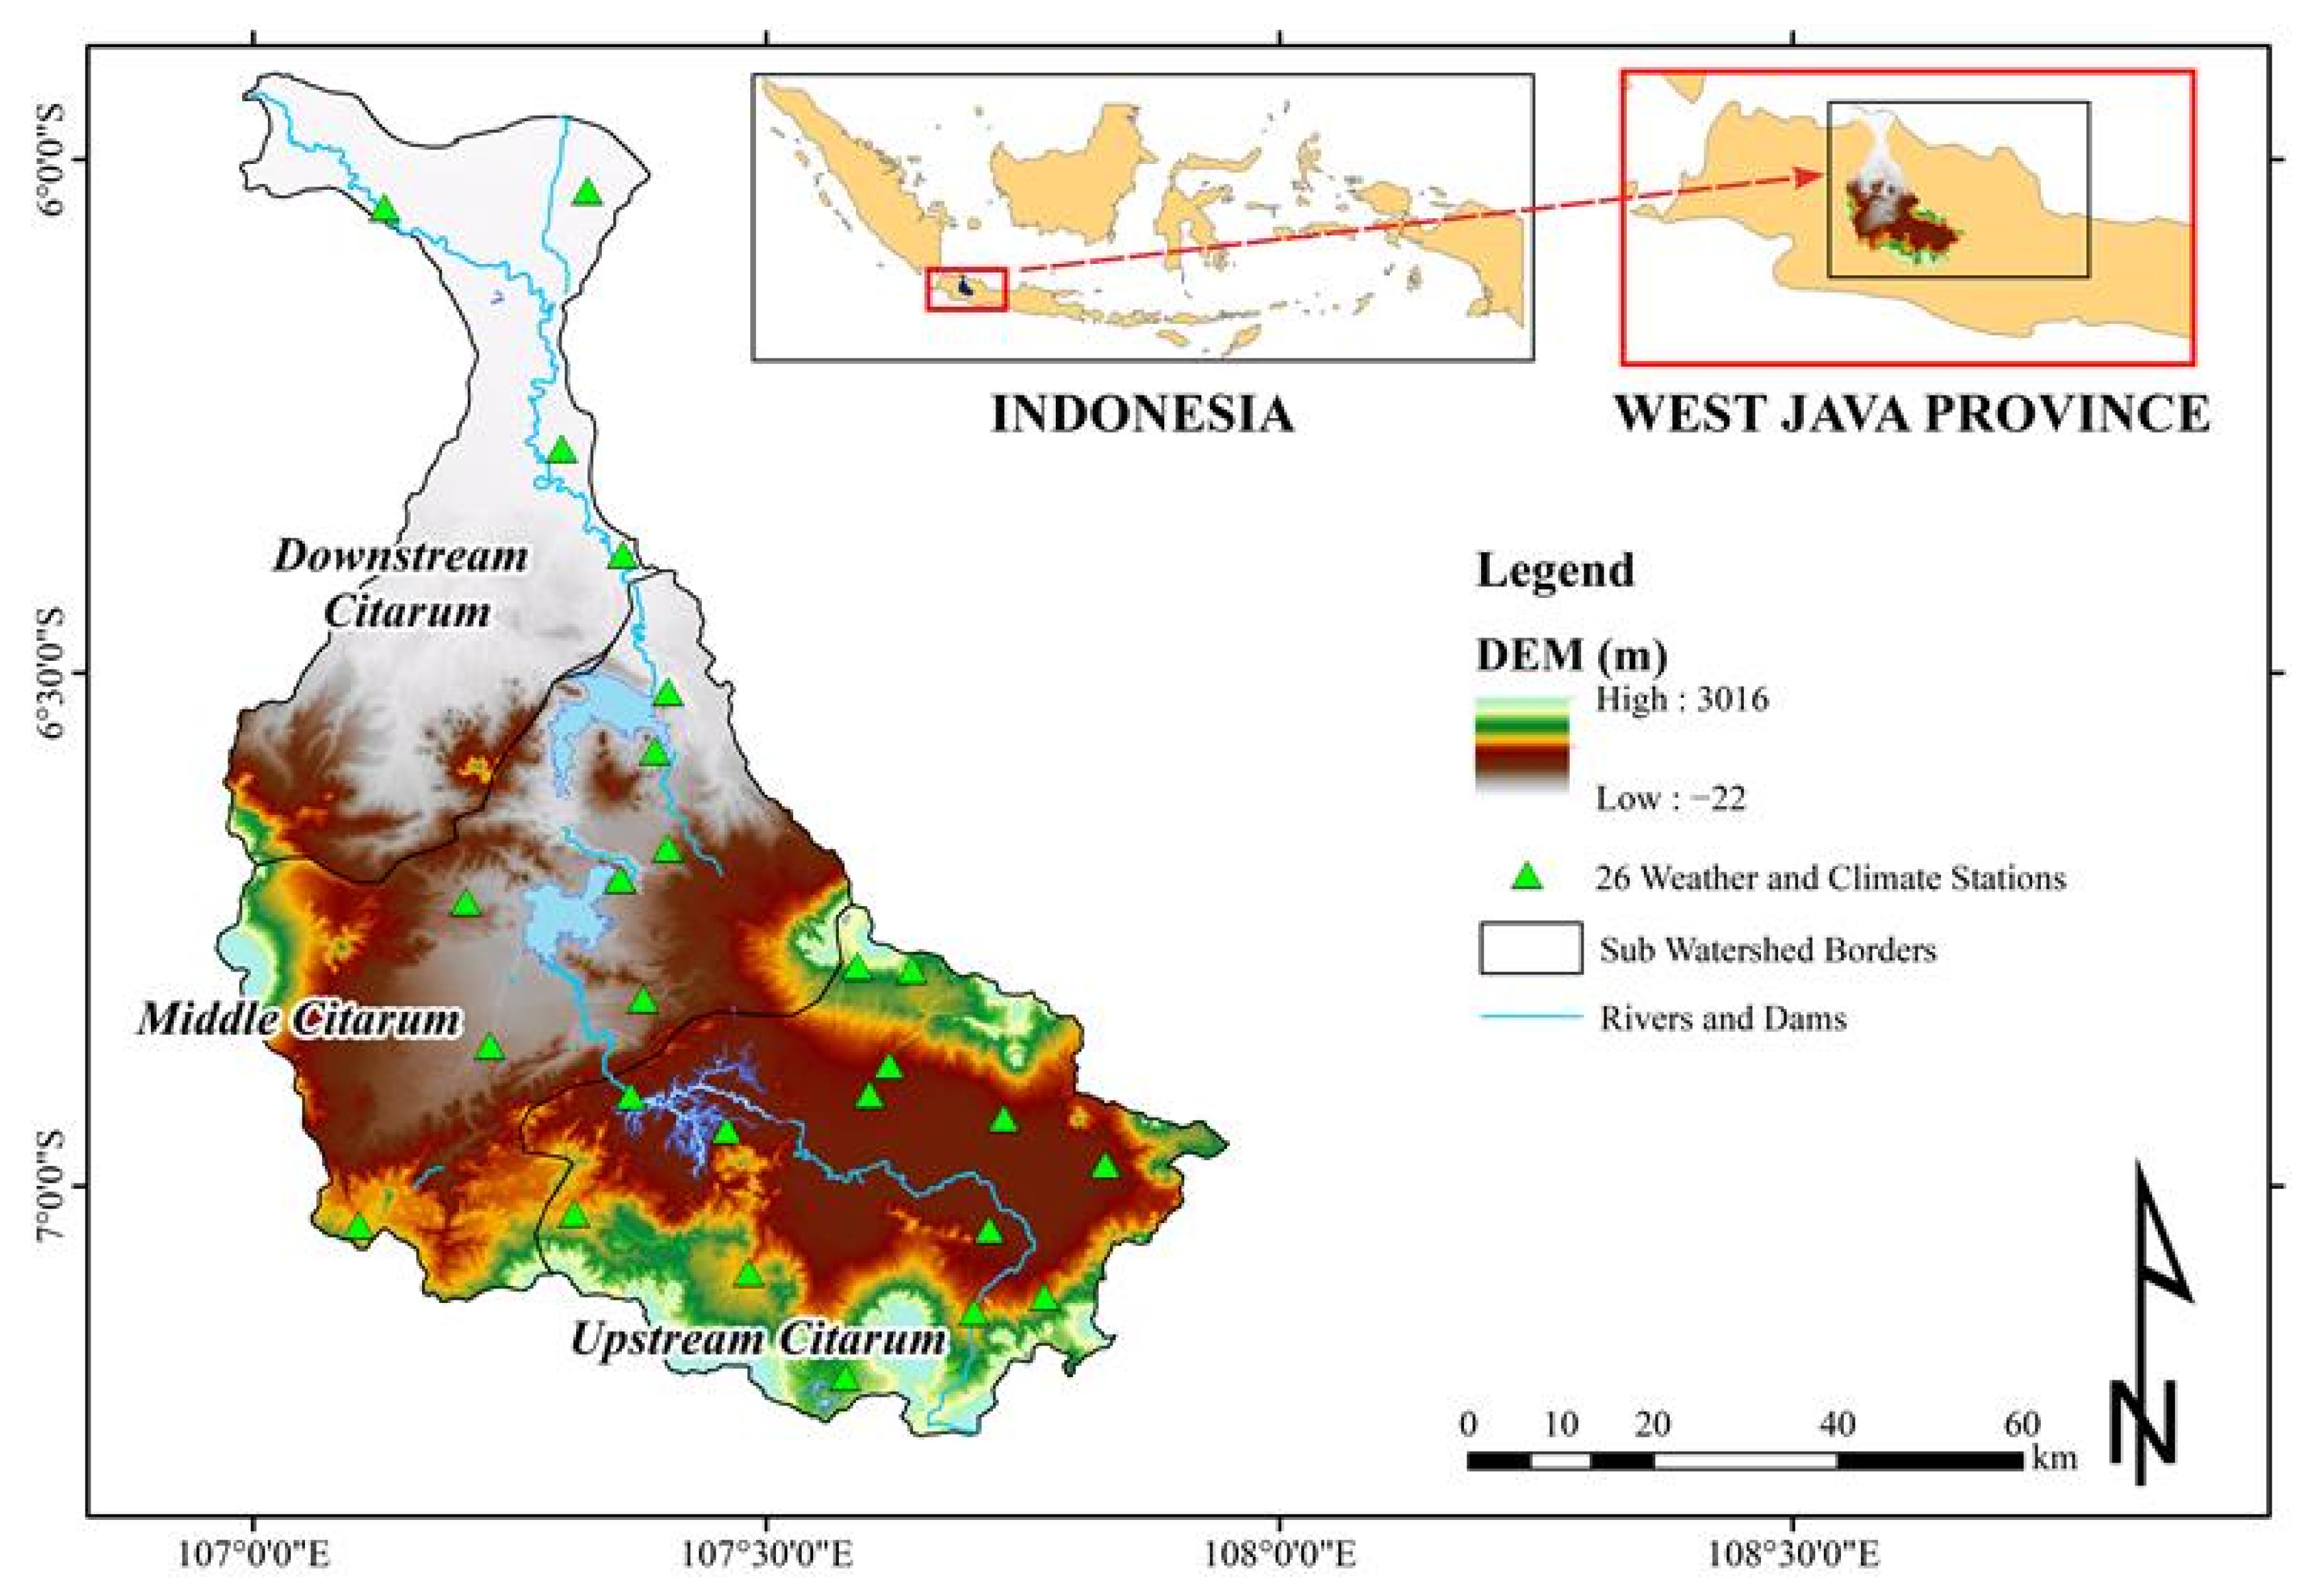
2.1. Study Area
2.2. Data Sources
2.3. Research Methodology
2.3.1. Data Preparation
2.3.2. Calculating WC
2.3.3. The Trajectory of Spatial Elasticity
2.3.4. MGWR Model
3. Results
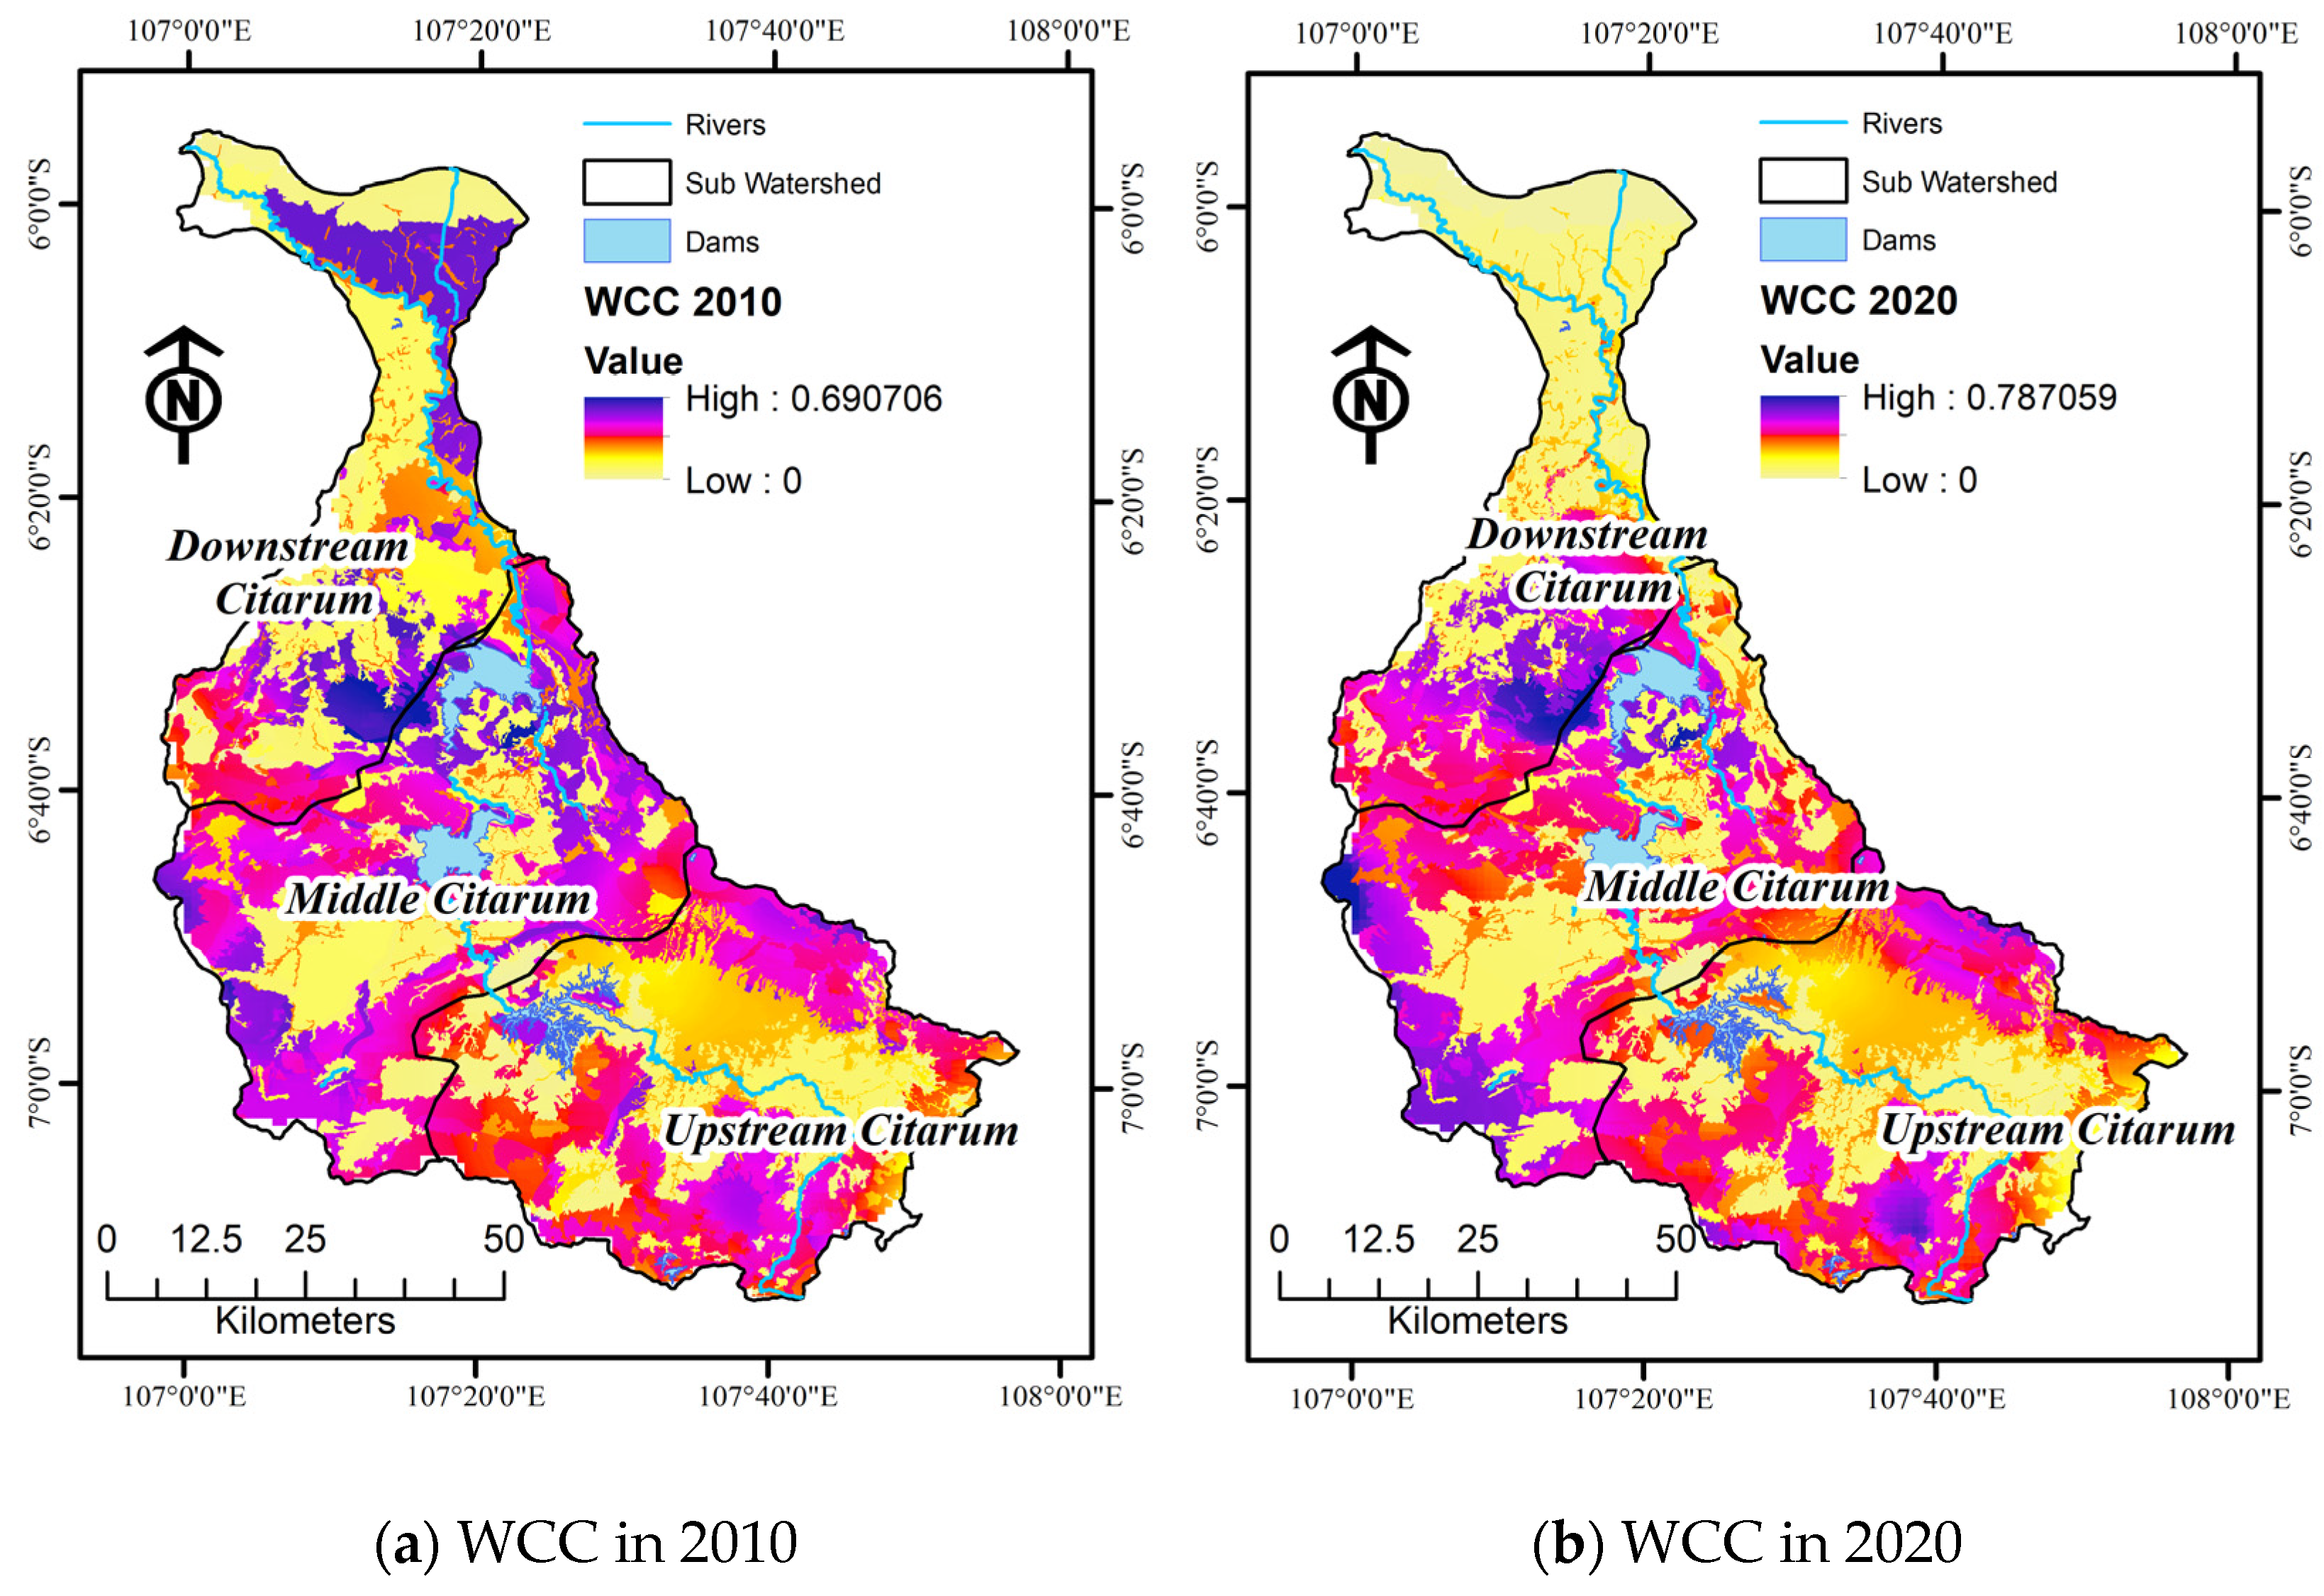
3.1. Analysis of WC
3.2. The Temporal Interaction Between WCs
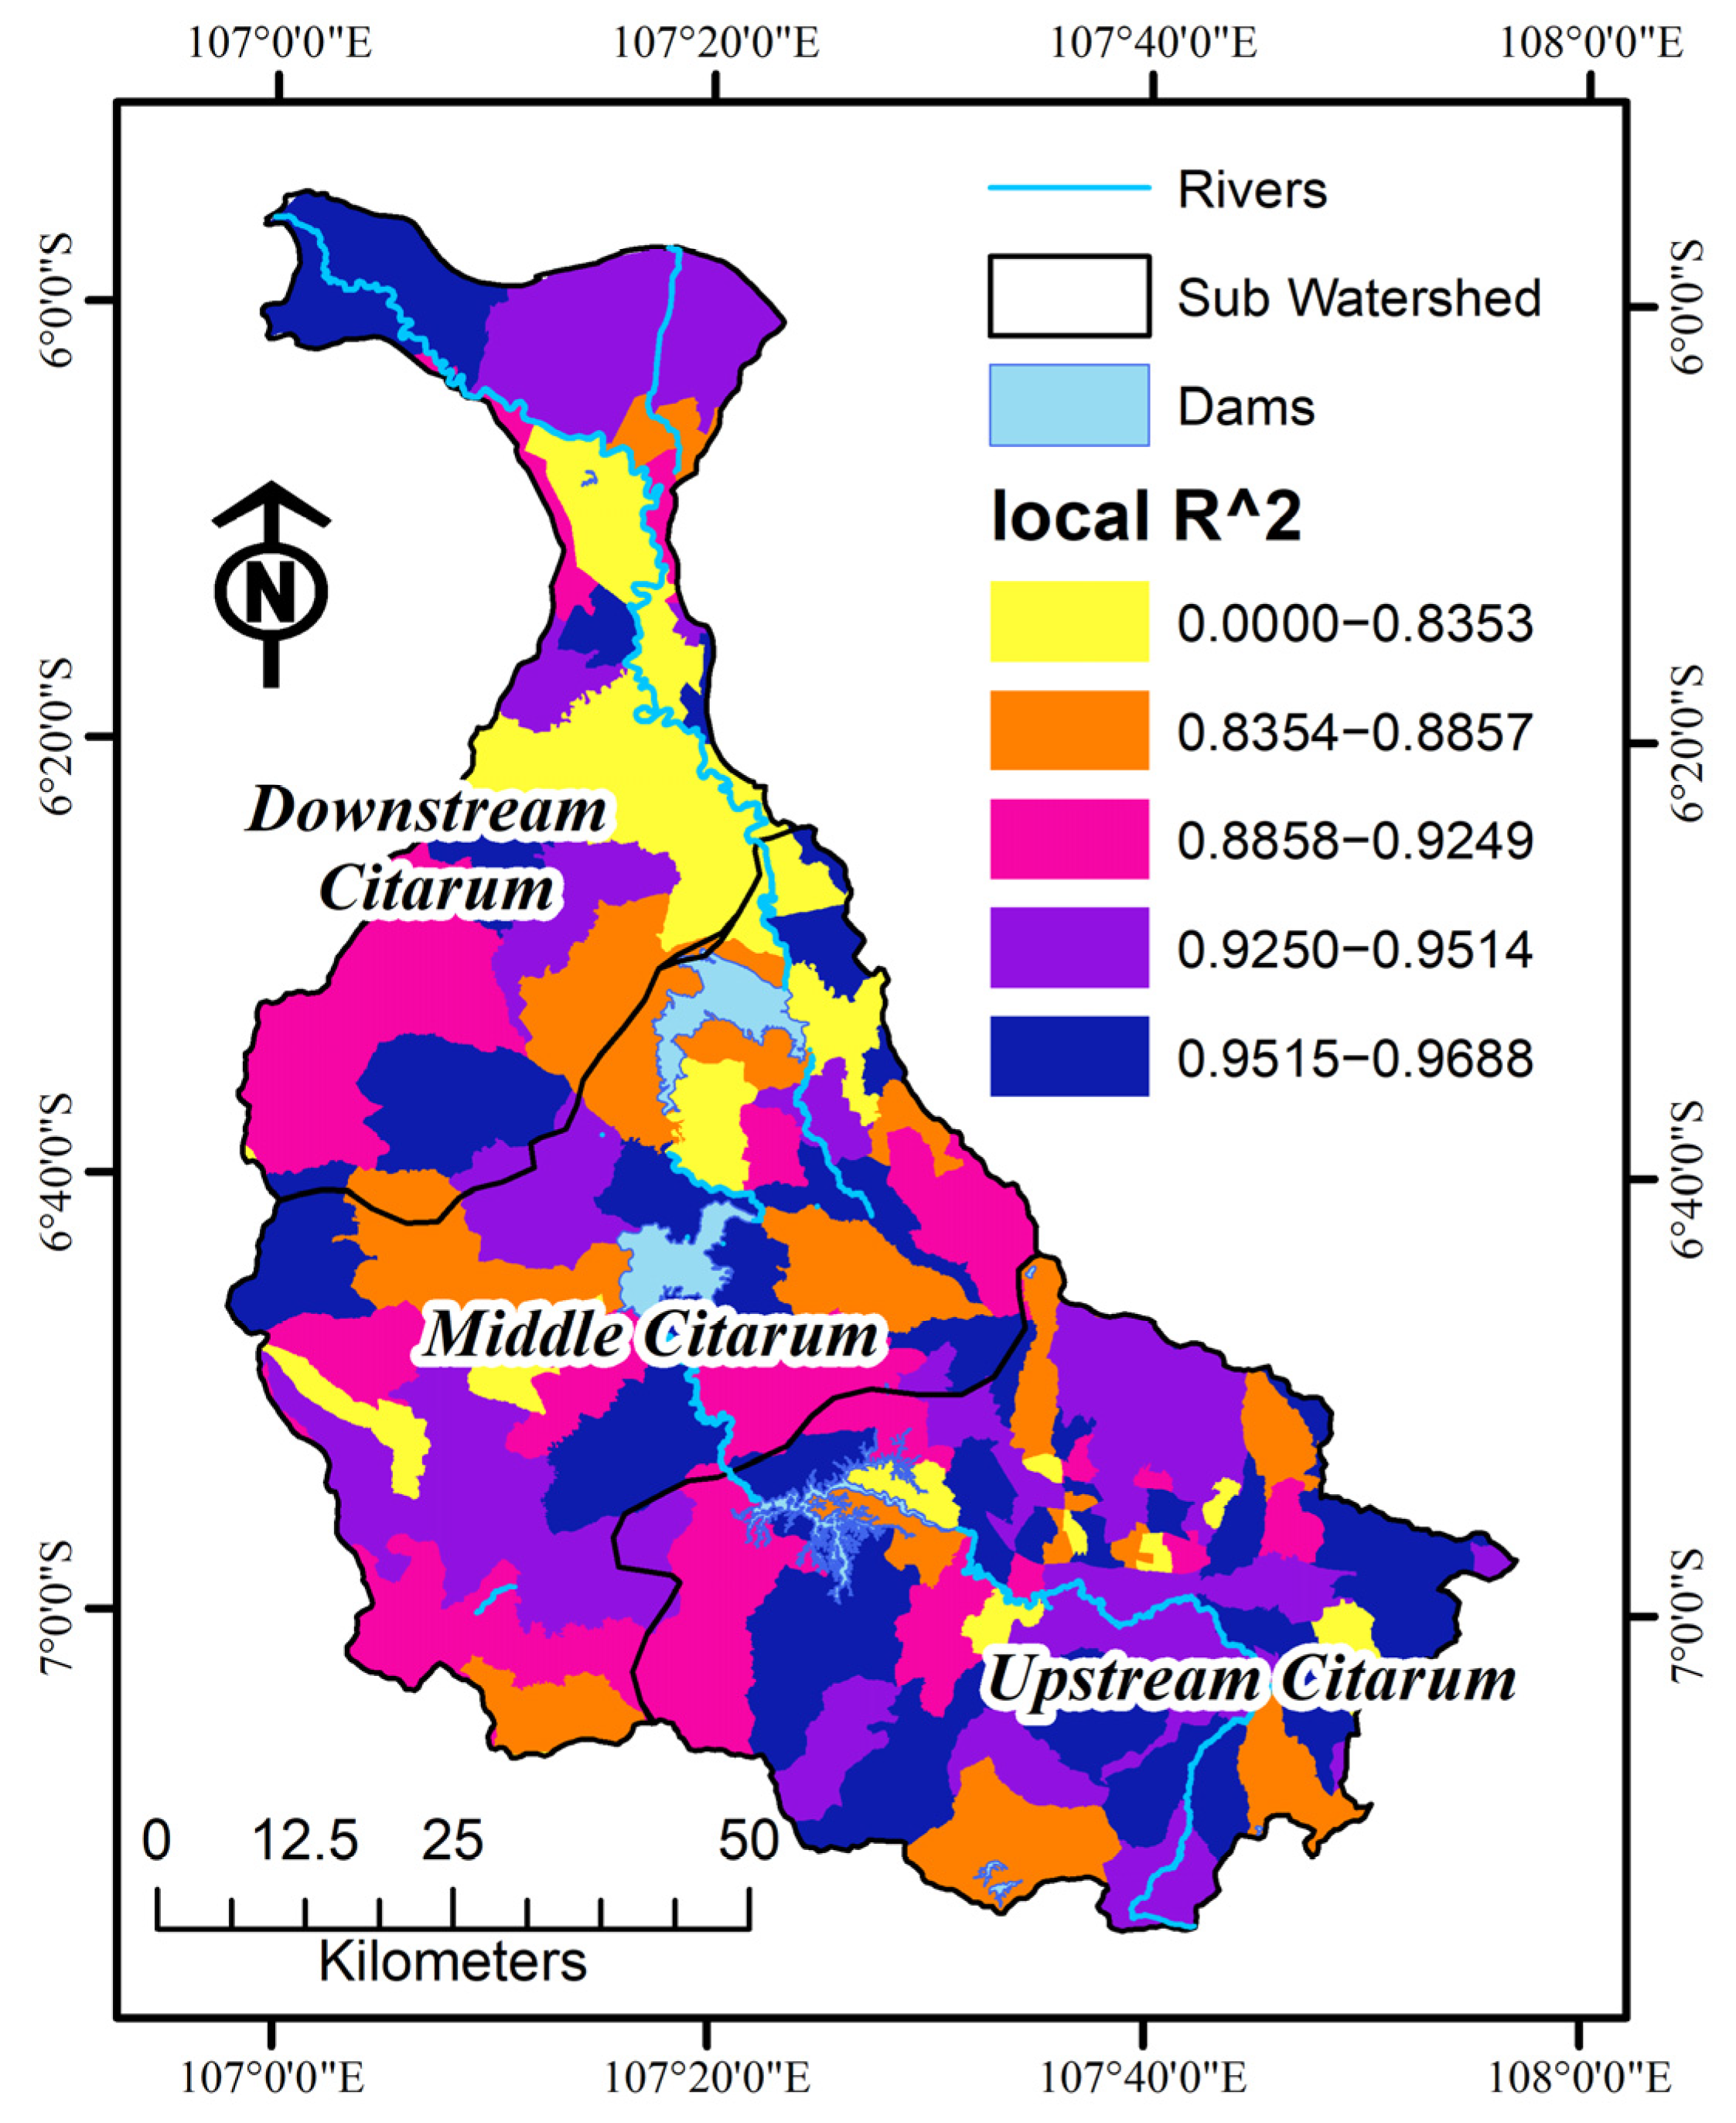
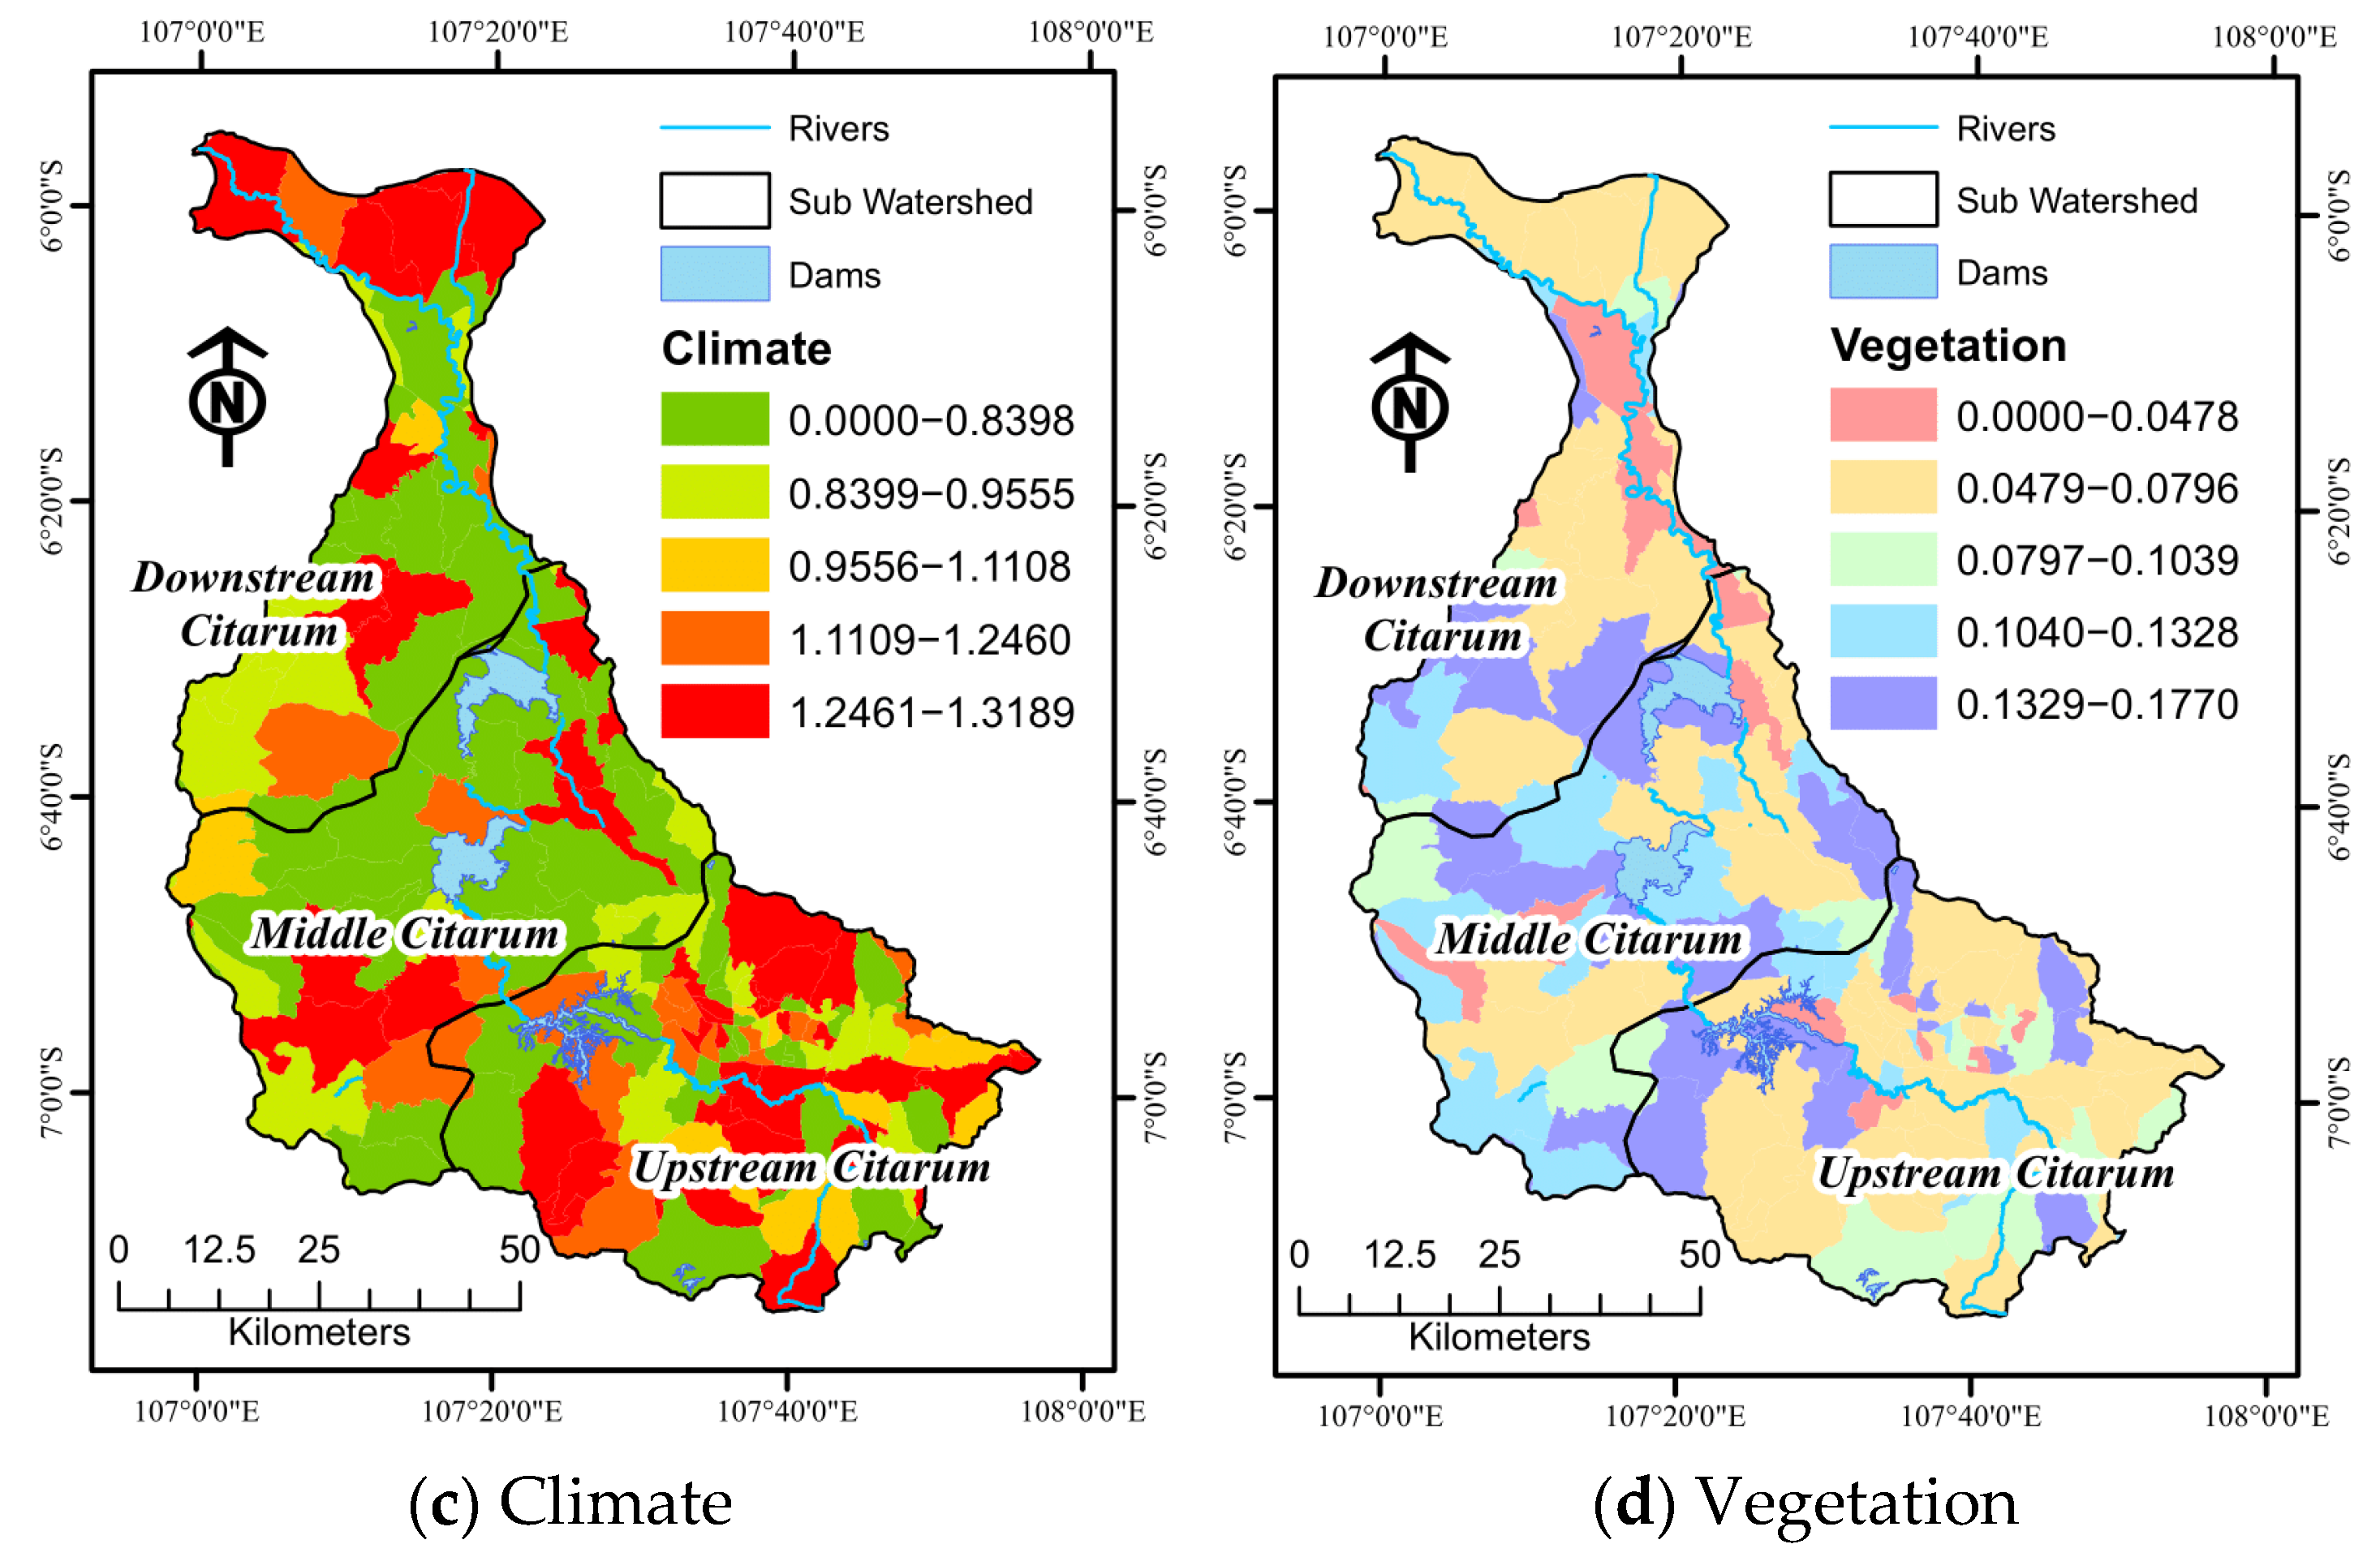
3.3. Driving Factors on WC
4. Discussion
4.1. Impact of Change in Comprehensive Factors on WC
4.2. Impact of Climate and Land-Use Changes on WC
4.3. Socioeconomic Factors and WC Decline
4.4. Policy and Management Recommendations
5. Conclusions
Supplementary Materials
Author Contributions
Funding
Data Availability Statement
Acknowledgments
Conflicts of Interest
References
- Li, M.; Liang, D.; Xia, J.; Song, J.; Cheng, D.; Wu, J.; Cao, Y.; Sun, H.; Li, Q. Evaluation of Water Conservation Function of Danjiang River Basin in Qinling Mountains, China Based on InVEST Model. J. Environ. Manag. 2021, 286, 112212. [Google Scholar] [CrossRef] [PubMed]
- Zhang, G.; Wu, Y.; Li, H.; Yin, X.; Chervan, A.; Liu, S.; Qiu, L.; Zhao, F.; Sun, P.; Wang, W. Assessment Framework of Water Conservation Based on Analytical Modeling of Ecohydrological Processes. J. Hydrol. 2024, 630, 130646. [Google Scholar] [CrossRef]
- Xu, M.; Xu, G.; Liu, S.; Li, J.; Li, Z.; Cheng, Y.; Zhuang, J.; Dang, Y.; Wang, B.; Gu, F. Changes in Water Conservation and a New Estimation for Its Future Potential. CATENA 2025, 250, 108761. [Google Scholar] [CrossRef]
- Wang, J.; Wu, T.; Li, Q.; Wang, S. Quantifying the Effect of Environmental Drivers on Water Conservation Variation in the Eastern Loess Plateau, China. Ecol. Indic. 2021, 125, 107493. [Google Scholar] [CrossRef]
- Costanza, R.; De Groot, R.; Braat, L.; Kubiszewski, I.; Fioramonti, L.; Sutton, P.; Farber, S.; Grasso, M. Twenty Years of Ecosystem Services: How Far Have We Come and How Far Do We Still Need to Go? Ecosyst. Serv. 2017, 28, 1–16. [Google Scholar] [CrossRef]
- Hu, W.; Li, G.; Gao, Z.; Jia, G.; Wang, Z.; Li, Y. Assessment of the Impact of the Poplar Ecological Retreat Project on Water Conservation in the Dongting Lake Wetland Region Using the InVEST Model. Sci. Total Environ. 2020, 733, 139423. [Google Scholar] [CrossRef] [PubMed]
- Kaseke, K.F.; Wang, L. Fog and Dew as Potable Water Resources: Maximizing Harvesting Potential and Water Quality Concerns. GeoHealth 2018, 2, 327–332. [Google Scholar] [CrossRef] [PubMed]
- Zhu, K.; Cheng, Y.; Zhou, Q.; Kápolnai, Z.; Dávid, L.D. The Contributions of Climate and Land Use/Cover Changes to Water Yield Services Considering Geographic Scale. Heliyon 2023, 9, e20115. [Google Scholar] [CrossRef]
- Miao, C.; Duan, Q.; Sun, Q.; Lei, X.; Li, H. Non-Uniform Changes in Different Categories of Precipitation Intensity across China and the Associated Large-Scale Circulations. Environ. Res. Lett. 2019, 14, 025004. [Google Scholar] [CrossRef]
- Hu, J.; Wu, Y.; Wang, L.; Sun, P.; Zhao, F.; Jin, Z.; Wang, Y.; Qiu, L.; Lian, Y. Impacts of Land-Use Conversions on the Water Cycle in a Typical Watershed in the Southern Chinese Loess Plateau. J. Hydrol. 2021, 593, 125741. [Google Scholar] [CrossRef]
- Li, L.; Yang, Y.; Cui, T.; Li, R.; Zheng, H. Land Use, Climate, and Socioeconomic Factors Determine the Variation in Hydrologic-Related Ecosystem Services in the Ecological Conservation Zone, Beijing, China. Water 2023, 15, 2022. [Google Scholar] [CrossRef]
- Capriolo, A.; Boschetto, R.G.; Mascolo, R.A.; Balbi, S.; Villa, F. Biophysical and Economic Assessment of Four Ecosystem Services for Natural Capital Accounting in Italy. Ecosyst. Serv. 2020, 46, 101207. [Google Scholar] [CrossRef]
- Sharp, R.; Douglass, J.; Wolny, S.; Arkema, K.; Bernhardt, J.; Bierbower, W.; Chaumont, N.; Denu, D.; Fisher, D.; Glowinski, K. InVEST 3.8.7. User’s Guide; The Natural Capital Project, Standford University, University of Minnesota, The Natural Capital Project: Stanford, CA, USA, 2020. [Google Scholar]
- Redhead, J.W.; May, L.; Oliver, T.H.; Hamel, P.; Sharp, R.; Bullock, J.M. National Scale Evaluation of the InVEST Nutrient Retention Model in the United Kingdom. Sci. Total Environ. 2018, 610–611, 666–677. [Google Scholar] [CrossRef] [PubMed]
- Yu, Y.; Sun, X.; Wang, J.; Zhang, J. Using InVEST to Evaluate Water Yield Services in Shangri-La, Northwestern Yunnan, China. PeerJ 2022, 10, e12804. [Google Scholar] [CrossRef] [PubMed]
- Chen, J.; Wang, D.; Li, G.; Sun, Z.; Wang, X.; Zhang, X.; Zhang, W. Spatial and Temporal Heterogeneity Analysis of Water Conservation in Beijing-Tianjin-Hebei Urban Agglomeration Based on the Geodetector and Spatial Elastic Coefficient Trajectory Models. GeoHealth 2020, 4, e2020GH000248. [Google Scholar] [CrossRef] [PubMed]
- Ouyang, B.; Yan, Z.; Jiang, Y.; Deng, C.; Chen, Y.; Wu, L. Multi-Scale Effects of Supply–Demand Changes in Water-Related Ecosystem Services Across Different Landscapes in River Basin. IJGI 2024, 13, 394. [Google Scholar] [CrossRef]
- Tu, L.; Duan, L. Spatial Downscaling Analysis of GPM IMERG Precipitation Dataset Based on Multiscale Geographically Weighted Regression Model: A Case Study of the Inner Mongolia Reach of the Yellow River Basin. Front. Environ. Sci. 2024, 12, 1389587. [Google Scholar] [CrossRef]
- Dharmawan, I.W.S.; Pratiwi; Siregar, C.A.; Narendra, B.H.; Undaharta, N.K.E.; Sitepu, B.S.; Sukmana, A.; Wiratmoko, M.D.E.; Abywijaya, I.K.; Sari, N. Implementation of Soil and Water Conservation in Indonesia and Its Impacts on Biodiversity, Hydrology, Soil Erosion and Microclimate. Appl. Sci. 2023, 13, 7648. [Google Scholar] [CrossRef]
- Dipu, S.U.A.; Piyash, N.A. Water Footprint and Virtual Water Assessment for Textile Industries of Bangladesh. WJARR 2024, 24, 339–351. [Google Scholar]
- Bao, C.; Chen, X. Spatial Econometric Analysis on Influencing Factors of Water Consumption Efficiency in Urbanizing China. J. Geogr. Sci. 2017, 27, 1450–1462. [Google Scholar] [CrossRef]
- Citaum org. Kondisi Fisik Dan Spasial. Physical and Spatial Conditions. Available online: http://Citarum.Org/Tentang_1116Kami/Sekilas-Citarum/Kondisi-Fisik-Dan-Spasial.Html (accessed on 26 April 2025).
- Sholeh, M.; Pranoto, P.; Budiastuti, S.; Sutarno, S. Analysis of Citarum River Pollution Indicator Using Chemical, Physical, and Bacteriological Methods; AIP Publishing: Surabaya, Indonesia, 2018; p. 020068. [Google Scholar]
- Khairunnisa, F.; Tambunan, M.P.; Marko, K. Estimation of Soil Erosion by USLE Model Using GIS Technique (A Case Study of Upper Citarum Watershed). IOP Conf. Ser. Earth Environ. Sci. 2020, 561, 012038. [Google Scholar] [CrossRef]
- Nahib, I.; Amhar, F.; Wahyudin, Y.; Ambarwulan, W.; Suwarno, Y.; Suwedi, N.; Turmudi, T.; Cahyana, D.; Nugroho, N.P.; Ramadhani, F.; et al. Spatial-Temporal Changes in Water Supply and Demand in the Citarum Watershed, West Java, Indonesia Using a Geospatial Approach. Sustainability 2022, 15, 562. [Google Scholar] [CrossRef]
- Bao, Y.; Li, T.; Liu, H.; Ma, T.; Wang, H.; Liu, K.; Shen, X.; Liu, X. Spatial and Temporal Changes of Water Conservation of Loess Plateau in Northern Shaanxi Province by InVEST Model. Geogr. Res. 2016, 35, 664–676. [Google Scholar]
- Wang, Z.; Xu, M.; Liu, X.; Singh, D.K.; Fu, X. Quantifying the Impact of Climate Change and Anthropogenic Activities on Runoff and Sediment Load Reduction in a Typical Loess Plateau Watershed. J. Hydrol. Reg. Stud. 2022, 39, 100992. [Google Scholar] [CrossRef]
- Wang, Y.; Ye, A.; Peng, D.; Miao, C.; Di, Z.; Gong, W. Spatiotemporal Variations in Water Conservation Function of the Tibetan Plateau under Climate Change Based on InVEST Model. J. Hydrol. Reg. Stud. 2022, 41, 101064. [Google Scholar] [CrossRef]
- Fang, X.; Roe, T.L.; Smith, R.B. Water Shortages, Intersectoral Water Allocation and Economic Growth: The Case of China. China Agric. Econ. Rev. 2015, 7, 2–26. [Google Scholar] [CrossRef]
- Yu, J.; Yuan, Y.; Nie, Y.; Ma, E.; Li, H.; Geng, X. The Temporal and Spatial Evolution of Water Yield in Dali County. Sustainability 2015, 7, 6069–6085. [Google Scholar] [CrossRef]
- Zhou, M.; Li, Y.; Zhang, F. Spatiotemporal Variation in Ground Level Ozone and Its Driving Factors: A Comparative Study of Coastal and Inland Cities in Eastern China. IJERPH 2022, 19, 9687. [Google Scholar] [CrossRef] [PubMed]
- Sannigrahi, S.; Zhang, Q.; Joshi, P.K.; Sutton, P.C.; Keesstra, S.; Roy, P.S.; Pilla, F.; Basu, B.; Wang, Y.; Jha, S.; et al. Examining Effects of Climate Change and Land Use Dynamic on Biophysical and Economic Values of Ecosystem Services of a Natural Reserve Region. J. Clean. Prod. 2020, 257, 120424. [Google Scholar] [CrossRef]
- Wang, J.-F.; Zhang, T.-L.; Fu, B.-J. A Measure of Spatial Stratified Heterogeneity. Ecol. Indic. 2016, 67, 250–256. [Google Scholar] [CrossRef]
- Gao, J.; Jiang, Y.; Anker, Y. Contribution Analysis on Spatial Tradeoff/Synergy of Karst Soil Conservation and Water Retention for Various Geomorphological Types: Geographical Detector Application. Ecol. Indic. 2021, 125, 107470. [Google Scholar] [CrossRef]
- Fotheringham, A.S.; Yang, W.; Kang, W. Multiscale Geographically Weighted Regression (MGWR). Ann. Am. Assoc. Geogr. 2017, 107, 1247–1265. [Google Scholar] [CrossRef]
- Shen, T.; Yu, H.; Zhou, L.; Gu, H.; He, H. Influence Mechanism of Second-Hand Housing Price in Beijing—A Study Based on Multi-Scale Geo-Weighted Regression Model (MGWR). Econ. Geogr. 2020, 40, 75–83. [Google Scholar]
- Oshan, T.; Li, Z.; Kang, W.; Wolf, L.; Fotheringham, A. Mgwr: A Python Implementation of Multiscale Geographically Weighted Regression for Investigating Process Spatial Heterogeneity and Scale. IJGI 2019, 8, 269. [Google Scholar] [CrossRef]
- Li, Z.; Fotheringham, A.S. Computational Improvements to Multi-Scale Geographically Weighted Regression. Int. J. Geogr. Inf. Sci. 2020, 34, 1378–1397. [Google Scholar] [CrossRef]
- Cao, Z.; Zhu, W.; Luo, P.; Wang, S.; Tang, Z.; Zhang, Y.; Guo, B. Spatially Non-Stationary Relationships between Changing Environment and Water Yield Services in Watersheds of China’s Climate Transition Zones. Remote Sens. 2022, 14, 5078. [Google Scholar] [CrossRef]
- Pranoto, B.; Hartulistiyoso, E.; Aidi, M.N.; Sutrisno, D.; Nahib, I.; Purwono, N.; Hudayat, N.; Rais, A.F.; Rahmila, Y.I. Assessing the Sustainability of Small Hydropower Sites in the Citarum Watershed, Indonesia Employing CA-Markov and SWAT Models. Water Supply 2024, 24, 3253–3268. [Google Scholar] [CrossRef]
- Asdak, C. Hidrologi Dan Pengelolaan Daerah Aliran Sungai; UGM Press: Yogyakarta, Indonesia, 2023; ISBN 6233590736. [Google Scholar]
- Gao, T.; Li, Y.; Zhao, C.; Chen, J.; Jin, R.; Zhu, W. Factors Driving Changes in Water Conservation Function from a Geospatial Perspective: Case Study of Jilin Province. Front. Ecol. Evol. 2023, 11, 1303957. [Google Scholar] [CrossRef]
- Yuyang, Z.; Xianbin, D.; Yafei, L.; Yingli, W.; Yue, G.; Jian, F.; Binbin, D.; Dachun, Z.; Wen, Z. Analysis of the Changes in Water Conservation in Jiangxi Province from 2000 to 2020, and the Determinant Factors. J. Resour. Ecol. 2023, 14, 940–950. [Google Scholar] [CrossRef]
- Zhou, L.; Cui, W.; Yang, F. Spatiotemporal Variations and Driving Forces Analysis of Ecosystem Water Conservation in Coastal Areas of China. Ecol. Indic. 2024, 162, 112019. [Google Scholar] [CrossRef]
- Braud, I.; Haverkamp, R.; Arrue, J.; López, M. Spatial Variability of Soil Surface Properties and Consequences for the Annual and Monthly Water Balance of a Semiarid Environment (EFEDA Experiment). J. Hydrometeorol. 2003, 4, 121–137. [Google Scholar] [CrossRef]
- Pan, Y.; Yin, Y. Spatial and Temporal Evolution Characteristics of Water Conservation in the Three-Rivers Headwater Region and the Driving Factors over the Past 30 Years. Atmosphere 2023, 14, 1453. [Google Scholar] [CrossRef]
- Qin, M.; Zhao, Y.; Liu, Y.; Jiang, H.; Li, H.; Zhu, Z. Multi-Scenario Simulation for 2060 and Driving Factors of the Eco-Spatial Carbon Sink in the Beibu Gulf Urban Agglomeration, China. Chin. Geogr. Sci. 2023, 33, 85–101. [Google Scholar] [CrossRef]
- Heo, J.; Lee, J.; Hyun, Y.; Park, J. Integrating Machine Learning, Land Cover, and Hydrological Modeling to Contribute Parameters for Climate Impacts on Water Resource Management. Sustainability 2024, 16, 8805. [Google Scholar] [CrossRef]
- Kreibich, J.; Bino, G.; Zheng, H.; Chiew, F.; Glamore, W.; Woods, J.; Kingsford, R.T. River Regulation and Climate Change Reduce River Flows to Major Australian Floodplain Wetland. J. Environ. Manag. 2024, 370, 122962. [Google Scholar] [CrossRef]
- Zhai, J.; Liu, Y.; Hou, P.; Xiao, T.; Cao, G. Water Conservation Service Assessment and Its Spatiotemporal Features in National Key Ecological Function Zones. Adv. Meteorol. 2016, 2016, 5194091. [Google Scholar] [CrossRef]
- Setti, S.; Barik, K.K.; Maheswaran, R. A Review of Attribution of Land Use and Climate Change on River Hydrology. Curr. Agric. Res. J. 2024, 12, 498–514. [Google Scholar] [CrossRef]
- Hazra, S.; Mukhopadhyay, A.; Chanda, A.; Mondal, P.; Ghosh, T.; Mukherjee, S.; Salehin, M. Characterizing the 2D Shape Complexity Dynamics of the Islands of Sundarbans, Bangladesh: A Fractal Dimension Approach. Environ. Earth Sci. 2016, 75, 1367. [Google Scholar] [CrossRef]
- Parhusip, Y.G.; Anggraheni, E. Influence of Erosion Potential Analysis Based on Land Use Change in Upper Citarum Watershed. Bentang 2024, 12, 153–160. [Google Scholar] [CrossRef]
- Wang, G.; Zhang, Y.; Liu, G.; Chen, L. Impact of Land-Use Change on Hydrological Processes in the Maying River Basin, China. Sci. China Ser. D 2006, 49, 1098–1110. [Google Scholar] [CrossRef]
- Anang, Z.; Yusop, Z.; Sharma, A.K.; Panagoulia, D.; Rashid, N.K.A.; Nawawi, N.R.W. Socioeconomic Factors Affecting Water Conservation in Household Consumption in Johor Bahru and Kuala Terengganu Districts of Malaysia. IJSDP 2024, 19, 3321–3338. [Google Scholar] [CrossRef]
- Jia, Y.; Jin, J.; Wang, Y.; Guo, X.; Du, E.; Wang, G. Evaluating the Spatiotemporal Distributions of Water Conservation in the Yiluo River Basin under a Changing Environment. Water 2024, 16, 2320. [Google Scholar] [CrossRef]
- Abdelhak, M. Innovative Techniques for Soil and Water Conservation. In Ecosystem Management; Banerjee, A., Jhariya, M.K., Raj, A., Mechergui, T., Eds.; Wiley: Hoboken, NJ, USA, 2024; pp. 291–326. ISBN 978-1-394-23121-8. [Google Scholar]
- Li, M.; Di, Z.; Yao, Y.; Ma, Q. Variations in Water Conservation Function and Attributions in the Three-River Source Region of the Qinghai–Tibet Plateau Based on the SWAT Model. Agric. For. Meteorol. 2024, 349, 109956. [Google Scholar] [CrossRef]
- Pavithran, P.; Pazhanivelan, S.; Sivamurugan, A.; Ragunath, K.; Selvakumar, S.; Vanitha, K.; Sakthivel, S.; Shanmugapriya, P. Long-Term Analysis of Reference Evapotranspiration Variations in the Lower Bhavani Basin. Plant Sci. Today 2024, 11, 1125–1135. [Google Scholar] [CrossRef]
- Xie, X.; Peng, M.; Zhang, L.; Chen, M.; Li, J.; Tuo, Y. Assessing the Impacts of Climate and Land Use Change on Water Conservation in the Three-River Headstreams Region of China Based on the Integration of the InVEST Model and Machine Learning. Land 2024, 13, 352. [Google Scholar] [CrossRef]
- Dwarakish, G.S.; Ganasri, B.P. Impact of Land Use Change on Hydrological Systems: A Review of Current Modeling Approaches. Cogent Geosci. 2015, 1, 1115691. [Google Scholar] [CrossRef]
- Xi, H.; Yuan, Y.; Dong, H.; Zhang, X. Quantifying the Effect of Land Use and Land Cover Changes on Spatial-Temporal Dynamics of Water in Hanjiang River Basin. Remote Sens. 2024, 16, 4136. [Google Scholar] [CrossRef]
- Zhao, J. Coordinated Management Model of Water Resources Utilization and Regional Economic Development Based on Genetic Neural Network. Int. J. Inf. Syst. Model. Des. 2024, 15, 1–18. [Google Scholar] [CrossRef]
- Qu, J.; Qin, C.; Chang, J.; Zhao, Y.; Wang, H.; He, F. Impact of Water Transfer on Socioeconomic Drought in China: A New Approach Based on Production and Consumption. Agric. Water Manag. 2025, 308, 109291. [Google Scholar] [CrossRef]
- Mishra, H. Environmental Degradation and Impacts on Agricultural Production: A Challenge to Urban Sustainability. In Sustainable Urban Environment and Waste Management; Parray, J.A., Shameem, N., Haghi, A.K., Eds.; Springer Nature: Singapore, 2025; pp. 53–92. ISBN 978-981-9611-39-3. [Google Scholar]
- Zhang, X.; Liu, J.; Zhu, J.; Cheng, W.; Zhang, Y. Analysis of the Spatiotemporal Patterns of Water Conservation in the Yangtze River Ecological Barrier Zone Based on the InVEST Model and SWAT-BiLSTM Model Using Fractal Theory: A Case Study of the Minjiang River Basin. Fractal Fract. 2025, 9, 116. [Google Scholar] [CrossRef]
- Prajapati, M.B.; Patel, R.B.; Dogra, A.K.; Singh, V.; Kumar, P.; Verma, S. Impact of Water Conservation on Household End-Use Water Consumption. In Advances in Environmental Engineering and Green Technologies; William, P., Kulkarni, S., Eds.; IGI Global: Hershey, PA, USA, 2025; pp. 265–282. ISBN 9798369394717. [Google Scholar]
- Wolters, E.A. Attitude–Behavior Consistency in Household Water Consumption. Soc. Sci. J. 2014, 51, 455–463. [Google Scholar] [CrossRef]
- Wang, J.; Li, Y.; Gao, J.; Wang, J.; Wu, L.; He, Z. Factors Influencing the Water Conservation Desire and Behavior Intention of Urban Households: A Survey Study in Hangzhou, China. Urban Water J. 2022, 19, 700–713. [Google Scholar] [CrossRef]
- Lucio, M.; Giulia, R.; Lorenzo, C. Investigating Attitudes towards Water Savings, Price Increases, and Willingness to Pay among Italian University Students. Water Resour. Manag. 2018, 32, 4123–4138. [Google Scholar] [CrossRef]
- Ngonta, A.G.M.; Hanani Ar, N.; Suhartini, S. Factors Influencing the Implementation of Soil and Water Conservation in Carrot Farming in East Java, Indonesia. Agro. Bali. Agric. J. 2024, 7, 719–730. [Google Scholar] [CrossRef]
- Wichman, C.J.; Taylor, L.O.; Von Haefen, R.H. Conservation Policies: Who Responds to Price and Who Responds to Prescription? J. Environ. Econ. Manag. 2016, 79, 114–134. [Google Scholar] [CrossRef]
- Mace, G.M.; Norris, K.; Fitter, A.H. Biodiversity and Ecosystem Services: A Multilayered Relationship. Trends Ecol. Evol. 2012, 27, 19–26. [Google Scholar] [CrossRef] [PubMed]
- Chen, Q.; Wang, C.; He, P.; Cai, A. Subjective Social Integration and Its Spatially Varying Determinants of Rural-to-Urban Migrants among Chinese Cities. Sci. Rep. 2024, 14, 5540. [Google Scholar] [CrossRef]
- Sedegah, D.D.; Agyekum, M.W.; Kyeremeh, B. Local-level Water Conservation and Management Practices in Rural Communities: A Case Study in Dormaa Municipality, Bono Region, Ghana. Irrig. Drain. 2023, 72, 1095–1108. [Google Scholar] [CrossRef]
- Mgonja, R.; Massawe, P. The Role of Community-Based Initiatives in Enhancing Water Quality and Livelihoods in Rural Tanzania: A Case Study of Mvomero Distric. NGJSD 2024, 15, 1–16. [Google Scholar] [CrossRef]
- Hermassi, T.; Jarray, F.; Tlili, W.; Achour, I.; Mechergui, M. Integrative Hydrologic Modelling of Soil and Water Conservation Strategies: A SWAT-Based Evaluation of Environmental Resilience in the Merguellil Watershed, Tunisia. Front. Water 2025, 7, 1521812. [Google Scholar] [CrossRef]
- Rodrigues, A.R.; Marques, S.; Botequim, B.; Marto, M.; Borges, J.G. Forest Management for Optimizing Soil Protection: A Landscape-Level Approach. For. Ecosyst. 2021, 8, 50. [Google Scholar] [CrossRef]
- Chen, Z.; Lü, Y.; Liu, Y.; Chen, D.; Peng, B. The Impact of Forest Management Inventory Factors on the Ecological Service Value of Forest Water Conservation Based on Machine Learning Algorithms. Forests 2024, 15, 1431. [Google Scholar] [CrossRef]
- Wang, N.; Bi, H.; Peng, R.; Zhao, D.; Liu, Z. Disparities in Soil and Water Conservation Functions among Different Forest Types and Implications for Afforestation on the Loess Plateau. Ecol. Indic. 2023, 155, 110935. [Google Scholar] [CrossRef]
- Farooqi, T.J.A.; Li, X.; Yu, Z.; Liu, S.; Sun, O.J. Reconciliation of Research on Forest Carbon Sequestration and Water Conservation. J. For. Res. 2021, 32, 7–14. [Google Scholar] [CrossRef]
- Yuan, Y.; Zheng, Y.; Huang, X.; Zhai, J. Climate Resilience of Urban Water Systems: A Case Study of Sponge Cities in China. J. Clean. Prod. 2024, 451, 141781. [Google Scholar] [CrossRef]
- Patil, P.V.; Lodhe, A.D. Innovative Approaches To Water Conservation In Rajasthan: Challenges And Solutions. J. Sci. Res. Technol. 2025, 3, 5–16. Available online: https://www.ajol.info/index.php/jasem/article/view/288048 (accessed on 2 March 2025).


| Parameter/Data | Description | Data and Value | Source |
|---|---|---|---|
| Water Yield (mm) | Map of average annual WY | Average Annual WY (mm) Raster | Published on [25] |
| Precipitation (mm) | Map of average annual precipitation | Average Annual Precipitation (mm) Raster | Published on [25] |
| Reference Evapotranspiration (mm) | The quantity of water that transitions from land to the atmosphere over a specific period is determined by the combined processes of evaporation—from soil, water bodies, and various surfaces—and transpiration through vegetation. | Global Potential Average Evapotranspiration (mm) Raster | Terra Modis Yearly L4 Global (https://earthexplorer.usgs.gov/ (accessed on 12 March 2024)) |
| Land Use/Land Cover (LULC): 2010 and 2020 | Defines the physical features of the land and/or the way individuals use it. | Raster–Coded Land Use/Land Cover | Landsat-OLI analysis results |
| Boundary shapefile (watershed) | Map of watershed boundaries | Integer (ws_id) from one to n. Vector file (.shp) | Ministry of Environment and Forestry, Republic of Indonesia |
| Biophysical Table | CSV File (Values assigned per Land Use/Land Cover type) | ||
| Coefficient of velocity | Coefficient of velocity | Flow velocity coefficient | Refer [16] modification |
| Elevation | Digital elevation Model | Used to calculate percentage slope, topography index, | Aster DEM-USGS |
| Soil depth | Soil depth (mm). | A comprehensive soil characteristics dataset | (http://globalchange.bnu.edu.cn/research/soil2 (accessed on 15 March 2024)) |
| Soil saturation hydraulic conductivity | Global soil saturation hydraulic conductivity | Clipping, for calculation of WC | Future Water (http://www.futurewater.eu/hihydrosoil (accessed on 20 March 2024)) |
| Topographic factors | |||
| Slope (Variable name: X1) | Shuttle Radar Topography Mission (SRTM) Global (USGS) | Calculation from DEM (X2) | 30 m × 30 m |
| Digital Elevation Model (DEM) (Variable name: X2) | Shuttle Radar Topography Mission (SRTM) Global (USGS) | - | 30 m × 30 m |
| Climate | |||
| Annual average temperature (TEM) (Variable name: X3) | Meteorological, climatological and Geophysical Agency | Numerical and tabular data, including geographic coordinates, were analyzed using the spline interpolation technique | 30 m × 30 m |
| Annual average precipitation, PRE (Variable name: X4) | Meteorological, climatological and Geophysical Agency | 30 m × 30 m | |
| Vegetation Factor | |||
| Net Primary Production (NPP) (Variable name: X5) | MODIS -MOD17A3HGF V6.1 product in 2000, 2010, and 2020 (https://www.usgs.gov/ and Google Earth Engine (accessed on 20 April 2024)) | The sum of all 8-day Net Photosynthesis is the difference between Gross Primary Productivity and Maintenance Respiration. Resampling from 500 m × 500 m | 30 m × 30 m |
| Fractional Vegetation Cover (FVC) (Variable name: X6) | MODIS–MOD13Q1 with NDVI value in 2000, 2010, and 2020 (https://www.usgs.gov/ and Google Earth Engine (accessed on 25 April 2024)) | FVC = ((NDVI − 0.2)/0.3) × 100. Resampling from 250 m × 250 m | 30 m × 30 m |
| Socioeconomic | |||
| Income per capita (X7) | West Java Central Statistics Agency 2010 & 2020 | Numerical and tabular data | 30 m × 30 m |
| Population Density (X8) | West Java Central Statistics Agency 2010 & 2020 | Numerical and tabular data | 30 m × 30 m |
| Name Sub Watershed | 2010 | 2020 | Change 2010–2020 | |||
|---|---|---|---|---|---|---|
| Mean (mm) | Total (108 m3) | Mean (mm) | Total (108 m3) | (108 m3) | % | |
| Upstream | 397.42 | 10.6 | 368.17 | 9.86 | −0.74 | −6.98113 |
| Middle | 631.22 | 17.37 | 548.16 | 15.12 | −2.25 | −12.9534 |
| Downstream | 508.07 | 10.3 | 437.87 | 8.86 | −1.44 | −13.9806 |
| Citarum | 513.96 | 38.26 | 453.64 | 33.84 | −4.42 | −11.5525 |
| No | LULC | 2010 | 2020 | Change 2010–2020 | |||
|---|---|---|---|---|---|---|---|
| mm | % | mm | % | Mm | % | ||
| 1 | Virgin Forest | 1145.54 | 0.50 | 1060.19 | 0.48 | −85.35 | (7.45) |
| 2 | Plantation Forest | 913.95 | 0.44 | 648.69 | 0.31 | −265.26 | (29.02) |
| 3 | Shrub | 295.78 | 0.13 | 263.34 | 0.13 | −32.44 | (10.97) |
| 4 | Estate Crop Plantation | 721.75 | 0.35 | 680.36 | 0.31 | −41.39 | (5.73) |
| 5 | Settlement Area | 846.19 | 0.28 | 741.76 | 0.20 | −104.43 | (12.34) |
| 6 | Bare Land | 366.52 | 0.21 | 270.77 | 0.13 | −95.75 | (26.12) |
| 7 | Lake | 84.74 | 0.04 | 65.34 | 0.02 | −19.40 | (22.89) |
| 8 | Dry Farming | 902.66 | 0.41 | 784.67 | 0.37 | −117.99 | (13.07) |
| 9 | Paddy Field | 742.97 | 0.43 | 623.19 | 0.36 | −119.78 | (16.12) |
| 10 | Fishpond | 158.82 | 0.08 | 139.54 | 0.05 | −19.28 | (12.14) |
| 11 | Airport | 370.58 | 0.15 | 280.96 | 0.19 | −89.62 | (24.18) |
| Regulation Area | Code * | Area | |
|---|---|---|---|
| ha | % | ||
| Strong PREC regulation | 122, 123, 132, 133 | 8636.45 | 1.25 |
| Strong PEVA Regulation | 212, 213, 312, 313 | - | 0 |
| Strong LULC regulation | 221, 321, 331, 231 | 179,983.62 | 26.05 |
| Strong COMP regulation | 111, 112, 113, 121, 131, 211, 311 | 502,295.93 | 72.7 |
| Weaks regulation area | 222, 223, 232, 233, 322, 323, 332, 333 | - | 0 |
| No data | - | 0 | |
| Driving Factors | Socioeconomic | Topography | Climate | Vegetation |
|---|---|---|---|---|
| Socioeconomic | 0.277 | |||
| Topography | 0.496 | 0.085 | ||
| Climate | 0.497 | 0.311 | 0.006 | |
| Vegetation | 0.527 | 0.380 | 0.318 | 0.114 |
| Fit Metrics | Model | ||
|---|---|---|---|
| OLS | GWR | MGWR | |
| Fix Model | |||
| R2 (adjust) | 0.003 | 0.741 | 0.977 |
| AICc | 470.549 | 347.870 | 5.973 |
| Adaptive Model | |||
| R2 (adjust) | 0.003 | 0.414 | 0.565 |
| AICc | 470.549 | 417.120 | 357.093 |
Disclaimer/Publisher’s Note: The statements, opinions and data contained in all publications are solely those of the individual author(s) and contributor(s) and not of MDPI and/or the editor(s). MDPI and/or the editor(s) disclaim responsibility for any injury to people or property resulting from any ideas, methods, instructions or products referred to in the content. |
© 2025 by the authors. Licensee MDPI, Basel, Switzerland. This article is an open access article distributed under the terms and conditions of the Creative Commons Attribution (CC BY) license (https://creativecommons.org/licenses/by/4.0/).
Share and Cite
Nahib, I.; Wahyudin, Y.; Ambarwulan, W.; Pranoto, B.; Ramadhani, F.; Cahyana, D.; Nugroho, N.P.; Suwedi, N.; Suryanta, J.; Karolinoerita, V.; et al. Spatial Analysis of Water Conservation and Its Driving Factors in an Urban Citarum Tropical Watershed: Geospatial Approach. Resources 2025, 14, 77. https://doi.org/10.3390/resources14050077
Nahib I, Wahyudin Y, Ambarwulan W, Pranoto B, Ramadhani F, Cahyana D, Nugroho NP, Suwedi N, Suryanta J, Karolinoerita V, et al. Spatial Analysis of Water Conservation and Its Driving Factors in an Urban Citarum Tropical Watershed: Geospatial Approach. Resources. 2025; 14(5):77. https://doi.org/10.3390/resources14050077
Chicago/Turabian StyleNahib, Irmadi, Yudi Wahyudin, Wiwin Ambarwulan, Bono Pranoto, Fadhlullah Ramadhani, Destika Cahyana, Nunung Puji Nugroho, Nawa Suwedi, Jaka Suryanta, Vicca Karolinoerita, and et al. 2025. "Spatial Analysis of Water Conservation and Its Driving Factors in an Urban Citarum Tropical Watershed: Geospatial Approach" Resources 14, no. 5: 77. https://doi.org/10.3390/resources14050077
APA StyleNahib, I., Wahyudin, Y., Ambarwulan, W., Pranoto, B., Ramadhani, F., Cahyana, D., Nugroho, N. P., Suwedi, N., Suryanta, J., Karolinoerita, V., Darmawan, M., Rudiastuti, A. W., Cahya, D. L., Winarno, B., Pianto, T. A., & Akbar, H. I. (2025). Spatial Analysis of Water Conservation and Its Driving Factors in an Urban Citarum Tropical Watershed: Geospatial Approach. Resources, 14(5), 77. https://doi.org/10.3390/resources14050077