Article

Assessment of the Hydrogen Production Potential in a Zeolite Assisted Two-Phase Dark and Photo-Fermentation Process from Urban Waste Mixture

1
Department of Environmental Sciences, Informatics and Statistics, Ca’ Foscari University of Venice, Via Torino 155, 30172 Venezia-Mestre, Italy
2
Department of Biotechnology, University of Verona, Strada Le Grazie 15, 37134 Verona, Italy
3
Istituto Nazionale per l’Assicurazione Contro gli Infortuni sul Lavoro (INAIL), Department of Technological Innovations and Safety of Plants, Products and Human Settlements, Via del Torraccio di Torrenova 7, 00133 Rome, Italy
*
Author to whom correspondence should be addressed.
Resources 2025, 14(3), 43; https://doi.org/10.3390/resources14030043
Submission received: 21 January 2025 / Revised: 24 February 2025 / Accepted: 3 March 2025 / Published: 6 March 2025

Abstract

:
Waste-based sustainable solutions proposed by scientific and industrial communities for energy production are an approach that can respond to the growing concerns regarding climate change and fossil resources depletion. This study investigates a two-phase bioprocess combining dark fermentation (DF) and photo-fermentation (PF) to enhance hydrogen yield while anaerobically treating urban organic food waste and sewage sludge. A key objective was to assess the effect of waste composition and temperature on hydrogen accumulation, with particular attention to the fermentation product and the role of zeolite in improving process efficiency. In the DF stage, the addition of zeolite significantly enhanced hydrogen production by increasing microbial activity and improving substrate bioavailability. As a result, hydrogen production increased up to 27.3 mmol H2/(L d) under thermophilic conditions. After the suspended solids were removed from the dark fermentation broth, a photo-fermentation step driven by a pure strain of Rhodopseudomonas palustris was performed under permanent IR light and different substrate-to-inoculum [S/I] ratios. The maximum hydrogen production rate was 9.33 mmol H2/(L d), when R. palustris was inoculated at the lowest [S/I] ratio (<20 COD/COD) and with 0.5 g VSS/L as the initial concentration. This condition in the photo-fermentation process led to an increase in the hydrogen yield up to 35% compared to values obtained from dark fermentation alone.

1. Introduction

The European Union (EU) defined its strategies for accomplishing the transition towards a circular economy; one of these strategies consists of the so called “closing the loop” approach within all the industrial sectors and production. Within this context, it is strongly recommended to maintain the value of resources and products for the longest time possible and, in the production line, recover all the by-products, and minimize the waste to be disposed of [1]. The conversion of organic waste into new added-value products can be technically realized with combined processes, in which the biological part can be optimized according to the metabolites of interest. In fact, end-product identification and cost-effective flow-charts are key elements in the design of biological processes, especially when they are focused on organic waste valorization [2].
In recent decades, growing concern about climate change and the depletion of fossil resources has pushed the scientific and industrial community to explore waste-based sustainable solutions for energy production. In this context, hydrogen emerges as a promising energy carrier, thanks to its high energy yield (142.35 kJ/g), ability to generate clean energy, and versatility in different sectors, from industry to transportation [3]. The production of hydrogen from renewable sources represents a crucial strategy for reducing greenhouse gas emissions and promoting the transition to a low-carbon economy. At the EU level, the European Green Deal includes an investment plan for green hydrogen, aiming to decarbonize industry and transportation. The goal is to produce 10 million tons of renewable hydrogen within the EU and import an additional 10 million tons by 2030. The plan seeks to mobilize at least EUR 1 trillion in sustainable investments over the next decade, with the aim to reduce CO2 emissions, create jobs, and strengthen Europe’s energy independence [4].
In the frame of biological processes, high-rate dark fermentation (DF) is considered the reference scenario for hydrogen production; this process includes only a part of the entire metabolic pathways usually observed in anaerobic digestion (AD), a fully established technology for biogas production [5]. In the DF process, the organic matter’s degradation occurs along with the accumulation of key metabolites such as volatile fatty acids (VFAs) and hydrogen. However, some technical issues have decreased the effectiveness of hydrogen recovery from organic waste and, up to now, the technology has yet to be established at an industrial scale due to the following: (a) waste availability and seasonality; (b) relatively low hydrogen production, according to the high hydrogen consumption by the CO2-reducing methanogens, especially when high hydraulic retention times (HRTs) are adopted; (c) low degradation rate of some residues, depending on the specific chemical composition [6]. It is clear that the stability and availability of the feedstock together with the appropriate operating conditions for the DF process are important factors to overcome. Within the urban scenario, food waste is abundant but subject to a strong variability in its chemical characteristics over the year [7]. Sewage sludge is another raw material potentially amenable for hydrogen recovery, since it is characterized by a high organic matter concentration and a continuous production in municipalities [8]. Hence, the mixture of both streams can be considered the logical solution for their valorization via DF, also considering the appropriate nutrient balance in the presence of a co-substrate [3,9].
Although DF is a promising process, the presence of soluble products reduces the capacity of hydrogen accumulation, the production of which is generally characterized by low yields (around 25%) [10]. However, aluminosilicate materials (zeolite) have been extensively studied in different biological processes due to some of their properties like the ion exchange capacity, high surface area, porosity, and electric conductivity. The scenario of zeolite application is better represented by anaerobic digestion (AD), where zeolites can act as ion-exchangers for ammonia removal or as free ammonia adsorbing material, avoiding the inhibitory effects of ammonia and improving biogas production. Also, cations like Ca2+ and Mg2+, as well as long chain fatty acids, can be adsorbed to zeolites, reducing the potential toxicity and increasing CH4 yield [11]. The utilization of zeolite in the DF processes is still limited, and it has only been reported in the work of Silva et al. [10], where the benefit of zeolite addition in hydrogen production in the DF driven by a pure culture of Sargassum sp. has been demonstrated.
DF processes are generally characterized by low energy input, and they do not produce or consume oxygen through biochemical reactions, maintaining the activity of both [Fe-Fe]- and [Ni-Fe]-hydrogenases [12]. However, given that hydrogen accumulation in one-step DF processes is limited and strictly related to the carbohydrate content of the feedstock [13], to boost the global hydrogen yield, an additional process could be the ideal solution according to the capacity of some phototrophic microorganisms to utilize VFAs accumulated in the DF broth. Hence, this additional step is represented by photo-fermentation (PF), which consists of the conversion of organic compounds into hydrogen (produced with the help of the nitrogenase enzyme) in the presence of IR light, involving the following different groups of photosynthetic bacteria [14]: Rhodobacter spheroides, Rhodobacter capsulatus, Rhodovulum sulfidophilum W-1S, and Rhodopseudomonas palustris [13].
In the frame of urban waste valorization, specifically food waste (FW) and municipal sewage sludge (MSS), this preliminary investigation has been developed to assess the effect of waste composition and temperature on hydrogen accumulation (specific rate and yield), with a particular focus on the fermentation products’ dynamics in batch DF tests. Parallel tests have been replicated with the addition of zeolite (chabazite type), at a content of 0.20 g/g VSinoculum [10], to mainly investigate its effect on the hydrogen production rate and yield. To maximize the hydrogen yield, a pure culture of Rhodopseudomonas palustris has been utilized in PF batch tests by using the DF broth as a substrate, particularly substrates rich in soluble compounds and with a limited amount of free ammonia, to enhance the hydrogen production capacity [15].

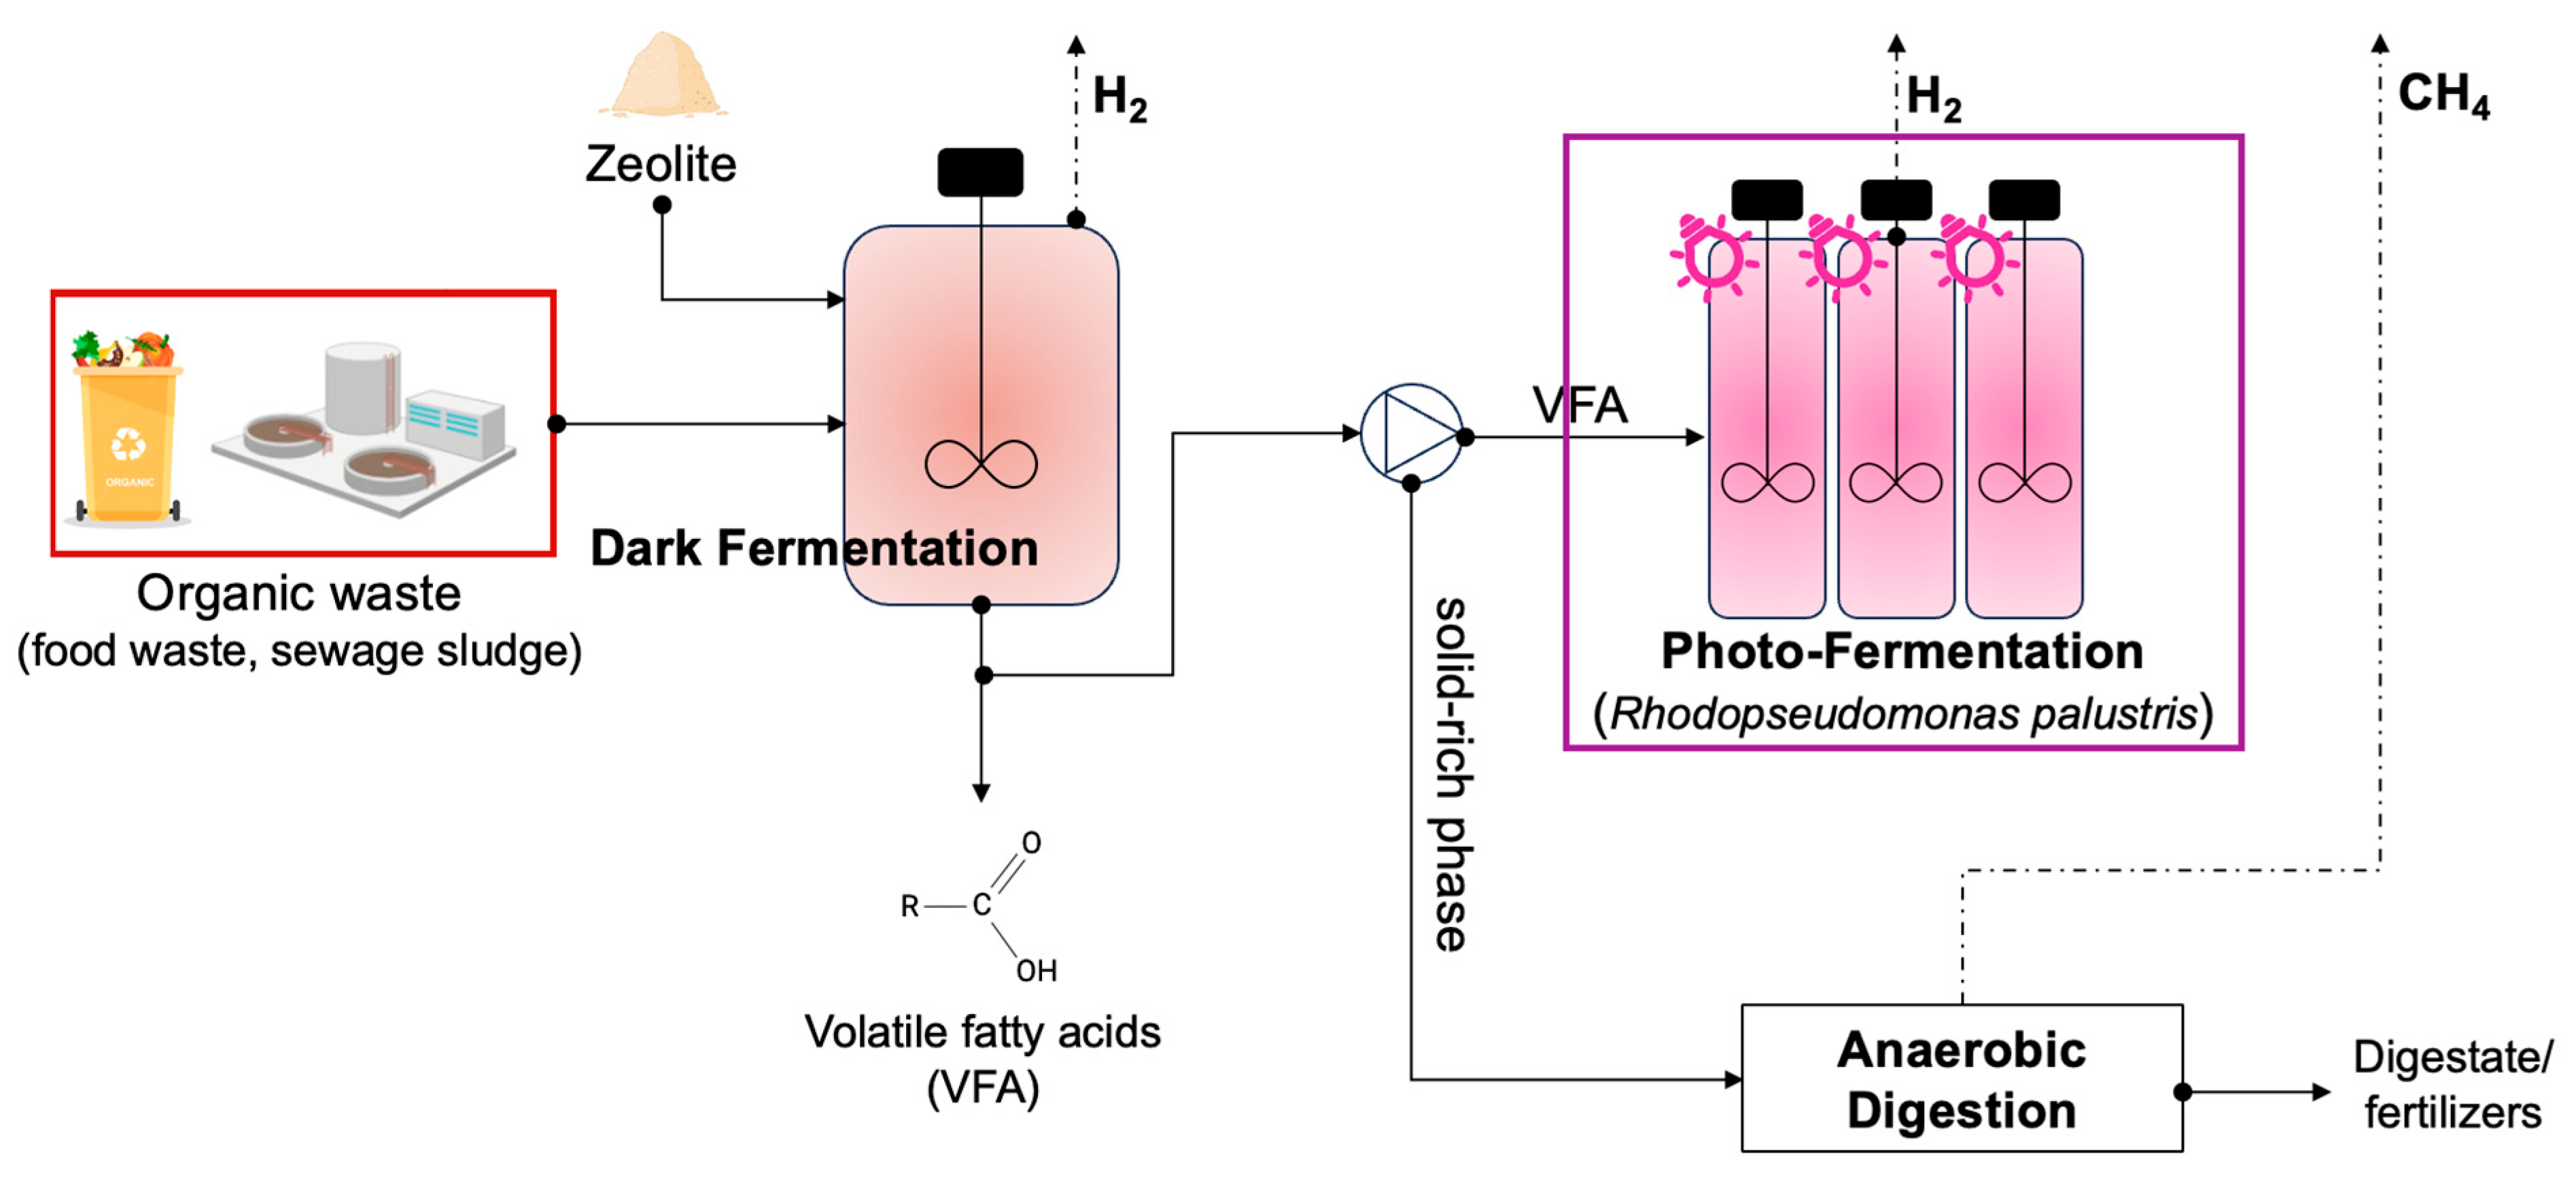
2. Materials and Methods

Thickened MSS was taken from the municipal wastewater treatment plant (WWTP) of Treviso (northeast Italy), from the static thickener of the sludge line; FW was taken from an external plant in the Treviso province, following its separate collection (related to 50 districts of the province), mechanical trituration, inert removal, and squeezing. Both streams have been separately characterized for total and volatile solids (TS and VS), soluble chemical oxygen demand (CODSOL), VFA, ammonia, phosphate, Total Kjeldahl Nitrogen (TKN), and organic phosphorus (P) (Table 1). The zeolite was made of 64% w/w chabazite, with a water retention of 37.8%; regarding particle size, 98% of the material was less than 0.15 mm in size. Small aliquots of the samples were disintegrated through acidic digestion and the digested samples were analyzed with ICP-MS NexION 350X (PerkinElmer, Markham, ON, Canada) coupled with the seaFAST autosampler (ESI) for metal quantification. Data are available in Tuci et al. [16].
The flowchart of the proposed approach is depicted in Figure 1. In this work, only the two fermentation stages (DF and FP) were taken into account; however, it has to be emphasized that the general approach to these technologies is consistent with the wider context of product’s differentiation and secondary waste flux recovery for the maximization of the bioresources’ potential.

2.1. Dark Fermentation (DF) Batch Tests

The DF batch tests were conducted in triplicate in the Nautilus BMP system designed by Anaero Technology (Cambridge, UK). The working volume was chosen as 0.8 L, and each bottle was mixed by a central mechanical stirrer in a water bath, which was maintained at 55 °C and 37 °C for thermophilic and mesophilic conditions, respectively. Both MSS and FW were firstly centrifuged (4.700 rpm for 10 min) and then diluted with tap water to reach an 80 g VS/L concentration in all tests. This value represents the initial inoculum concentration; indeed, no external inoculum was added since each test was performed by using the fermentation capacity of the mixed consortia already present in both streams. Liquid samples were periodically taken with a syringe connected to a sampling port of the system; to quantify the produced hydrogen, gas bags were connected to the same sampling port with a three-way valve. The following table (Table 2) shows all the tests carried out in the two temperature regimes.

2.2. Photo-Fermentation (PF) Batch Tests

The PF tests were conducted in 250 mL serum bottles (200 mL working volume) sealed with butyl rubber caps and subjected to an argon flux for approximately 20 min to achieve anaerobic conditions. A pure strain of the Gram-negative purple nonsulfur bacterium Rhodopseudomonas palustris (R. palustris), provided by BCCM (Belgian Coordinated Microorganism Collections, Ghent, Belgium), was used as inoculum, cultivated in a specific mineral medium, the composition of which was defined by BCCM itself. The hydrogen production capacity of R. palustris was tested with the addition of the fermentation broth (obtained from some of the DF tests), after its centrifugation—filtration on Whatman® (Merck KGaA, Germany) glass microfiber-grade GF/C filter (1.2 μm pore size)—and pH adjustment to 7.0 using a 3 M NaOH solution. All bottles were mixed using a single magnetic stirrer with heating plate (120 rpm), set to maintain a constant temperature of approximately 25 °C. IR lamps were placed on the sides of the stirrer to provide continuous lighting, with an average intensity of 50 W/m2. A control experiment (with no inoculum) was also performed to quantify the net hydrogen production. The gaseous and liquid phases were then periodically sampled to evaluate VFA and ammonia consumption, as well as hydrogen production and R. palustris growth (via VSS quantification).
Each test was conducted in triplicate; the fermentation broth was added to reach different initial VFA concentrations (through the appropriate dilution with a carbon-free mineral medium). The initial concentrations of inoculum R. palustris were set to 0.1, 0.25, and 0.5 g VSS/L.

2.3. Analytical Methods

With the exception of VFA, ethanol, lactic acid, and hydrogen, all the analyses were conducted according to Standard Methods [17]. Ethanol, volatile fatty acids, and caproic acid were quantified with an Agilent 6890 N gas chromatograph (Milan, Italy) equipped with a flame ionization detector (FID; 225 °C) and with an Agilent fused silica capillary column DB-WAX (15 m × 0.53 mm × 0.5 μm film thickness). Hydrogen was used as the carrier. The inlet was working in split mode, with a split ratio of 20:1. A ramp temperature was chosen, with a ramp rate of 10 °C/min, from 40 °C to 200 °C. Before the GC analyses, samples were centrifuged at 4700 rpm for 10 min and the supernatant was filtered at 0.2 mm using acetate cellulose syringe filters (Whatman). The same preparation was followed for the lactic acid quantification, which was then performed by using Megazyme kits [18]. The hydrogen percentage was quantified with the same GC described above, equipped with the HP-PLOT MOLESIEVETM column (30 m × 0.53 m ID × 25 μm film thickness), using a thermal conductivity detector (TCD; 250 °C). The temperature and pressure of the injector were 120 °C and 70 kPa, respectively; samples were taken using a gas-type syringe in 100 μL biogas amounts. The analyses were conducted at 40 °C for 8 min, with Argon as the carrier.

2.4. Calculations

In the DF tests, the fermentation yield (YOAs) was calculated according to the maximum concentration of the VFA and caproic acid achieved (as the sum of organic acid [OAst]), in relation to the initial vs. level (VS0). Ethanol and lactic acid were excluded from the yield since, in most of the tests, their trend was not characterized by a plateau curve.
Y O A s = O A s t O A s 0 V S 0
In the DF and PF tests, the maximum volumetric hydrogen production rate (RH2) was calculated based on the total mmol of biogas produced, the hydrogen percentage (from the GC analysis), and the working volume (L); this was reported at the peak of hydrogen production, generally observed in the first days (t) after inoculation.
R H 2 = m m o L / L ] · [ % H 2 t
In the PF tests, based on the maximum volumetric hydrogen production rate (RH2) observed, the volumetric VFA consumption rate (RVFA) and the volumetric growth rate (RR.p.) were calculated at the same time interval of RH2. For the RVFA, the consumption of VFA and caproic acid (if present) was considered; for the RR.p., the increase in the VSS was considered. Also, the maximum hydrogen yield was calculated according to the observed peak of production and the OAs consumed in the same time interval (t).
Y H 2 = [ ( N L   b i o g a s / L ) ·     % H 2 ]   t O A s 0 O A s t

3. Results

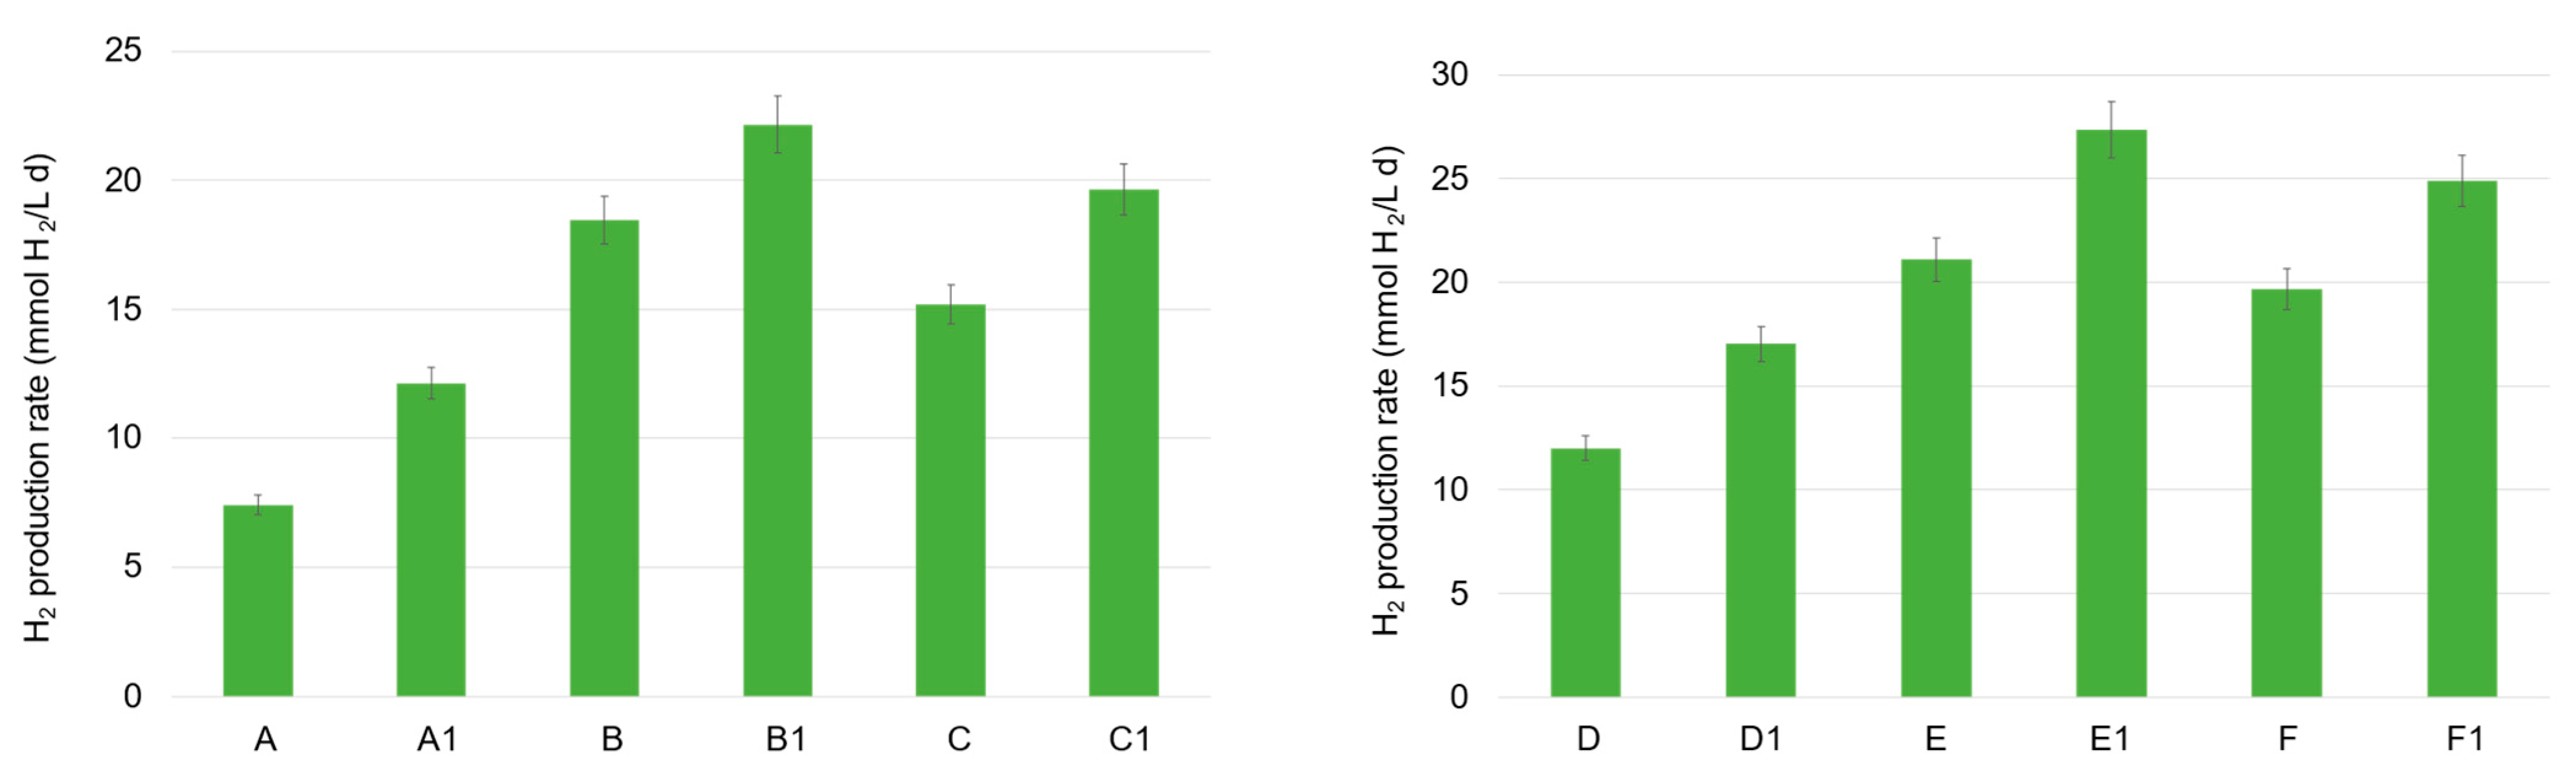
3.1. Hydrogen Production in Mesophilic and Thermophilic DF Tests

Regarding mesophilic tests, the increase in the OA level and, in particular, of the acetic and butyric acid in the tests where FW was present (tests B and C), matched with the higher hydrogen production activity. This was particularly true in the presence of the zeolite, where the highest hydrogen production rate was observed, as follows: 19.6 mmol H2/(L d) in test C1 and 22.2 mmol H2/(L d) in test B1 (Figure 2). Zeolites are an aluminosilicate material which have been extensively investigated in bioprocesses, different from DF (mainly AD), due to their interesting properties discussed above. A remarkable finding was the significant increase in the maximum hydrogen production rate with the addition of zeolite, even when utilizing MSS alone (tests A1 vs. A), which is a substrate less suitable for hydrogen production due to its relatively high protein content (>40% w/w) [5]. Regarding MSS in particular, the DF tests exhibited the lowest volumetric hydrogen production rate, 7.4 and 12.1 mmol H2/(L d) in tests A and A1, respectively. Notably, the presence of MSS alone led to a particularly high propionic acid accumulation, sometimes higher than 3.0 g COD/L, which corresponded to a percentage of 25–30% of the total OAs (COD basin). This high level was also part of the reason it occurred at a low hydrogen production activity, since the inhibition potential of propionate accumulation on the hydrogen production rate and yield in a mesophilic environment has been recently demonstrated [19]. The authors also discussed the benefit of a temperature shift from 37 °C to 45 °C to overcome propionic acid inhibition, sustaining the thermophilic dominance of hydrogen-producing bacteria, such as Clostridium butyricum and Clostridium acetobutylicum, on the Selenomonas lacticifex and Bifidobacterium catenulatum, mainly involved in propionate production in the mesophilic fermentation of beverage industry wastewater.
Regarding the production of bio-hydrogen in thermophilic trials, the volumetric rates were generally higher compared to the mesophilic values and they increased when zeolite was added (as also observed at 37 °C). The performance with MSS was improved by an increase of 30% in the D1 test, where the volumetric hydrogen production rate was equal to 17.0 mmol H2/(L d). The highest rate was observed in the test conducted with FW alone (E1), where the lowest propionic acid accumulation was observed (between 8–9% CODpropionic/CODOAs approximately), 27.3 mmol H2/(L d). This value was 23% higher than the H2 production rate obtained in the corresponding mesophilic test (B1). However, a comparable value was also obtained in the F1 test, where a mixture of FW and MSS was used, together with a zeolite addition—24.9 mmol H2/(L d).
To sum up, the maximum hydrogen production rate was detected with a zeolite addition in tests E1 and F1, suggesting the real possibility of also using MSS as a carbon source (abundantly available), in combination with a highly biodegradable co-substrate, for hydrogen production in DF processes. Even though the utilization of this material has not been deeply investigated thus far in DF technology, a recent work also showed the positive effect of zeolite addition in the microbial utilization of organic waste, as demonstrated by Silva et al. [11] and the present study. Mansouri et al. [20] have demonstrated the technical feasibility to produce hydrogen in the DF of industrial food wastewater driven by Staphylococcus culture, with modified zeolite decorated with green iron oxide nanoparticles (Fe3O4/ZSM-5) as a catalyzer. Optimal conditions for hydrogen production were found to be a nanoparticle concentration of 300 mg/L, a slightly acidic pH (5.5), and mesophilic temperature (36 °C). The authors stated that the nanoparticles at the specified concentrations enhanced bacterial activity. In particular, nanoparticles’ presence improved the electron transfer rate and accelerated the production of metabolites, mainly acetic, lactic, and formic acid and ethanol. Most importantly, since iron is known to be a vital component for cytochromes’ activity in bacteria and it is also responsible for the electrons’ transfer to the hydrogenase enzymes (involved in hydrogen production), the addition of iron nanoparticles probably contributed to the microbes’ growth and in the increase of hydrogenase activity.
In addition, the DF tests in this study were performed with a limited dosage of zeolite (when present); apparently, this approach was in agreement with the findings of Mansouri et al. [20], where zeolite addition was also limited, since an excessive increase in nanoparticles could cause a suppression of hydrogen production due to oxidative stress. Hence, the level of nanoparticles or catalyzers, in general, should always be controlled to prevent inhibition phenomena on the fermentation process and hydrogen production.
Table 3 summarizes the performance and primary outcomes from the DF batch tests, conducted in both mesophilic and thermophilic conditions.

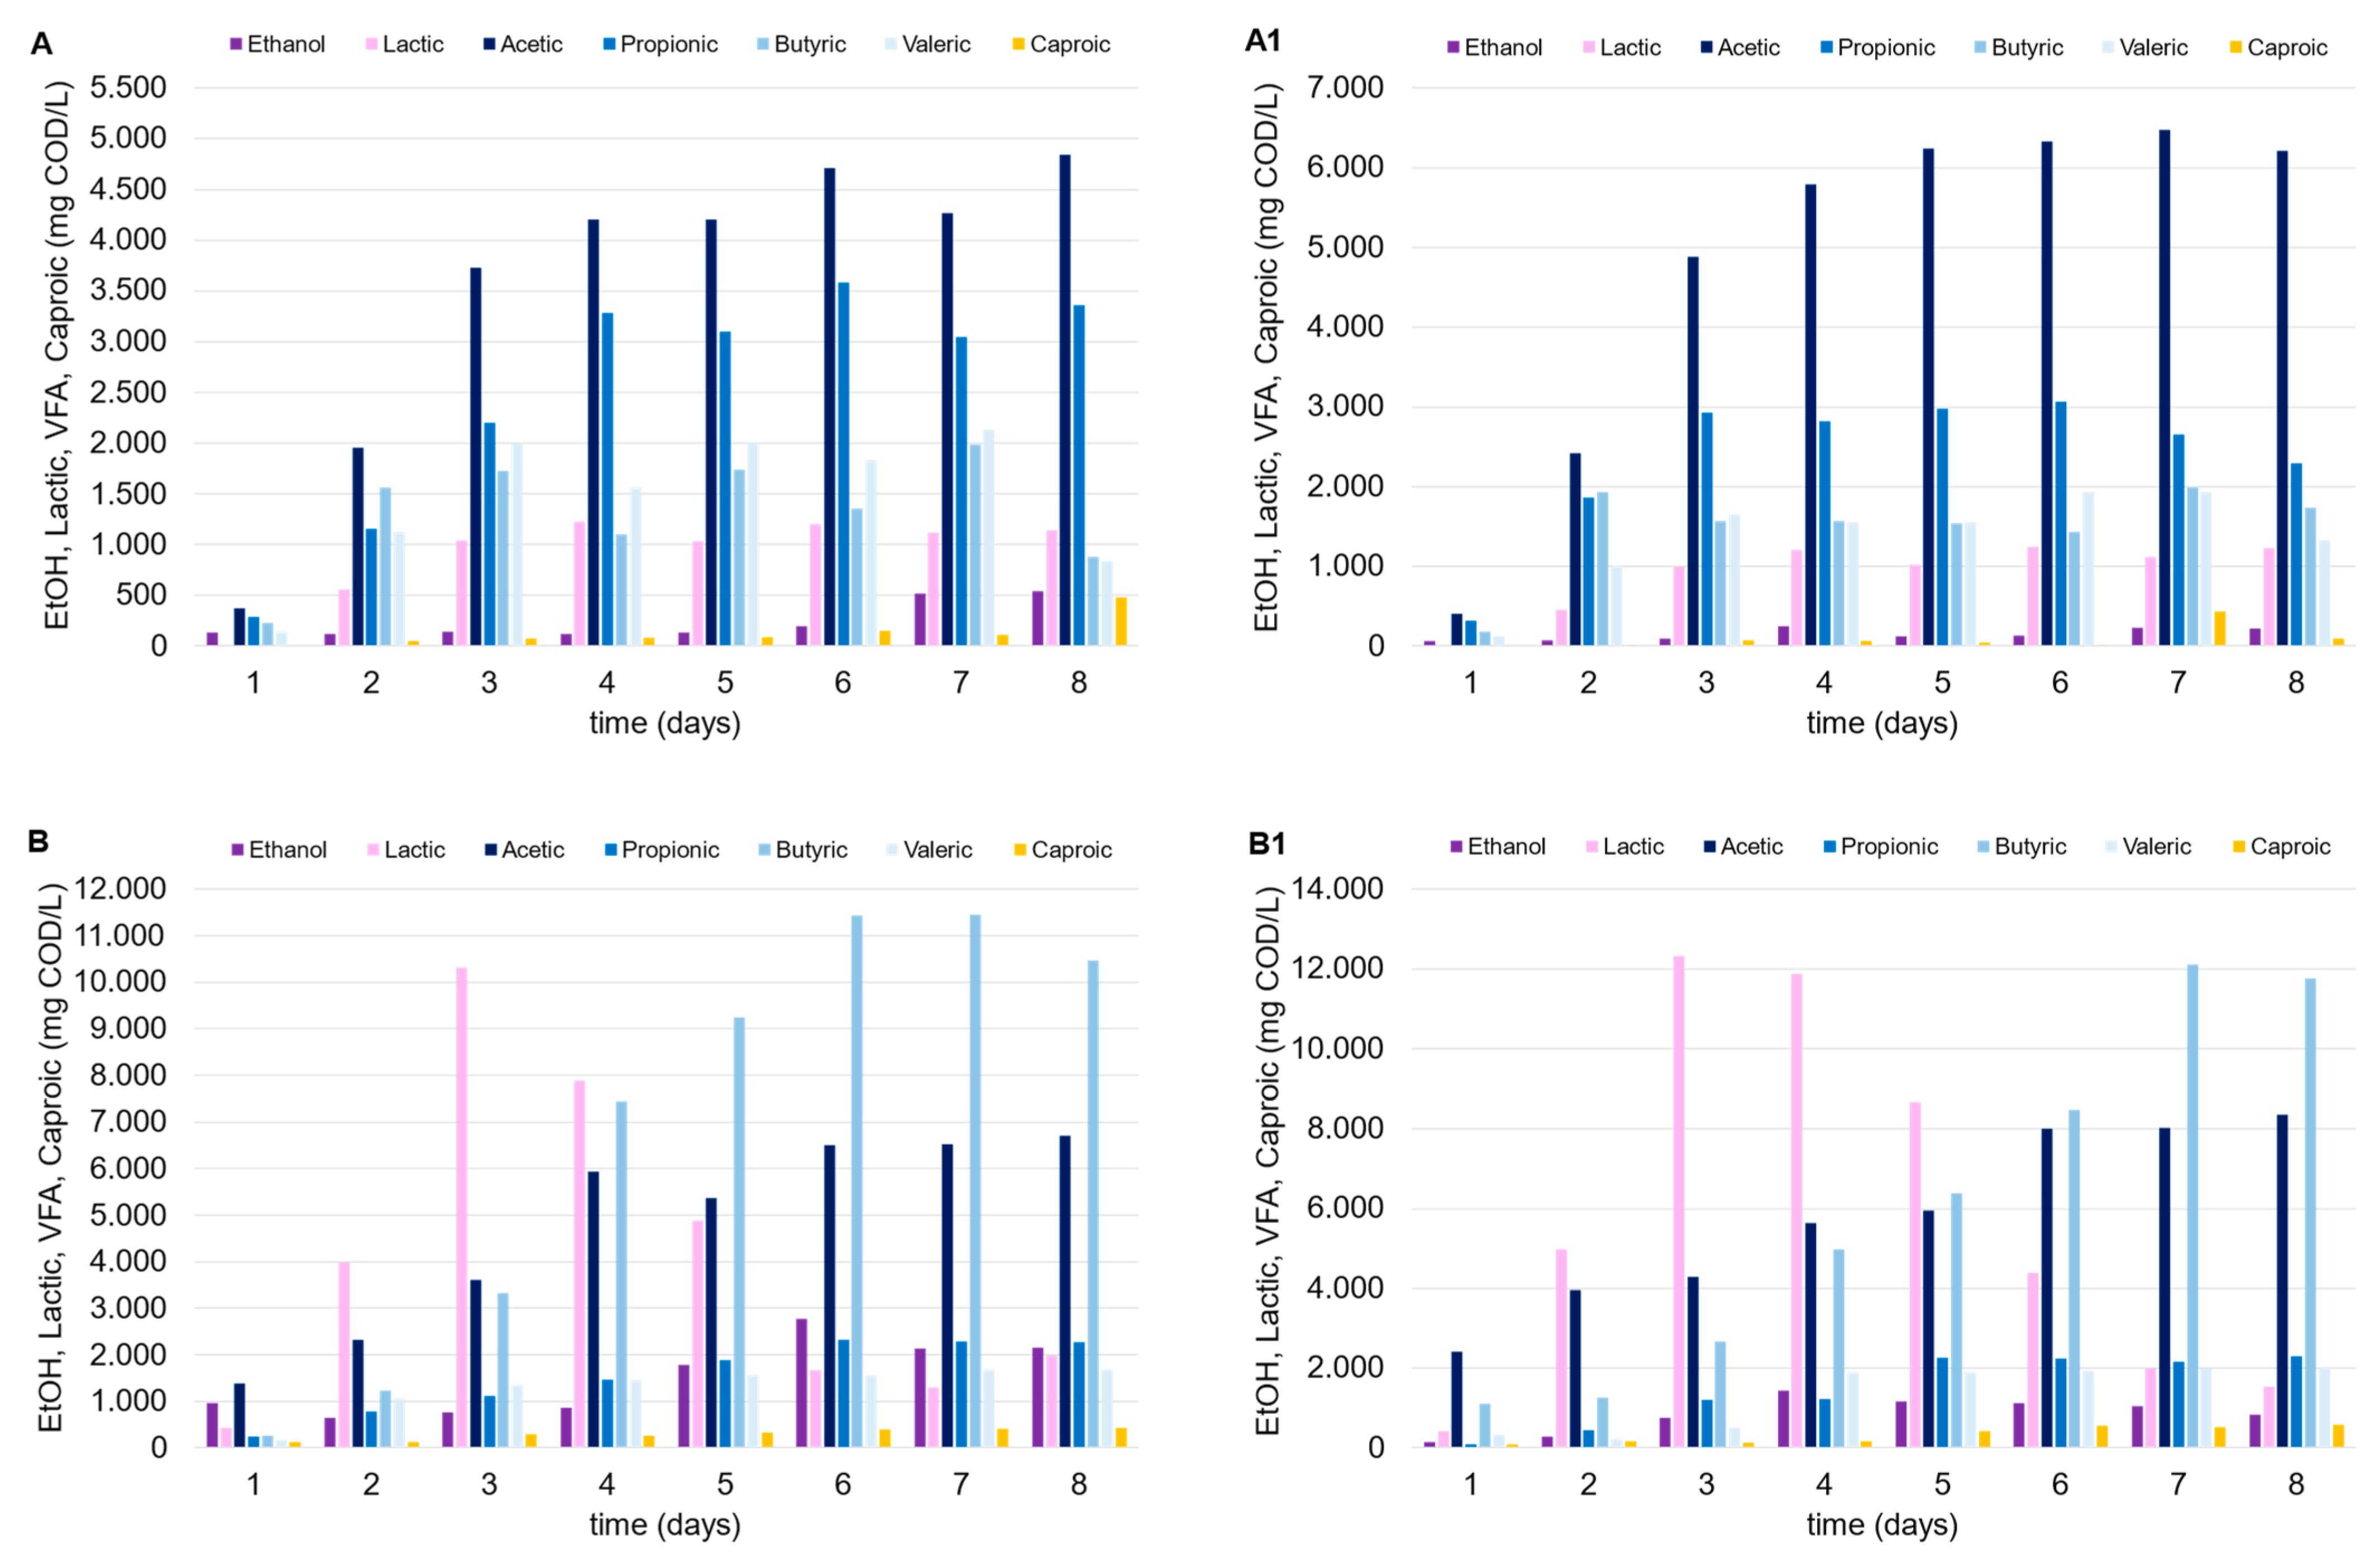
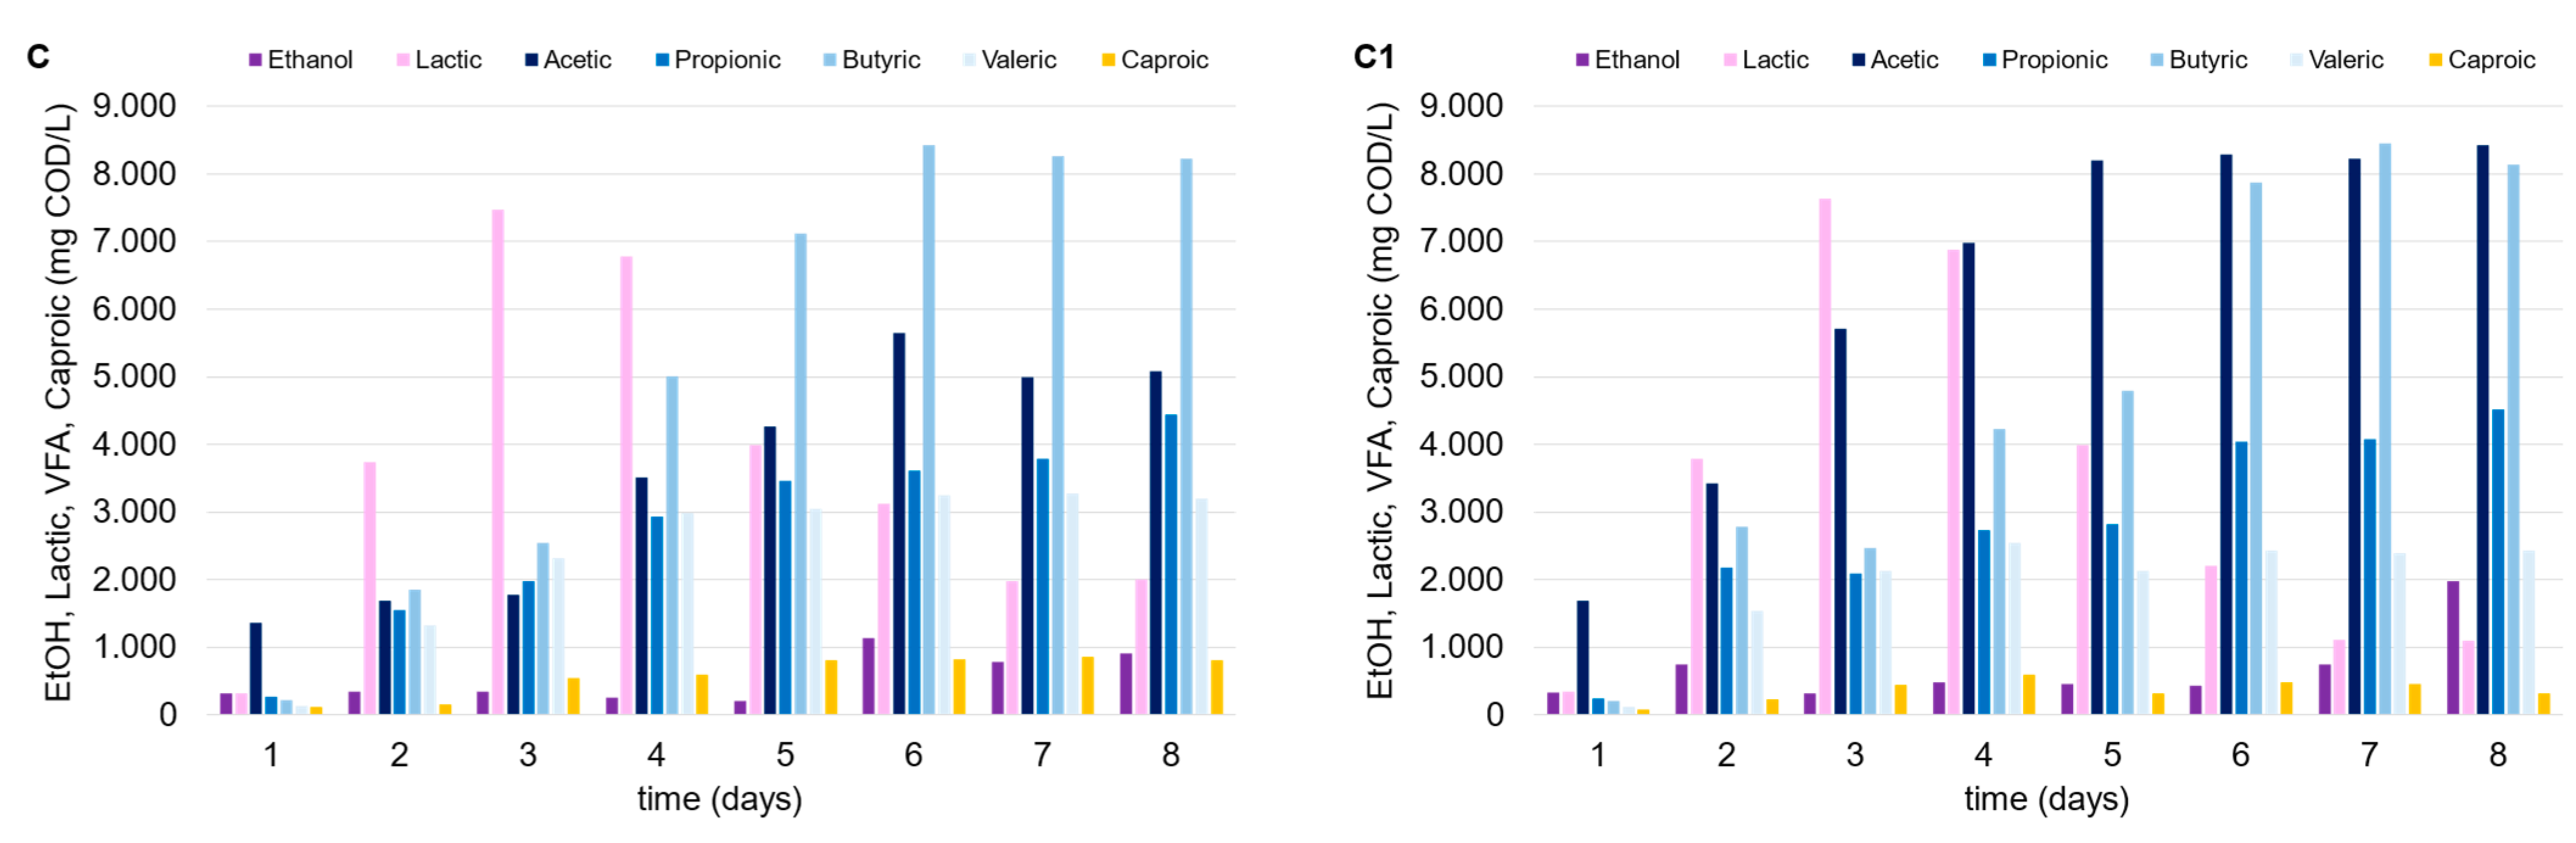
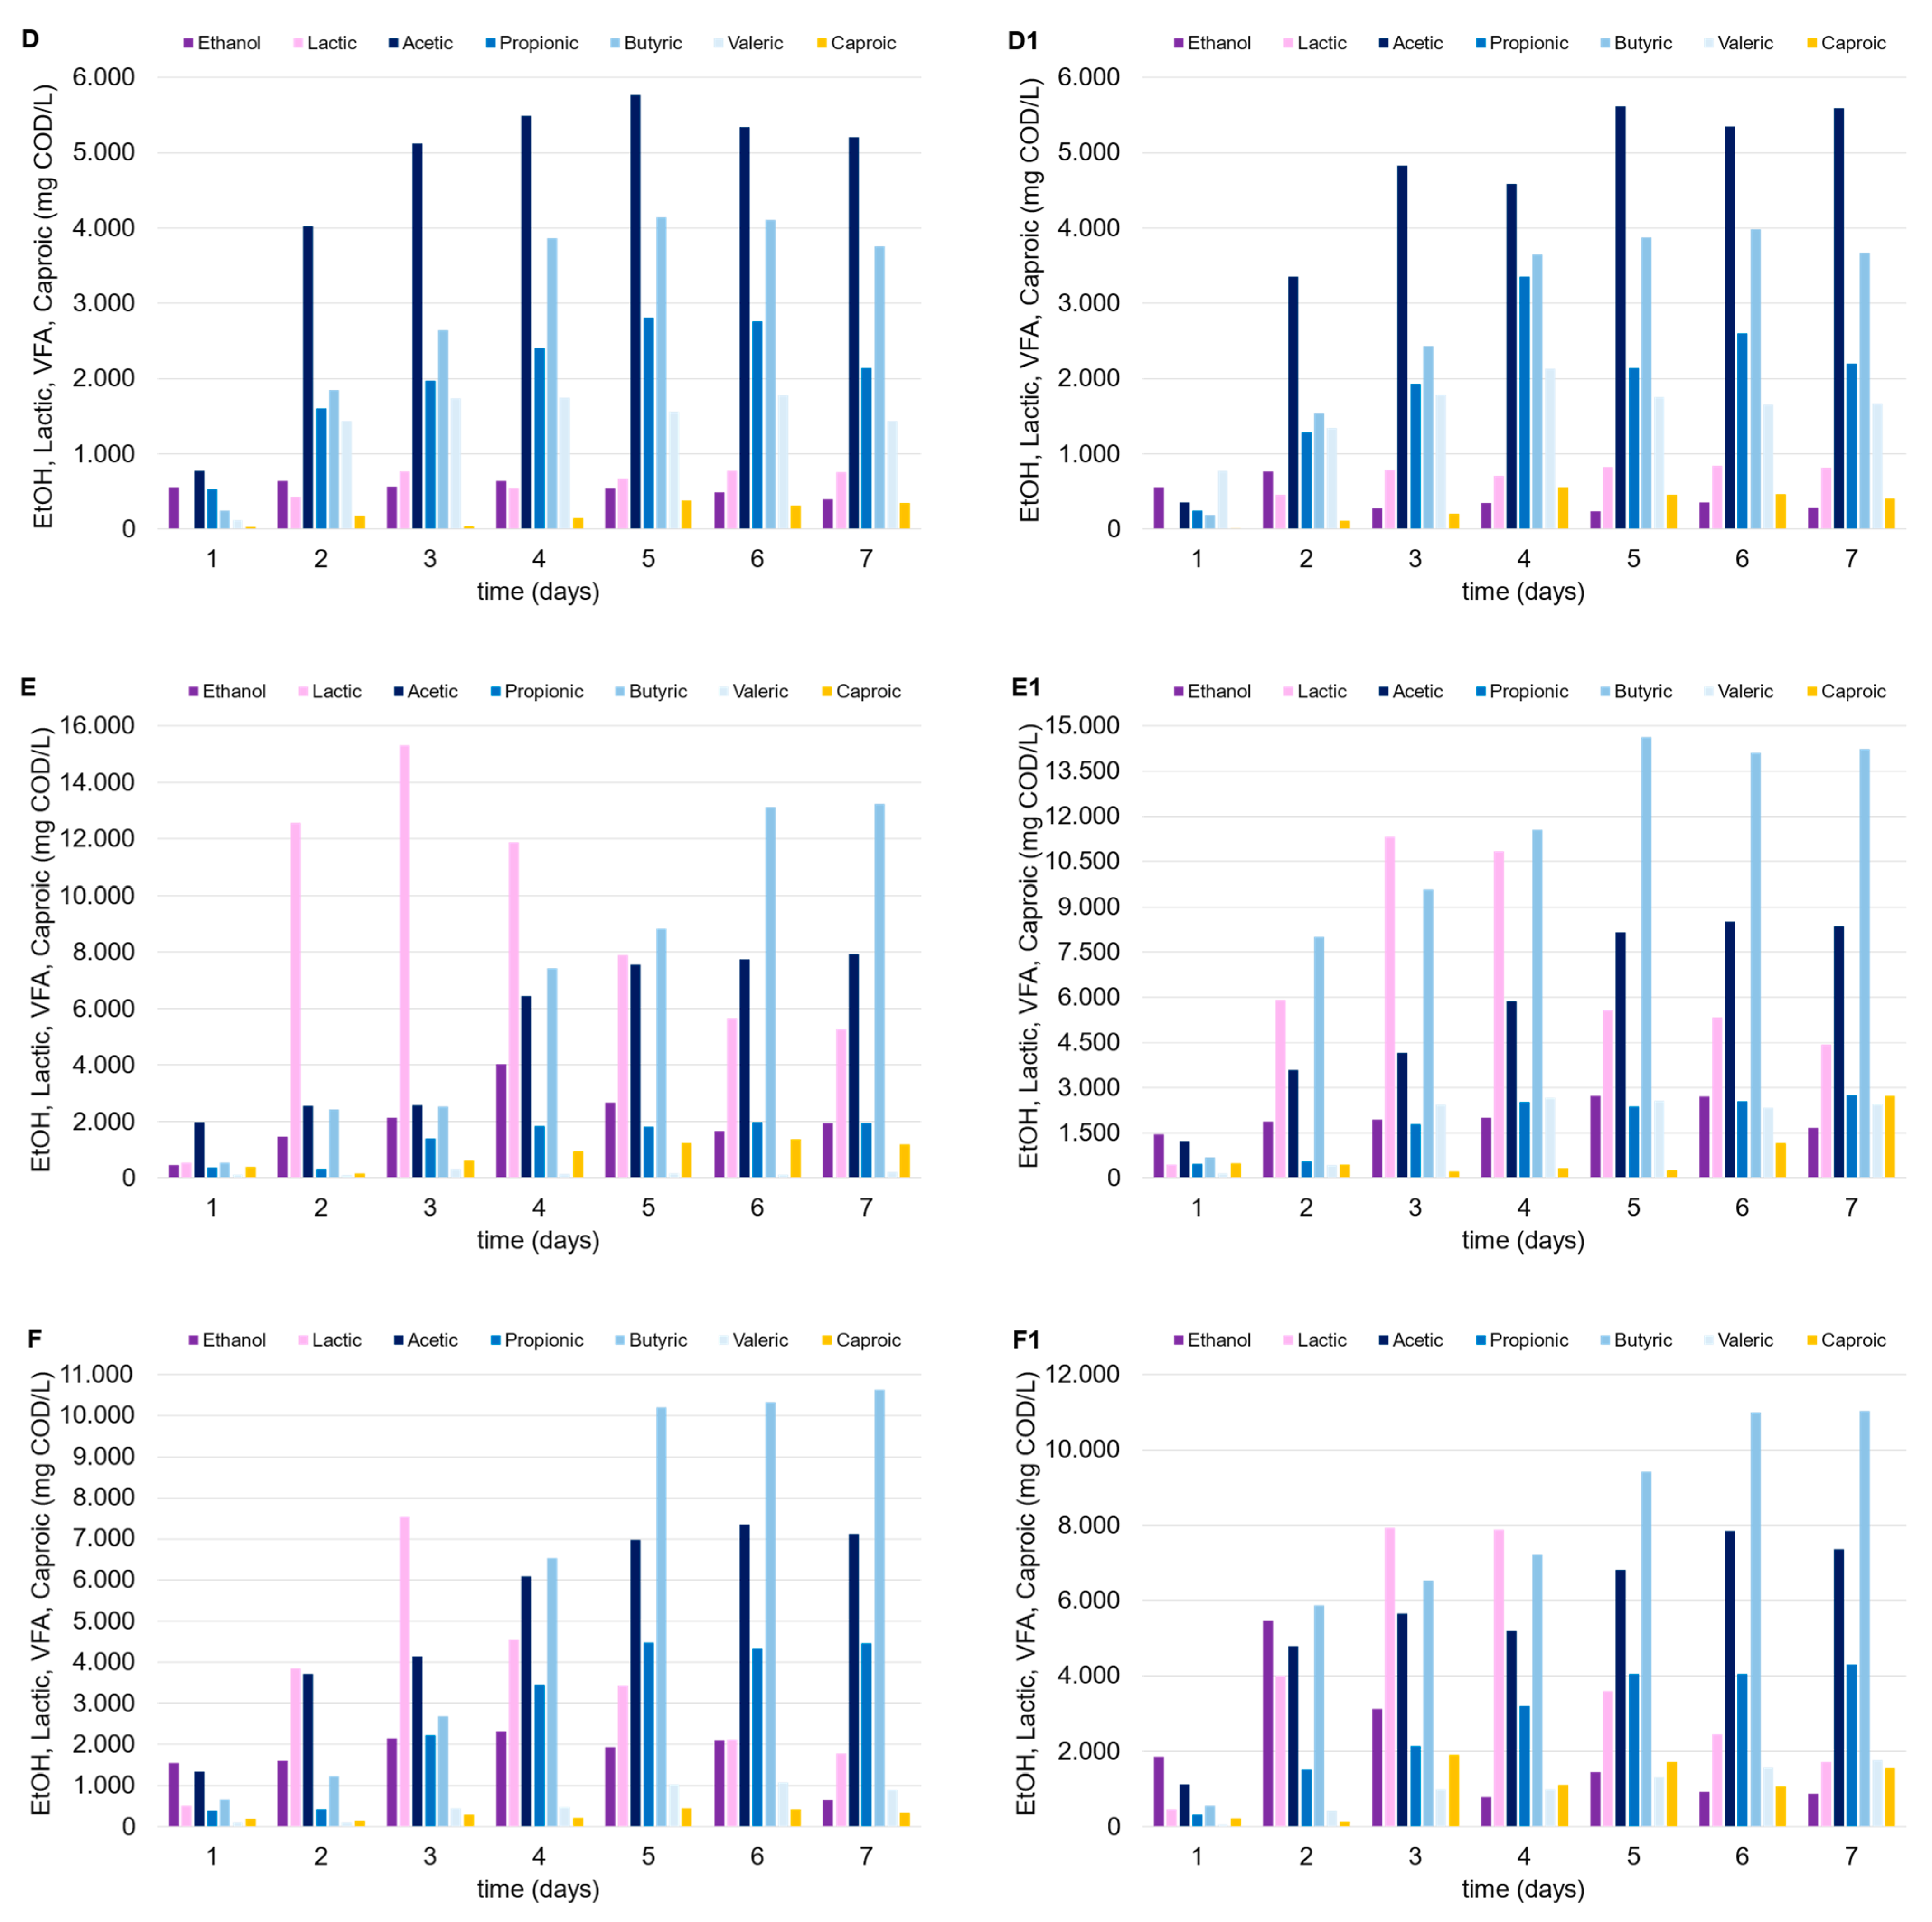
3.2. Fermentation Products in the Mesophilic and Thermophilic DF Tests

The mesophilic tests highlighted the positive impact of the FW as a co-substrate. As depicted in Figure 3, the OA concentration substantially increased when the mixed stream approach was utilized (C and C1), compared to the tests conducted solely with MSS (A and A1). Compared to FW, the lower biodegradability of the MSS and its limited potential for OA production (unless with the adoption of specific pretreatments) are known factors previously discussed [21]. When used as a carbon source, MSS alone led to an average OA concentration between 10 and 13 g COD/L (test A), and this did not particularly improve with the addition of zeolite (A1), probably due to the naturally generated slightly acidic environment. It is also known that zeolite can improve amino acid metabolism, increasing the microbial community diversity if combined with an alkaline environment, especially with a substrate particularly abundant in protein content (like MSS; Li et al. [22]). Concerning the tests with FW alone (B, B1) and with the FW-MSS mixture (C, C1), the acidification performances remarkably improved, as follows: the final OA concentration was in the range of 20–25 g COD/L, with a maximum YOAs of 0.39 g CODOAs/g VS. In these tests, lactic acid was detected at high concentrations in the first days after incubation, probably due to the presence of FW. Considering tests B and B1, lactic acid was quantified up to 12 g COD/L (almost 60% COD/COD of the lactic acid and OAs sum); however, after an initial production, its concentration progressively decreased until the end of the tests to less than 10% COD/COD. Both acetic and butyric acid, which showed an increase from 10% to 40% COD/COD (roughly), replaced lactic acid, starting from the fourth day after inoculum. Previous studies reported that the lactic acid within the DF process can stimulate bio-hydrogen production, since it can be easily converted to butyric and acetic acid in mixed culture systems particularly rich in microbes like Megasphaera, Caproicproducens, Solobacteria, and Clostridium butyricum [23,24]. In addition, Butyribacterium methylotrophicum and Clostridium diolis are also capable of effectively utilizing lactate and acetate, converting them to butyrate, CO2, and hydrogen in a mesophilic environment [23,24].
Additionally, an important aspect of co-fermentation concerns the nutrient ratio of feedstock obtained from mixing substrates with different origins. The nutrient content of individual substrates revealed that the COD/N ratio of MSS (15.6 g COD/g N) was substantially lower than the value of FW (87.9 g COD/g N). Since fermentation products (OAs and H2) are directly derived from primary metabolism, the nutrient ratio has to be adequate for cell growth. Leite et al. [25] highlighted that a COD/N ratio suitable for cell growth should be lower than 60 g COD/g N, which is not close to the COD/N ratio of FW. However, the addition of FW, as depicted in Table 2, allowed for an average COD/N ratio equal to approximately 50 g COD/g N, thereby improving the nutritional quality of the culture broth.
In addition to the improvement in the nutrients’ balance, the utilization of MSS with the FW in the co-fermentation process has been demonstrated to increase the stability performance [26]. The authors discussed the importance of the addition of MSS in increasing mixture alkalinity (which was low in the FW) and, in turn, balancing the acidification process, especially under mesophilic conditions (37 °C), when the acidification mechanisms were characterized by lower specific rates compared to a high-temperature regime.
In general, the zeolite addition improved the acidification, mostly when FW was present in the media, demonstrated by the higher OA level obtained in tests B1 and C1 (25.0 and 24.2 g CODOAs/L, respectively) compared to test B and C (22.3 and 22.7 g CODOAs/L, respectively). The slight improvement was also confirmed by Silva et al. [11], where the zeolite addition increased the VFA production yields in sugar-rich synthetic media.
The thermophilic environment increased the capability of the mixed consortium to convert organic matter into OAs compared to under mesophilic temperature conditions. Despite the higher energy consumption, the thermophilic condition should be always tested since they promote a larger degree of pathogen deactivation, in addition to the increased destruction rates of organics and biogas production yields [27]. Lactic acid was produced in the tests conducted with FW (alone or in mixture with MSS), with similar trends observed in mesophilic trials, and up to 15 g COD/L (Figure 4). In fact, after the third day after inoculum, lactic acid concentration progressively decreased over time in both cases (tests E and F), independently of the presence of zeolite (test E1 and F1), being replaced by a dominant production of acetic and butyric acid. Regarding the use of MSS alone (tests D and D1), a remarkable lactic acid production was not observed, and the maximum OA level achieved was near to 15 g COD/L. The low production of lactic acid through the DF of MSS is widely reported in the literature, and it is explained by the relatively low carbohydrate content in MSS. Jian et al. [28] observed an increase in lactic acid production through the fermentation of MSS by adding carbohydrates to the substrate. This evidence confirms the findings of this study, as lactic acid production was only detected when FW was added to MSS.
The addition of zeolite did not seem to affect OA production, probably due to the following two factors which limited MSS acidification: (a) the feedstock itself is not ideal for the acidification process without an effective pretreatment [29]; (b) the limited effect of zeolite in an acidic environment [22]. As previously indicated, FW presence (alone or as a co-substrate) was pivotal to the increase in OA concentration. Given the same initial vs. level in each test, higher OA concentrations in the thermophilic tests corresponded to higher OA conversion yields (up to 0.48 g CODOAs/g VS). It is also noteworthy that the zeolite addition substantially enhanced OA production when FW was utilized alone (test E1) or in the FW-MSS mixture (test F1), or at least more than what was observed in the mesophilic trials. The thermophilic tests showed that OA concentration increased up to 11% and 30% in tests F1 and E1, respectively, as compared to tests F and E, conducted with no zeolite addition. A sufficiently high OA concentration in fermentation broth is a crucial factor for the further valorization and utilization of the acidified stream, from both a technical and economical point of view [30]. In fact, the downstream processes used to separate and/or concentrate the OAs in the fermentation liquor need to be considered for their marketability. Adsorption and extraction technologies, traditional distillation, or more innovative membrane-based techniques can be less economically effective if a fermented stream is highly concentrated, independently from the wide OA spectrum [31]. In this context, thermophilic bioprocesses supported by zeolite addition enhanced the waste degradation and the utilization of the organic matter from fermentative bacteria, producing an OA-rich stream at 26.0 g CODOAs/L and 30.5 g CODOAs/L in tests F1 and E1, respectively.
The influence of temperature was also analyzed by Fernandez-Domínguez et al. [32] in the MSS-FW fermentation batch assays. In this case, the CODOAs/CODSOL ratio decreased from 0.53 to 0.41 as temperature increased from 20 °C to 70 °C, due to the solubilization and hydrolysis favored by the increase in the temperature. However, similar yields were obtained at 35 °C and 55 °C, as indicated in this study (0.35–0.48 g CODOAs/g VS). Despite the enhancement of hydrolysis at 70 °C, the lowest maximum VFA yield was reached at 70 °C, indicating a remarkable decline in acidification performance.

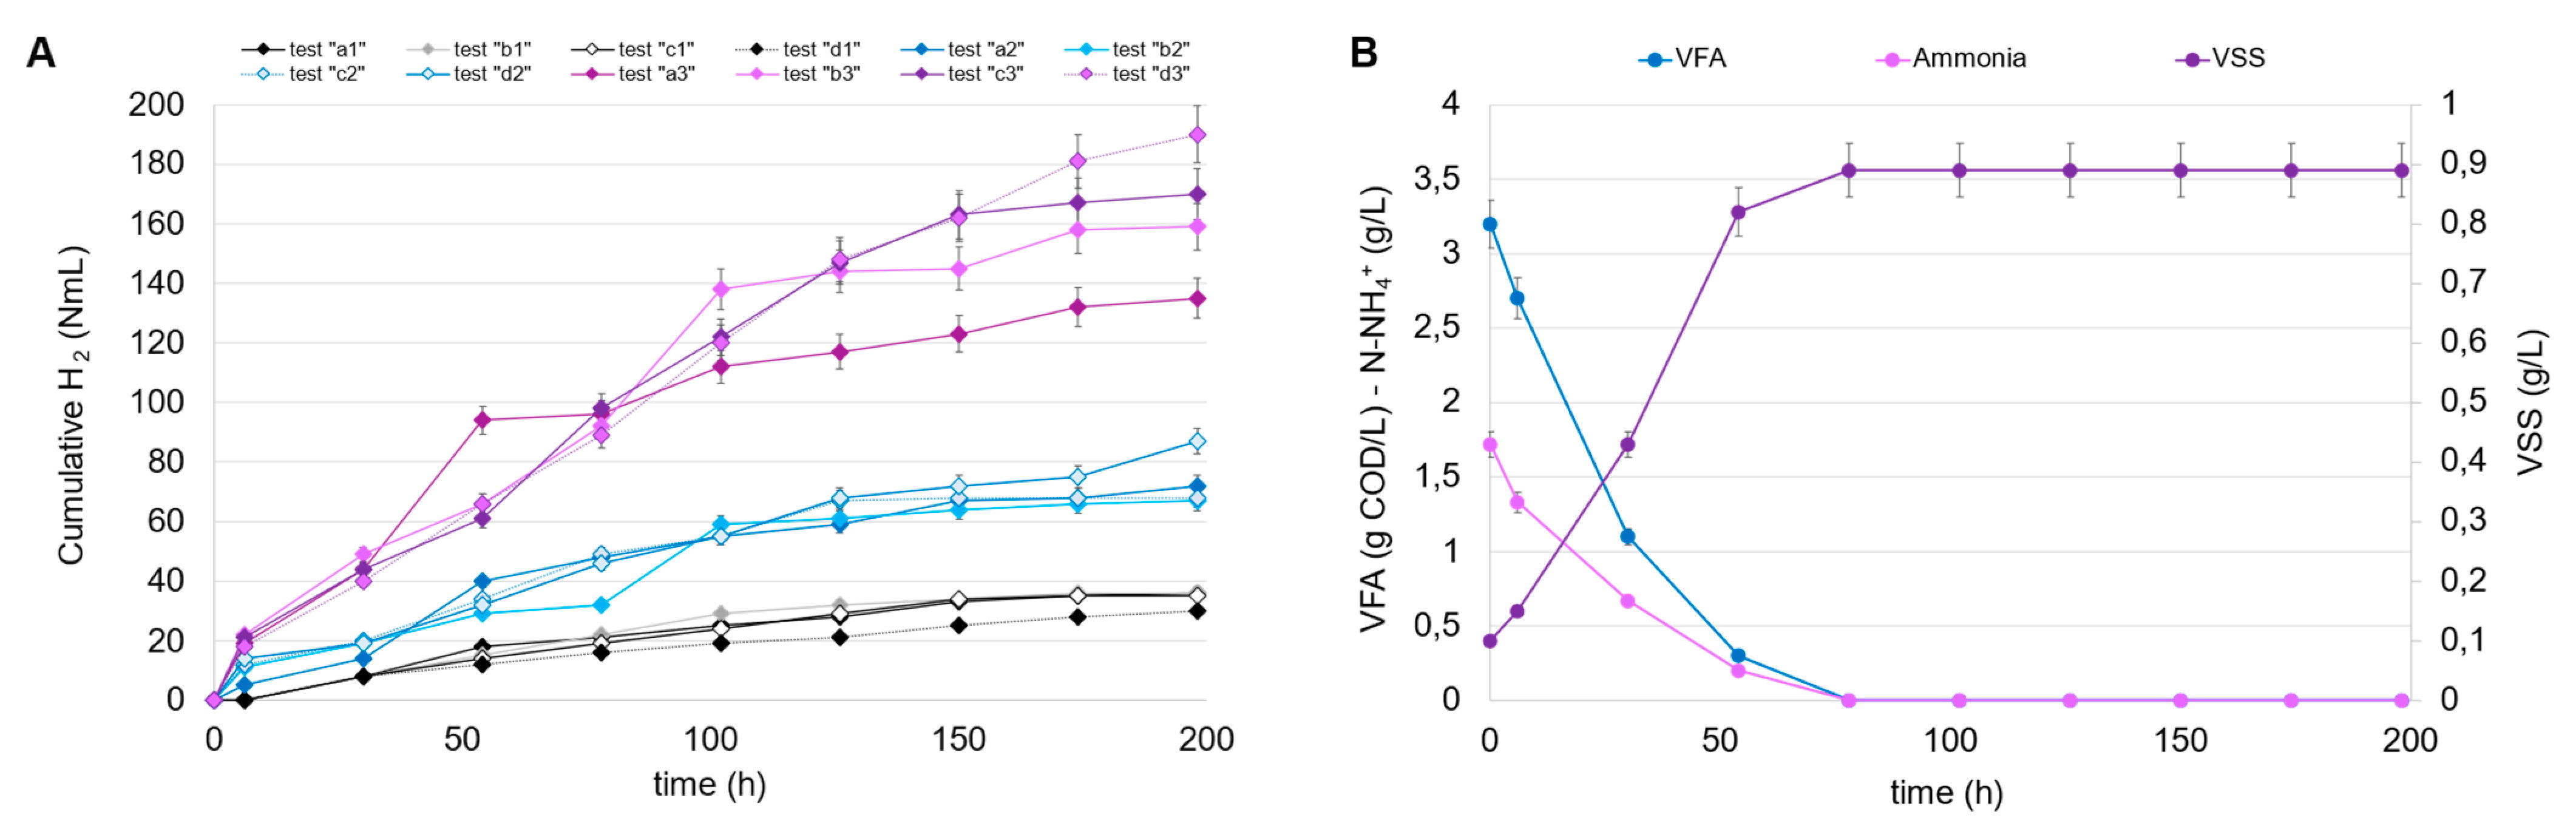
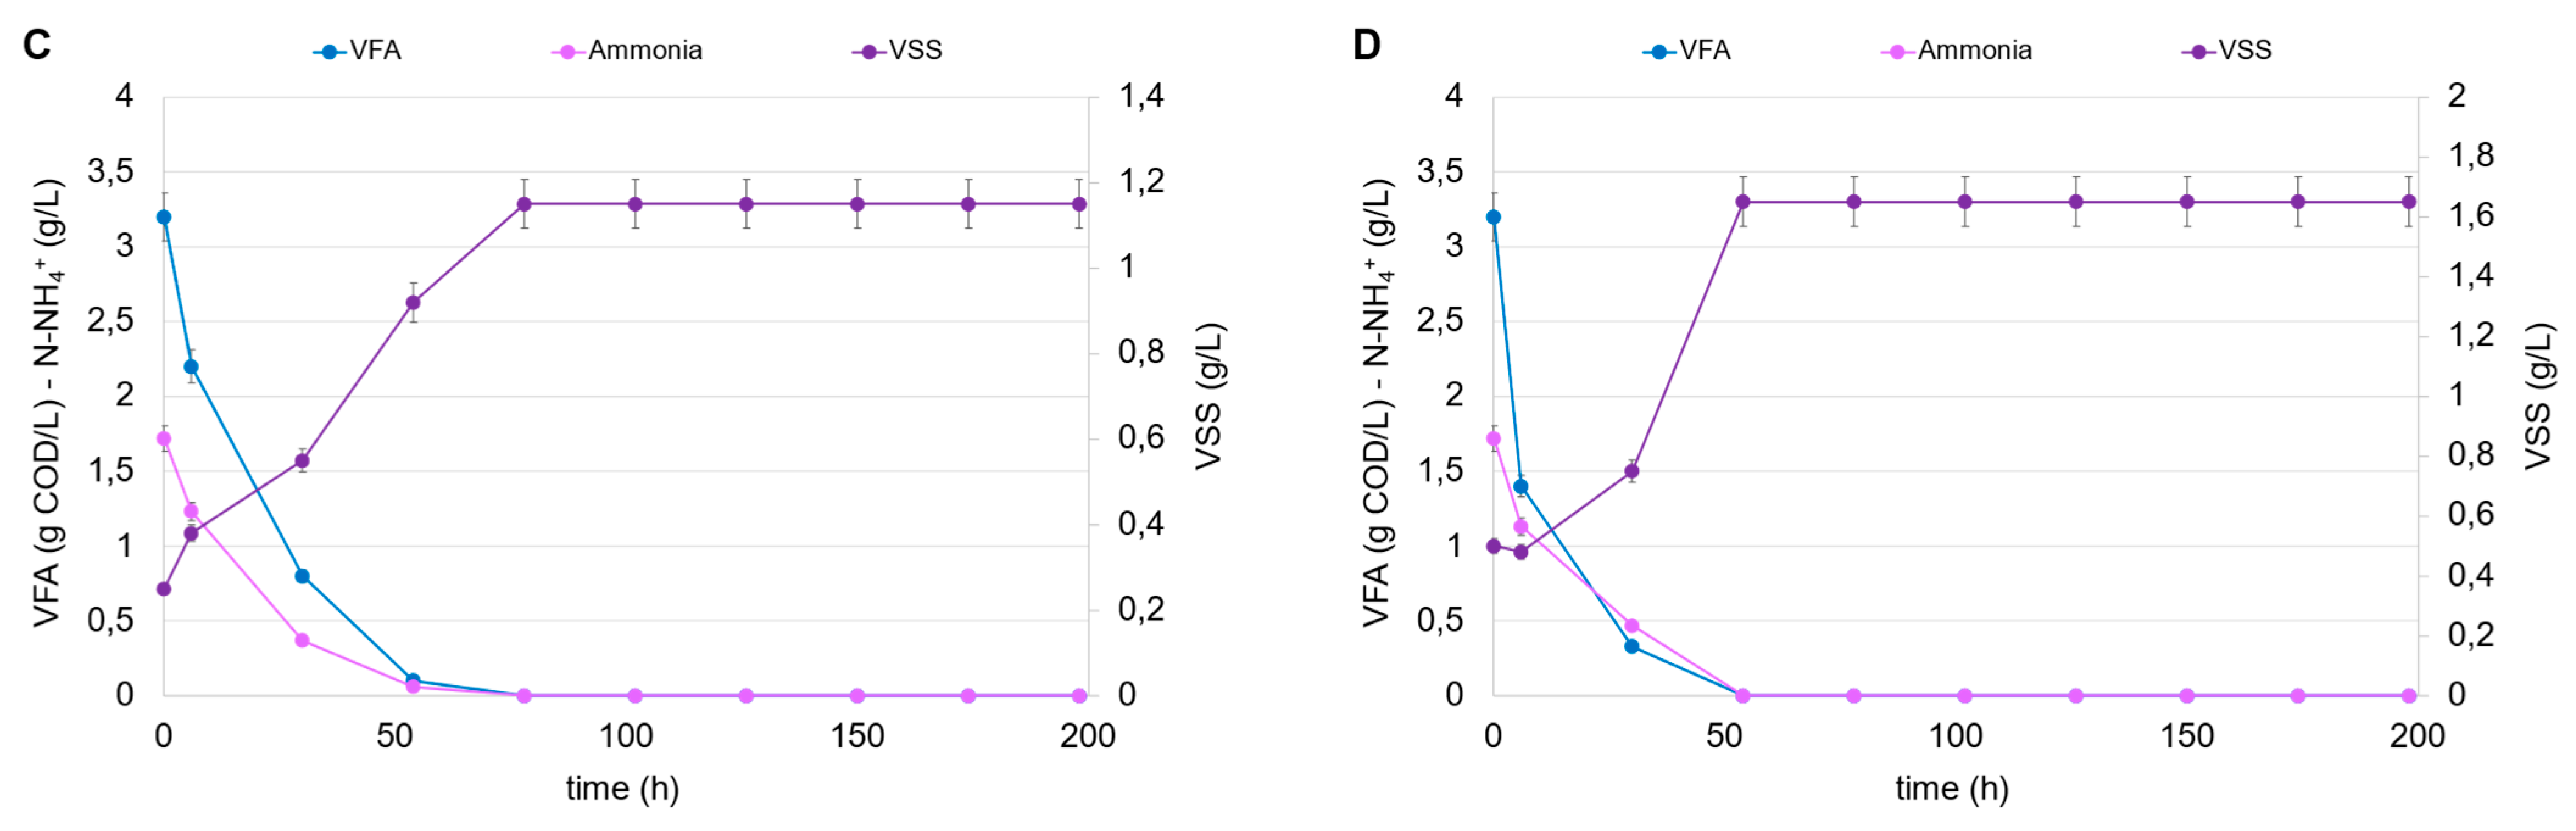
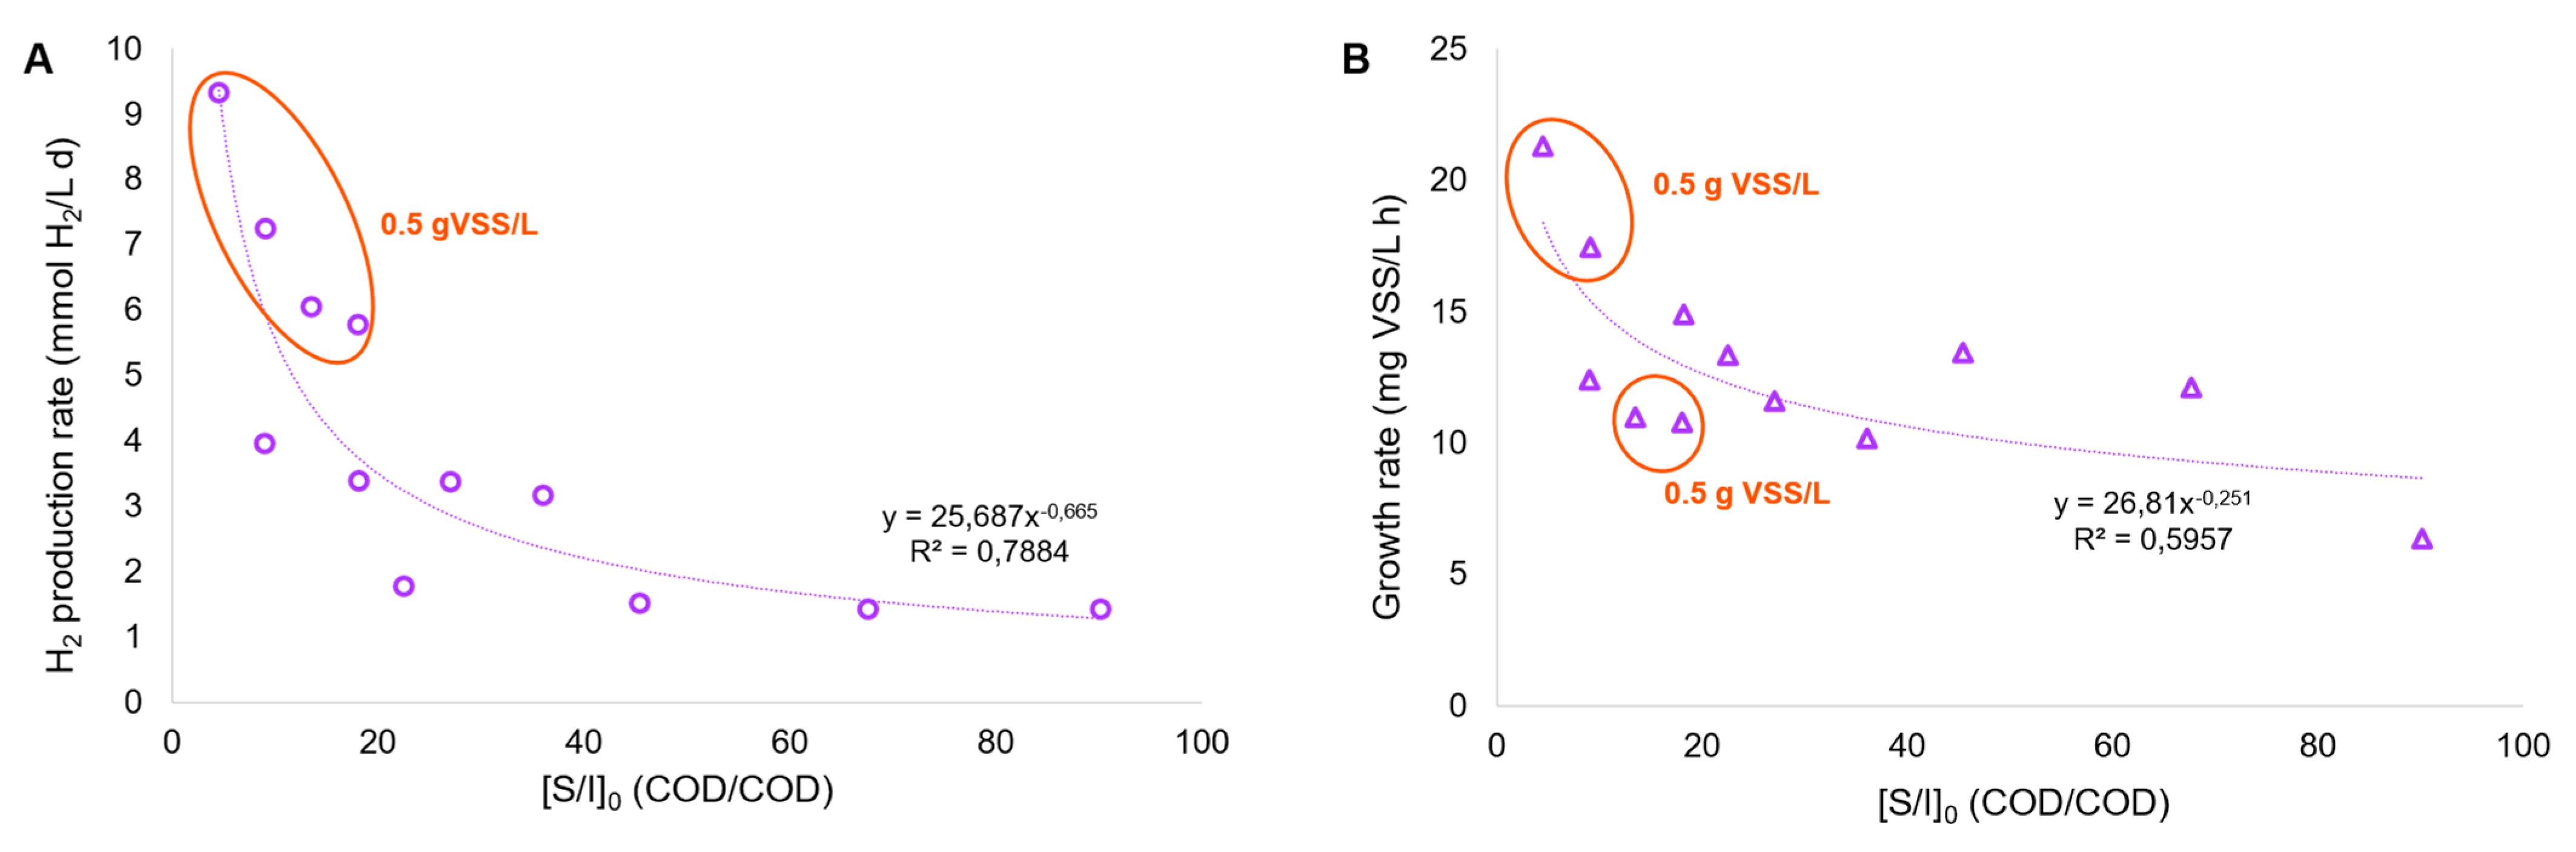
3.3. Hydrogen Production and Kinetics in the Photo-Fermentation Process Driven by R. palustris

The conditions investigated were chosen according to the different degrees of dilution of the fermented stream and, consequently, the different initial concentrations of VFA and N-NH4+. In all tests, the fermentation broths from tests B1 and E1 were chosen as the carbon and nitrogen source (after mixing), given the high VFA level and the highest CODVFA/CODSOL ratio (around 0.70). The cumulative produced hydrogen is shown in Figure 5A for all the PF tests conducted at a different inoculum and VFA concentration. The results can be separated into three clusters, which clearly show the impact of the initial VSS concentration on hydrogen accumulation, as follows: in tests a3, b3, c3, and d3, conducted at the highest inoculum concentration (0.5 g VSS/L), the cumulative hydrogen was at least three times higher compared to tests a1, b1, c1, and d1, carried out at the lowest inoculum concentration (0.1 g VSS/L). In this series, despite the growth of R. palustris observed in all tests conducted, the increase in the initial carbon load (VFA at time zero) was not favorable to the growth’s kinetics. In fact, the highest volumetric VFA consumption rate (1.68 g CODVFA/L d) was observed in accordance with the lowest dosage (initial VFA level of 3.2 g COD/L), where a total consumption of both VFA and ammoniacal nitrogen were observed, together with a growth response which reached a plateau in approximately 80 h, according to the total ammonia consumption (Figure 5B). The increase in VFA dosage caused a partial inhibition of the culture; the added VFAs were only partially consumed in the foreseen 200 h and, in the worst condition (initial VFA level of 12.8 g COD/L; Table 4), only 33% of dosed VFAs were removed from the culture media. In accordance with the observed trends of VSS growth and VFA consumption, the hydrogen production rate also exhibited the highest value (1.79 mmol H2/L d) at the lowest VFA dosage. As the VFA dosage increased, the hydrogen production rate progressively decreased, confirming the substrate inhibition phenomena probably caused by the substrate shift (R. palustris was not acclimated to the FW-MSS fermentation broth) or to the presence of undetected compounds (other than VFAs) in the media. It has been demonstrated that polychlorinated biphenyl (PCB), polycyclic aromatic hydrocarbons (PAHs), and some heavy metals (As, Cd, Fe, Hg, Ni, Pb, and Zn) can be contained in FW-MSS fermentation broth [33,34,35], even though their inhibition potential has not been demonstrated. Parallel experiments were dedicated to investigating the response of R. palustris at higher inoculum concentrations, i.e., 0.25 and 0.50 g VSS/L. These values are considered technically suitable for permitting an efficient use of IR light, thus supporting metabolism expression [36]. Figure 5C shows the trends of VFAs, ammoniacal nitrogen, and VSSs in the PF tests conducted with an initial VSS concentration of 0.25 g/L and, for simplicity’s sake, only the highest degree of dilution of fermentation broth. Also, in this case, the high VFA dilution favored hydrogen production, the maximum rate of which was equal to 3.97 mmol H2/L d, increased by 120% compared to the previously conducted condition with a lower inoculum concentration (0.1 g VSS/L). Similarly, the trends of the same variables in a parallel experiment starting from an inoculum concentration of 0.5 g VSS/L are reported (Figure 5D). Also, in this case, the hydrogen production was higher at the highest dilution, if compared to the other experiments conducted at the same inoculum concentration. It has to be highlighted that this represents the most favorable condition in terms of hydrogen production potential since the related volumetric rate was equal to 9.33 mmol H2/L d, the highest value obtained among all the tests conducted at different VFA dilution degrees and at different initial inoculum concentrations.
Table 4 reports the data relating to the main operating parameters and performances of all PF batch tests as follows: growth rate (RR.p.), VFA consumption rate (RVFA), hydrogen production rate, and yield (RH2 and YH2 respectively). The trend relating to the production yield (YH2), calculated based on the VFAs actually consumed, showed the highest values in the tests conducted at the highest inoculum concentration (0.5 g VSS/L), having a range of 1.7–2.9 × 10⁻² NL H2/g CODVFA, particularly in the “a3” test conducted with a greater VFA dilution degree. Such a condition therefore appeared more suitable for hydrogen production than the FW-MSS fermentation liquor, as it allowed us to minimize the possible inhibitory effects of the substrate itself.
The comparison with data from the literature revealed the promising outcomes derived from this study. Regarding the hydrogen production rate, the values obtained in the tests “a3” and “b3” were approximately 4-fold higher than the values obtained with synthetic carbon (malic, butyric, and acetic acids) and nitrogen sources (NH4Cl, Na-glutamate, and N2 gas) [37,38], even though the authors tested the hydrogen production potential with mixed purple phototrophic bacteria (PPB). The initial VSS concentration was also unclear (1% v/v inoculum) and difficult to compare with this study. A more recent study investigated the photo-fermentative hydrogen production by Rhodopseudomonas palustris CGA009 in the presence of inhibitory compounds, usually present in the lignocellulosic steam explosion hydrolysate [39]. The authors reported a hydrogen production in the same order of magnitude compared to this study, even though it was three times higher than the values observed in the “a3-b3-c3-d3” set, according to the quantified cumulative hydrogen (in the range 600–900 mL). However, it has to be highlighted that Mabutyana and Pott [39] utilized more energy demanding conditions in terms of temperature and light intensity compared to this study; in fact, the culture was maintained at 35 °C and illuminated by tungsten light bulbs at an average of 200 ± 5 W/m2.

4. Discussion

The approach developed in this study supports the hypothesis of the possible implementation of the DF-PF process from a FW-MSS mixture to increase overall hydrogen production compared to the DF stage alone. As the first consideration, the use of the zeolite was specifically shown to boost the capacity of hydrogen accumulation, and according to the detected hydrogen, tests E1 and F1 exhibited a maximum specific hydrogen production (SHP) in the range 0.034–0.039 Nm3 H2/Kg VS. It is important to note that such values were generated in batch systems and were perfectly comparable with results previously obtained with thermally pretreated feedstock in a continuous mode (0.024–0.046 Nm3 H2/Kg VS) [3], which is technically more suitable for stable performance.
In addition, the upgrade of PF has been demonstrated to be effective in terms of hydrogen production yield. When considering cumulative hydrogen production and the working volume of both DF and PF systems, the PF process has the potential to increase the hydrogen yield up to 35% (roughly), compared to the SHP quantified in the DF tests. This outcome is technically valuable and needs to be confirmed in a continuous DF-PF bioprocess. It is also crucial to set the fermentation broth dilution factor (approximately 10 times in this work) to allow for the greater assimilation of the substrate (concomitant with the use of IR light); hence, future experiments need to be conducted to check whether VFA dilutions may result in an excessive increase in HRT in a continuous photobioreactor, which can, in turn, increase the operating costs compromising the benefit of the dual DF-PF stages in terms of cumulative hydrogen production. Considering all the PF tests conducted, it was clear that both the volumetric hydrogen production and growth rate of R. palustris were affected by the initial substrate-to-inoculum ratio ([S/I]0); more specifically, a low [S/I] ratio or a high dilution factor of fermentation broth was favorable for both parameters (Figure 6).
Moreover, the PF tests with the highest hydrogen production rate, and in two cases out of four where the highest growth rate was observed, corresponded to the highest initial inoculum concentration, which increased up to 0.9–1.6 g VSS/L as a function of the carbon load. As a consequence, some parameters like the organic loading rate (OLR) and sludge retention time (SRT) need to be adjusted in the following continuous tests to maintain the solid level around the values indicated above. As an example, avoiding an excessively low OLR could be a successful strategy enabling the good treatment capacity of the fermented feedstock and, presumably, maximizing hydrogen production, as depicted in the schematic model of Allegue et al. [40], where the carbon storage in different types of biopolymers and the consequent electron allocation between polyhydroxyalkanoates (PHA), glycogen, extracellular polymers (EPS), and hydrogen related to the increase in organic load stress has been described using a mixed PPB. In particular, the OLR increase in the photobioreactor (fed with FW alone, after steam explosion and fermentation) led to the destabilization of the culture in terms of PHA synthesis, even though an increase in glycogen accumulation and hydrogen production was detected. At the same time, an excessively high OLR could compromise stability in hydrogen production; hence, more efforts should be dedicated to clarifying this aspect with the mixed FW-MSS stream.

5. Conclusions

MSS and FW are abundant waste streams that are available and renewable in an urban scenario. Their potential in terms of hydrogen recovery has been investigated in batch tests and with different technologies (DF and PF), the utilization of which in a coupled system has been effectively set up.
Considering the first DF step, the addition of natural zeolite (in the form of chabazite) in fermentation broths improved the rates of bio-H2 production when the feedstock was utilized separately or in mixture, under both a mesophilic and thermophilic environment. The zeolite’s effects need to be further evaluated in continuous mode to investigate the interaction of bacteria with its porous structure and possible links between the microbial communities and the fermentation products. In fact, the DF tests revealed that the production of other fermentative end-products, rather than acetic and/or butyric acid (e.g., lactic and/or propionic acid), by the MMC led to lower H2 production activity, as primarily observed when MSS was used as the only carbon source. On the other hand, FW and MSS-FW mixtures were more suited for maximizing the H2-related performances, that is, the production rate and SHP in the range 24.9–27.3 mmol H2/(L d) and 0.034–0.039 Nm3 H2/Kg VS, respectively.
The following FP step contributed to further increasing hydrogen yield by roughly 35%, according to the capacity of Rhodopseudomonas palustris to consume the fermentation products from an urban waste mixture, producing H2 with a rate up to 9.33 mmol H2/(L d), under a high VFA dilution and inoculum concentration (initial S/I ratio < 10 COD/COD) and permanent IR lighting. Further investigations are necessary to evaluate which parameters affect H2 productivity in a continuous system (OLR and IR intensity among others) to better quantify the potentiality of double-stage anaerobic treatment for urban waste mixture valorization.

Author Contributions

Conceptualization, M.G., F.B. and F.V.; methodology, M.G. and F.V.; software, M.G.; validation, M.G., F.B. and F.V.; formal analysis, N.K. and M.G.; investigation, M.G.; resources, R.L., P.P. and F.V.; data curation, N.K., M.G. and F.B.; writing—original draft preparation, M.G.; writing—review and editing, M.G., F.B., R.L. and F.V.; visualization, P.P. and D.B.; supervision, M.G. and F.V; project administration, F.V.; funding acquisition, F.V. All authors have read and agreed to the published version of the manuscript.

Funding

This research was funded by the Italian National Institute for Insurance against Accidents at Work (Istituto Nazionale per l’Assicurazione contro gli Infortuni sul Lavoro, INAIL) within the framework of the national Call BRiC 2022, Piano Attività di Ricerca 2022/2024, (ID64); CUP number H73C22001670005.

Data Availability Statement

The raw data supporting the conclusions of this article can be made available by the authors upon request.

Acknowledgments

This work took place within the framework of the Department of Excellence 2023–2027 (Ministero dell’Università e della Ricerca, AIS.DIP.ECCELLENZA2023_27.FF project).

Conflicts of Interest

The authors declare no conflicts of interest.

Abbreviations

The following abbreviations are used in this manuscript:
ADAnaerobic Digestion
DFDark Fermentation
EPSExtracellular Polymers
EUEuropean Union
HRTHydraulic Retention Time
IRInfra-Red
OLROrganic Loading Rate
PHAPolyhydroxyalkanoates
PNSBPurple Nonsulfur Bacteria
PPBPurple Phototrophic Bacteria
SRTSludge Retention Time
S/ISubstrate-to-Inoculum ratio
VFAVolatile Fatty Acid
VSSVolatile Suspended Solid
WWTPWastewater Treatment Plant

References

  1. European Commission. Closing the Loop—An EU Action Plan for Te Circular Economy. 2015. Available online: http://eur-lex.europa.eu/legal-content/EN/TXT/?uri=CELEX:52015DC0614 (accessed on 7 January 2025).
  2. Zabaniotou, A.; Kamaterou, P. Food waste valorization advocating circular bioeconomy—A critical review of potentialities and perspectives of spent coffee grounds biorefinery. J. Clean. Prod. 2019, 211, 1553–1566. [Google Scholar] [CrossRef]
  3. Gottardo, M.; Dosta, J.; Cavinato, C.; Crognale, S.; Tonanzi, B.; Rossetti, S.; Bolzonella, D.; Pavan, P.; Valentino, F. Boosting butyrate and hydrogen production in acidogenic fermentation of food waste and sewage sludge mixture: A pilot scale demonstration. J. Clean. Prod. 2023, 404, 136919. [Google Scholar] [CrossRef]
  4. Available online: https://observatory.clean-hydrogen.europa.eu/eu-policy/eu-hydrogen-strategy-under-eu-green-deal (accessed on 25 February 2025).
  5. Johnravindar, D.; Wong, J.W.C.; Chakraborty, D.; Bodedla, G.; Kaur, G. Food waste and sewage sludge co-digestion amended with different biochars: VFA kinetics, methane yield and digestate quality assessment. J. Environ. Manag. 2021, 290, 112457. [Google Scholar] [CrossRef] [PubMed]
  6. Tena, M.; Perez, M.; Solera, R. Effect of hydraulic retention time on hydrogen production from sewage sludge and wine vinasse in a thermophilic acidogenic CSTR: A promising approach for hydrogen production within the biorefinery concept. Int. J. Hydrogen Energy 2021, 46, 7810–7820. [Google Scholar] [CrossRef]
  7. Hossain, S.; Wasima, F.; Shawon, S.I.K.; Das, B.K.; Das, P.; Paul, S. Hydrogen from food waste: Energy potential, economic feasibility, and environmental impact for sustainable valorization. Energy Rep. 2024, 11, 3367–3382. [Google Scholar] [CrossRef]
  8. Khan, U.; Bilal, M.; Adil, H.M.; Darlington, N.; Khan, A.; Khan, N.; Ihsanullah, I. Hydrogen from sewage sludge: Production methods, influencing factors, challenges, and prospects. Sci. Total Environ. 2024, 919, 170696. [Google Scholar] [CrossRef]
  9. Vidal-Antich, C.; Perez-Esteban, N.; Astals, S.; Peces, M.; Mata-Alvarez, J.; Dosta, J. Assessing the potential of waste activated sludge and food waste co-fermentation for carboxylic acids production. Sci. Total Environ. 2021, 757, 143763. [Google Scholar] [CrossRef]
  10. Wang, X.; Zhang, L.; Xi, B.; Sun, W.; Xia, X.; Zhu, C.; He, X.; Li, M.; Yang, T.; Wang, P.; et al. Biogas production improvement and C/N control by natural clinoptilolite addition into anaerobic co-digestion of Phragmites australis, feces and kitchen waste. Bioresour. Technol. 2015, 180, 192–199. [Google Scholar] [CrossRef]
  11. Silva, R.M.; Abreu, A.A.; Salvador, A.F.; Alves, M.M.; Neves, I.C.; Pereira, M.A. Zeolite addition to improve biohydrogen production from dark fermentation of C5/C6-sugars and Sargassum sp. biomass. Sci. Rep. 2021, 11, 16350. [Google Scholar] [CrossRef]
  12. Dinesh, G.K.; Chauhan, R.; Chakma, S. Influence and strategies for enhanced biohydrogen production from food waste. Renew. Sustain. Energy Rev. 2018, 92, 807–822. [Google Scholar] [CrossRef]
  13. Rezania, S.; Din, M.F.M.; Taib, S.M.; Sohaili, J.; Chelliapan, S.; Kamyab, H.; Saha, B.B. Review on fermentative biohydrogen production from water hyacinth, wheat straw and rice straw with focus on recent perspectives. Int. J. Hydrogen Energy 2017, 42, 20955–20969. [Google Scholar] [CrossRef]
  14. Zhang, Q.; Wang, Y.; Zhang, Z.; Lee, D.J.; Zhou, X.; Jing, Y.; Ge, X.; Jiang, D.; Hu, J.; He, C. Photo-fermentative hydrogen production from crop residue: A mini review. Bioresour. Technol. 2017, 229, 222–230. [Google Scholar] [CrossRef] [PubMed]
  15. Androga, D.D.; Özgür, E.; Eroglu, I.; Gündüz, U.; Yücel, M. Amelioration of photofermentative hydrogen production from molasses dark fermenter effluent by zeolite-based removal of ammonium ion. Int. J. Hydrogen Energy 2012, 37, 16421–16429. [Google Scholar] [CrossRef]
  16. Tuci, G.A.; Valentino, F.; Pavan, P.; Gottardo, M. Tannery sludge valorization through zeolite-assisted anaerobic process for short-chain fatty acids (SCFAs) production. Environ. Res. 2024, 246, 118046. [Google Scholar] [CrossRef]
  17. APHA, AWWA, WEF, 1998; Standard Methods for the Examinations of Water and Wastewater, 20th ed. American Public Health Association: Washington, WA, USA, 1998.
  18. Megazyme. L-Lactic Acid Assay Procedure (L-LACTATE). 2018. Available online: https://prod-docs.megazyme.com/documents/Assay_Protocol/K-LATE_DATA.pdf (accessed on 23 January 2025).
  19. Sivagurunathan, P.; Sen, B.; Lin, C.Y. Batch fermentative hydrogen production by enriched mixed culture: Combination strategy and their microbial composition. J. Biosci. Bioeng. 2014, 117, 222–228. [Google Scholar] [CrossRef]
  20. Mansouri, E.; Sayadi, M.H.; Fahoul, N. Bio-hydrogen production using modified zeolite decorated with green iron oxide nanoparticles during the fermentation process from food industry wastewater. J. Water Environ. Nanotechnol. 2024, 9, 385–397. [Google Scholar] [CrossRef]
  21. Moretto, G.; Valentino, F.; Pavan, P.; Majone, M.; Bolzonella, D. Optimization of urban waste fermentation for volatile fatty acids production. Waste Manag. 2019, 92, 21–29. [Google Scholar] [CrossRef]
  22. Li, Z.; Huang, X.; Dong, W.; Wang, H.; Liu, B. Simultaneous nitrogen and phosphorus control from alkali and zeolite sludge fermentation process: Mechanism and application. J. Environ. Chem. Eng. 2023, 11, 111324. [Google Scholar] [CrossRef]
  23. Bella, K.; Rao, P.V. Anaerobic co-digestion of cheese whey and septage: Effect of substrate and inoculum on biogas production. J. Environ. Manag. 2022, 308, 114581. [Google Scholar] [CrossRef]
  24. Detman, A.; Mielecki, D.; Chojnacka, A.; Salamon, A.; Błaszczyk, M.K.; Sikora, A. Cell factories converting lactate and acetate to butyrate: Clostridium butyricum and microbial communities from dark fermentation bioreactors. Microb. Cell Factories 2019, 18, 36. [Google Scholar] [CrossRef]
  25. Leite, W.R.M.; Gottardo, M.; Pavan, P.; Filho, P.B.; Bolzonella, D. Performance and energy aspects of single and two phase thermophilic anaerobic digestion of waste activated sludge. Renew. Energy 2016, 86, 1324–1331. [Google Scholar] [CrossRef]
  26. Battista, F.; Strazzera, G.; Valentino, F.; Gottardo, M.; Villano, M.; Matos, M.; Silva, F.; Reis, M.M.; Mata-Alvarez, J.; Astals, S.; et al. New insights in food waste, sewage sludge and green waste anaerobic fermentation for short-chain volatile fatty acids production: A review. J. Environ. Chem. Eng. 2022, 10, 108319. [Google Scholar] [CrossRef]
  27. Yang, Y.; Bu, J.; Tiong, Y.W.; Xu, S.; Zhang, J.; He, Y.; Zhu, M.; Tong, Y.W. Enhanced thermophilic dark fermentation of hydrogen production from food waste by Fe-modified biochar. Environ. Res. 2024, 244, 117946. [Google Scholar] [CrossRef] [PubMed]
  28. Jian, Q.; Li, X.; Chen, Y.; Liu, Y.; Pan, Y. Production of high optical purity l-lactic acid from waste activated sludge by supplementing carbohydrate: Effect of temperature and pretreatment time. Environ. Technol. 2016, 37, 2457–2466. [Google Scholar] [CrossRef]
  29. Gottardo, M.; Crognale, S.; Tonanzi, B.; Rossetti, S.; D’Annibale, L.; Dosta, J.; Valentino, F. Volatile fatty acid production from hydrolyzed sewage sludge: Effect of hydraulic retention time and insight into thermophilic microbial community. Biomass Conv. Biorefin. 2024, 14, 14921–14932. [Google Scholar] [CrossRef]
  30. Atasoy, M.; Owusu-Agyeman, I.; Plaza, E.; Cetecioglu, Z. Bio-based volatile fatty acid production and recovery from waste streams: Current status and future challenges. Bioresour. Technol. 2018, 268, 773–786. [Google Scholar] [CrossRef]
  31. Aktij, S.A.; Zirehpour, A.; Mollahosseini, A.; Taherzadeh, M.J.; Tiraferri, A.; Rahimpour, A. Feasibility of membrane processes for the recovery and purification of bio-based volatile fatty acids: A comprehensive review. J. Ind. Eng. Chem. 2020, 81, 24–40. [Google Scholar] [CrossRef]
  32. Fernandez-Dominguez, D.; Astals, S.; Peces, M.; Frison, N.; Bolzonella, D.; Mata-Alvarez, J.; Dosta, J. Volatile fatty acids production from biowaste at mechanical-biological treatment plants: Focusing on fermentation temperature. Bioresour. Technol. 2020, 314, 123729. [Google Scholar] [CrossRef]
  33. Cavaliere, C.; Capriotti, A.L.; Cerrato, A.; Lorini, L.; Montone, M.C.; Valentino, F.; Laganà, A.; Majone, M. Identification and quantification of polycyclic aromatic hydrocarbons in polyhydroxyalkanoates produced from mixed microbial cultures and municipal organic wastes at pilot scale. Molecules 2021, 26, 539. [Google Scholar] [CrossRef]
  34. Astolfi, M.L.; Marconi, E.; Lorini, L.; Valentino, F.; Silva, F.; Sommer Ferreira, B.; Canepari, S.; Majone, M. Elemental concentration and migratability in bioplastics derived from organic waste. Chemosphere 2020, 259, 127472. [Google Scholar] [CrossRef]
  35. Riccardi, C.; Buiarelli, F.; Castellani, F.; Di Filippo, P.; Lorini, L.; Majone, M.; Matos, M.; Pomata, D.; Simonetti, G.; Ferreira, B.S.; et al. Polychlorinated biphenyl profile in polyhydroxyalkanoates synthetized from urban organic wastes. Polymers 2020, 12, 659. [Google Scholar] [CrossRef] [PubMed]
  36. Sepúlveda-Muñoz, C.A.; Torres-Franco, A.; de Godos, I.; Muñoz, R. Exploring the metabolic capabilities of purple phototrophic bacteria during piggery wastewater treatment. J. Water Process. Eng. 2022, 50, 103317. [Google Scholar] [CrossRef]
  37. Vasiliadou, I.A.; Berná, A.; Manchon, C.; Melero, J.A.; Martinez, F.; Esteve-Nuñez, A.; Puyol, D. Biological and bioelectrochemical systems for hydrogen production and carbon fixation using purple phototrophic bacteria. Front. Energy Res. 2018, 6, 107. [Google Scholar] [CrossRef]
  38. Vasiliadou, I.A.; Melero, J.A.; Molina, R.; Puyol, D.; Martinez, F. Optimization of H2 Production through minimization of CO2 emissions by mixed cultures of purple phototrophic bacteria in aqueous samples. Water 2020, 12, 2015. [Google Scholar] [CrossRef]
  39. Mabutyana, L.; Pott, R.W.M. Photo-fermentative hydrogen production by Rhodopseudomonas palustris CGA009 in the presence of inhibitory compounds. Int. J. Hydrogen Energy 2021, 46, 29088–29099. [Google Scholar] [CrossRef]
  40. Allegue, L.D.; Ventura, M.; Melero, J.A.; Puyol, D. Unraveling PHA production from urban organic waste with purple phototrophic bacteria via organic overload. Renew. Sustain. Energy Rev. 2022, 166, 112687. [Google Scholar] [CrossRef]
Figure 1. Overview of the approach applied in this study for the maximization of hydrogen production from DF and PF technologies.
Resources 14 00043 g001
Figure 2. Maximal volumetric hydrogen production in the mesophilic (A, A1, B, B1, C, C1) and thermophilic (D, D1, E, E1, F, F1) DF tests.
Resources 14 00043 g002
Figure 3. Trends of OAs, ethanol, and lactic acid over time in the mesophilic DF tests performed with MSS (A, A1), FW (B, B1) and MSS-FW mixture (C, C1).
Resources 14 00043 g003aResources 14 00043 g003b
Figure 4. Trends of OAs, ethanol, and lactic acid over time in the thermophilic DF tests performed with MSS (D, D1), FW (E, E1) and FW-MSS mixture (F, F1).
Resources 14 00043 g004
Figure 5. Trends of cumulative H2 production in the PF tests (A); trends of VFAs, ammonia, and VSSs in the PF tests “a1” (0.1 g VSS/L) (B), “a2” (0.25 g VSS/L) (C), and “a3” (0.5 g VSS/L) (D), conducted at the highest dilution of fermentation broth.
Resources 14 00043 g005aResources 14 00043 g005b
Figure 6. Trends of the volumetric H2 production rate (A) and growth rate (B) in the PF batch tests.
Resources 14 00043 g006
Table 1. Physical and chemical features of municipal sewage sludge (MSS) and food waste (FW).
ParameterMSSFW
TS (g/L)27.6 ± 0.448 ± 2
VS (g/L)22.3 ± 0.243 ± 1
CODSOL (g/L)0.29 ± 0.0116.6 ± 0.7
CODVFA (g/L)-4.0 ± 0.5
pH7.0 ± 0.54.7 ± 0.2
Ammonia (g N-NH4+/L)0.48 ± 0.040.11 ± 0.02
Phosphate (g P-PO43−/L)0.08 ± 0.010.01 ± 0.01
TKN (g N/kg TS)35 ± 213 ± 2
P (g P/kg TS)3.6 ± 0.70.5 ± 0.1
Table 2. Summary of the DF tests and the related operating conditions.
Operating ConditionsDark Fermentation Batch Tests
AA1BB1CC1DD1EE1FF1
Temperature (°C)373737373737555555555555
Inoculum (g VS/L)808080808080808080808080
MSS Content (%, v/v)100100003535100100003535
FW Content (%, v/v)001001006565001001006565
Zeolite (g/g TS)00.200.200.200.200.200.2
Table 3. Summary of the results from DF tests.
ParametersDark Fermentation Batch Tests
AA1BB1CC1DD1EE1FF1
VFA *
(g COD/L)
11.6 ± 0.4 12.9 ± 0.222.4 ± 0.125.0 ± 0.422.8 ± 0.124 ± 114.7 ± 0.814.1 ± 0.723.6 ± 0.330.5 ± 0.523.5 ± 0.926.0 ± 0.6
Caproic acid *
(g COD/L)
0.4 ± 0.10.11 ± 0.020.4 ± 0.10.5 ± 0.10.8 ± 0.10.3 ± 0.10.34 ± 0.090.41 ± 0.091.2 ± 0.62.7 ± 0.80.3 ± 0.11.6 ± 0.1
Ethanol *
(g COD/L)
0.5 ± 0.10.23 ± 0.062.8 ± 0.30.8 ± 0.11.1 ± 0.22.0 ± 0.10.6 ± 0.10.4 ± 0.11.9 ± 0.21.7 ± 0.12.1 ± 0.30.9 ± 0.2
Lactic acid *
(g COD/L)
1.2 ± 0.21.3 ± 0.42.1 ± 0.21.5 ± 0.32.0 ± 0.21.1 ± 0.30.8 ± 0.20.8 ± 0.25.3 ± 0.64.4 ± 0.82.1 ± 0.61.7 ± 0.3
YOAs *
(g CODOAs/VS0)
0.18 ± 0.010.20 ± 0.030.35 ± 0.030.39 ± 0.020.36 ± 0.020.38 ± 0.010.23 ± 0.020.22 ± 0.030.37 ± 0.030.48 ± 0.030.37 ± 0.020.41 ± 0.02
RH2
(mmol H2/L d)
7.4 ± 0.312.1 ± 0.218.5 ± 0.222.2 ± 0.415.2 ± 0.519.6 ± 0.612.0 ± 0.317.0 ± 0.321.1 ± 0.527.3 ± 0.619.7 ± 0.724.9 ± 0.5
H2 content **
(%, v/v)
12 ± 215 ± 229.9 ± 0.933.6 ± 0.616.6 ± 0.722.2 ± 0.813.1 ± 0.518 ± 127.4 ± 0.732.1 ± 0.418.2 ± 0.326.3 ± 0.7
CO2 content **
(%, v/v)
88 ± 285 ± 270.1 ± 0.966.4 ± 0.683.4 ± 0.777.8 ± 0.886.9 ± 0.582 ± 172.6 ± 0.767.9 ± 0.481.8 ± 0.373.7 ± 0.7
* At the maximum OA concentration; ** at the maximum H2 production rate.
Table 4. Performances of R. palustris in the PF batch test (growth, VFA consumption, and H2 production).
PF Batch TestsR. palustrisVFA (t0)N-NH4+ (t0)RR.p.RVFARH2YH2
g VSS/Lg COD/Lg/Lmg VSS/(L h)g COD/(L d)mmol H2/L dNL H2/g CODVFA
Control03.21.72----
a10.13.21.7213.3 ± 0.41.68 ± 0.051.79 ± 0.026.2 × 10−3
b10.16.453.1213.4 ± 0.21.58 ± 0.021.52 ± 0.014.8 × 10−3
c10.19.65.112.1 ± 0.10.79 ± 0.011.43 ± 0.035.5 × 10−3
d10.112.86.856.4 ± 0.10.52 ± 0.011.43 ± 0.017.1 × 10−3
a20.253.21.7212.4 ± 0.21.92 ± 0.043.97 ± 0.011.3 × 10−3
b20.256.453.1214.9 ± 0.31.67 ± 0.033.39 ± 0.069.3 × 10−3
c20.259.65.111.6 ± 0.11.11 ± 0.033.37 ± 0.029.0 × 10−3
d20.2512.86.8510.2 ± 0.11.17 ± 0.013.17 ± 0.039.0 × 10−3
a30.53.21.7221.3 ± 0.12.30 ± 0.039.33 ± 0.042.9 × 10−2
b30.56.453.1217.5 ± 0.41.85 ± 0.027.25 ± 0.042.1 × 10−2
c30.59.65.111.0 ± 0.31.16 ± 0.015.82 ± 0.021.9 × 10−2
d30.512.86.8510.8 ± 0.11.43 ± 0.015.28 ± 0.021.7 × 10−2
Disclaimer/Publisher’s Note: The statements, opinions and data contained in all publications are solely those of the individual author(s) and contributor(s) and not of MDPI and/or the editor(s). MDPI and/or the editor(s) disclaim responsibility for any injury to people or property resulting from any ideas, methods, instructions or products referred to in the content.

