Abstract
In the context of the urgent global transition toward sustainable materials, this study presents a comparative environmental life cycle assessment (LCA) of poly(3-hydroxybutyrate) (PHB), a biodegradable, bio-based polymer, against conventional petrochemical plastics (polystyrene—PS; polypropylene—PP) and another popular biopolymer, namely polylactic acid (PLA). The LCA was conducted using primary production data from a laboratory-scale PHB manufacturing process, integrating real-time energy consumption measurements across all production stages. Environmental indicators such as carbon footprint and energy demand were analyzed under cradle-to-gate and end-of-life scenarios. The results indicate that PHB, while offering biodegradability and renewable sourcing, currently exhibits a significantly higher carbon footprint than PP, PS, and PLA, primarily due to its energy-intensive downstream processing. However, the environmental impact of PHB can be markedly reduced—by over 67%—through partial integration of renewable energy. PLA demonstrated the lowest production-phase emissions, while PP showed the most favorable end-of-life outcomes under municipal waste management assumptions. The study highlights the critical influence of energy sourcing, production scale, and waste treatment infrastructure on the sustainability performance of biopolymers. These findings provide practical insights for industry and policymakers aiming to reduce the environmental burden of plastics and support a shift toward circular material systems.
1. Introduction
Amid growing global environmental challenges and the urgent need to reduce reliance on fossil-based materials, biopolymers, whether naturally occurring or biosynthetically produced, have emerged as a promising alternative to traditional plastics. Derived from renewable biological sources, such as plants, microorganisms, or agricultural waste, biopolymers offer biodegradability, biocompatibility, and a reduced carbon footprint. Their application is expanding across industries, including packaging, agriculture, medicine, and textiles, as they meet both ecological and functional requirements (Figure 1) [1]. Among them, poly(3-hydroxybutyrate) (PHB), a member of the polyhydroxyalkanoate (PHA) family, is gaining attention due to its biodegradability, biocompatibility, and potential to be synthesized from renewable feedstocks [2]. Wang at al. [3] indicate that the high crystallinity and notable mechanical strength of PHB should be considered both advantageous and limiting. Authors point out that the material’s crystallinity contributes to its brittleness, reducing impact resistance and flexibility, while its low thermal stability—degrading at temperatures below 190 °C—poses challenges for processing methods such as injection molding and extrusion [3]. To overcome these limitations, recent research has explored blending PHB with plasticizers, other biopolymers, or natural additives to enhance flexibility and processability. Polylactic acid (PLA), on the other hand, is a linear aliphatic polyester derived from renewable resources such as corn starch or sugarcane, known for its transparency, ease of processing, and relatively good mechanical performance. Both PHB and PLA have been the focus of numerous recent studies that investigate their functional properties, composite formulations, and environmental impacts, highlighting their potential as sustainable alternatives to petroleum-based plastics.
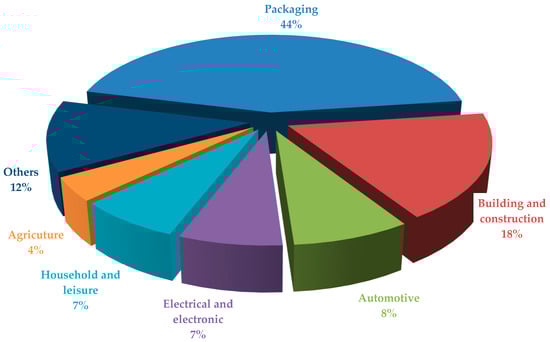
Figure 1.
Application areas of biopolymers across various industries and production sectors.
However, to determine its actual environmental viability, it is essential to conduct a comprehensive environmental impact assessment and benchmark it against traditional petroleum-derived polymers such as polystyrene (PS) and polypropylene (PP). In the study polylactic acid (PLA) was also included, the most widely used and thoroughly studied biopolymer to date. Comparing PLA and PHB with conventional polymers such as PS and PP is ecologically justified, as it allows for a meaningful assessment of environmental benefits, biodegradability, and life cycle impacts when transitioning from fossil-based to bio-based materials.
The production and extensive use of synthetic plastics have resulted in a severe global environmental burden, particularly due to the accumulation of persistent plastic waste in terrestrial and marine ecosystems. PS and PP represent more than 70% of global plastic production and are characterized by high durability and resistance to biodegradation, which leads to long-term environmental persistence [4]. The mismanagement of these plastics contributes to the proliferation of microplastics and nanoplastics, with significant implications for ecological and human health. The biopolymer market has been experiencing significant growth in recent years. In 2022, its value was just over 33 billion USD. Market analysts estimate that by 2033, the volume of biopolymer production and consumption will nearly triple (Figure 2) [5]. This rapid expansion is driven by increasing demand for sustainable materials across various industries, as well as growing environmental awareness and regulatory support worldwide.
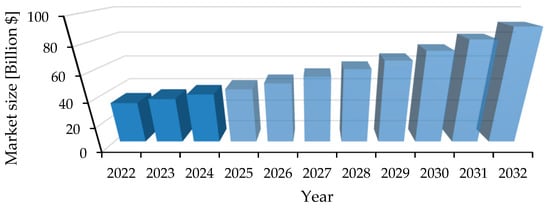
Figure 2.
Global Bioplastics and Biopolymer Market size.
Biopolymers such as PLA and PHB are posited as sustainable alternatives due to their complete biodegradability under controlled and natural conditions, leading to carbon dioxide and water without the release of persistent microplastics.
PLA is typically produced through the polymerization of lactic acid, which is obtained via the fermentation of renewable resources such as corn starch, sugarcane, or cassava. The two main production routes are direct polycondensation of lactic acid and ring-opening polymerization of lactide, with the latter being the most common due to its ability to yield high-molecular-weight PLA with desirable mechanical properties. PHB is produced via microbial fermentation, often using organic waste streams or agricultural by-products as feedstock, which further enhances its sustainability profile. The environmental advantages of PHB are context-dependent and require careful examination through life cycle assessment (LCA) methodologies to quantify emissions, resource use, and other environmental impacts across the production, use, and end-of-life stages [6].
Existing LCA studies present mixed outcomes regarding the environmental superiority of PHB over conventional plastics. Some analyses indicate that PHB production may have a higher environmental burden in terms of energy consumption and greenhouse gas emissions due to the need for sterile conditions, fermentation substrates, and downstream purification. For instance, cradle-to-gate assessments often reveal that PHB can result in higher global warming potential than PE and PP if fossil-derived energy sources are used during production [7]. Senila et al. [8] emphasize that PHB obtained from lignocellulosic waste, although derived from renewable sources, still entails substantial environmental loads associated with pretreatment and recovery processes. On the other hand, advancements in production technologies, such as the utilization of mixed microbial cultures and non-food biomass, have shown promise in reducing the environmental footprint of PHB [9]. Koch et al. [10] demonstrate that transitioning from first-generation feedstocks like corn to third-generation systems based on CO2 can markedly lower impacts related to global warming potential, eutrophication, and land use. Their findings reinforce the conclusion that feedstock choice and process design are decisive in shaping the sustainability profile of PHB. This highlights not only the potential of PHB but also the urgent necessity for targeted technological and systemic innovation to justify its role as a sustainable alternative.
Economic and scalability challenges in PHB production remain significant barriers to its widespread adoption. Traditional plastics benefit from well-established, large-scale industrial processes with highly optimized supply chains, whereas PHB production is still emerging and subject to higher unit costs. Lopez-Arenas et al. [11] demonstrate that fermentation strategy and process configuration strongly influence production economics, but even under optimized conditions PHB cannot yet compete with fossil-based polymers without external support mechanisms. This economic gap underscores the importance of policy instruments such as subsidies, carbon pricing, or extended producer responsibility schemes, which could help internalize the hidden environmental costs of conventional plastics and improve the competitiveness of PHB [12].
At the same time, environmental impact comparisons between PHB and fossil-based plastics must also consider the end-of-life fate of materials. While PE and PP largely accumulate in landfills or enter natural ecosystems, PHB can biodegrade under both aerobic and anaerobic conditions while PLA can be subjected to industrial fermentation [13]. However, the biodegradation rate is influenced by environmental factors such as temperature, microbial activity, and oxygen availability, which necessitates standardized testing and real-world validation to confirm its behavior outside laboratory conditions.
While PHB presents a compelling case as an environmentally superior alternative to conventional plastics, its overall sustainability must be validated through robust, data-driven comparative assessments. Current evidence demonstrates that PHB can outperform fossil-based polymers in certain impact categories, particularly when renewable feedstocks or CO2-based production pathways are employed [8]. However, other studies indicate that the energy intensity of fermentation and downstream recovery steps may offset these advantages, leading to environmental burdens comparable to or greater than those of PE or PP if fossil-based energy sources are used. These discrepancies underscore that sustainability claims cannot rely on single indicators or partial system boundaries.
A comprehensive environmental impact analysis is therefore essential, integrating life cycle assessment (LCA) to capture cradle-to-grave burdens, techno-economic analysis (TEA) to evaluate the scalability and cost-competitiveness of PHB production [9], and systematic studies of end-of-life behavior to confirm biodegradation under realistic environmental conditions [10]. Such a multidimensional framework is critical for revealing potential trade-offs between ecological performance and economic feasibility, while also clarifying under which conditions PHB offers genuine advantages over both petrochemical and other bio-based polymers.
Ultimately, the integration of these approaches will provide the evidence base needed to inform policy decisions and guide industrial stakeholders in the transition toward bio-based circular materials. Without such robust, data-driven assessments, there is a risk that PHB will be promoted as a sustainable alternative prematurely, without addressing its current technological and economic limitations. Continuous, comparative evaluation across the entire life cycle thus represents not only a scientific necessity but also a prerequisite for shaping effective policy frameworks and accelerating the systemic shift away from fossil-based plastics.
The primary objective of this study is to conduct a comprehensive life-cycle assessment (LCA) of poly(3-hydroxybutyrate) (PHB) production, with a focus on quantifying energy and raw material consumption across all life-cycle stages. This includes analyzing key environmental indicators such as global warming potential, cumulative energy demand, and resource depletion. A central aspect of this study is to compare the environmental performance of PHB with conventional petrochemical-based polymers such as polystyrene (PS), polypropylene (PP), and bio-based alternatives (PLA), which still dominate the plastics market. The results of individual analyses and the overall comparison are presented in kilograms of carbon dioxide equivalent [kg CO2-eq] derived from the carbon footprint method, which is the sum of greenhouse gas emissions (such as carbon dioxide, methane, nitrous oxide) generated directly and indirectly by the entire production system of a given material, as well as processes related to the disposal of the produced material over a given period [14]. These results provide a measure of the impact of a specific material on climate change, expressed in carbon dioxide equivalents (CO2-eq). PHB is frequently promoted as a sustainable alternative due to its biodegradability and bio-based origin, yet its production processes are often resource-intensive and technologically complex. Through detailed LCA modeling, this publication aims to identify environmental hotspots in PHB production, assess its viability in the context of circular economy goals, and evaluate whether its substitution for traditional polymers yields meaningful environmental benefits. The results will support decision-making in sustainable materials selection and industrial biotechnology strategies.
The conducted research addresses a significant gap in the current literature by combining real-world production data of PHB with a detailed environmental assessment, which is often lacking in previous studies based solely on theoretical or database-derived values [15]. The innovative aspect lies in the integration of experimental energy consumption measurements for each stage of the PHB production process, providing a more accurate and process-specific Life Cycle Assessment (LCA). Moreover, the comparison with conventional plastics such as PE, PP, and PVC, using standardized datasets, highlights the potential of PHB as a sustainable alternative. This approach enables a more realistic evaluation of biopolymer performance under industrial conditions and contributes valuable insights for future optimization and implementation.
2. Literature Review and Research Gap
A cradle-to-grave LCA conducted by Pietrini et al. (2007) [16] compared PHB-based composites with high-impact polystyrene (HIPS) and glass-fiber-filled polypropylene (PP-GF), highlighting that PHB composites may deliver environmental advantages in selected applications, particularly due to their biodegradability and renewable origin. More than a decade later Kookos et al. (2019) [17] provided an updated perspective by reviewing various bioprocessing schemes for PHB production, demonstrating that the environmental impact of PHB is highly dependent on the feedstock and process configuration, with some pathways achieving performance comparable to or better than other bio-based polymers. Rueda et al. (2023) [18] further examined the LCA of PHB production using heterotrophic microorganisms, emphasizing the importance of process optimization to reduce environmental impacts.
However, while these studies provide valuable insights, there remains a need for more comprehensive and up-to-date analyses that consider recent advancements in PHB production technologies and their scalability. Additionally, comparative LCAs that include a broader range of bio-based and petrochemical polymers, such as polylactic acid (PLA), polystyrene (PS), and polypropylene (PP), are limited. Recent systematic reviews, such as those by Ghomi et al. (2021) [19] and Fonseca et al. (2023) [20], have synthesized LCA studies for PLA products, but similar comprehensive reviews for PHB are scarce.
Furthermore, existing studies often focus on specific applications or production pathways, with limited consideration of regional variations, technological innovations, and end-of-life scenarios. Addressing these gaps is crucial for providing a holistic understanding of the environmental performance of PHB and its competitiveness as a sustainable alternative to conventional plastics. Without incorporating recent technological innovations—such as CO2-based production routes, waste-derived substrates, or improved downstream recovery methods—LCA studies risk underestimating the potential of PHB or, conversely, overstating its current sustainability profile. At the same time, overlooking regional variations in energy mixes, agricultural practices, and waste management systems may lead to results that are not representative at a global scale, thereby limiting the reliability of cross-country comparisons. addressing current research gaps is not only an academic exercise but also a prerequisite for guiding investment decisions, shaping effective policy instruments, and fostering industrial strategies aligned with the circular economy. Only through such comprehensive and data-driven assessments can PHB be realistically positioned as a viable component of sustainable plastics transitions.
3. Methodology
Life cycle assessment (LCA) is a practical environmental management method that finds the environmental impact of a product or system throughout its life cycle [21]. This method considers all stages, from the sourcing of raw materials to the disposal of waste and everything that happens between them. The full life cycle is referred to as the cradle-to-grave shot. In the context of the European Union’s commitments to minimize the environmental impact of industry, the Life Cycle Assessment (LCA) method is a useful tool for measuring the effectiveness of the implementation of green solutions and improvements.
LCA covers the entire life cycle of a product, which is a key advantage because at every stage of the life cycle, it helps to examine the impact that a product has on the environment, including humans, global warming, and natural resources. The LCA method allows for awareness and identification of the interdependence between human activity and its consequences for the natural environment. It is also an important source of information in designing, optimizing, and improving product features. It allows you to compare the impact on the natural environment and thus contributes to improving its condition. The LCA method is also used as a basic tool for environmental management in enterprises as a system of environmental measurement and monitoring [22].
The LCA study was conducted in accordance with the principles outlined in EN ISO 14040 and 14044 standards, using the SimaPro software version 9.3.0.3 [23,24]. The functional unit of the study was the production of 10 kg of PHB, PP, PS and PLA plastic using current production technologies and the same environmental conditions. A screening analysis approach was applied, with a process and product cut-off system boundary. System processes, including those related to electricity, were geographically modeled for the European region, based on polymer production data and using the appropriate energy mix, thereby enabling material comparison on a consistent energy basis. The baseline European energy mix was determined using the average market mix currently available in the Ecoinvent database. The composition of the selected mix was created in the Ecoinvent database based on data available in Eurostat studies [23]. The assumed average European energy mix comprises 42.35% fossil fuels, 29.18% renewable energy sources, and 28.47% nuclear energy. For PHB production, water and energy consumption were measured and incorporated into the study. All other processes and their environmental impacts were sourced from the Ecoinvent environmental database version 3.8 and Agri-footprint version 5.0. The data on PHB production were obtained directly from measurements on the production line and refer to experimental and small-scale production, which may require greater resource input compared to large-scale manufacturing.
The ISO 14040 standard defines a method for assessing the ecological aspects and potential impacts associated with a product as an LCA. This method consists of the analysis of the inventory of input and output factors of ecological significance, the analysis of the potential environmental impact related to the factors, the interpretation of the results of the analysis, the inventory and the phases of impact in relation to objective research [23]. The nature and potential of environmental impacts must be figured out in the most objective and reproducible manner possible, which is ensured by the application of LCA procedures. Environmental impact is the result of the interaction of factors with complex, multi-criteria relationships. It is difficult to predict the end environmental effect and the consequences of environmental changes caused by the process of production, use, and disposal of the product after use. In order to assess the impact of the tested materials on the environment, the carbon footprint method was chosen.
The study used the IPCC 2021 method developed by the Intergovernmental Panel on Climate Change to assess environmental impacts. It includes climate change factors for global warming potential (GWP) over a 100-year time horizon. Note that GWP factors of 100 are the default recommended by UNEP-GLAM (2017) [25]. This version of the method includes CO2 uptake and biogenic CO2 emissions. The characterization factor for biogenic methane is therefore increased to correct for the included carbon dioxide uptake. Results are calculated cumulatively and by category: fossil, biogenic, CO2 uptake, and soil transformation. This method is based on the final, government-issued version of the IPCC report, “AR6 Climate Change 2021: Fundamentals of the Physical Sciences” [25]. The characteristic factors for fossil methane, biogenic methane, nitrous oxide, trichlorofluoromethane, CFC-11, difluoromethane, HFC-32, 1,1,1,2-tetrafluoroethane, HFC-134a, and tetrafluoromethane, CFC-14 are based on Table 7.15 in Chapter 7 [26]. The characteristic factors for other substances are based on Table 7.SM.7 in the supplementary material in Chapter 7 [27].
4. Goal and Scope of the Study
The aim of the study is to compare the environmental impacts of producing an innovative and eco-friendly plastic generated by bacteria with those of conventional petroleum-based plastics. The comparison is intended to highlight the critical aspects of polymer production that require attention from an environmental perspective. The nature of the impact is presented in the form of a carbon footprint expressed as carbon dioxide equivalent. The study includes processes such as bacterial and nutrient preparation, equipment components, as well as the materials and energy used during production. The analysis also considers waste management processes related to both production materials and the final plastic product. In this way, emissions resulting from municipal disposal of these wastes are also accounted for. The analysis thus covers a cradle-to-gate scope with the inclusion of the end-of-life stage using municipal waste management. The main processes were categorized into biopolymer production, nutrient preparation, and electricity usage.
To accurately measure electricity consumption during the PHB production process, both single-phase and three-phase power measurements were carried out using a clamp-on meter directly mounted on the power supply cables of each device. The specific device used was the 3F WiFi MEW-01 by Zamel SPL10000009 (Pszczyna, Poland), which is equipped with WiFi communication module. This allowed for continuous, real-time monitoring and data collection throughout the operation of equipment such as fermenters, centrifuges, and drying units. The clamp-type installation enabled non-invasive measurements without interrupting the power supply, while the integrated wireless system facilitated seamless transmission of measurement data to a central database. This setup ensured high-resolution tracking of energy consumption across individual stages of the production process, providing a reliable basis for both environmental (LCA) and techno-economic analyses.
The result of the study is a comparison of plastics in terms of greenhouse gas emissions based on the carbon footprint method. The study compares the production stages with the final management system of 4 types of plastics: PP, PLA, PS, PHB.
5. Production Process and Energy and Raw Material Consumption Assessment
The production of polyhydroxybutyrate (PHB) through bacterial fermentation is a multi-step biotechnological process (Table 1) that begins with the cultivation of specific microorganisms and ends with the recovery and purification of the biopolymer. The entire process can be divided into four major stages: (1) bacterial strain selection and inoculum preparation, (2) fermentation, (3) cell harvesting and lysis, and (4) downstream processing, including polymer precipitation and purification (Figure 3). Below is a detailed description of each step, along with the methods used to measure energy consumption.

Table 1.
Individual production stages of PHB along with their description and indication of energy consumption sources.
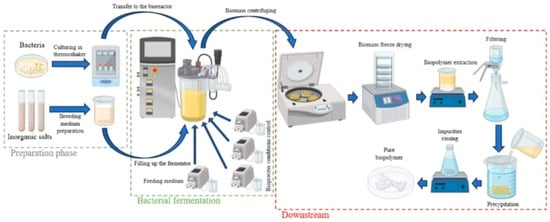
Figure 3.
The production process of biopolymers via bacterial fermentation.
During the bacterial fermentation process for polyhydroxybutyrate (PHB) production, various equipment was utilized at different stages according to their specific functions and technical requirements. In the bacterial strain cultivation and inoculum preparation phase, the ThermoScientific MAXQ 6000 (Waltham, MA, USA) incubator was used, providing precise temperature control and efficient mixing to ensure optimal microbial growth under aerobic conditions. The fermentation process itself was carried out in the Sartorius BioStat D (Göttingen, Germany) fermentor, which allowed for strict regulation of parameters such as pH, temperature, oxygen supply, and agitation, enabling effective PHB biosynthesis. Prior to fermentation, all media and solutions were sterilized using the Tuttnauer 5075ELV autoclave to maintain aseptic conditions. After fermentation, the bacterial biomass was separated from the culture medium using the CEPA Z101 (Lahr, Germany) centrifuge and subsequently lyophilized in an industrial lyophilizer to stabilize the biomass for downstream processing. Finally, during the downstream processing and precipitation stage, the Heidolph HEI VAP (Schwabach, Germany) industrial evaporator and Binder BD 400 (Tuttlingen, Germany) heating furnace were employed for solvent removal and polymer purification.
The data for PHB were obtained from a real production process, ensuring accurate and process-specific information for analysis. In contrast, the data for other polymers used for comparison were sourced from scientific publications and LCA databases, such as EcoInvent. These external sources provided standardized and widely accepted datasets, which were used for the Life Cycle Assessment (LCA) to ensure consistency and comparability across different materials.
6. Results
Thanks to real-time online monitoring of electricity consumption, a more comprehensive analysis of the production process is possible. Continuous tracking allows for the identification of energy-intensive phases and specific operations within each production stage (Table 2). This detailed insight enables targeted optimization efforts, helping to reduce overall energy demand and improve process efficiency. Moreover, such precise energy data strengthens the reliability of environmental assessments, particularly in life cycle analysis, by accurately reflecting the actual resource use associated with each production phase. Below, energy consumption results from all PHB production stages are presented:
Table 2.
Energy consumption at individual stages of biopolymer production.
6.1. PHB Powered by Standard Energy Mix
In the study, production processes are divided into 3 main strands with the most significant involvement. These are chemical processes marked as PHB biopolymer (Single production), processes related to the preparation of nutrient solution in the tank marked as Feed 200l, as well as the total value of electricity used by all devices in production processes together.
In PHB production proceses (Figure 4), the most significant share of the carbon footprint of 77.8% (138 kg CO2-eq) is exerted using energy by the equipment in the production processes, with the energy impacts decreasing in further steps. This reduction occurs through the balancing of carbon dioxide in the first group of manufacturing processes, thanks to the use of glycerin produced from extruded rapeseed oil. This product, thanks to its biological origin, has a CO2 balancing potential of −39.7 kg CO2-eq, which is −22.3%. As a result, the overall result of the manufacturing processes is 106 kg of CO2 equivalent.
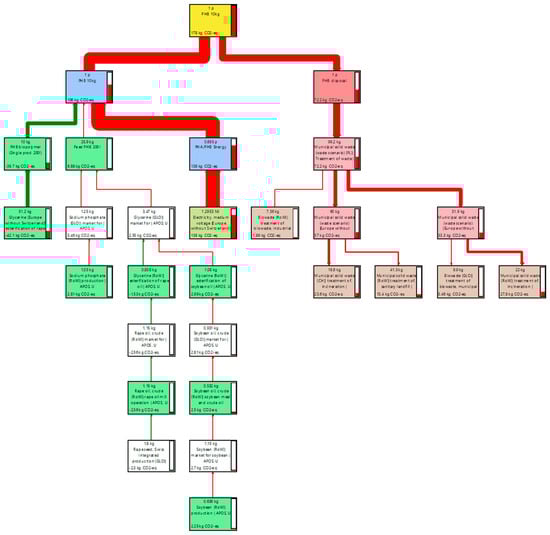
Figure 4.
Sankey diagram of PHB production process network.
Emissions from PHB production are primarily affected by electricity generation, and therefore carbon dioxide and methane to the greatest extent (Table 3).
Table 3.
Process contribution for PHB production.
The main carbon footprint emissions for PHB production are detailed in the Table 4. A large portion of these emissions are related to the municipal waste disposal system.
Table 4.
Results of the CO2 emission analysis for the PHB production process.
6.2. PHB Powered by 50% Renewable Energy Sources (RES)
Due to such a large share of electricity, it was considered justified to use renewable energy sources and to adopt such a scenario for the study as well. Therefore, a 50% share of energy in production processes from renewable sources from the company’s own photovoltaic installation was assumed (Figure 5). In this situation, the graph shows a new branch of processes related to power generation and photovoltaic panels, as well as reduced impacts from these processes of 67.2 kg CO2-eq, which is approximately 48.69% of the previous value. The result of the carbon footprint of production impacts using 50% renewable energy is therefore 34.5 kg CO2-eq.
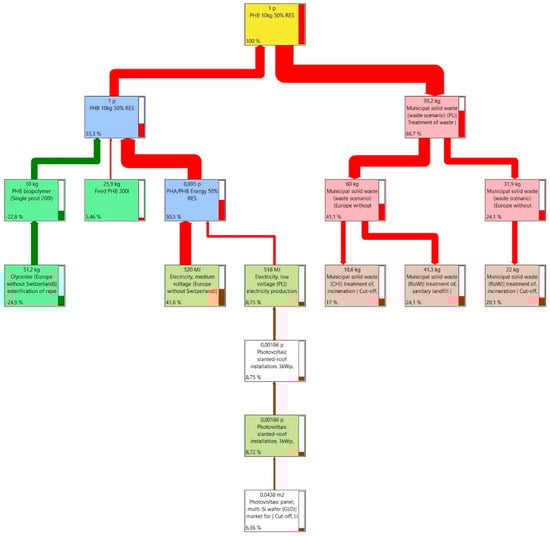
Figure 5.
Sankey diagram of PHB powered by 50% RES production process network.
By using 50% of energy from renewable sources such as photovoltaic panels, fossil carbon dioxide emissions and the environmental footprint of production processes were reduced by 67.31%. This factor is important when using large amounts of electricity (Table 5).
Table 5.
Process contribution for PHB production with 50% RES.
6.3. PLA
The production of PLA primarily uses “polylactide, granules”, which is a bio-based plastic product, biodegradable and thermoplastic. This product consists of 100% virgin material with no recycled material. The product is used in the following applications and sectors: plastic films, bottles, cups for cold drinks, rigid packaging, footwear such as flip-flops, as well as degradable films. It can be processed on standard equipment and used in injection molding, blow molding, and to produce blown and cast films, biaxially oriented films, or converted into extruded paper coating compounds or others. The set of processes included includes, but is not limited to, local maize production, wet maize milling, lactic acid production, lactide and polymer production, steam, on-site wastewater treatment, and various raw material production processes (Figure 6).
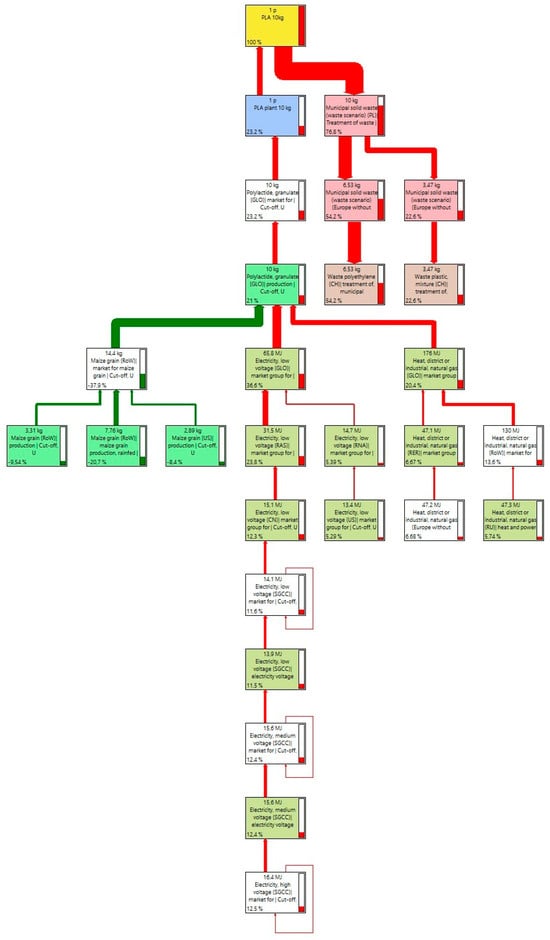
Figure 6.
Sankey’s diagram of PLA production process network.
In PLA production, the impacts associated with the use of electricity of 10.7 kg CO2 and fuels in the form of gas with a footprint of 3.41 and 5.26 kg CO2-eq come to the fore. These sources, together with the other processes, achieve 22.8 kg CO2-eq for the entire production of 10 kg PLA. The impact of final management is also visible, reaching the result of 5.74 kg CO2 carbon footprint (Table 6).
Table 6.
Process contribution for PLA production.
6.4. PP
The adopted polypropylene production system includes the production mix of commercial PP production technologies: slurry suspension polymerization, bulk suspension polymerization, and gas-phase polymerization. The summary of production processes was taken from the Ecoinvent environmental database version 3.8 for the product available on the European market. The production system is represented by a Sankey diagram (Figure 7).
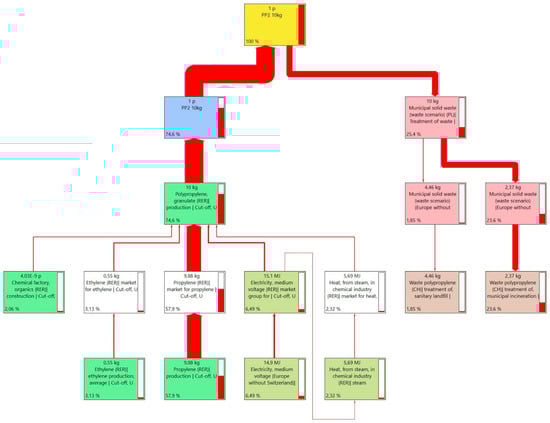
Figure 7.
Sankey’s diagram of PP production process network.
For polypropylene, the production processes of 12.2 kg CO2-eq themselves, which consist of the extraction of raw materials, chemical processing and the energy used, are associated with the greatest impacts. The second important source is also the processes related to the final management of the product and its final waste disposal of 6.2 kg CO2-eq (Table 7).
Table 7.
Process contribution for PP production.
6.5. PS
The production system for polystyrene was presented in the form of polystyrene foam insulation for use in walls and roofs. The production includes raw materials, raw material transportation, expanding polystyrene granules, recycling polystyrene waste for primary production, and forming insulation boards. For the purposes of the inventory, it was assumed that the energy used for foaming and forming the panels is independent of the density of the final product. Therefore, per kilogram of material input, it was considered that energy consumption is the same for all polystyrene boards. Data on the production system from the Ecoinvent 3.8 environmental database was used. The production system ends with the finished product in the production plant. The dataset includes raw materials, as well as transport and energy needed to convert them into a final product. The dataset does not include the packaging of the final product (Figure 8).
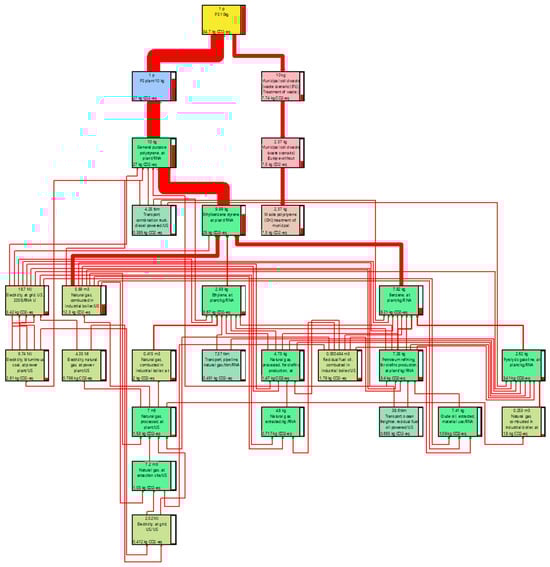
Figure 8.
Sankey’s diagram of PS production process network.
Polystyrene granules containing pentane are expanded with steam. Polystyrene waste is shredded. In the thermoforming process, the foamed granulate and recycled material are formed into slabs and finally cut to the desired dimensions.
For polystyrene, the main sources of carbon footprint are processes related to the production of ethylbenzene styrene 25 kg CO2-eq, which mainly uses natural gas and fuels. End-of-life processes are also noticeable with a result of 7.75 kg CO2-eq (Table 8).
Table 8.
Process contribution for PS production.
7. Comparison and Discussion
The comparative study of materials is presented as a selected segment of the product life cycle. It focuses on the environmental impacts associated with the manufacturing processes, representing a cradle-to-gate approach, and also includes the end-of-life stage based on a municipal waste management scenario. The comparison of plastics was conducted for a reference amount of 10 kg of product, and the final results are expressed in units of kilograms of CO2 equivalent emissions, in accordance with EN ISO 14067 [26] (see Figure 9). The total outcome is composed of two assessed phases: the production phase and the end-of-life phase.
Figure 9.
Comparison of the overall carbon footprint results of the tested plastics by phase.
The most favorable total result, 21.9 kg CO2-eq, was obtained for polypropylene (PP), while the second-lowest overall impact was recorded for polylactic acid (PLA) with 33.25 kg CO2-eq. However, when considering only the production phase, PLA demonstrated the lowest manufacturing-related CO2 emissions, amounting to just 5.58 kg CO2-eq, due to its biobased origin, compared to PP, which generated 15.69 kg CO2-eq during production (see Table 9).
Table 9.
Total carbon footprint score for the thermoplastics tested.
This highlights that end-of-life management is a critical determinant of total environmental performance, with composting, recycling, or landfilling scenarios strongly influencing the net emissions of bio-based materials. In the case of PP, the end-of-life impact was 6.2 kg CO2-eq, significantly lower than PLA’s 27.66 kg CO2-eq. The least favorable result, despite its biological origin, was obtained for the PHB material and it is a value of 177.66 [kg CO2-eq] in total for both tested phases, including 105.51 [kg CO2-eq] for the production phase and 72.16 [kg CO2-eq] for the disposal phase.
This considerable carbon footprint is largely attributable to the energy-intensive nature of PHB production, including fermentation, lyophilization, solvent extraction, and polymer purification, which are not yet optimized at industrial scale. Also small-scale laboratory production exacerbates energy demand compared to mass-produced polymers. This discrepancy stems from the municipal waste management scenario adopted in the analysis. For PP, the possibility of mechanical recycling contributes to lowering its overall impact, as it reduces the demand for virgin raw materials, which would otherwise generate high CO2 emissions.
The relatively low carbon footprint of PLA in the production phase (around 0.29 kg CO2-eq/kg) reflects recent LCA results showing significant greenhouse gas reductions compared to fossil-based plastics. However, PLA’s overall environmental benefits depend strongly on the end-of-life scenario.
Unlike polypropylene, PLA is rarely recycled at scale due to limited infrastructure and sorting incompatibilities. Instead, PLA is mainly composted or incinerated, which may increase emissions and reduce sustainability. Composting efficiency is affected by factors like temperature and PLA content; high PLA shares (>30%) can lower pH and inhibit microbial activity. Thus, to fully unlock PLA’s sustainability potential, improvements in recycling technologies and waste management policies are needed.
In contrast, materials such as PLA, despite being compostable, are currently not integrated into standard municipal composting systems, leading to higher modeled emissions. Similarly, PHB, although biodegradable, requires specific infrastructure and additional effort from municipal services to ensure proper processing. Without dedicated industrial composting or biowaste treatment systems, PHB may also be landfilled, contributing to methane emissions and reducing its effective circularity. Moreover, the energy-intensive production processes of PHB exacerbate its life cycle carbon footprint, making the availability of renewable energy and optimized processing crucial for realizing its environmental advantages [8,11].
PHB is further burdened by high energy consumption, measured for small-scale production, which results in higher CO2 emissions, while the values for other plastics are derived from mass production. Therefore, to level the playing field for PHB and simultaneously find a simple path to reducing its carbon footprint, an alternative production scenario was assumed and investigated, in which 50% of the electricity used comes from an on-site photovoltaic installation. This scenario will not serve as a direct comparison with other plastics, but rather as a simple path to improving performance compared to the mass production of other materials. Nevertheless, these biodegradable materials offer significant long-term benefits. Considering scenarios such as landfill disposal or uncontrolled littering, PLA and PHB may offer advantages over conventional plastics because they decompose naturally and do not persist in the environment, avoiding the long-term ecological burden associated with persistent plastic waste. Determining their precise advantage will certainly be the subject of further research and calculations in the near future.
Therefore, their potential environmental benefits become much more apparent when the full waste management landscape, including worst-case scenarios, is considered, or a scenario that allows the user to store in their own composter that does not require waste collection and transport processes. In such scenarios, both PHB and PLA can fully realize their biodegradability potential, as the emissions associated with transportation, sorting, and industrial composting energy consumption are effectively eliminated [10,17,18]. This localized composting approach minimizes fossil energy use, reduces greenhouse gas emissions, and prevents the accumulation of persistent plastics in the environment. The ability to manage organic waste on-site enhances the circularity of these materials, allowing nutrients and carbon to return directly to the soil and supporting a regenerative lifecycle. By contrast, conventional petrochemical plastics remain inert under these conditions, highlighting the relative advantage of bio-based, biodegradable polymers when end-of-life strategies are fully optimized [10,18].
Among the tested materials, the result of 37.03 [kg CO2-eq] was obtained by polystyrene (PS), for which there is a possibility of a scenario containing the processes of recovery of some of it, which is reflected in the reduced result of end-use emissions. The result of PS production processes is 29.28 [kg CO2-eq] and already has 10% recycled material, and 7.74 [kg CO2-eq] in end-of-life management. In fourth place in the table, we can see biologically produced and compostable PHB plastic, characterized by a high complexity of production processes, the participation of numerous processes and devices in production, as well as water and energy demand. Assuming the basic average European energy mix discussed in the study’s assumptions, the carbon footprint for this material is 177.66 kg CO2-eq, with production itself accounting for 105.51 kg CO2-eq and final disposal for 72.16 kg CO2-eq. It should be noted that this is not mass production like other materials, and the solutions used may therefore be more energy-intensive.
Due to the energy demand and the plans for the production hall equipment, as well as the desire to bridge the gap between other materials and identify a simple path to improvement, an alternative energy generation scenario was adopted, using 50% of energy from on-site photovoltaic panels and designated as 50% renewable energy. In this system, production processes achieve a carbon footprint of 34.49 [kg CO2-eq], approaching the carbon footprint of other materials, while the final disposal of the material itself and the raw materials used in production is 72.16 [kg CO2-eq]. Furthermore, the lack of a recycling scenario for PHB and the need to landfill waste for composting negatively impact the final phase’s result. Due to the use of renewable energy sources, the total carbon footprint for PHB is 106.65 [kg CO2-eq]. These results suggest that PHB is well on its way to matching the carbon footprint of other materials, and that its emissions require less significant changes to achieve real improvement and become competitive with other materials in this regard.
The significant carbon footprint associated with polyhydroxybutyrate (PHB), particularly during production, has been confirmed in recent studies. Klüppel [28] emphasized that PHB production remains highly energy- and resource-intensive due to complex fermentation and purification steps. While PHB is biodegradable and derived from renewable feedstocks, its environmental benefits are often offset by limited infrastructure for industrial composting and the absence of effective recycling systems. This is particularly problematic in regions where composting conditions are not optimized or where PHB waste is landfilled, contributing to methane emissions and reducing its circular potential. In contrast, materials such as polystyrene, despite being fossil-based, can achieve lower overall environmental burdens when partially recycled, as mechanical recovery and reuse of PS significantly lower end-of-life emissions. These findings suggest that bio-based origin alone does not guarantee environmental superiority; rather, the integration of renewable energy inputs and development of dedicated waste treatment systems are crucial in reducing the life cycle impact of materials like PHB. In the next step, the production processes for the compared materials were analyzed using the breakdown into carbon dioxide equivalent emission sources (Figure 10).
Figure 10.
Comparison of the carbon footprint broken down by emission sources of the analyzed polymers.
The result of the allocation of emission sources of the carbon footprint indicates a significant share of emissions from fossil sources for all materials. It can be said that it is one of the main sources of impact of this assessment method. In addition, for bio-based plastics, i.e., PLA and PHB, balancing of CO2 emissions was observed with the participation of raw materials or materials of plant origin, and in PHB plastic, biogenic impacts are additionally visible, as well as the share of land transformation (Table 10).
Table 10.
Comparison of the carbon footprint in damage categories for polymer production processes.
It can also be noted that in these plastics, the fossil impacts are greater than the result shows, but these emissions are balanced by the share of plant-based ingredients in production and reported using the Uptake CO2 balancing indicator. For example, for PHB production processes from the standard European mix, the carbon footprint is approximately 218.26 kg CO2-eq, and about 203.2 kg of CO2-eq has been balanced in the production processes. In the scenario using renewable energy sources, emissions of fossil origin are lower and amount to approx. 149.7 kg CO2-eq, while approx. 196.74 kg CO2-eq has been balanced (Table 9). In connection with the biological elements present in production, there are also values of bio-source impacts, as well as land transformation.
The impacts from the final management stage of the tested products are presented in Figure 11.
Figure 11.
Comparison of sources of impact in the final development phase.
The disposal phase is dominated mainly by fossil raw materials, and in the case of PHB plastics, impacts from biological agents. A more accurate identification of the processes responsible for these specific impacts will be possible in the next stages of the study. One can only guess that the fuels necessary to transport waste to appropriate processing or storage sites and the energy needed to carry out recycling processes may be responsible for fossil raw materials, and that biogenic impacts will be related to the processes of composting and decomposition of substances that cause emissions (Table 11).
Table 11.
Comparison of the carbon footprint of the tested plastics from the final management stage.
The impact of the management phase will therefore depend not only on the product itself, but above all on the way waste collection is organized, the possibility of recycling and the processes going with these tasks. It should be noted that PHB and PLA plastics can be composted in home composters. The use of such a scenario would limit the carbon footprint from end-use processes only to nutrients related to product decomposition processes. In such a situation, the results of these materials would be like other mass-produced plastics already at the stage of low-volume production.
Knowing that the systemic method of final management is so fundamental to the overall result, it is worth taking another look at the results of the production of plastics itself. Assuming that the largest production impacts among the compared and commercially produced plastics are assumed to be 100%—in this case it will be polystyrene—the production of biological PHB is only 17.78% more kg of carbon dioxide equivalent, while the production of PHB without the participation of renewable energy sources would already account for 360.27% of the emissions allocated to PS (Table 12). The most advantageous in this comparison is the production of PLA, which assumes a value of 5.58 kg CO2-eq, which is equivalent to 19.06% of the impact appropriate for PS.
Table 12.
Percentage comparison of the carbon footprint of plastics production in relation to PS.
These results underscore the critical importance of system-level decisions, especially in the production phase of plastic materials. When normalizing the production-related emissions of polystyrene (PS) to 100%, the manufacturing of bio-based PHB without renewable energy contributes over 360% more CO2-eq, emphasizing how strongly energy sourcing influences life cycle impacts. However, when PHB is produced with partial integration of renewable energy, its emissions drop substantially—only 17.78% higher than those of PS. This observation is consistent with findings by Klüppel (2005) [28], who reported that electricity consumption during fermentation and polymer recovery is the dominant contributor to PHB’s carbon footprint. Similarly, Nelson et al. (2024) [29] highlighted that PHB’s environmental advantage depends heavily on decarbonizing the energy mix used in production. On the other hand, polylactic acid (PLA) stands out for its low production-phase emissions—just 5.58 kg CO2-eq, or 19.06% relative to PS—aligning with recent research showing that PLA’s manufacturing can outperform fossil-based polymers even without renewable inputs (Forster et al., 2023) [30]. These comparisons reinforce that while the biogenic origin of materials like PHB and PLA offers a sustainability advantage, it is the integration of low-emission energy and efficient industrial practices that ultimately determines their environmental competitiveness. The results of this study provide a comprehensive comparison of the environmental impacts associated with the production and end-of-life scenarios of PHB, PLA, and conventional petrochemical plastics (PP and PS). These findings highlight the inherent trade-offs between renewable sourcing, biodegradability, and energy efficiency, which are critical considerations for stakeholders aiming to integrate biopolymers into sustainable material strategies [17,18,25]. While PHB and PLA originate from renewable feedstocks, their environmental performance is strongly influenced by the energy intensity of production processes, particularly for PHB, and by the availability and efficiency of end-of-life management systems [18,22]. In other words, a bio-based or biodegradable origin alone does not automatically confer environmental superiority; rather, it is the combination of renewable sourcing, optimized processing, and effective waste management infrastructure that determines the overall sustainability outcome [17,18,25]. These considerations are essential for policymakers, industry practitioners, and material designers who aim to prioritize polymers that align with circular economy principles while minimizing carbon footprint and resource consumption.
PHB demonstrates clear advantages from the perspective of circular economy principles. Being a microbial-derived polymer, it is produced from renewable feedstocks such as sugars, plant oils, or organic waste streams. Its inherent biodegradability allows for natural degradation in composting or soil environments, addressing the persistent pollution associated with conventional petrochemical plastics. However, our LCA results indicate that PHB’s current laboratory-scale production exhibits a substantially higher carbon footprint and energy demand compared to PLA, PP, and PS. This discrepancy primarily arises from the energy-intensive downstream processing stages, including lyophilization, solvent extraction, and polymer purification, which are not yet optimized at industrial scale. Comparatively, PLA exhibits the lowest production-phase emissions in our study. This aligns with the literature, which attributes PLA’s favorable environmental profile to its relatively low-temperature polymerization processes and the use of starch-derived feedstocks with established agricultural supply chains [20,31]. PP, on the other hand, shows the most advantageous end-of-life outcomes under municipal waste management assumptions, largely due to its recyclability and widespread industrial recycling infrastructure. These results underline the importance of considering both production and disposal phases when evaluating polymer sustainability, as improvements in one life cycle stage may not compensate for environmental burdens in another.
The integration of renewable energy into PHB production offers a significant mitigation pathway. Our analysis indicates that substituting a portion of grid electricity with renewable sources could reduce the overall carbon footprint of PHB production by over 67%, highlighting the dominant role of energy sourcing in determining environmental performance [22,23]. This emphasizes that decarbonizing the electricity mix is a critical lever for improving the sustainability of biopolymer manufacturing. In addition, technological improvements such as optimizing microbial strains, employing low-cost or waste-derived feedstocks, and adopting energy-efficient recovery techniques (e.g., enzymatic or supercritical fluid extraction) are likely to yield further reductions in environmental impacts [3,29,32]. These innovations, particularly when combined with economies of scale achievable at industrial production levels, are expected not only to enhance ecological performance but also to improve cost-effectiveness, making PHB increasingly competitive with conventional petrochemical plastics [18,22,23]. Such integrated strategies underscore that sustainability gains in biopolymer production require both upstream process optimization and strategic energy planning, rather than relying solely on the renewable or biodegradable nature of the material.
Despite the promising attributes of PHB, several research and industrial gaps remain. Current LCA studies are often limited to laboratory-scale data, focusing on single environmental indicators such as carbon footprint or energy demand, without fully considering comprehensive end-of-life scenarios or regional variations in energy and waste management systems. Comparative LCAs across multiple bio-based and petrochemical polymers are still scarce, particularly those incorporating recent technological advances and process-specific data. Addressing these gaps will be essential for providing robust, actionable information for policymakers and industrial decision-makers. In addition, expanding LCA frameworks to include social and economic dimensions through Life Cycle Sustainability Assessment (LCSA) could provide a more holistic understanding of the trade-offs and co-benefits associated with biopolymer adoption.
8. Conclusions
The production of PHB, while still facing certain technological and economic barriers, presents significant advantages from the perspective of sustainable development. One of the key challenges identified in this study is the relatively high energy demand associated with PHB synthesis, especially in the downstream processing stages such as lyophilization, solvent extraction, and polymer purification. However, it is important to note that the energy used in PHB production can be sourced from renewable electricity or waste heat recovery systems, which significantly reduces its environmental burden. From a sustainability standpoint, PHB offers clear benefits. Unlike PP and PS, which are entirely dependent on fossil resources, PHB is produced from renewable carbon sources such as sugars, plant oils, or organic waste streams. Moreover, its biodegradability in natural environments and composting systems positions PHB as a strategic material in the development of circular economy models, where end-of-life disposal becomes part of a regenerative biological cycle. This is in stark contrast to conventional plastics, which persist in ecosystems for decades and contribute to microplastic pollution. Despite its current energy inefficiencies, PHB demonstrates greater long-term sustainability potential. Improvements in microbial strain engineering, the use of low-cost or waste-derived substrates, and the optimization of recovery techniques (e.g., solvent-free or enzymatic methods) are actively being researched and implemented. As these technologies mature, it is expected that both the energy intensity and production costs of PHB will decrease, making it a more competitive and ecologically responsible alternative to fossil-based plastics. Therefore, while PS and PP remain more energy-efficient in current industrial practice, PHB provides a forward-looking, sustainable solution aligned with global environmental goals.
Polyhydroxybutyrate has the clear advantage of being derived from renewable resources such as glycerol or waste plant oils, reducing dependence on fossil fuels. The use of agricultural or industrial by-products as carbon sources for PHB can further reduce the environmental burden associated with raw material extraction, especially when integrated into circular production models. LCA results derived from EcoInvent data and scientific literature confirm that although PHB currently has a higher energy demand, it offers significant environmental benefits due to its renewability, biodegradability, and lower toxicity. With ongoing improvements in microbial efficiency, use of low-cost feedstocks, and energy recovery systems, PHB could become an increasingly viable and sustainable alternative to conventional plastics in various applications.
One of the most significant advantages of PHB from an industrial perspective is its biodegradability and renewable origin. Unlike polystyrene (PS) or polypropylene (PP), which are derived from non-renewable petrochemical resources and contribute significantly to long-term environmental pollution, PHB is synthesized by bacteria from renewable feedstocks and degrades naturally in various environments [33]. This makes PHB particularly attractive for use in single-use applications, packaging, agriculture, and even biomedical products, where biodegradability is a valuable functional feature. Industries that adopt PHB can respond to growing consumer and regulatory demand for sustainable products and may gain a competitive edge in eco-conscious markets. Despite its potential, there are still several industrial challenges associated with PHB production. The most critical barriers include relatively high production costs, limited scalability, and energy-intensive downstream processing [12,33,34]. However, current trends in biotechnology such as the use of genetically engineered microbial strains, the valorization of industrial and agricultural waste as feedstock, and improvements in extraction and purification methods are gradually overcoming these obstacles [35]. As technology matures, economies of scale and process integration will make PHB production more cost-effective and resource-efficient. Another important consideration for industry is the compatibility of PHB with existing manufacturing infrastructure. PHB can be processed using conventional plastic technologies such as extrusion, injection molding, and thermoforming, which significantly reduces the need for investment in new machinery [36,37,38]. However, its thermal sensitivity and narrower processing window require some adaptation of processing conditions, particularly in high-volume applications. Also, strategies such as the use of plasticizers, polymer blends, or nucleating agents can expand the processing window, improve melt flow, and reduce brittleness, making PHB more suitable for industrial-scale applications while maintaining its structural integrity and biodegradability [39]. From a broader sustainability and policy perspective, companies investing in PHB and other biopolymers may benefit from upcoming environmental regulations, plastic taxes, and green public procurement initiatives. Moreover, life cycle assessments (LCA) confirm that PHB has a significantly lower environmental impact in terms of carbon emissions and post-consumer waste, especially when the full biodegradation pathway is considered. For industries operating in regions with strict environmental standards or strong green innovation ecosystems, PHB may become not only a technological option but also a regulatory necessity. In conclusion, PHB and other biopolymers represent a viable and increasingly attractive alternative to traditional plastics. Although certain technical and economic barriers still exist, ongoing research, industrial innovation, and supportive policy frameworks are paving the way for their broader adoption. For the plastics industry, the shift toward PHB offers an opportunity to align with circular economy principles, reduce environmental footprint, and meet the sustainability expectations of future markets. Companies that engage early in this transition will be better positioned to lead in a rapidly changing materials landscape. One of the most critical areas for future research is the optimization of microbial strains and fermentation conditions [40,41]. Advances in synthetic biology and metabolic engineering can lead to the development of robust bacterial or algal strains capable of producing biopolymers from low-cost or waste-derived feedstocks, including lignocellulosic biomass, industrial by-products, or carbon dioxide. Additionally, co-culture systems and continuous fermentation processes could improve yield, productivity, and energy efficiency, making large-scale production more economically viable.
Equally important is the development of greener and more efficient downstream processing methods. Traditional extraction techniques often rely on toxic solvents and high energy input, which offset the environmental benefits of the biopolymer itself [42]. Therefore, future work should explore solvent-free, enzymatic, or supercritical fluid extraction methods that reduce environmental impact and enhance polymer purity. Integrating biopolymer recovery into closed-loop production systems, with solvent recovery and energy reuse, will also be crucial for improving overall process sustainability. From an environmental assessment perspective, future research should aim to improve life cycle assessment (LCA) methodologies tailored specifically for biopolymers. This includes the development of more detailed and region-specific inventory data for bio-based processes, the inclusion of land use change impacts, and the consideration of end-of-life scenarios such as composting, biodegradation in different environments, and recycling. The dynamic nature of agricultural supply chains and biopolymer degradation pathways should also be better reflected in LCA models to provide more accurate and decision-relevant results.
Furthermore, comparative studies between biopolymers and fossil-based plastics need to be expanded to cover not only environmental indicators (e.g., carbon footprint, eutrophication, resource depletion), but also social and economic dimensions, such as labor conditions in feedstock production or long-term cost competitiveness. Incorporating Life Cycle Sustainability Assessment (LCSA) frameworks can help provide a more holistic understanding of the impacts and trade-offs associated with biopolymer adoption. Finally, interdisciplinary and cross-sector collaboration should be encouraged in future research projects, involving material scientists, microbiologists, environmental engineers, and economists. Such collaborations can support the development of integrated value chains for biopolymers—from raw material sourcing and production to product design and waste management—and foster innovation that is both scientifically sound and industrially relevant.
In summary, future research on biopolymers should prioritize the development of cost-effective, energy-efficient, and environmentally benign production methods, along with improved tools for comprehensive sustainability assessment. These efforts will be key to accelerating the transition toward a bio-based economy and reducing the environmental burden of plastic materials.
The results of this study provide a valuable decision-making basis for industrial stakeholders, material developers, and policymakers aiming to implement more sustainable production strategies. By identifying the environmental hotspots in the production of poly(3-hydroxybutyrate) (PHB) [42], the study highlights key stages where energy and resource consumption can be reduced through process optimization, adoption of renewable energy, or improved feedstock management. These findings can directly inform industrial biotechnology initiatives seeking to integrate biopolymers into scalable and environmentally sound value chains.
The comparative life cycle assessment (LCA) with petrochemical (PE, PP) and other bio-based polymers (PLA) offers practical insight into the environmental trade-offs associated with polymer substitution. This enables more informed material selection in eco-design, procurement, and product development, especially in packaging, agriculture, and biomedical sectors where sustainability criteria are increasingly prioritized.
The study also supports the development of green certification schemes and eco-labeling by providing experimentally validated LCA data, rather than relying solely on generic database assumptions. This contributes to higher credibility and transparency in sustainability claims related to bioplastics.
This research contributes to the advancement of theory and methodology in the field of management and quality science, particularly in the domains of environmental performance management and sustainable product life cycle governance.
By integrating real-life experimental measurements into life cycle modeling, the study enhances the methodological robustness of LCA applications in industrial biotechnology. This represents a methodological innovation, moving beyond generic data toward process-specific, evidence-based environmental evaluations—an approach essential for realistic and actionable sustainability assessments.
The comparative assessment with conventional polymers under standardized conditions introduces a framework for evaluating trade-offs between biodegradability, resource efficiency, and environmental impacts. This contributes to the theoretical understanding of how sustainability-oriented innovation in materials can be evaluated not only by end-of-life performance but across the full product system.
The study aligns with circular economy principles by critically assessing whether biopolymers like PHB meet the systemic requirements of resource closure, energy efficiency, and low environmental burden. It supports the development of a more nuanced theoretical framework for sustainable materials management that goes beyond simple substitution logic and incorporates life cycle thinking into strategic decision-making.
Author Contributions
Conceptualization, M.W., M.R. and T.W.; methodology, T.W. and M.R.; validation, T.W., M.R. and M.W.; formal analysis, M.R. and T.W.; investigation, M.R. and T.W.; data curation, T.W. and M.R.; writing—original draft preparation, M.W., M.R. and T.W.; writing—review and editing, M.W., M.R. and T.W.; visualization, T.W. and M.R.; supervision, M.W. All authors have read and agreed to the published version of the manuscript.
Funding
The article presents the results of the Project financed from the subsidy granted to the Krakow University of Economics—Project nr 017/ZJE/2025/DOS.
Data Availability Statement
The original contributions presented in this study are included in the article. Further inquiries can be directed to the corresponding author.
Conflicts of Interest
The authors declare no conflict of interest.
References
- Verbeek, C.; Johannes, R. Products and Applications of Biopolymers; InTech: Rijeka, Croatia, 2012; ISBN 9789535102267. [Google Scholar]
- Holmes, P.A. Applications of PHB—A Microbially Produced Biodegradable Thermoplastic. Phys. Technol. 1985, 16, 32–36. [Google Scholar] [CrossRef]
- Wang, J.; Huang, J.; Liu, S. The Production, Recovery, and Valorization of Polyhydroxybutyrate (PHB) Based on Circular Bioeconomy. Biotechnol. Adv. 2024, 72, 108340. [Google Scholar] [CrossRef]
- Plastics Europe. PlasticEurope: Plastics—The Facts 2024. Available online: https://plasticseurope.org/knowledge-hub/plastics-the-fast-facts-2024/ (accessed on 20 May 2025).
- Rohan Top 10 Plastics Market. Available online: https://www.marketsandmarkets.com/PressReleases/top-10-plastics.asp (accessed on 20 May 2025).
- Witko, T.; Solarz, D.; Feliksiak, K.; Haraźna, K.; Rajfur, Z.; Guzik, M. Insights into In Vitro Wound Closure on Two Biopolyesters—Polylactide and Polyhydroxyoctanoate. Materials 2020, 13, 2793. [Google Scholar] [CrossRef] [PubMed]
- Senila, L.; Kovacs, E.; Resz, M.-A.; Senila, M.; Becze, A.; Roman, C. Life Cycle Assessment (LCA) of Bioplastics Production from Lignocellulosic Waste (Study Case: PLA and PHB). Polymers 2024, 16, 3330. [Google Scholar] [CrossRef]
- Senila, L.; Kovacs, E.; Senila, M. A Review of Polylactic Acid (PLA) and Poly(3-Hydroxybutyrate) (PHB) as Bio-Sourced Polymers for Membrane Production Applications. Membranes 2025, 15, 210. [Google Scholar] [CrossRef]
- Koch, M.; Spierling, S.; Venkatachalam, V.; Endres, H.-J.; Owsianiak, M.; Vea, E.B.; Daffert, C.; Neureiter, M.; Fritz, I. Comparative Assessment of Environmental Impacts of 1st Generation (Corn Feedstock) and 3rd Generation (Carbon Dioxide Feedstock) PHA Production Pathways Using Life Cycle Assessment. Sci. Total Environ. 2023, 863, 160991. [Google Scholar] [CrossRef] [PubMed]
- Koch, N.; Naumann, L.; Pretis, F.; Ritter, N.; Schwarz, M. Attributing Agnostically Detected Large Reductions in Road CO2 Emissions to Policy Mixes. Nat. Energy 2022, 7, 844–853. [Google Scholar] [CrossRef]
- Lopez-Arenas, T.; González-Contreras, M.; Anaya-Reza, O.; Sales-Cruz, M. Analysis of the Fermentation Strategy and Its Impact on the Economics of the Production Process of PHB (Polyhydroxybutyrate). Comput. Chem. Eng. 2017, 107, 140–150. [Google Scholar] [CrossRef]
- Vlaeminck, E.; Quataert, K.; Uitterhaegen, E.; De Winter, K.; Soetaert, W.K. Advanced PHB fermentation strategies with CO2-derived organic acids. J. Biotechnol. 2022, 343, 102–109. [Google Scholar] [CrossRef] [PubMed]
- Sikorska, W.; Musioł, M.; Zawidlak-Węgrzyńska, B.; Rydz, J. End-of-Life Options for (Bio)Degradable Polymers in the Circular Economy. Adv. Polym. Technol. 2021, 2021, 6695140. [Google Scholar] [CrossRef]
- Çelekli, A.; Zariç, Ö.E. From Emissions to Environmental Impact: Understanding the Carbon Footprint. Int. J. Environ. Geoinform. 2023, 10, 146–156. [Google Scholar] [CrossRef]
- Hohenschuh, W.; Kumar, D.; Murthy, G.S. Economic and Cradle-to-Gate Life Cycle Assessment of Poly-3-Hydroxybutyrate Production from Plastic Producing, Genetically Modified Hybrid Poplar Leaves. J. Renew. Sustain. Energy 2014, 6, 063113. [Google Scholar] [CrossRef]
- Pietrini, M.; Roes, L.; Patel, M.K.; Chiellini, E. Comparative Life Cycle Studies on Poly(3-Hydroxybutyrate)-Based Composites as Potential Replacement for Conventional Petrochemical Plastics. Biomacromolecules 2007, 8, 2210–2218. [Google Scholar] [CrossRef]
- Kookos, I.K.; Koutinas, A.; Vlysidis, A. Life Cycle Assessment of Bioprocessing Schemes for Poly(3-Hydroxybutyrate) Production Using Soybean Oil and Sucrose as Carbon Sources. Resour. Conserv. Recycl. 2019, 141, 317–328. [Google Scholar] [CrossRef]
- Rueda, E.; Gonzalez-Flo, E.; Mondal, S.; Forchhammer, K.; Arias, D.M.; Ludwig, K.; Drosg, B.; Fritz, I.; Gonzalez-Esquer, C.R.; Pacheco, S.; et al. Challenges, Progress, and Future Perspectives for Cyanobacterial Polyhydroxyalkanoate Production. Rev. Environ. Sci. Biotechnol. 2024, 23, 321–350. [Google Scholar] [CrossRef]
- Rezvani Ghomi, E.R.; Khosravi, F.; Saedi Ardahaei, A.S.; Dai, Y.; Neisiany, R.E.; Foroughi, F.; Wu, M.; Das, O.; Ramakrishna, S. The Life Cycle Assessment for Polylactic Acid (PLA) to Make It a Low-Carbon Material. Polymers 2021, 13, 1854. [Google Scholar] [CrossRef]
- Fonseca, A.; Ramalho, E.; Gouveia, A.; Figueiredo, F.; Nunes, J. Life Cycle Assessment of PLA Products: A Systematic Literature Review. Sustainability 2023, 15, 12470. [Google Scholar] [CrossRef]
- Nitkiewicz, T.; Wojnarowska, M.; Sołtysik, M.; Kaczmarski, A.; Witko, T.; Ingrao, C.; Guzik, M. How Sustainable Are Biopolymers? Findings from a Life Cycle Assessment of Polyhydroxyalkanoate Production from Rapeseed-Oil Derivatives. Sci. Total Environ. 2020, 749, 141279. [Google Scholar] [CrossRef] [PubMed]
- Ziemińska-Stolarska, A.; Pietrzak, M.; Zbiciński, I. Application of LCA to Determine Environmental Impact of Concentrated Photovoltaic Solar Panels—State-of-the-Art. Energies 2021, 14, 3143. [Google Scholar] [CrossRef]
- ISO 14040:2006; Amd 1:2020 Environmental Management—Life Cycle Assessment—Principles and Framework. International Organization for Standardization: Geneva, Switzerland, 2006. Available online: https://www.iso.org/standard/37456.html (accessed on 20 May 2025).
- ISO 14044:2006; Amd 2:2020 Environmental Management—Life Cycle Assessment—Requirements and Guidelines. International Organization for Standardization: Geneva, Switzerland, 2006. Available online: https://www.iso.org/standard/38498.html (accessed on 20 May 2025).
- Global Guidance for Life Cycle Impact Assessment Indicators Volume 1, UNEP/SETAC Life Cycle Initiative, 2017. Available online: https://www.lifecycleinitiative.org/training-resources/global-guidance-lcia-indicators-v-1/ (accessed on 20 May 2025).
- ISO 14067:2018; Greenhouse Gases—Carbon Footprint of Products—Requirements and Guidelines for Quantification. International Organization for Standardization: Geneva, Switzerland, 2018. Available online: https://www.iso.org/standard/71206.html (accessed on 20 May 2025).
- Eurostat. Energy Production and Imports; Eurostat: Luxembourg, 2025. [Google Scholar]
- Klüppel, H.-J. The Revision of ISO Standards 14040-3—ISO 14040: Environmental Management—Life Cycle Assessment—Principles and Framework—ISO 14044: Environmental Management—Life Cycle Assessment—Requirements and Guidelines. Int. J. Life Cycle Assess. 2005, 10, 165. [Google Scholar] [CrossRef]
- Nelson, M.; Nelson, D.B. The Cloud Model for Climate Change. Int. J. Geosci. 2024, 15, 366–395. [Google Scholar] [CrossRef]
- Forster, P.M.; Smith, C.J.; Walsh, T.; Lamb, W.F.; Lamboll, R.; Hauser, M.; Ribes, A.; Rosen, D.; Gillett, N.; Palmer, M.D.; et al. Indicators of Global Climate Change 2022: Annual Update of Large-Scale Indicators of the State of the Climate System and Human Influence. Earth Syst. Sci. Data 2023, 15, 2295–2327. [Google Scholar] [CrossRef]
- Lunevich, L. Critical Digital Pedagogy and Innovative Model, Revisiting Plato and Kant: An Environmental Approach to Teaching in the Digital Era. Creat. Educ. 2021, 12, 2011–2024. [Google Scholar] [CrossRef]
- Rodríguez-Álvarez, M.J.; García-Garrido, S.E.; Perrone, S.; García-Álvarez, J.; Capriati, V. Deep Eutectic Solvents and Heterogeneous Catalysis with Metallic Nanoparticles: A Powerful Partnership in Sustainable Synthesis. Curr. Opin. Green Sustain. Chem. 2023, 39, 100723. [Google Scholar] [CrossRef]
- Mathel, V.; Aziz, S.; Guo, X.; Bertling, K.; Rakić, A.D.; Heitzmann, M.T.; Vandi, L.-J. Wood/PHAs Biocomposites with Mechanical Properties Comparable to Conventional Plastics: Model-Based Prediction and Experimental Validation. Compos. Part A Appl. Sci. Manuf. 2025, 194, 108916. [Google Scholar] [CrossRef]
- Song, L.; Li, Y.; Meng, X.; Wang, T.; Shi, Y.; Wang, Y.; Shi, S.; Liu, L.-Z. Crystallization, Structure and Significantly Improved Mechanical Properties of PLA/PPC Blends Compatibilized with PLA-PPC Copolymers Produced by Reactions Initiated with TBT or TDI. Polymers 2021, 13, 3245. [Google Scholar] [CrossRef]
- Narodoslawsky, M.; Shazad, K.; Kollmann, R.; Schnitzer, H. LCA of PHA Production—Identifying the Ecological Potential of Bio-Plastic. Chem. Biochem. Eng. Q. 2015, 29, 299–305. [Google Scholar] [CrossRef]
- Witko, T. Biophysical Characteristics and Cellular Studies of Polyhydroxyoctanoate (PHO)—Biodegradable and Biocompatible Polymer for Biomedical Applications. Ph.D. Thesis, Jagiellonian University, Kraków, Poland, 2019. [Google Scholar]
- Tan, D.; Wang, Y.; Tong, Y.; Chen, G.-Q. Grand Challenges for Industrializing Polyhydroxyalkanoates (PHAs). Trends Biotechnol. 2021, 39, 953–963. [Google Scholar] [CrossRef]
- García, A.; Segura, D.; Espín, G.; Galindo, E.; Castillo, T.; Peña, C. High Production of Poly-β-Hydroxybutyrate (PHB) by an Azotobacter Vinelandii Mutant Altered in PHB Regulation Using a Fed-Batch Fermentation Process. Biochem. Eng. J. 2014, 82, 117–123. [Google Scholar] [CrossRef]
- Guzik, M.; Witko, T.; Steinbüchel, A.; Wojnarowska, M.; Sołtysik, M.; Wawak, S. What Has Been Trending in the Research of Polyhydroxyalkanoates? A Systematic Review. Front. Bioeng. Biotechnol. 2020, 8, 959. [Google Scholar] [CrossRef]
- Koller, M. The Handbook of Polyhydroxyalkanoates; Koller, M., Ed.; CRC Press: Boca Raton, FL, USA, 2020; ISBN 9781003087663. [Google Scholar]
- Hernandez, M.M.; Gupta, N.S.; Lee, K.-S.; Pital, A.C.; Marrone, B.L.; Iverson, C.N.; Dumont, J.H. Characterization of Polyhydroxybutyrate-Based Composites Prepared by Injection Molding. Polymers 2021, 13, 4444. [Google Scholar] [CrossRef] [PubMed]
- Choi, J.; Lee, S.Y. Process Analysis and Economic Evaluation for Poly(3-Hydroxybutyrate) Production by Fermentation. Bioprocess Eng. 1997, 17, 335. [Google Scholar] [CrossRef]
Disclaimer/Publisher’s Note: The statements, opinions and data contained in all publications are solely those of the individual author(s) and contributor(s) and not of MDPI and/or the editor(s). MDPI and/or the editor(s) disclaim responsibility for any injury to people or property resulting from any ideas, methods, instructions or products referred to in the content. |
© 2025 by the authors. Licensee MDPI, Basel, Switzerland. This article is an open access article distributed under the terms and conditions of the Creative Commons Attribution (CC BY) license (https://creativecommons.org/licenses/by/4.0/).