Article

Quality Assessment and Classification of Feedstock for Bioenergy Applications Considering ISO 17225 Standard on Solid Biofuels

Department of Agricultural, Food and Environmental Sciences, Università Politecnica Delle Marche, 60131 Ancona, Italy
*
Author to whom correspondence should be addressed.
Resources 2023, 12(6), 69; https://doi.org/10.3390/resources12060069
Submission received: 4 April 2023 / Revised: 2 May 2023 / Accepted: 25 May 2023 / Published: 29 May 2023

Abstract

:
Biomass materials play a key role in the renewable energy market as they can serve as a suitable alternative to fossil fuels. However, the quality of the material entering bioenergy plants is often a cause of technical concern. Biomass quality assessment is crucial not only for energy characterization but also for environmental and operational aspects. The goal of this study is to characterize and classify the biomasses used by Italian power plants with reference to the quality classes stated by the ISO standard 17225:2021. A further objective is to verify the ability of the standard to classify heterogeneous and specific biomasses. In this study, more than 900 biomass samples were analyzed. The samples were collected from several Italian power plants with >5 MWe between 2010 and 2020, and the most important physical and chemical parameters were analyzed according to the international standards of reference. The results of the analyses were collected in a large dataset used for subsequent statistical analyses. Statistical analyses applied are Principal Component Analysis and Pearson correlation maps, which showed that the ash content is a fundamental and ideal parameter to assess the biomass quality. Results obtained demonstrate that herbaceous biomasses are of low quality mainly due to the high ash content; a relatively low ash content was found for woody biomasses.

1. Introduction

During the 20th and 21st centuries, the increase in the global population coupled with a shift towards decarbonization led to increased demand for renewable energy to sustain the global community Hence, there has been the need to find reproducible and unlimited energy sources to replace fossil fuels [1,2,3,4,5,6,7,8,9,10,11]. In Europe, biomass sustainability began to be discussed with Directive 2009/28/EC which sought to promote the use of energy from renewable sources where biomass plays an important role. The depletion in fossil feedstocks, increasing oil prices, and the ecological problems associated with CO2 emissions are forcing the development of alternative resources for energy, transport fuels, and chemicals: the replacement of fossil resources with CO2 neutral biomass [8,9,10,11,12,13,14,15]. Furthermore, renewables are seen globally as the main transformers of the energy mix, becoming the first source of electricity as early as 2027 with a critical role of bioenergy as an integrator of wind and solar PV power [16]. Indeed, as expected by the International Energy Agency (IEA), renewables consumption for heating purposes is expected to increase by almost 33% between 2022 and 2027, reaching a share of 14% manly due to bioenergy (biomasses and biofuels).
According to the EU and several authors [17,18,19,20], the use of biomass is crucial for achieving the objectives of climate strategies and targets stated by 2030, even though biomass materials are represented by a highly heterogeneous set of biogenic materials of different origins (e.g., forestry, sylvicultural, agricultural, aquatic, food), often difficult to standardize and model. Among the existing biomasses, woody biomass is certainly one of the most promising and with a greatest potential. It is available in many forms (dedicated and residual biomass) and in all parts of the world, with relatively constant and predictable energy production [21]. The biomass heterogeneity is one of the main problems encountered in its use in power plants, as it affects its quality for energy purposes. To overcome this problem, over the years, technical documents and international standards have been produced such as the technical standard ISO 17225-1:2021. The main purpose of this standard is to classify the raw biomass and specify the physical and chemical and other quality aspects of the different biofuels (woody and non-woody biofuels) derived (the so-called standardization process).
Considering that any feedstock can be considered a source of energy (directly) or a feedstock for generating higher quality biofuels, knowledge of the most limiting parameters is essential.
The standardization (from raw biomasses to graded biofuels) according to quality classes is valid for various solid biofuels such as pellets, wood chips, briquettes and firewood, and depends largely on feedstock origin and feedstock analytical parameters (such as ashes) as reported in Table 1.
The standard underlines the importance of the origin of the biomass from which the solid biofuel is produced, codifying it within a classification based on a four-digit system in which many vegetable raw materials are recognized, including aquatic ones. ISO 17225 is divided into nine parts, and the subject of the origin of raw biomass is covered in Part 1. With respect to biofuels, the reference standard distinguishes Part 2 and Part 3 for densified woody biofuels (pellet and briquettes); Part 4 and Part 5 for less processed biofuels (woodchips and firewood, respectively); Part 6 and Part 7 for non-woody densified biofuels (non-woody pellet and brickette, respectively); Part 8 and Part 9 for other biofuels intended for commercial or industrial use (thermally treated densified biofuels and wood chips/hog fuel, respectively). For each biofuel group, ISO 17225 sets specific quality classes (e.g., for woody pellet, classes A1, A2 and B), even if some biomasses included by the ISO 17225-1 in Italy fail to comply with the limits of relative high to medium quality biofuels. The reason for the introduction of other standards (from Part 6 to Part 9 of ISO 17225) is precisely to allow the standardization and valorization of biomass that could be considered of “lower quality” (compared to wood pellet). The identification of these “low quality” biofuels made of residues and residual biomasses could foster new market prospects, allowing the various operators in the sector to assess their performance and behavior in thermal plants, assigning the right value to the raw material and avoiding technical and environmental problems [22,23]. The correct valorization of biofuels, both woody and not, is highly dependent on the absolute quality of biomass input to the system, and therefore on the value of the various physical, chemical and energy parameters determined by the analytical process [22,23,24,25,26,27,28,29] and mainly on the ash content as evidenced by various studies [17,30,31,32]. To this end, the Biomass Lab of the Università Politecnica delle Marche has been engaged for several years in determining the chemical–physical characteristics of biomass from various power plants on the Italian territory to measure its quality and predict its performance based on its energy use. The aim of this study is to assess the chemical–physical quality of biomass in relation to the 17725 series of the ISO standard. The goal of the study is to critically compare the classification provided by the legislation in terms of raw biomass with the analytical characteristics of different groups. The initial hypothesis is that a single group of biomasses should correspond to a set of relatively narrow and characterizing analytical parameters. The main parameters taken into consideration are the content of carbon, hydrogen, oxygen, moisture, ash (with a particular focus), chlorine, sulfur, nitrogen and gross calorific value [33,34,35,36,37,38,39,40,41,42,43]. The case study presents several points of novelty with respect to the literature. First, it describes in a representative way the biofuels used in Italian thermal and thermoelectric plants; it also provides an important update and knowledge increase with respect to some key parameters such as hydrogen. Precisely for the latter, the legislation allows the use of secondary data aimed at calculating the lower calorific value and, although the literature is relatively rich in such information, it is not easy to find representative data on the scale of thermoelectric plants.

2. Materials and Methods

2.1. Samples Description, Collection, and Preparation

Data in this study come from an exhaustive biomass database realized in years by the Biomass Lab from Università Politecnica delle Marche “http://www.laboratoriobiomasse.it (accessed on 25 January 2023). The laboratory mainly carries out analysis and consultancy activities for private companies. Over time, the collection of analytical results has built up a private internal database mainly represented by analyzes of samples of solid biofuels from various operators in the sector, in particular power plants, distributors, and operators in the pellet supply chain.
In the period from 2010 to 2020, during a long-term quality monitoring plan performed in several power plants located all over Italy, thousands of biomass samples were collected. Almost all the samples considered in this study (929) feed power plants between 5 and over 20 MWe. These materials come from agricultural and farming activities, food processing industry, silvicultural practices (branches and plant tops), pruning, management of rivers, gardens, and parks. According to the classification of origin and sources of solid biofuel as shown in the technical standard ISO 17225-1, the biomass types considered in this study are divided, as reported in Table 1, into three main groups, as specified in Table 1 of the standard: herbaceous biomass (HB), biomass from food processing industry, also called “fruit biomass” (FB), and woody biomass (WB). “Aquatic biomass” and “blends and mixtures”, the other main groups depicted in the ISO standard, are not considered in this study, because we do not have an adequate number of samples for their statistical analysis.
Within the selected groups, there are subgroups that represent the actual type of biomass analyzed. For example, WB includes subgroups such as bark, woodchip, residues from maintenance of urban green, and pruning. Hence, Table 2 provides a list of the residual biomass considered in this study grouped into main groups and subgroups. The latter is associated with a short description accompanied by the respective abbreviation for a more suitable reading and the corresponding ISO code from the aforementioned standard. A single ISO code can be applied to different subgroups.
Considering that the study includes samples from the largest biomass thermoelectric plants in Italy (in central and southern Italy and Sardinia), they can be seen as representative of the national scene. In addition, because of the high number and the large national distribution, they cover the variability of the biomass typology.
All of the samples were sent to the Biomass Lab sealed in hermetic plastic bags to preserve the moisture content, the quality and the characteristics. The samples were prepared for chemical–physical analysis after being dried and milled according to ISO 14780.
It should be noted that all these measurements have been carried out over the years by the same laboratory following the procedures tested and validated by round robin on solid biofuels on biomass samples from all over the national territory. As a result, this study is instrumental in providing an overview of the biomass quality characteristics in Italy. It could be considered a particularly interesting aspect considering the international technical regulations regarding the products released over time (ISO) and the related integrations developed by the Italian Standardization Institute (UNI).

2.2. Laboratory Analysis

All the analyses were carried out following the technical standards on solid biofuels. Table 3 provides a list of methods and investigated parameters associated with the relative ISO standard and the laboratory equipment used.
To further characterize the biomass under investigation and to provide the tools for their qualitative separation, the variables have been calculated subsequently, including (C/N)d.m., Cox, (H/C)atr and (O/C)atr, whose function is now briefly discussed.
The carbon/nitrogen mass ratio (C/N)d.m. is both a qualitative and an environmental parameter which provides an estimate of the potential burnable C in biomass in relation to N, which does not significantly produce energy and becomes NOx. In general, the thermochemical conversion for biomass with values > 30 and the biochemical conversion in biomass digesters for biomass with values < 30 are preferred.
The average carbon oxidation number for a biomass Cox defines the extent to which a biomass is oxidized and consequently indicates its energy content. Depending on the hydrogen, oxygen and carbon content, Cox varies with molecule composition. Considering the typical atomic ratio of hemicelluloses, cellulose, lignin and triglycerides compounds, it provides a further differentiation in biomass variety on the basis of their chemical composition [6].
The atomic ratios of hydrogen/carbon (H/C)atr and oxygen/carbon (O/C)atr are essential for plotting the van Krevelen diagrams which are used to characterize fuels and provide information on the differences in the carbon, hydrogen and oxygen compositions. The lower the ratios, the higher the energetic content [7,8,9].
The equations used for calculating these parameters are shown below.
The carbon–nitrogen ratio:
(C/N)dm = C%dm/N%dm,
where C%dm and N%dm represent carbon and nitrogen content expressed as percentage on dry matter.
Calculation of Cox:
For the calculation of Cox, evaluating Ca, Ha and Oa is necessary. They represent the number of moles of atoms in each 100 g of biomass.
Ca = C%dm/Caw,
Ha = H%dm/Haw,
Oa = O%dm/Oaw,
where Caw, Haw and Oaw are the atomic weights, respectively, of carbon, hydrogen and oxygen, while C %dm, H %dm and O %dm are carbon, hydrogen and oxygen content expressed as percentage of dry matter.
Taking into account the chemical bonds, Cox is calculated for every single record as
Cox = (2 Oa − Ha)/Ca.
Hydrogen carbon and oxygen carbon atomic ratio (atr) are calculated following Equations (6) and (7):
(H/C)atr = Ha/Ca,
(O/C)atr = Oa/Ca.
By dividing the moles of 2 different elements present in a 100 g of substance between them, the mass in grams vanishes, and the result is their atomic ratio.

2.3. Statistical Analysis

The database for this study was prepared based on the results obtained from 929 samples. As explained, we tried to provide an exhaustive picture of the variety of biomass for energy purposes present at a national level.
Naturally, certain biomass typologies are more commonly used compared to others. For example, woodchips are probably the most used biomass in energy production plants, while olive stones are less common. This, in turn, leads to the numerical disproportion in the species of biomass analyzed by the laboratory over the years and, accordingly, in the subgroups of this database. Statistical analysis of the results obtained after analysis was performed beginning with a descriptive statistic. Mean values, standard deviation, and minimum and maximum values for the main parameters were calculated considering first the main groups and then all the subgroups.
The calculated variables were used to build graphs illustrating the differentiation of biomass on a chemical basis. One was composed considering the averages of (C/N)dm of the several subgroups, and the other considering (H/C)atr and (O/C)atr of all the samples (van Krevelen diagrams).
To evaluate the correlation among the parameters considered in this study, Principal Component Analysis (PCA) and Pearson correlation map were performed. All the observations obtained were considered as components of a matrix, where the chemical–physical parameters analyzed and the ones obtained after calculation (see Section 2.2) are the variables. PCA was used to search for similarities among the samples according to their chemical–physical properties, highlighting the correlations among the analyzed parameters and defining clusters that could be visualized in a graph. The Pearson correlation map was used to show the correlation matrix among the different variables as its results were particularly useful for summarizing large data.
An analysis of variance within the populations was also conducted, considering both the main groups and the subgroups within a main group, verifying whether there were any statistical differences for the same parameter. Therefore, we analyzed the distribution of every parameter by means of the “Normality test” [44] conducted with the Kolmogorov–Smirnov method. Finding out a non-Gaussian distribution for all of them, the Kruskal–Wallis test, a non-parametric method for testing whether samples originate from the same distribution, was used as an alternative to parametric one-way ANOVA [45]. The post hoc test used for the assignment of the significance letter was Fisher’s Least Significant Difference (LSD), with a p-value of 0.05.
Considering the entire database, special boxplots were constructed, the so-called “violin plots” which, compared to the first one, add the information relative to the density distribution of the samples. Limits of the quality classes, defined based on the ash content, for different specific kinds of biomass as reported by the 17,225 series of the ISO standards were then added to these graphs. The decision to report and focus the analysis only on the ash content is based on the fact that other studies have already highlighted the correlation of this parameter with others (such as chlorine, sulfur and metals) and the predominant weight of the ash content in determining the overall quality of the biofuel [34]. Despite this, other qualitative parameters were also reported in the results.
For statistical data analysis, the following calculation software were used:
-
Matlab rel. 2020b, developed by Mathworks;
-
Minitab ver 16, developed by Minitab, LLC;
-
R-studio ver. 1.4.1106, an integrated development environment (IDE) for software R, distributed with the GPU license.

3. Results

3.1. Descriptive Analysis and the Kruskal–Wallis Test

The results of the sample analysis are reported in the following tables, where descriptive statistics for the quality parameters are provided. Table 4 considers the division of biomass material based on the three main groups, while the others consider the subgroups included in every leading group (HB—Table 5, FB—Table 6, WB—Table 7).
The descriptive statistic parameters included are the median, mean, standard deviation, maximum, and minimum. In addition to the groups, the LSD test significance letter was added to show the statistical differences and similarities between populations for a single parameter.
The results are in line with the scientific literature and dedicated databases [2,24,36,37,45]. WB are generally less rich in A, N, Cl and S than HB; M values are affected by a wide variability due to the different types of products, the different periods of production and delivery (summer/winter), different treatments and management in the supply chain. As expected, the most homogeneous is SW, from which a woody pellet can be obtained. FB, despite having high A, M and N values, appears to be a good group of fuels, with high GCV (>20000 J/g) and good homogeneity between samples. In general, subgroups with the highest standard deviation and the highest max–min range are those intrinsically more heterogeneous, coming from different origins and most subject to contamination, such as PrUG, Brk and GM.

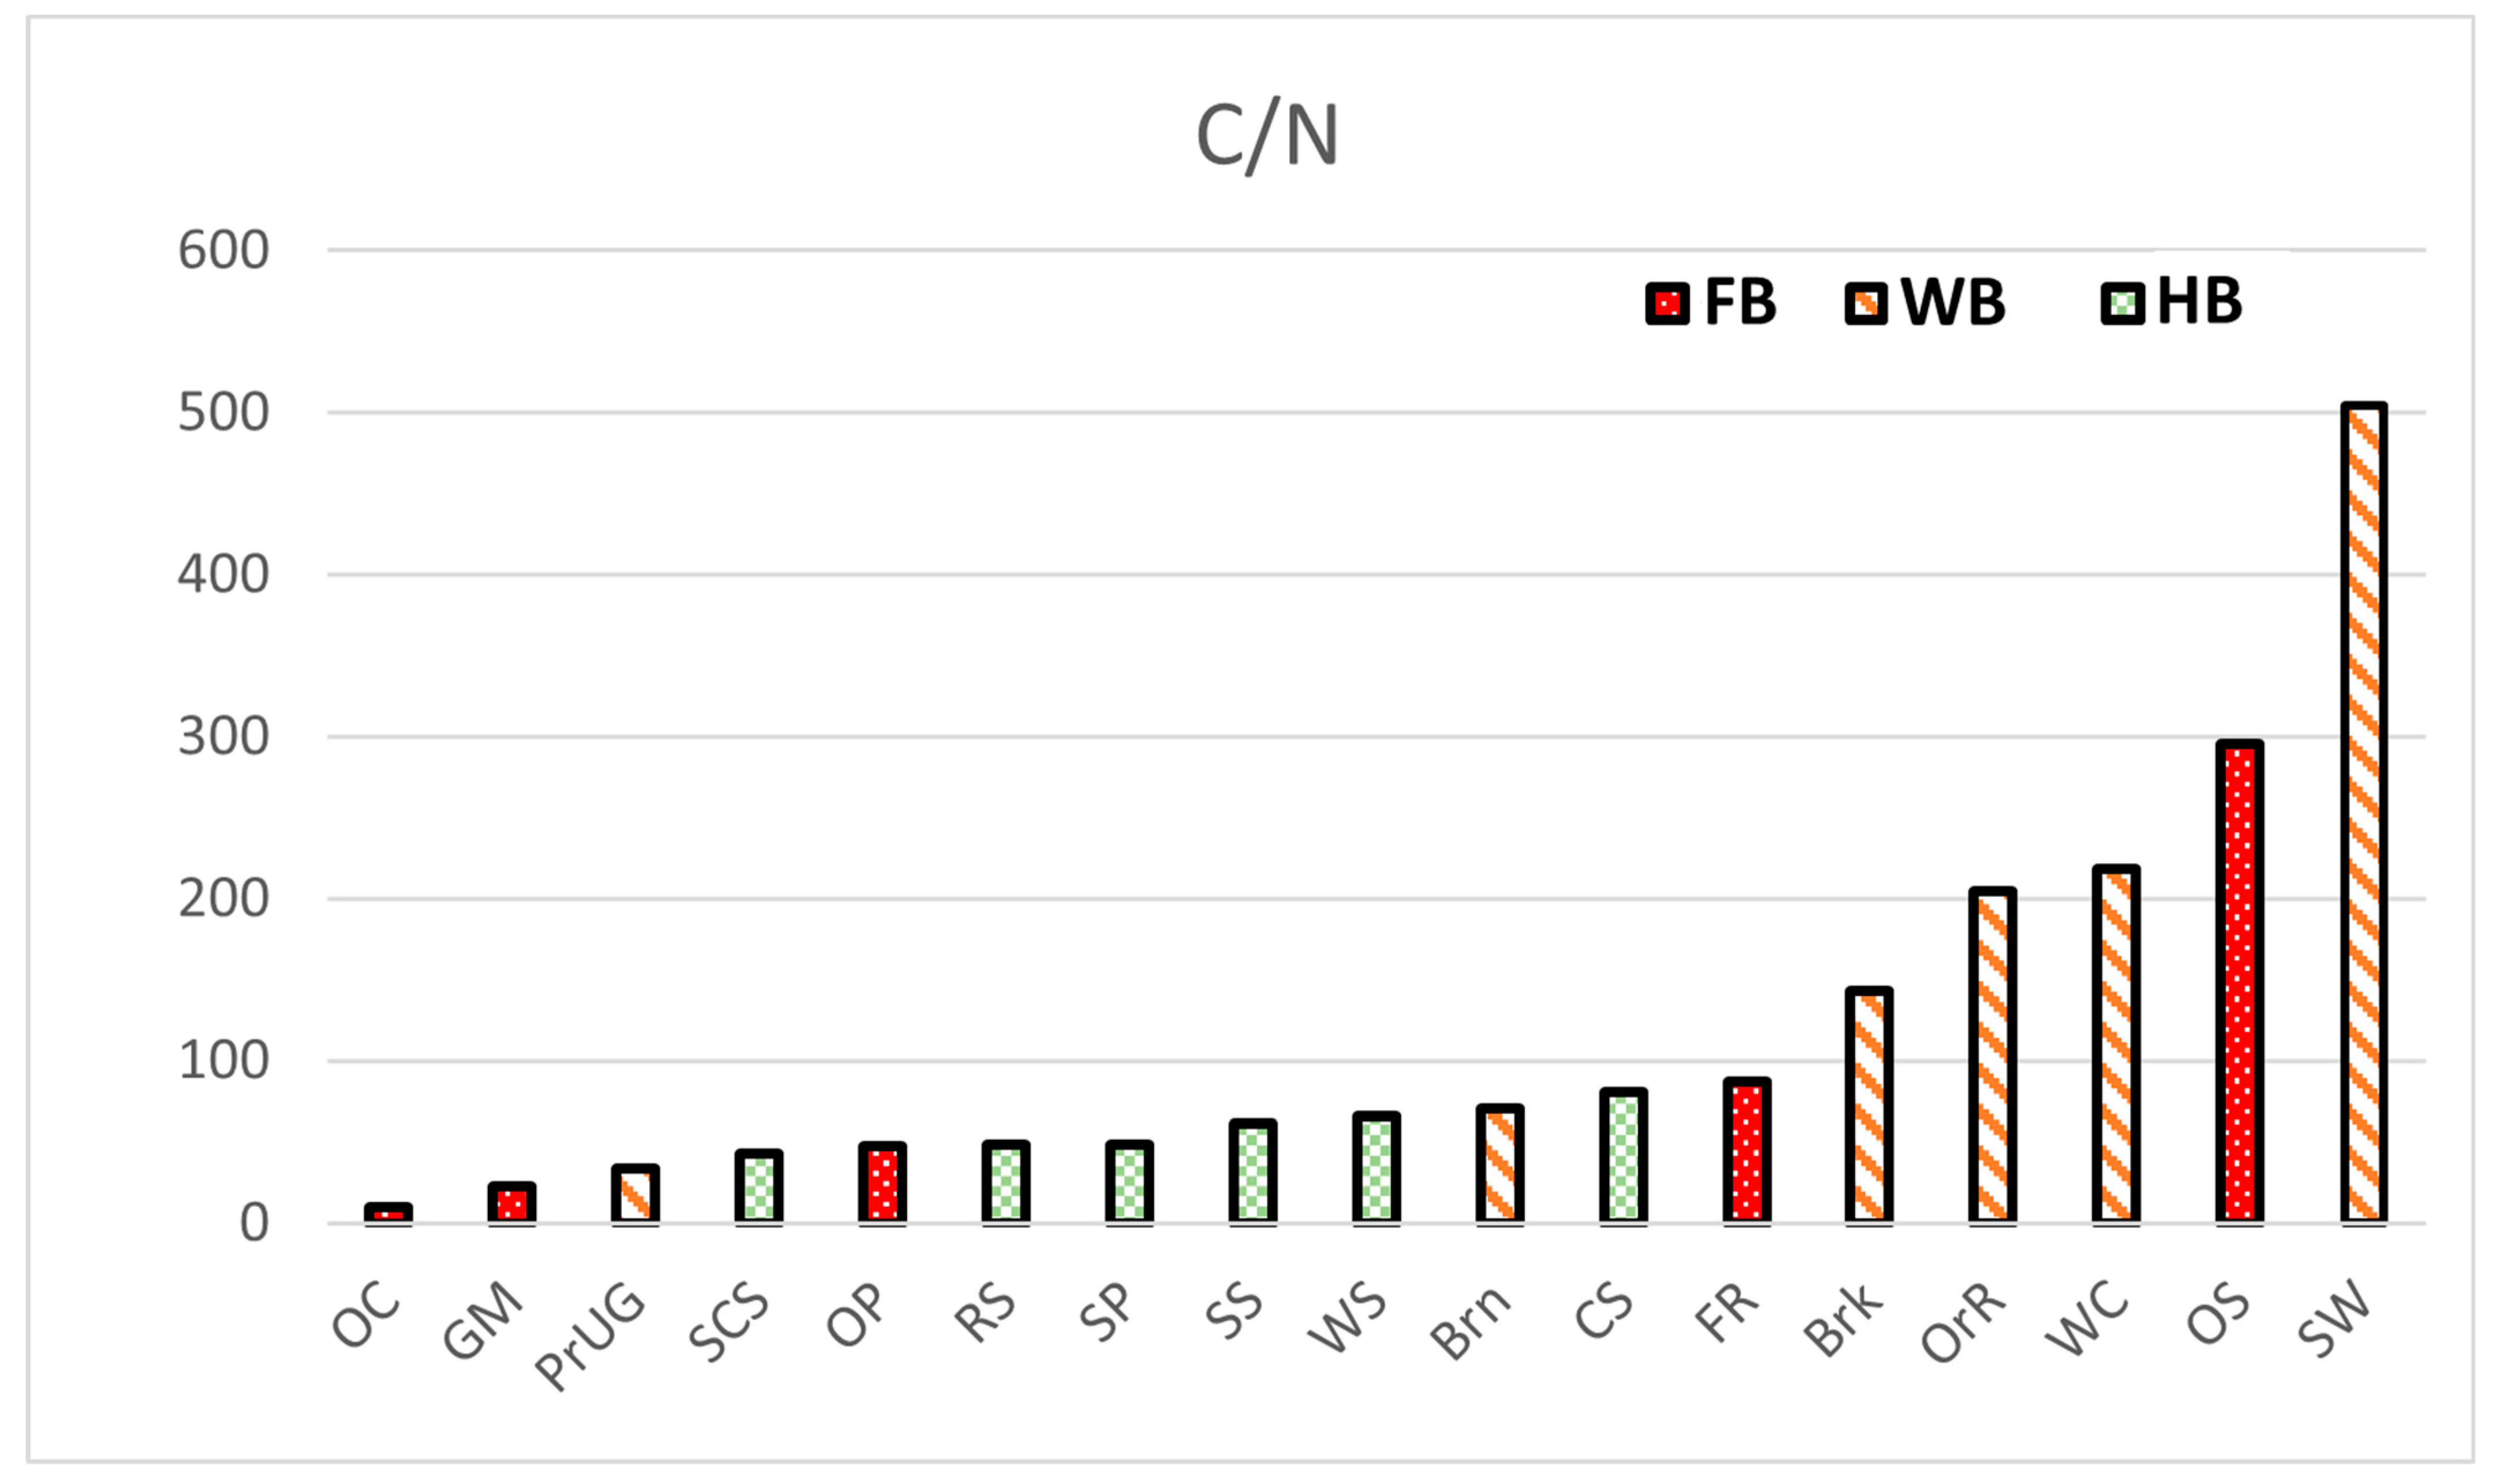
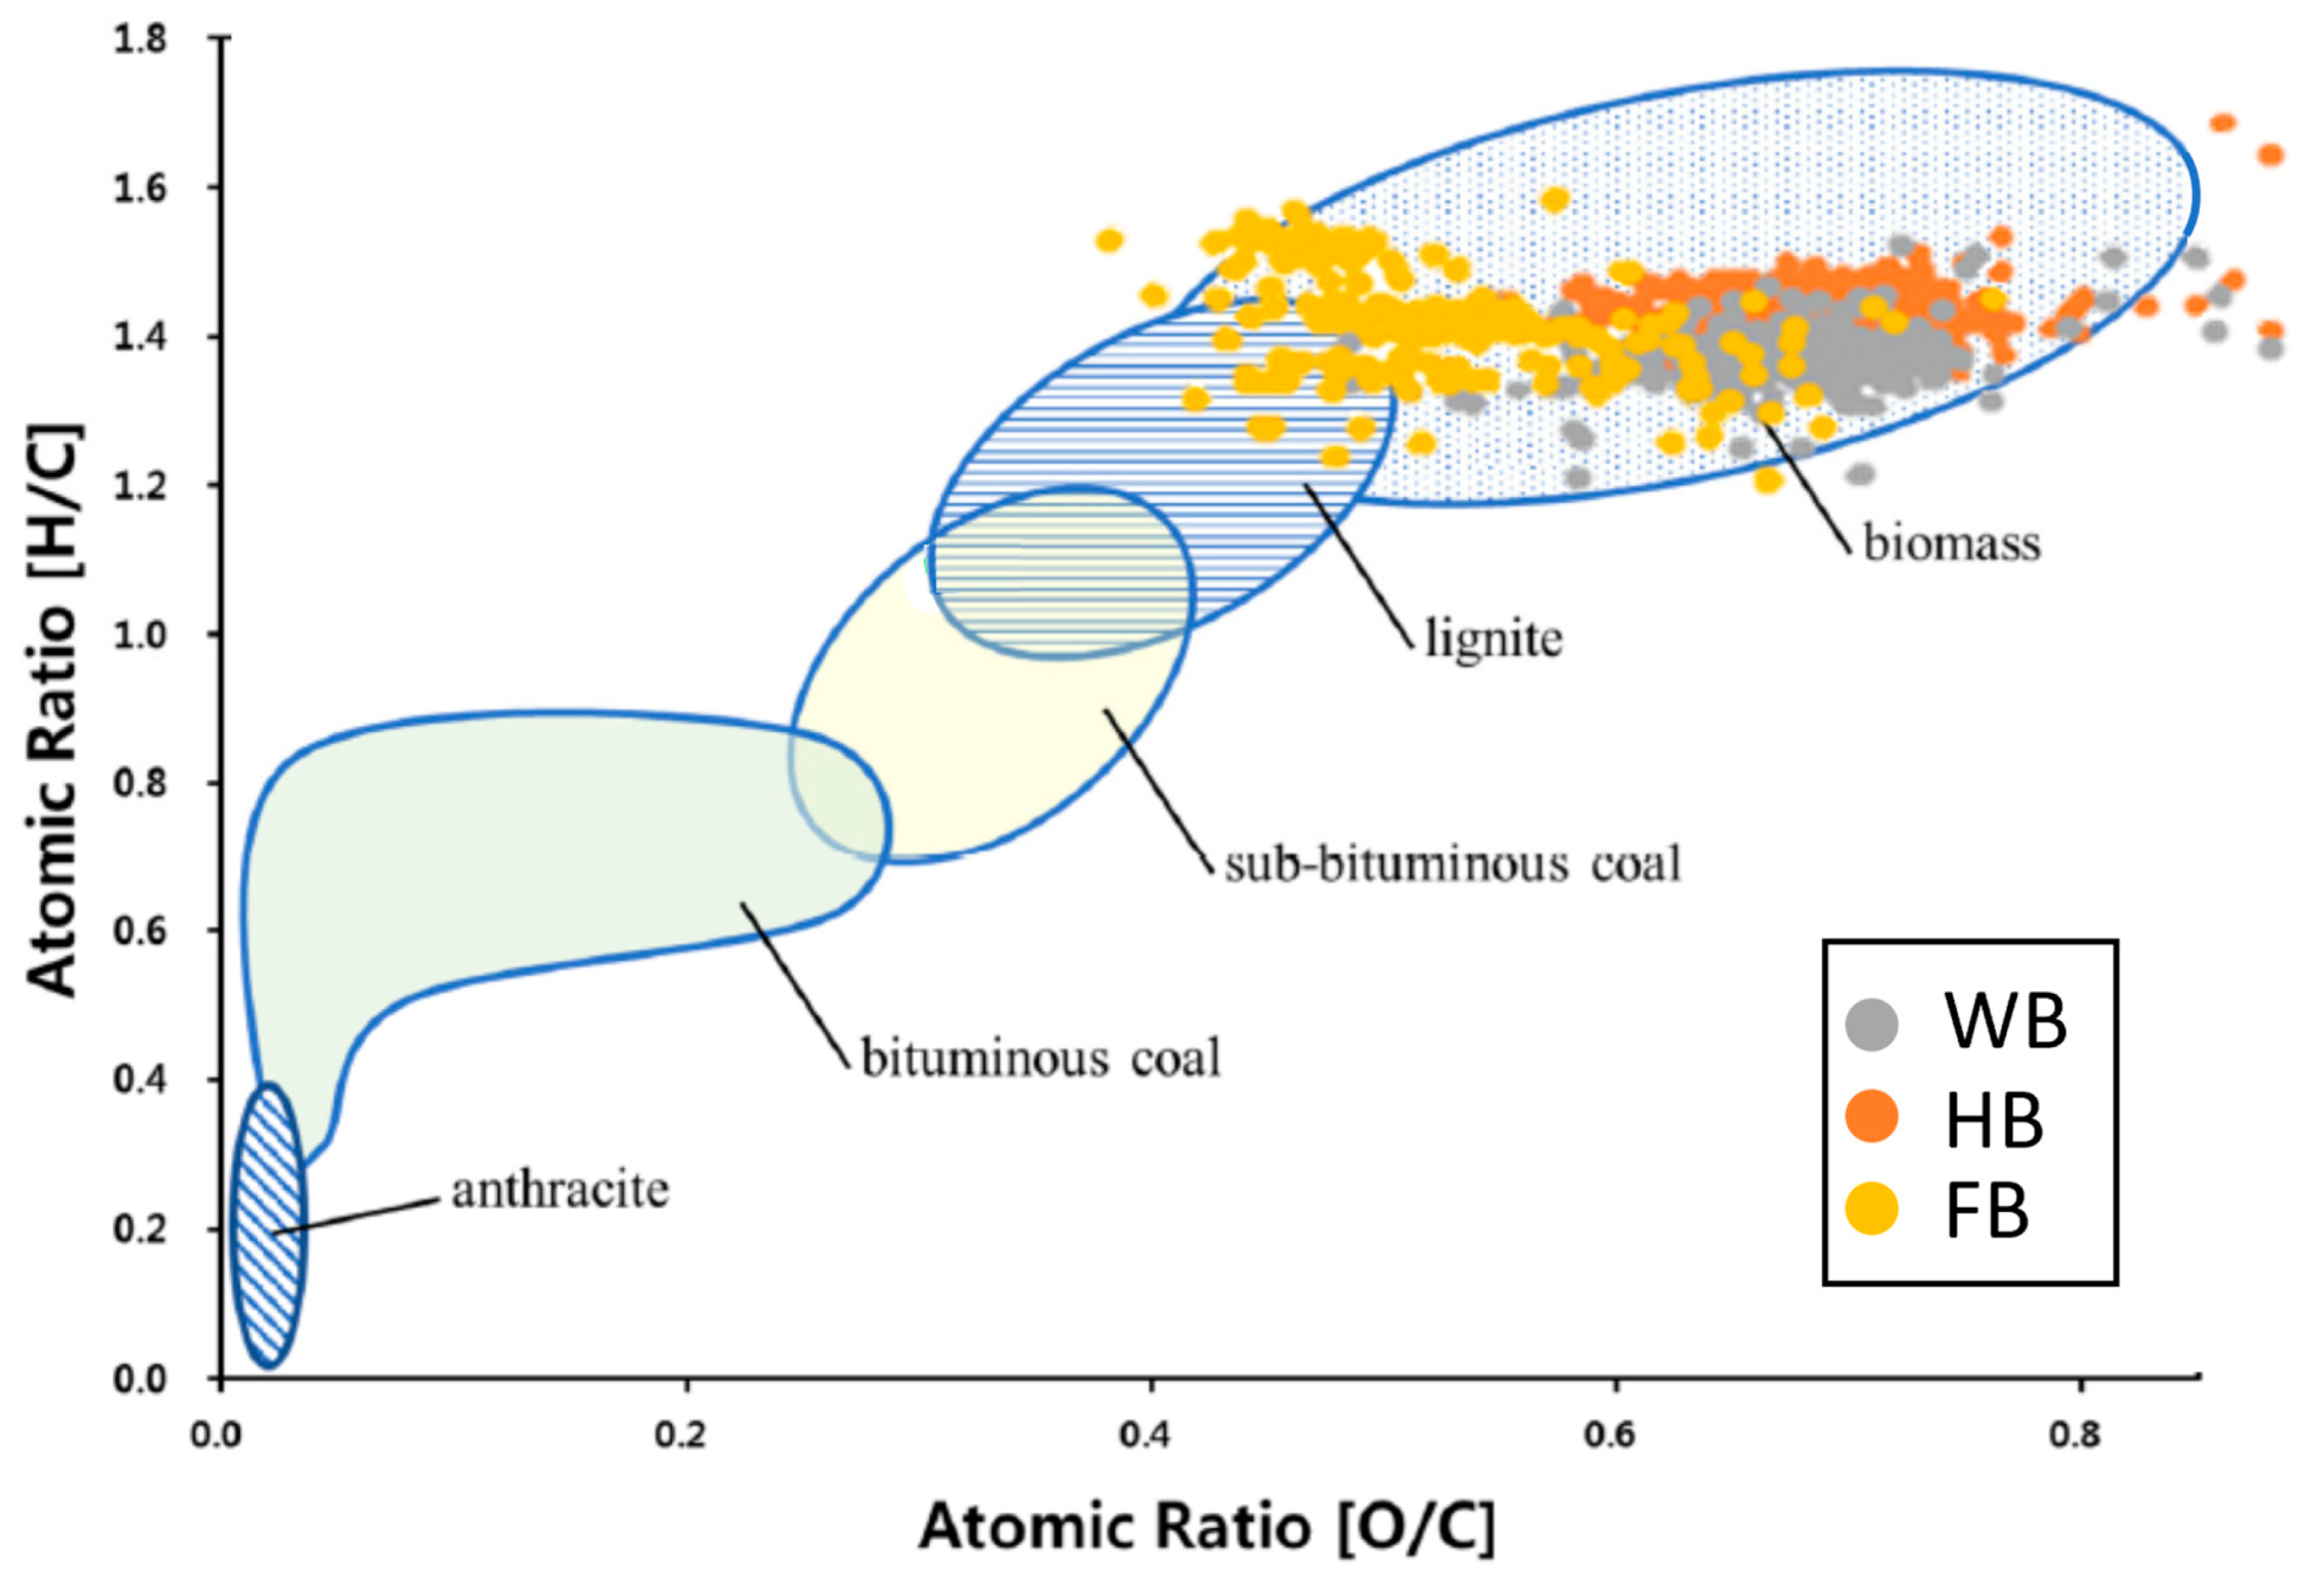
3.2. Diagrams Based on Elementary Analysis (C/N, van Krevelen)

Values of the C/N ratio were used to build the histogram in Figure 1. The values, relating to the various biomass subgroups, are entered in an ascending order from left to right.
C/N, as expected, is, on average, higher for WB. HB groups are positioned in the middle, while OS stands out among the FB, close to the higher value (between stem wood residues and woodchip). It should be noted that, even if a substantial Gross Calorific Value is envisaged for OC and GM (as reported in Table 6), the high content of N could cause problems in combustion, linked to the high NOx emissions. This suggests that these biomasses are difficult to exploit through thermochemical processes.
The calculation of (H/C)atr and (O/C)atr for all the samples permitted to plot the Van Kreleven diagrams as shown in Figure 2. The results are compared with another diagram taken from the literature [25], which depicts the position assumed in the graph from coal and other solid fossil fuel and the area related to biomass samples. This permits to correlate the data obtained from biomass and to consider its position with respect to a class of fuels with higher GCVs and bulk energy.
Results show similarities in the positioning of biomass. It lies in both cases (the literature and case study) approximately between (O/C)atr = 0.4–0.8 and (H/C)atr = 1.0–2.0. Regarding the biomass samples of this study, it is worth noting that although the various groups are close together in the same area, the separation is quite clear. HB seem to show higher (O/C)atr, WB lies in the middle, while FB is shifted more to the left, with most of these values between 0.4 and 0.6. These results reflect an important differentiation in terms of chemical composition and level of oxidation of several groups of biomasses.

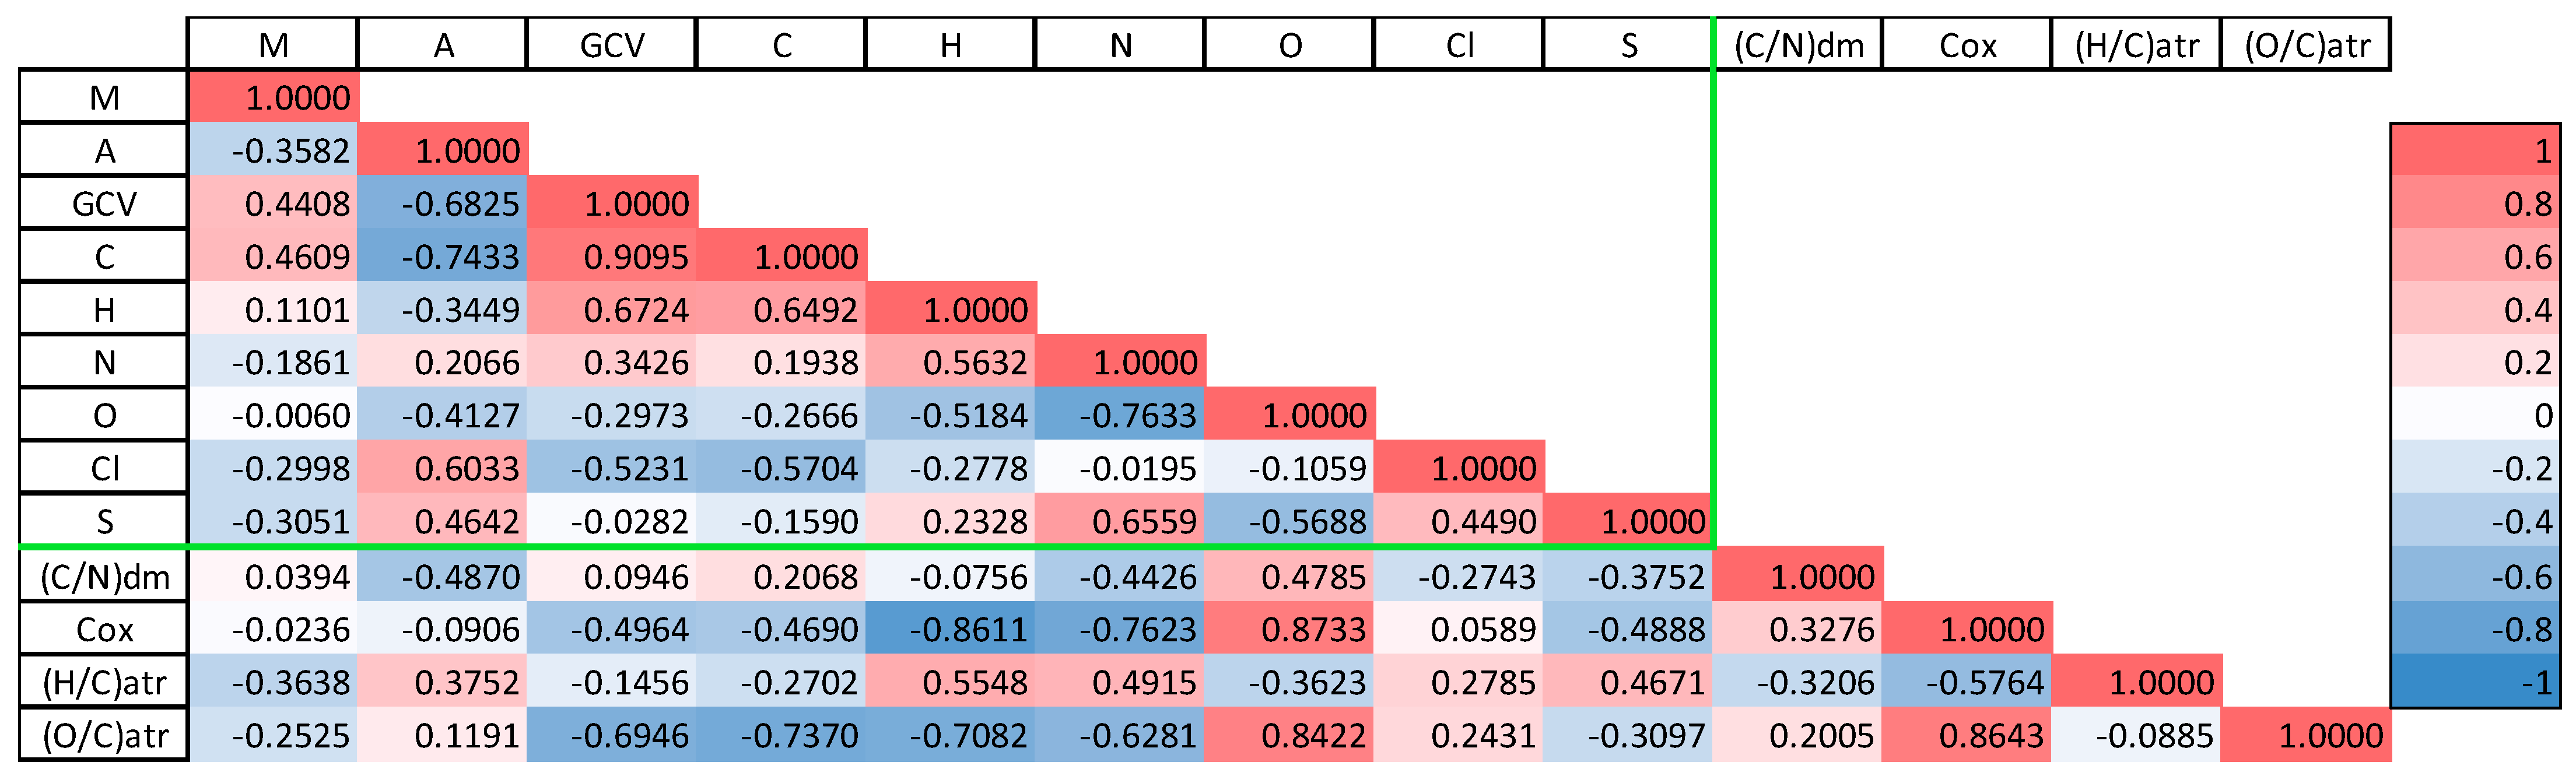
3.3. Principal Component Analysis and Pearson Correlation Map
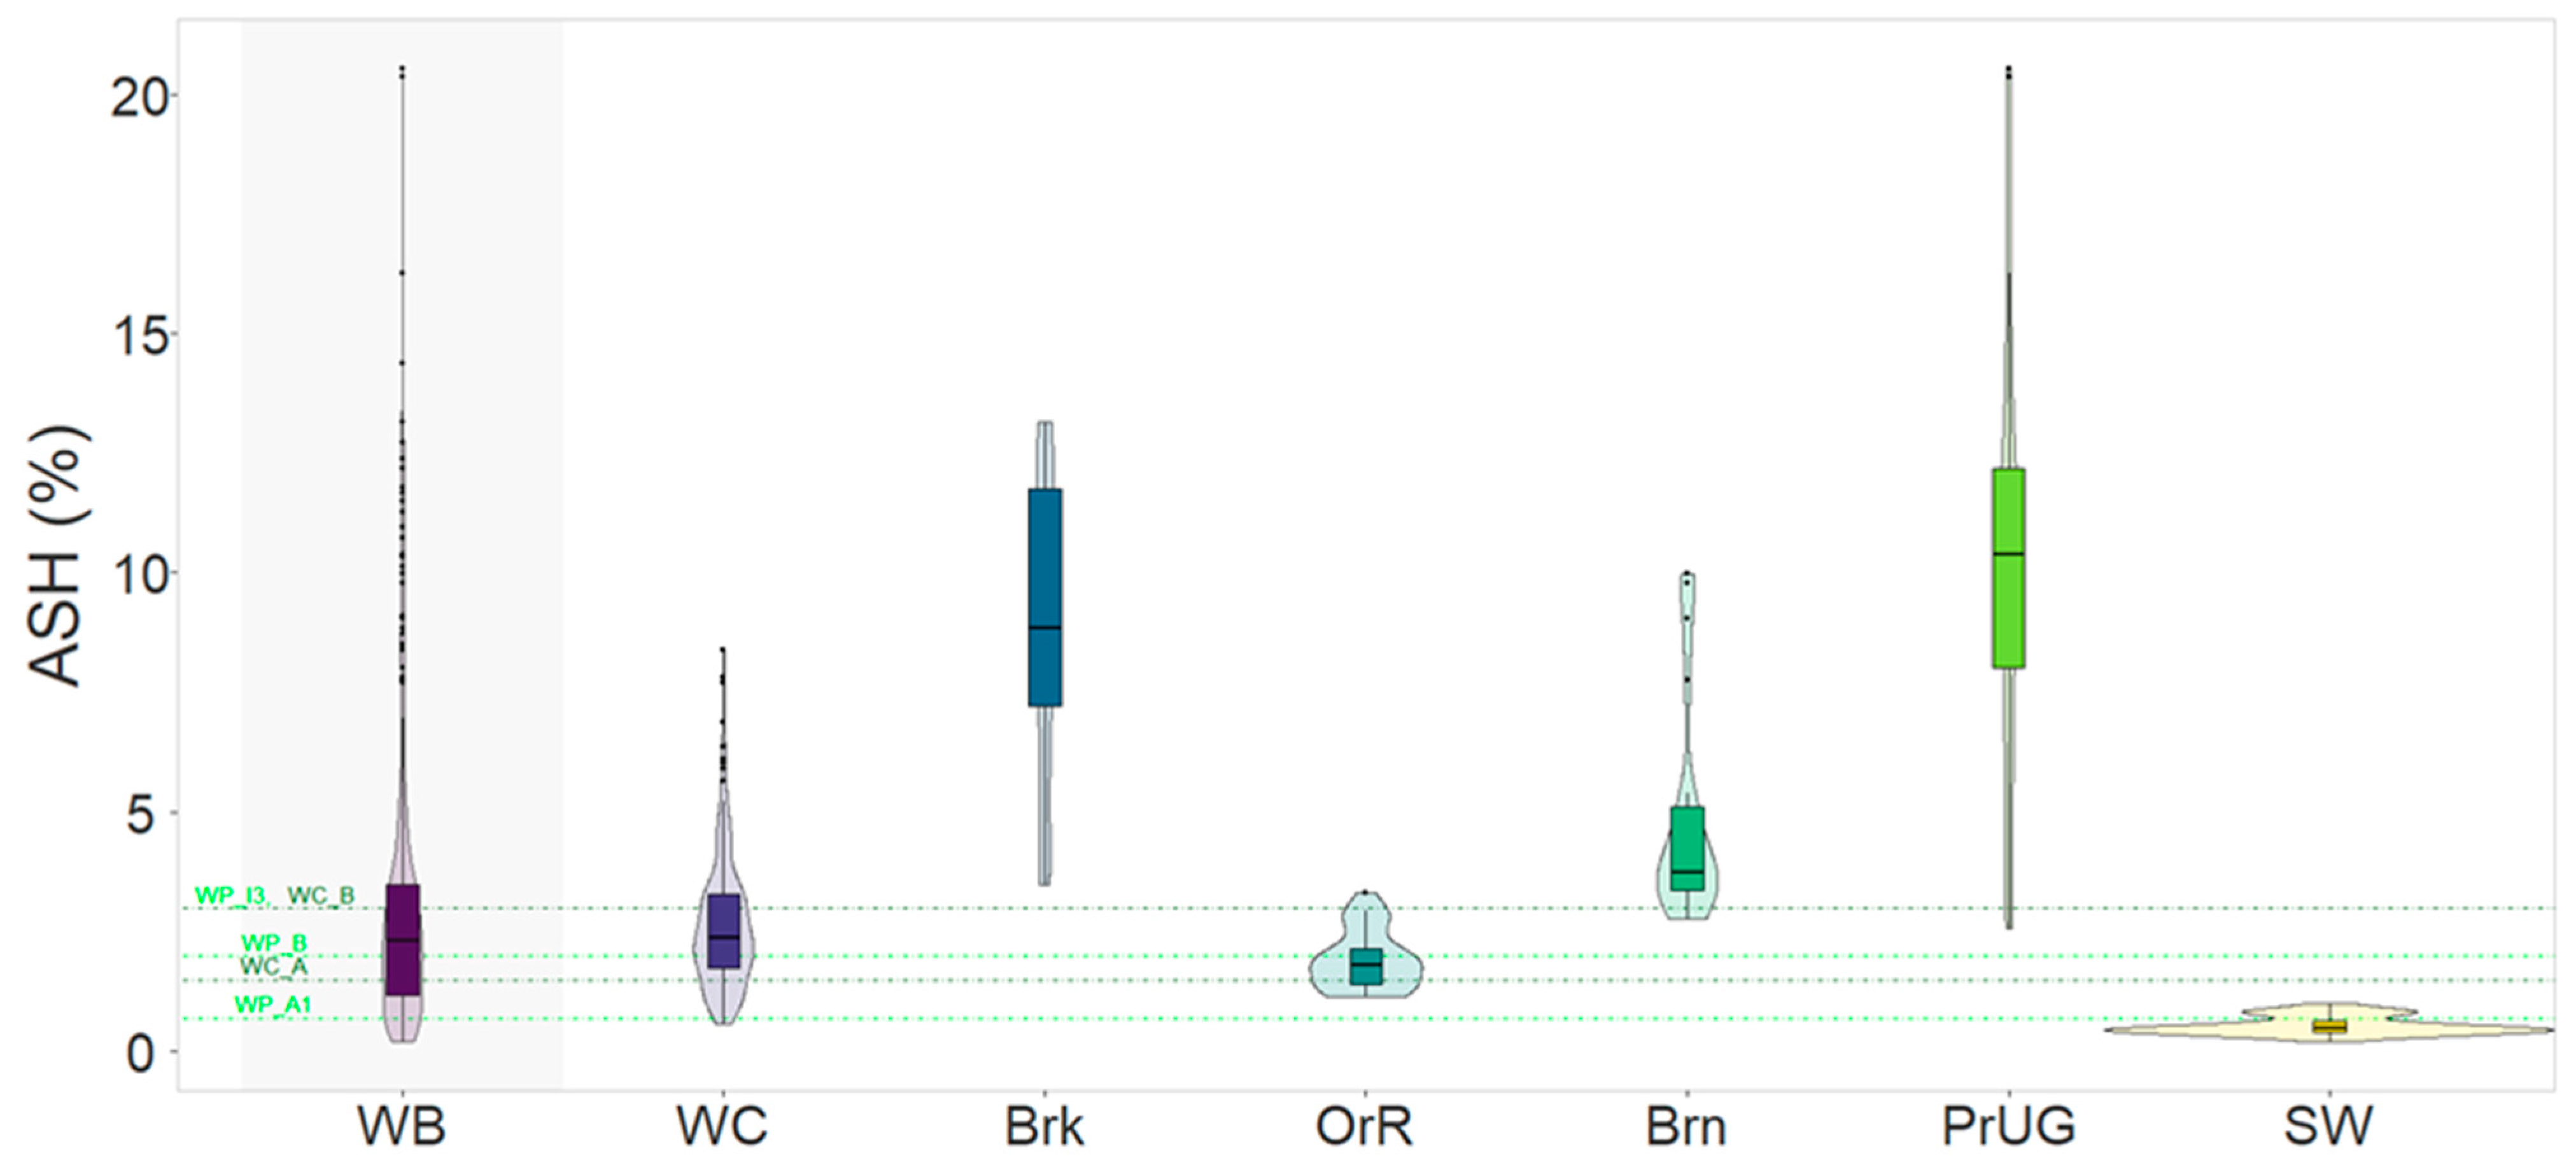
PCA was carried out on the general dataset matrix to analyze the dataset variability and sample distribution based on pattern similarity and to highlight the separation between WB, FB and HB. Figure 3 reports the biplot of the first two principal components (PCs).
The separation of the three main groups is clear. WB appears concentrated and homogenous, while FB is quite more scattered. The positive and negative quadrants of PC1 divide the HB and WB groups from the FB one. On the other hand, PC2 differentiates, in its positive and negative quadrants, two different subgroups of FB and, clearly, HB from WB.
The arrows starting from the center show how strongly each variable influences the PCs. Correlations among original variables are accentuated since the new PCs are not correlated. According to the graph, GCV, C, S, N and H are the parameters responsible for the separation of FB. PC1 appears to be highly influenced by GCV and N. That could be related to the presence of biomass such as GM which has high GCV and elevated N contents. Cl and A determine the separation of HB from other biomasses, while WB is characterized and differentiated by C/N. Both WB and HB are separated from FB with respect to Cox, (O/C)atr, and O.
Biplots were performed on the same data but without the variable. M showed no difference with respect to the others performed previously. This highlights how poorly this parameter results in differentiating various typologies of biomass and in establishing quality specifications.
To further analyze the correlations between parameters, a Pearson correlation map was plotted, as it can be seen in Figure 4.
According to Figure 4, GCV shows a high positive correlation with C (0.9095) and a high negative one with A as expected (−0.6825), and a good one with parameter H (0.6724). Curiously, GCV shows little or no correlation with C/N (0.0946). As said previously, M has no specific correlation with every other variable. Parameter A seems to be correlated with a higher presence of S (0.4642) but even more Cl (0.6033). An interesting result is the positive correlation between S and N (0.6559). Similar but opposite observations could be conducted for O and N (−0.7633). The graph also shows a moderate negative correlation between Cox and GCV (−0.4964), which could underline the greater difficulty of releasing energy for biomass at higher oxidation levels.

3.4. Violin Plots

The following figures show violin plots of the ash (A) parameter for all subgroups. The violin plots are like the box plots, but also show the probability density of the data at different values, expressed as the lateral shape of the lines. The plots were superimposed, for a qualitative comparison, on the limits expressed by the ISO 17225 series standards (for WB, FB and HB) for the main critical parameter A, a telltale indicator of biomass quality content.

3.4.1. Violin Plots for Woody Biomasses (WB)

Figure 5 shows the violin plots for woody biomasses.
Stem wood residues values are below those of any other subgroup, and their distribution is found slightly above 0%. Furthermore, all values are below the limit established for the lowest value class of pellets for commercial–residential use, class B of ISO 17225-2. Woodchips have the most similar distribution to the general one for WB. The third quartile of WC appears to be just above the limit for woodchip class B of ISO 17225-4, the lowest for commercial/residential use. Few samples of the WC subgroup exceed the ash value for class I4 of ISO 17225-9 for industrial woodchips (set at a 7% ash content). However, it should be noted that all the samples received for this biomass subgroup come from large industrial plants. Bark, as expected, has a quantity of A that goes above the aforementioned class I4 of ISO 17225-9. Urban greenery maintenance residues have a distribution of values between the first and third quartiles of around 10%, confirming that it is a biomass of little energy interest and already exploited in composting processes also considering the Italian regulatory limits. However, because of their nature, their values even at very low distributions have very high ranges. This also affects the general WB graph. Orchard residues (OrR) and branches (Brn) appear to have good quality. The upper limit of the Brn is lower than the limit of the best supplementary class (I4) of the Italian standard for woody and non-woody pellets (UNI/TS 11773) and class I2 of industrial woodchip (ISO 17225-9). The OrR appears particularly valuable as the median is below the pellet class B (2%) of the ISO 17225-2, and its values are substantially concentrated around that limit. In relation to the probability of distribution of the frequency values (violin plot halo), OrR and SW show the best conditions of restricted variability of the qualitative parameter considered, and this suggests that the 17225-1 standard correctly assigns a unique code for the classification of the relative raw biomass. WC and Brn show a higher frequency probability for lower A values, frequency which gradually decreases for higher A values (bottle shape). The variability, in this case, is due to the greater variability in the raw biomasses that make up the different samples (WC and Brn are set less specifically than, for example, OrR and SW). Brk and PrUG are the only groups characterized by a frequency distributed over very different A values, and this would suggest that for these biomasses, the classification in relation to the origin of the raw material does not reflect the specific qualitative characteristics. In particular, PrUG, according to the 17225-1 standard, would belong to the same group as OrR which, however, is much less variable than the previous one.

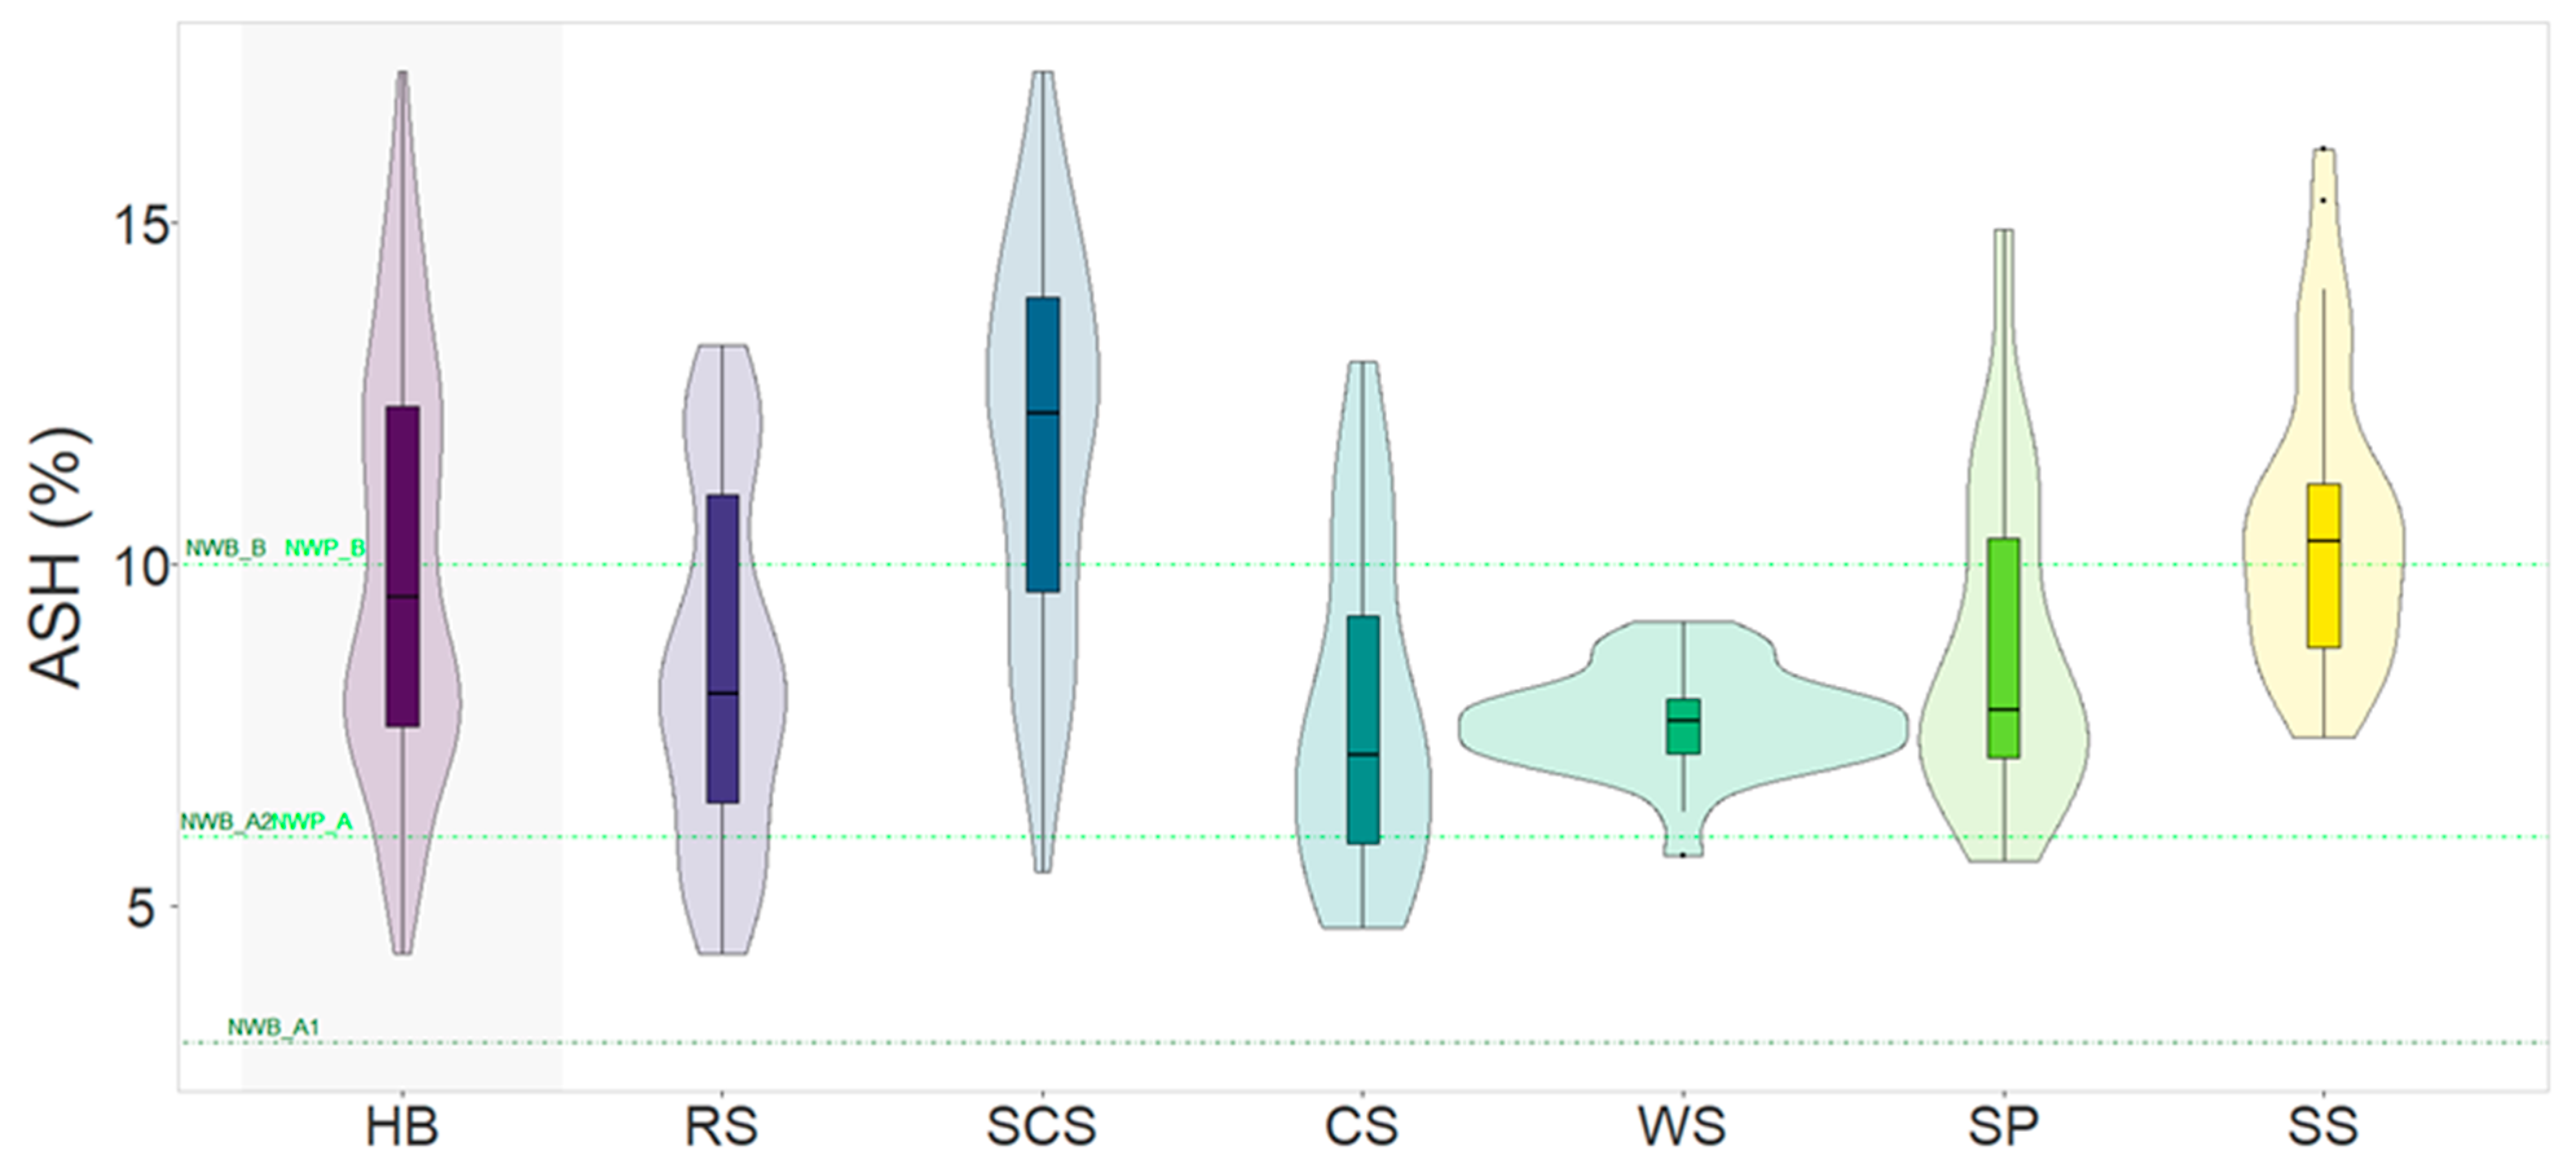
3.4.2. Violin Plots for Herbaceous Biomasses (HB)

Figure 6 shows the violin plots for herbaceous biomasses.
A significant portion of herbaceous biomass in the database of this research falls outside the upper limits for A of all the classes for non-woody brichette specification and almost 50% exceed the upper limits of the class B for non-woody brichette and pellet specification. Only a negligible proportion of the samples falls within the limits of class A2 for non-woody brichette and pellet. Among the biomass subgroups, it is mainly the SS that shows a distribution toward high A values. In general, except for WS, all subgroups show very broad data distributions. It is conceivable that part of this variability is related to the intrinsic nature of the biomass composed in some cases of different plant components (inflorescence, leaf, stem parts, roots). However, other factors such as the biomass harvesting conditions (type of medium, operator and soil conditions) which affect the presence of soil and the storage phase in the field and in the plant during which the effects of product degradation can play a role determine important changes in the biomass properties. In general, the ranges established by the limits of the current technical specifications are in line with the distribution of HB for ash content and allow for a suitable differentiation of quality levels. Following the same discussion conducted previously on woody biomass, for biomass belonging to the HB group, WS shows a frequency concentrated on slightly variable A values, a sign that the 17225-1 standard correctly assigns the code of origin of the raw biomass not only in terms of traceability but also in terms of quality. All the other groups, albeit with more distributed frequencies, show a relative specificity in terms of quality as well as the origin of the raw biomass.

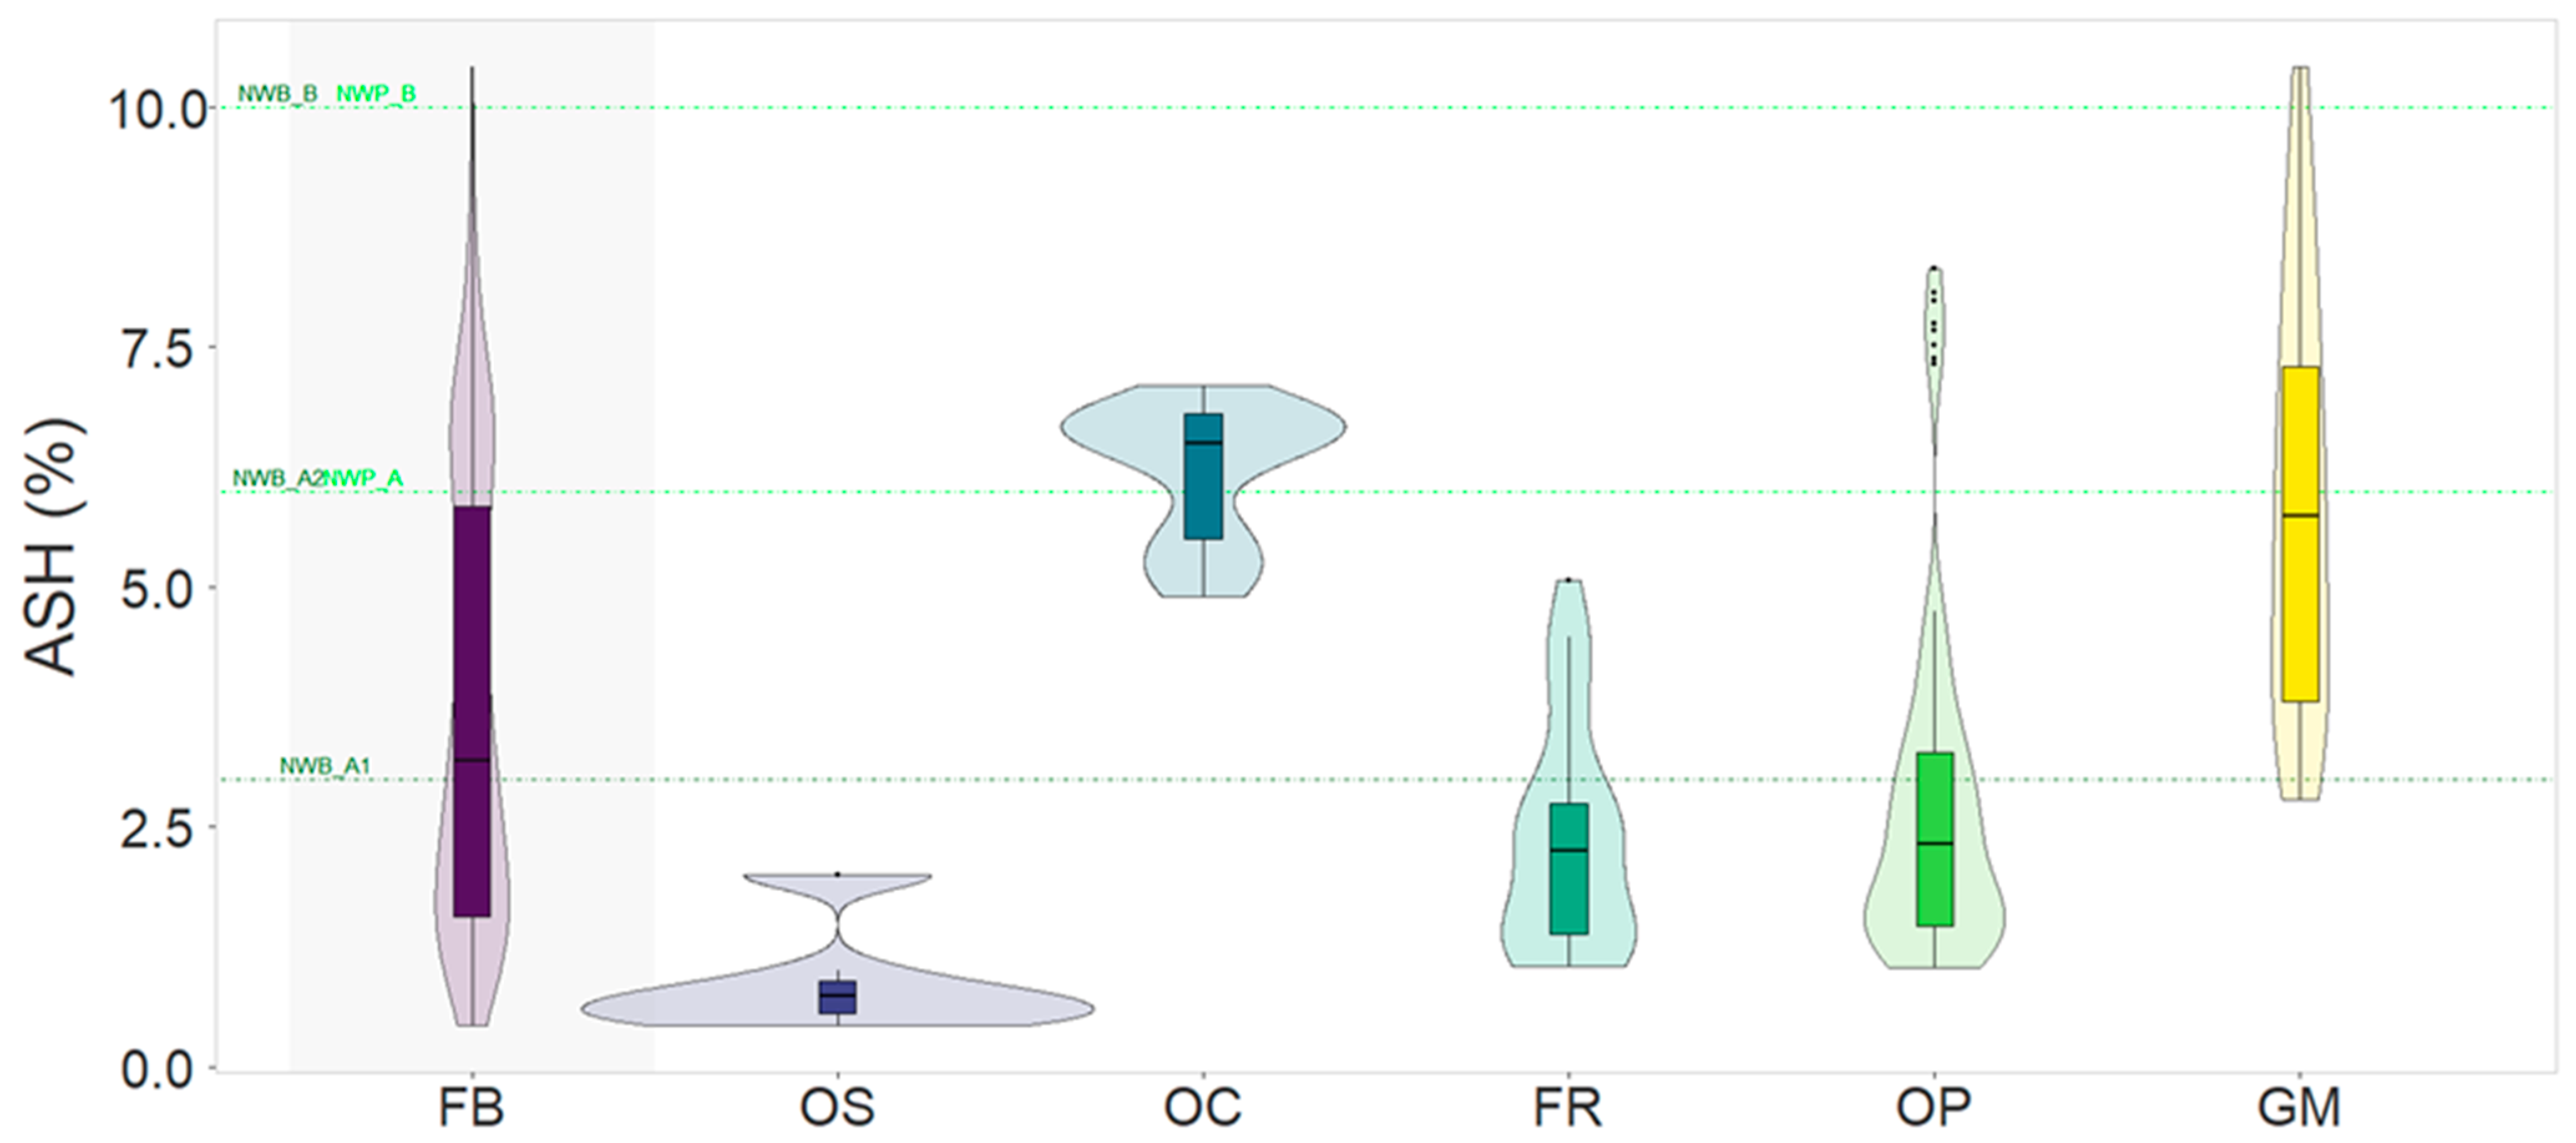
3.4.3. Violin Plots for Fruit Biomasses (FB)

Figure 7 shows the violin plots for fruit biomasses.
The distribution of A values is very different between the different FB subgroups both in terms of the range of values and average levels. Although all subgroups fall within the upper limit of the class B for non-woody brichette and pellet specification, compliance with the limits of class A for non-woody brichette and pellet concerns only OP, FR and particularly OS, whose distribution is concentrated around very low values. Most of the samples show an A value below 5% with very low values for specific types (i.e., OS, FR and OP). For fruit biomass, OS and OC show very high probabilities of frequency on very limited A ranges. Moreover, for these two groups, it would be possible to distinguish two subgroups, each well characterized by the A content. Although with more variable frequencies than the previous ones, the FR and OP groups are within the A limit for most biofuels used as raw biomass. On the contrary, GM shows a frequency uniformly distributed over all the A values, making this class not very specific considering only the A parameter.

4. Discussion

The main observation from this work is that the origin and the source of biomass correspond to different chemical–physical natures. This could have implications in different kinetics of combustion and different assessments by the managers of the thermoelectric power plants [26]. Based on this consideration, this work would confirm experimentally the indications of the ISO 17225-1 standard, which sets the origin and source as parameters for the classification of biomass.
The distinction between the main groups Is evident from the first graph, the (C/N)d.m. histogram of Figure 1. In general, WB appears to be shifted on the right (high (C/N)d.m.), the subgroups belonging to HB lie in the central area, while the values of FB are distributed homogeneously in the line. The oilseed cake is in the lower position of the graph. Despite high C, these materials present high quantities of N due to the abundance of proteins [46,47,48]. In addition, high N content in marc is observed [3]. Urban green maintenance residues are the only subgroups belonging to WB on the left side, and that is probably due to the high N content in grass and leaves [4]. Not surprisingly, the pomace extracted is in the bottom right, second only to the pellet for (C/N)dm. Twigs/pruning are richer in N than other woody parts of the plant [21]. A useful method of energy conversion for the biomass typology belonging to the left side of the graph could be the production of biogas through anaerobic fermentation. This is especially true for pomace, which, according to the values of Table 3, has an average M value of 67.0%, favoring microbial activity. Moving to the right side, the option of thermochemical valorization would be the best [5].
As observed from the van Krevelen diagrams in Figure 2, all the biomass samples form a unitary group. However, discrimination between the main groups is visible based on the O/C ratio, which places FB as a group a bit shifted towards the chemical–physical characteristics of solid fossil fuels such as coal.
Such division on chemical–physical properties is confirmed in the score plots of PCA. Figure 3 demonstrates that HB and WB are divided from FB based on their oxidation state, which results in the release of less energy from combustion. This is confirmed by the opposite directions of the vectors (blue lines) Cox and GCV, which lie in the segment of the PCA biplot representative, respectively, of HB and WB (right) and FB (left) quadrants.
Such relation between these parameters (hydrogen, carbon, oxidation state, energy released) is also confirmed in other studies [6,38]. The more hydrogen per carbon, the lower the oxidation state, and the more energy is released during the oxidation reaction.
As reported in previous studies, O and (O/C)atr in biomass is major in HB rather than WB [27,28,45], and this study confirms this tendency. FB shows a lower content of O than HB and WB, and greater (H/C)atr, leading to a lower oxidation state and greater GCV. FB contains subgroups such as marc, panels, fruit processing residues and seeds. They are lower in cellulose and richer in oils [7,29,39,40]. Oils are made up of long hydrocarbon chains, for example, lipids or fatty acids, often saturated and therefore richer in H [8,9]. Furthermore, fruit biomasses abound in other molecules made up essentially of C and H such as proteins and amino acids [10,30].
WB and HB, on the other hand, have higher O concentrations. The average chemical composition of a lignocellulosic biomass consists of about 25–30% of lignin and 75% of carbohydrates joined to form long polymer chains [31]. The two most important carbohydrates are cellulose and hemicellulose. These are characterized by the presence of multiple hydroxyl groups of the glucose belonging to a chain, forming hydrogen bonds with oxygen atoms of the same or another chain [11]. Lignin is a phenolic substance consisting of an irregular series of hydroxyl- and methoxy-substituted phenylpropane units linked in different ways [12]. O therefore plays a fundamental role in the elemental composition of this molecule.
Differences in percentages of O and O/C ratio are extremely important in treating biomass for energy purposes as they lead to different reaction paths. Studies carried out with thermogravimetric techniques and distributed activation energy models (DAEM) underline different combustion kinetics [41,42]. In general terms, a higher oxygen content (and a relatively high O/C ratio) is typical of reactive biomass leading to combustion with a faster mass loss related to an increasing temperature.
Observing Figure 3, it appears that the FB is shifting towards two regions, indicating that the internal division within this group is linked to variations in chemical composition among its subgroups. For example, cakes are found separated from the others on the basis of A, but also by (H/C)atr, N and S. This may result in the validation of their classification according to their composition, given that these components, such as S, are present in high quantities [13].
The Pearson correlation map (Figure 4) provides a confirmation of the negative correlation between the parameters Cox and GCV with a correlation coefficient of −0.4964. Other interesting relations regard Cl and S (0.4490), A and Cl (0.6033) and A and S (0.4642).
These relations are particularly interesting when considering how these elements in biomass influence the melting behaviors of the A and the combustion quality [2,14]. The contribution of S to the protein and amino acid content discussed above is explained by the positive correlation of N and S (0.6559).
Further correlations that would be interesting to investigate would be the extremely negative one between C and O (−0.7633) and the practically null one between C-GCV and S.
Analyzing Figure 5, it can be stated that among woody biomass, the use of pellets is well recognized and utilized due to their low heterogeneity and streamlined strict quality-grading system that ensures consistent material properties. In a different way, other materials of wood origin such as wood chips turn out to be extremely heterogeneous; the variability is due to origin, weather conditions and all the supply or conferment phases in the plant. The same analysis can be conducted for agricultural residues from the pruning of different crops (vineyards and/or olive groves), which possess very similar characteristics and little variability over time, and thus a low level of heterogeneity, probably due to the material obtained under the same conditions. For most of these residual biomasses, the standard on hog fuel and industrial woodchips (ISO 17225-9) incorporates well (at least for the A parameter) the quality of the fuels in contexts such as the Italian industrial one, where the raw material does not normally come from the sawmill but from forestry.
Considering Figure 6, it is conceivable that part of this variability is related to the intrinsic nature of the biomass. However, other factors such as the harvesting conditions of the material influence the presence of the aggregates. During the storage phase, the effects of product degradation can lead to important changes in the biomass properties. In general, the ranges established by the limits of the current technical specifications are in line with the distribution of the HB A data and allow for adequate differentiation of quality levels.
Observing Figure 7, it can be seen that variability is high in all the biomass types, the only ones with fewer variable characteristics being cakes and olive stone. In general, the ranges set by the current technical specification limits are in line with the distribution of FB A data and allow for adequate differentiation of quality levels. Specifically for fruit biomass, also related to the classification shown in Table 2, the difficulty in correctly classifying the OC (oilseed cake) group must be highlighted. Following the indications of ISO 17225-1, in which the residue of the extraction of oil from herbaceous oil crops could be associated both with the biomass group 3.2.1.4 (by-products and residues from food and fruit processing industry—chemically untreated fruit residues—crude olive cake), being a cake, and with the group 2.2.1.2 (by-products and residues from food and herbaceous processing industry—chemically untreated herbaceous residues—oil seed crops), being derived from a herbaceous crop, it is not clear whether these residues must be considered herbaceous residual biomass or fruit residual biomass.
Although the “ash” parameter for the legislation corresponds only to the percentage by weight of the inert component on the total mass, other equally important parameters can be derived from the ashes such as metals and other major elements which were not analyzed in the present study, but which could be an interesting topic for future experiments. In fact, metals and major elements are normally present in traces, but in specific cases (for example, for residual biomass), they can be much more abundant; the very narrow limits of the legislation make them a potential threat to the quality of the biomass.

5. Conclusions

Through statistical analyses such as PCA and/or Pearson correlation map, it was seen that the ash content could be considered a fundamental and representative parameter for the evaluation of the quality of the biomass used in the power plants. It is no coincidence that the quality classes defined by the technical specifications for solid biofuels always highlight a difference in terms of ash content. Reported below are the main results of the study.
(1)
For all the biomasses analyzed, positive correlation was found between ash content and chlorine/sulfur.
(2)
In general terms, woody biomasses have a higher atomic carbon/nitrogen ratio (higher carbon content), while agricultural residual biomasses, and, to some extent, herbaceous biomasses, have a higher nitrogen content. Woody biomasses would seem more suitable for feeding thermochemical systems (power plants), and agricultural and herbaceous biomasses would be better for feeding biochemical systems (biogas plants).
(3)
The study confirms the general correctness of the classification criteria of the ISO 17225-1 standard. In some cases, however, the variability is so high as to suggest that the classes identified by the standard are recognizable only through an accurate traceability process (not always possible and economically advantageous).
(4)
Finally, for OC and OS, results would suggest the possibility of introducing an additional level to the classes of ISO 17225-1. However, an effective revision of the standard in this sense could be very expensive given the complexity of the topic. The results obtained represent the overview of the different types of biomasses used by Italian thermal energy plants.
Thus, the present study is representative only of the Italian case. At an international level, further similar studies are necessary to describe exhaustively the very high qualitative variability that distinguishes solid biomass for energy use. Finally, the analytical results of the study are certainly useful to cover a gap of knowledge about specific physical and chemical parameters. An example is provided by hydrogen, essential for the calculation of the lower calorific value.

Author Contributions

Conceptualization, G.T. and D.D.; Data curation, A.I.; Formal analysis, C.D.F. and T.G.; Funding acquisition, G.T.; Investigation, C.D.F., T.G. and A.I.; Methodology, S.F., D.D. and A.I.; Project administration, G.T.; Resources, G.T.; Software, S.F. and A.I.; Supervision, G.T.; Validation, G.T., S.F. and D.D.; Visualization, C.D.F. and A.I.; Writing—original draft, C.D.F. and A.I.; Writing—review and editing, G.T., D.D. and A.I. All authors have read and agreed to the published version of the manuscript.

Funding

This research received no external funding.

Data Availability Statement

The data presented in this study are available on request from the corresponding author.

Conflicts of Interest

The authors declare no conflict of interest.

Abbreviations

Mmoisture
Aash
GCVgross calorific value
Ccarbon
Hhydrogen
Nnitrogen
Ooxygen
Clchlorine
Ssulphur
WBwoody biomass
WCwoodchip
Brkbark
OrRorchard residues
Brnbranches
PrUGpruning from urban greenery
SWstemwood residues
FBfruit biomass
OSolive stone
OCoilseed cake
FRfruit residues
OPolive pomace
GMgrape marc
HBherbaceous biomass
RSrapeseed straw
SCSsunflower flower head and stalks
CScorn stalks
WSwheat straw
SPsorghum plant
SSsorghum stalks

References

  1. Jafri, N.; Wong, W.Y.; Doshi, V.; Yoon, L.W.; Cheah, K.H. A Review on Production and Characterization of Biochars for Application in Direct Carbon Fuel Cells A review on production and characterization of biochars for application in direct carbon fuel cells. Process Saf. Environ. Prot. 2018, 118, 152–166. [Google Scholar] [CrossRef]
  2. Toscano, G.; Feliciangeli, G.; Rossini, G.; Fabrizi, S.; Foppa Pedretti, E.; Duca, D. Engineered solid biofuel from herbaceous biomass mixed with inorganic additives. Fuel 2019, 256, 115895. [Google Scholar] [CrossRef]
  3. Gowman, A.C.; Picard, M.C.; Rodriguez-Uribe, A.; Misra, M.; Khalil, H.; Thimmanagari, M.; Mohanty, A.K. Physicochemical analysis of apple and grape pomaces. BioResources 2019, 14, 3210–3230. [Google Scholar] [CrossRef]
  4. Loomis, R.S. On the utility of nitrogen in leaves. Proc. Natl. Acad. Sci. USA 1997, 94, 13378–13379. [Google Scholar] [CrossRef] [PubMed]
  5. USDA, Natural Resources Conservation Service of U.S. Department of Agriculture. Carbon to Nitrogen Ratios in Cropping Systems. Available online: https://bwsr.state.mn.us/sites/default/files/2019-07/C_N_ratios_cropping_systems.pdf (accessed on 25 January 2023).
  6. Agostinho, D.; Eloy, E.; Caron, B.O.; Trugilho, P.F. Elemental Chemical Composition of Forest Biomass at Different Ages for Energy Purposes. In Biomass Volume Estimation and Valorization for Energy; Tumuluru, J.S., Ed.; IntechOpen: London, UK, 2017; Volume 26. [Google Scholar]
  7. Murphy, D.J. Engineering oil production in rapeseed and other oil crops. Tibtech 1996, 14, 206–213. [Google Scholar] [CrossRef]
  8. Doan, L.P.; Nguyen, T.T.; Pham, M.Q.; Tran, Q.T. Extraction Process, Identification of Fatty Acids, Tocopherols, Sterols and Phenolic Constituents, and Antioxidant Evaluation of Seed Oils from Five Fabaceae Species. Processes 2019, 7, 456. [Google Scholar] [CrossRef]
  9. Rutkowska, J. Effects of fatty acid composition of liquid margarines on sensory quality of cakes. Acta Aliment. 2010, 39, 125–137. [Google Scholar] [CrossRef]
  10. Scott, E.; Peter, F.; Sanders, J. Biomass in the manufacture of industrial products—The use of proteins and amino acids. Appl. Microbiol. Biotechnol. 2007, 75, 751–762. [Google Scholar] [CrossRef]
  11. Wyman, C.E.; Decker, S.R.; Himmel, M.E.; Brady, J.W.; Skopec, C.E. Hydrolysis of Cellulose and Hemicellulose. In Polysaccharides: Structural Diversity and Functional Versatility; Marcel Dekker:  New York, NY, USA, 2005. [Google Scholar]
  12. Rutkowski, P.; Waliszewska, B.; Mleczek, M.; Zborowska, M.; Golin, P.; Szentner, K. Changes in the chemical composition and the structure of cellulose and lignin in elm wood exposed to various forms of arsenic. Cellulose 2019, 26, 6303–6315. [Google Scholar] [CrossRef]
  13. Balan, V.; Rogers, C.A.; Chundawat, S.P.S.; da Costa Sousa, L.; Slininger, P.J.; Gupta, R.; Dale, B.E. Conversion of Extracted Oil Cake Fibers into Bioethanol Including DDGS, Conversion of Extracted Oil Cake Fibers into Bioethanol Including DDGS, Canola, Sunflower, Sesame, Soy, and Peanut for Integrated Biodiesel Processing. J. Am. Oil Chem. Soc. 2009, 86, 157–165. [Google Scholar] [CrossRef]
  14. Iqbal, Y.; Lewandowski, I. Biomass composition and ash melting behaviour of selected miscanthus genotypes in Southern Germany. Fuel 2016, 180, 606–612. [Google Scholar] [CrossRef]
  15. Silberberg, M.S. Chemistry: The Molecular Nature of Matter and Change; McGraw-Hill: New York, NY, USA, 2006. [Google Scholar]
  16. IEA. Renewables 2022; IEA: Paris, France, 2022. [Google Scholar]
  17. Mancini, M.; Toscano, G.; Feliciangeli, G.; Leoni, E.; Duca, D. Investigation on woodchip quality with respect to ISO standards and relationship among quality parameters. Fuel 2020, 279, 118559. [Google Scholar] [CrossRef]
  18. Duca, D.; Toscano, G.; Pizzi, A.; Rossini, G.; Fabrizi, S.; Lucesoli, G.; Servili, A.; Mancini, V.; Romanazzi, G.; Mengarelli, C. Evaluation of the characteristics of vineyard pruning residues for energy applications: Effect of different copper-based treatments. J. Agric. Eng. 2016, 47, 22–27. [Google Scholar] [CrossRef]
  19. Ilari, A.; Toscano, G.; Pedretti, E.F.; Fabrizi, S.; Duca, D. Environmental sustainability of heating systems based on pellets produced in mobile and stationary plants from vineyard pruning residues. Resources 2020, 9, 94. [Google Scholar] [CrossRef]
  20. Ilari, A.; Foppa Pedretti, E.; De Francesco, C.; Duca, D. Pellet Production from Residual Biomass of Greenery Maintenance in a Small-Scale Company to Improve Sustainability. Resources 2021, 10, 122. [Google Scholar] [CrossRef]
  21. Pizzi, A.; Foppa Pedretti, E.; Duca, D.; Rossini, G.; Mengarelli, C.; Ilari, A.; Mancini, M.; Toscano, G. Emissions of heating appliances fuelled with agropellet produced from vine pruning residues and environmental aspects. Renew. Energy 2018, 121, 513–520. [Google Scholar] [CrossRef]
  22. Toscano, G.; Riva, G.; Foppa Pedretti, E.; Duca, D. Effect of the carbon oxidation state of biomass compounds on the relationship between GCV and carbon content. Biomass Bioenergy 2013, 48, 231–238. [Google Scholar] [CrossRef]
  23. Mckendry, P. Energy production from biomass (part 1): Overview of biomass. Bioresour. Technol. 2002, 83, 37–46. [Google Scholar] [CrossRef]
  24. Koppejan, J.; Van Loo, S. The Handbook of Biomass Combustion & Co-Firing; Earthscan Publishing House: London, UK, 2007; ISBN 978-1-84407-249-1. [Google Scholar]
  25. University of Stanford. An Assessment of Biomass Feedstock and Conversion Research Opportunities; University of Stanford: Stanford, CA, USA, 2006. [Google Scholar]
  26. Williams, C.L.; Emerson, R.M.; Emerson, R.M. Biomass Compositional Analysis for Conversion to Renewable Fuels and Chemicals. In Biomass Volume Estimation and Valorization for Energy; Tumuluru, J.S., Ed.; IntechOpen: London, UK, 2017; ISBN 978-953-51-2938-7. [Google Scholar]
  27. Tumuluru, J.S. Comparison of Chemical Composition and Energy Property of Torrefied Switchgrass and Corn Stover. Front. Energy Res. 2015, 3, 46. [Google Scholar] [CrossRef]
  28. Tan, C.P.; Man, Y.B.C. Differential scanning calorimetric analysis of palm oil, palm oil based products and coconut oil: Effects of scanning rate variation. Food Chem. 2002, 76, 89–102. [Google Scholar] [CrossRef]
  29. Duca, D.; Riva, G.; Foppa Pedretti, E.; Toscano, G. Wood pellet quality with respect to en 14961-2 standard and certifications. Fuel 2014, 135, 9–14. [Google Scholar] [CrossRef]
  30. Toscano, G.; Riva, G.; Foppa Pedretti, E.; Corinaldesi, F.; Mengarelli, C.; Duca, D. Investigation on wood pellet quality and relationship between ash content and the most important chemical elements. Biomass Bioenergy 2013, 56, 317–322. [Google Scholar] [CrossRef]
  31. Toscano, G.; Duca, D.; Foppa Pedretti, E.; Pizzi, A.; Rossini, G.; Mengarelli, C.; Mancini, M. Investigation of woodchip quality: Relationship between the most important chemical and physical parameters. Energy 2016, 106, 38–44. [Google Scholar] [CrossRef]
  32. Vivoli, F.P. Energia Dalle Biomasse—Tecnologie e Prospettive; Regione Siciliana Assessorato Industria: Palermo, Italy, 2008. [Google Scholar]
  33. Faravelli, T.; Frassoldati, A.; Granata, S.; Ranzi, E.; Cuoci, A. Fenomenologia Della Combustione di Biomasse; Politecnico di Milano: Milan, Italy, 2006. [Google Scholar]
  34. Sohaib, Q.; Habib, M.; Fawad, S.; Shah, A.; Habib, U.; Ullah, S. Fast pyrolysis of locally available green waste at different residence time and temperatures. Energy Sources Part A Recovery Util. Environ. Eff. 2017, 39, 1639–1646. [Google Scholar] [CrossRef]
  35. Phyllis2—Database for Biomass and Waste. Biomass Unit of Energy Research Centre of the Netherlands (ECN). Available online: https://phyllis.nl/ (accessed on 12 January 2023).
  36. Easterly, J.L.; Burnham, M. Overview of Biomass and Waste Fuel for Power Production. Biomass Bioenergy 1996, 10, 79–92. [Google Scholar] [CrossRef]
  37. Adamovics, A.; Platace, R.; Gulbe, I.; Ivanovs, S. The content of carbon and hydrogen in grass biomass and its influence on heating value. Eng. Rural Dev. 2018, 1, 1277–1281. [Google Scholar] [CrossRef]
  38. Pizzi, A.; Duca, D.; Rossini, G.; Fabrizi, S.; Toscano, G. Biofuel, Bioenergy and Feed Valorization of By-Products and Residues from Hevea brasiliensis Cultivation to Enhance Sustainability. Resources 2020, 9, 114. [Google Scholar] [CrossRef]
  39. Pedretti, E.F.; Del Gatto, A.; Pieri, S.; Mangoni, L.; Ilari, A.; Mancini, M.; Feliciangeli, G.; Leoni, E.; Toscano, G. Experimental Study to Support Local Sunflower Oil Chains: Production of Cold Pressed Oil in Central Italy. Agriculture 2019, 9, 231. [Google Scholar] [CrossRef]
  40. Senneca, O. Kinetics of pyrolysis, combustion and gasification of three biomass fuels. Fuel Process. Technol. 2007, 88, 87–97. [Google Scholar] [CrossRef]
  41. Jankovi, B.; Jovanovi, V.; Stojiljkovi, D. Comparative pyrolysis kinetics of various biomasses based on model-free and DAEM approaches improved with numerical optimization procedure. PLoS ONE 2018, 13, e0206657. [Google Scholar] [CrossRef]
  42. Yap, B.W.; Sim, C.H. Comparisons of various types of normality tests. J. Stat. Comput. Simul. 2011, 81, 2141–2155. [Google Scholar] [CrossRef]
  43. MacFarland, T.W.; Yates, J.M. Nonparametric Statistics for the Biological Sciences. In Introduction to Nonparametric Statistics for the Biological Sciences Using R; Springer: Cham, Switzerland, 2016. [Google Scholar]
  44. Jiang, Y.; Park, K.H.; Jeon, C.H. Feasibility Study of Co-Firing of Torrefied Empty Fruit Bunch and Coal Through Boiler Simulation. Energies 2020, 13, 3051. [Google Scholar] [CrossRef]
  45. Eduardo, C.; Braz, M.; Crnkovic, P.M. Physical–Chemical Characterization of Biomass Samples for Application in Pyrolysis Process. Chem. Eng. Trans. 2014, 37, 523–528. [Google Scholar] [CrossRef]
  46. Vassilev, S.V.; Baxter, D.; Andersen, L.K.; Vassileva, C.G. An overview of the chemical composition of biomass. Fuel 2010, 89, 913–933. [Google Scholar] [CrossRef]
  47. Ancuta, P.; Sonia, A. Oil Press-Cakes and Meals Valorization through Circular Economy Approaches: A Review. Appl. Sci. 2020, 10, 7432. [Google Scholar] [CrossRef]
  48. Lomascolo, A.; Uzan-Boukhris, E.; Sigoillot, J.C.; Fine, F. Rapeseed and sunflower meal: A review on biotechnology status and challenges. Appl. Microbiol. Biotechnol. 2012, 95, 1105–1114. [Google Scholar] [CrossRef]
Figure 1. The mean values of (C/N)dm of the various subgroups. The ones belonging to the same main group share the same color. HB: herbaceous biomass, FB: fruit biomass, WB: woody biomass, OC: oilseed cake, GM: grape marc, PrUG: pruning from urban greenery, SCS: sunflower flower head and stalks, OP: olive pomace, RS: rapeseed stalks, SP: sorghum plant, SS: sorghum stalks, WS: wheat straw, Brn: branches, CS: corn stalks, FR: fruit residues, Brk: bark, OrR: orchard residues, WC: woodchip, OS: olive stone, SW: stem wood residues.
Resources 12 00069 g001
Figure 2. van Krevelen Diagrams for the groups considered in this study (colored dots) compared with another diagram concerning biomass and solid fossil fuels (Jiang et al. 2020 46 modified, ellipses and groups in the background). HB: herbaceous biomass (orange dots), FB: fruit biomass (yellow dots), WB: woody biomass (grey dots).
Resources 12 00069 g002
Figure 3. Biplot of the first 2 PCs of the general biomass dataset. It resumes the results from the score and loading plot. In the first one (PC1), the score of each sample is plotted based on its proximity to the new PCs. The second one (PC2) shows how strongly each originally investigated parameter influences a PC. Scores were colored and marked according to their belonging to a main group. Ellipses underline the average “cluster zone”. HB: herbaceous biomass, FB: fruit biomass, WB: woody biomass.
Resources 12 00069 g003
Figure 4. Pearson correlation map for the biomass dataset. Negative correlations are in blue and tend to be −1, while positive correlations are in red and tend to be +1. Values tending to 0 underline the absence of correlation and are colored in white. The green lines divide the physical–chemical analysis from the newly calculated parameters. M: moisture, A: ash, GCV: gross calorific value, C: carbon, H: hydrogen, N: nitrogen, O: oxygen, Cl: chlorine, S: sulfur, C/N: carbon to nitrogen ratio, Cox: carbon oxidation number, H/C: hydrogen to carbon ratio, O/C: oxygen to carbon ratio.
Resources 12 00069 g004
Figure 5. Violin plot of A for the entire WB group. WB: Woody biomass, WC: Woodchip, Brk: Bark, OrR: Orchard residues, Brn: Branches, PrUG: Pruning from urban green, SW: Stem wood residues. WP_I3, WP_B, WP_A1 are the ash limits for woody pellet; WC_A and WC_B are ash limits for wood chips.
Resources 12 00069 g005
Figure 6. Violin plot of A content for the entire HB group. HB: Herbaceous biomass, RS: Rape seed straw, SCS: Sunflower flower head and stalks, CS: Corn stalks, WS: Wheat straw, SP: Sorghum plant, SS: Sorghum stalks. NWB_A1, NWB_A2, NWB_B, NWP_A, NWP_B are the ash limits for non-woody brichette and pellet, respectively.
Resources 12 00069 g006
Figure 7. Violin plot of A content for the entire FB group. FB: Fruit biomass, OS: Olive stone, OC: Oil seed cake, FR: Fruit residues, OP: Olive pomace, GM: Grape marc.
Resources 12 00069 g007
Table 1. Ash limit values and quality classes for the various biofuels identified by the ISO 17225 group standards with reference to the raw biomasses allowed for their production as indicated by the ISO 17225-1 standard.
ISO StandardBiofuelRaw Material
(ISO 17225-1:2021, Table 1)
Quality ClassesAsh Limit % in Dry Mass
ISO 17225-2Wood pellet.1.1Forest, plantation, and other virgin woodA10.7
1.2By-products and residues from wood processing industryA21.2
1.3.1Chemically untreated used woodB2.0
ISO 17225-3Wood briquettes.1.1Forest, plantation, and other virgin woodA11.0
1.2By-products and residues from wood processing industryA23.0
1.3.1Chemically untreated used woodB5.0
ISO 17225-4Wood chips.1.1Forest, plantation, and other virgin woodA1–A21.5
1.2By-products and residues from wood processing industry
1.3.1Chemically untreated used woodB1–B23.0
ISO 17225-5Firewood.1.1.1Whole trees without rootsA1
1.1.3Stem wood
1.1.4Logging residues A2
1.2.1Chemically untreated by-products and residues from wood processing industryB
ISO 17225-6Non-woody
pellets.
2Herbaceous biomassA6.0
3Fruit biomass
4Aquatic biomassB10.0
5Biomass blends and mixtures
ISO 17225-7Non-woody
briquettes.
2Herbaceous biomassA13.0
3Fruit biomass
4Aquatic biomassA26.0
5Biomass blends and mixturesB10.0
ISO/TS 17225-8Graded thermally treated and densified biomass fuel.1.1Forest, plantation and other virgin woodTW1H-TW1L1.2
1.2By-products and residues from wood processing industry
1.3.1Chemically untreated used woodTW2H-TW2L3.0
2Herbaceous biomass
3Fruit biomassTW3H-TW3L5.0
4Aquatic biomass
ISO 17225-9Hog fuel and wood chips for industrial use.1.1Forest, plantation and other virgin woodI13.0
1.2By-products and residues from wood processing industryI25.0
1.3Used woodI36.0
1.4Blends and mixturesI47.0
Table 2. Main groups of biomasses considered in this study. The standard codes correspond to the ones reported in Table 1 of ISO 17225-1, except for woody pellets, which refer entirely to ISO 17225-2. The last column represents the number of samples for a single specific subgroup.
Main GroupsSubgroupsDescription/OriginAbbrevCorresponding ISO CodeN.
Samples
Herbaceous biomass—HB
(378 samples)
Wheat strawDry stalks of cereal plants after the grain and chaff have been removed.WS2.1.1.234
Corn stalksCorn from dedicated culture, straw parts.CS2.1.1.228
Sorghum plantSorghum from dedicated culture of cereal crops, whole plant.SP2.1.1.138
Sorghum stalksSorghum from dedicated culture, straw parts. SS2.1.1.236
Rapeseed strawFrom dedicated culture of rapeseed for oil extraction. RS2.1.3.281
Sunflower flower head and stalksFrom dedicated culture of sunflower for oil extraction.SCS2.1.3.2161
Food processing industry/fruit biomass—FB (226 samples)Grape marcBerries of chemically untreated grape residues.GM3.2.1.125
Fruit ResiduesStone/kernel fruits/fruit fibre.FR3.2.1.227
Oilseed cakeCake from oilseed plat such as rapeseed or sunflower.OC3.2.1.455
Olive pomaceCrude olive cake obtained after extraction of oil from olive.OP3.2.1.4108
Oilve stoneKernel/stone coming obtained by extraction of oil from olive.OS3.2.1.211
Woody biomass—WB
(325 samples)
BranchesFrom forestry operations.Brn1.1.421
Orchard residuesOrchard pruning residue subjected to the first coarse grinding before being transported to the plant—d95 > 100 mm.OrR1.1.727
BarkFrom forestry operations.Brk1.1.618
WoodchipForest, plantation, logging residues.WC1.1.3188
Pruning from urban greenerySegregated wood from gardens, parks, roadside maintenance, plant waste removal.PrUG1.1.717
Stem wood residuesFrom sawdust and related industrial wastes from the milling of lumber, manufacture of wood products and furniture, and construction.SW1.2.154
Table 3. Characterization analyses performed on biomass samples.
Parameter/ProcedureUnitStandardInstrumentsMethodology
Sampling-ISO 18135:2017-Withdrawal of 10 increments of 10 L from every 100 t biomass batch.
Quartering procedure to reduce the sample size.
Sample preparation-ISO 14780:2017Ventilated stove “MPM Instruments” + Cutting mill RETSCH SM 2000Stabilization: in oven at 40 °C for about 24 h
Milling: <1 mm particle size distribution.
Moisture content (M)% a.r.ISO 18134-2:2015Ventilated stove + Electronic ScaleAfter weighing in and drying (105 °C
for 24 h) of about 400 g material specimen in duplicate, they are weighed again.
Gross Calorific Value (GCV)J/g d.m.ISO 18125:2017Calorimeter IKA c2000Combustion of about 1 g material through a calorimeter equipped with a
stainless steel Mahler bomb filled with 3 MPa Oxygen. The energy released
from the process is related to the increase in temperature of a known mass of
water placed in contact with the bomb.
Ash content (A)% d.m.ISO 18122:2015Ash analyzer TGA 701 LECOIncineration through three steps—105, 250 and 550 °C—in air of 1 g of milled material weighed in duplicate until reaching a constant weight. The percentage of remaining mass after the process represents the ash content.
Chlorine and Sulfur content (Cl, S)% d.m.ISO 16994:2015Water collected through Mahler Bomb + Ion Chromatographer
METROHM 761 Compact IC
After analysis of gross calorific value, combustion water condenses inside the bomb and captures these elements. It is then recovered, appropriately diluted and analyzed by anion-exchange chromatography.
Carbon, Hydrogen and Nitrogen content (C, H, N O *)% d.m.ISO 16948:2015CHN Analyzer 2400 Perkin ElmerGaseous CO2, H2O and N2 were obtained by the complete combustion and subsequent reduction of about 4 mg sample measured by a thermal conductivity detector.
* Oxygen is calculated, according to ISO 16948, as the difference to 100% of the percentage content of ash, nitrogen, hydrogen, carbon, chlorine, and sulfur.
Table 4. Descriptive analysis results of the samples in the final dataset.
MAGCVCHNOClS
1—HB
Median10.6 c9.5 a17,720 c44.4 c5.6 c0.9 b39.2 b0.32 a0.12 a
Mean11.910.017,64544.35.61.038.70.440.15
St. dev.4.53.06971.60.30.32.60.360.11
Max59.317.221,61748.66.32.345.81.560.59
Min7.84.314,69337.84.70.130.70.030.01
2—FB
Median28.8 b3.2 b22,507 a52.8 a6.6 a1.5 a34.8 c0.04 b0.10 b
Mean30.73.822,29452.76.52.234.70.050.16
St. dev.20.92.310152.10.71.74.20.060.17
Max74.110.424,27757.27.75.948.50.340.65
Min5.00.418,52342.10.70.125.30.010.01
3—WB
Median34.2 a2.3 c19,724 b49.3 b5.8 b0.3 c42.2 a0.01 c0.02 c
Mean31.23.219,62849.05.70.441.70.040.03
St. dev.15.23.17982.10.30.52.70.130.04
Max77.720.521,93754.56.53.948.91.190.31
Min4.60.216,43838.64.40.028.40.010.01
Significance letters refer to Kruskal–Wallis one-way analysis of variance and relative Fisher’s least significant difference post hoc test and specify the differences or similarities between groups. HB: herbaceous biomass, FB: fruit biomass, WB: woody biomass, M: moisture, A: ash, GCV: gross calorific value, C: carbon, H: hydrogen, N: nitrogen, O: oxygen, Cl: chlorine, S: sulfur.
Table 5. Descriptive analysis results of the samples for the subgroups of HB.
MAGCVCHNOClS
1—Wheat straw
Median9.7 d7.7 c18,222 a45.1 a5.6 c0.7 c40.3 b0.49 a0.13 b
Mean10.87.718,21645.25.60.740.20.500.13
St. dev.3.30.71660.60.20.21.00.210.04
Max24.39.218,66546.66.01.141.91.200.21
Min7.85.717,83244.05.40.437.60.150.07
2—Corn stalks
Median11.8 bc7.2 c17,986 b44.3 bc5.4 d0.7 c42.1 a0.24 b0.07 c
Mean12.87.817,86943.85.40.742.00.270.07
St. dev.3.32.45542.40.20.21.30.110.02
Max20.713.018,98648.65.80.944.10.580.11
Min8.64.716,55038.44.70.138.30.120.04
3—Sorghum plant
Median18.4 a7.9 c18,045 b45.0 b5.4 d0.9 b40.2 bc0.40 a0.08 c
Mean20.68.818,04744.65.41.039.80.410.08
St. dev.8.42.33951.20.20.31.90.130.02
Max59.314.918,94246.35.92.042.70.740.14
Min10.25.717,06842.04.90.634.00.180.05
4—Sorghum stalks
Median12.1 b10.3 b17,608 c43.2 d5.3 e0.7 c39.8 bc0.43 b0.08 c
Mean12.710.617,50643.05.30.739.80.500.09
St. dev.3.32.14381.50.20.21.80.300.04
Max22.316.118,37745.75.61.243.81.370.23
Min4.97.516,47639.24.80.336.50.080.01
5—Rapeseed straw
Median9.0 e8.1 c18,037 b45.7 a5.9 a0.9 b39.4 c0.42 a0.22 a
Mean9.18.518,00545.35.91.039.30.610.27
St. dev.0.62.55371.40.20.31.40.500.17
Max10.213.219,17848.26.21.942.61.550.59
Min8.04.316,88941.85.40.636.20.050.06
6—Sunflowers flower head and stalks
Median11.3 c12.2 a17,281 d44.0 c5.7 c1.1 a36.7 d0.28 b0.15 b
Mean11.211.717,24244.05.71.137.00.360.13
St. dev.1.32.87191.40.20.32.70.330.06
Max14.217.221,61746.76.32.345.81.560.24
Min8.35.514,69337.85.10.430.70.030.03
Significance letters refer to Kruskal–Wallis one-way analysis of variance and relative Fisher’s least significant difference post hoc test and specify the differences or similarities between groups. M: moisture, A: ash, GCV: gross calorific value, C: carbon, H: hydrogen, N: nitrogen, O: oxygen, Cl: chlorine, S: sulfur.
Table 6. Descriptive analysis results of the subgroups belonging to FB.
MAGCVCHNOClS
7—Grape marc
Median35.2 b5.7 a22,287 b53.5 b6.0 c2.5 b30.8 c0.01 bc0.18 b
Mean35.25.922,14353.36.02.532.10.020.19
St. dev.20.22.29701.80.50.62.60.020.09
Max66.110.423,65657.07.64.237.10.090.60
Min8.02.819,73049.85.01.128.70.010.13
8—Fruit residues
Median12.5 c2.3 b20,692 c50.4 c5.9 c0.6 d40.8 a0.01 c0.03 d
Mean24.32.420,70750.75.90.840.20.010.05
St. dev.18.21.212252.20.50.63.00.010.05
Max59.55.124,27756.17.02.643.40.020.17
Min6.21.018,52346.24.50.330.40.010.01
9—Oilseed cake
Median7.9 d6.5 a22,386 b51.7 c7.1 a5.1 a30.1 d0.02 b0.46 a
Mean7.96.222,33251.37.15.130.30.020.40
St. dev.1.50.73761.90.40.42.20.010.18
Max13.17.122,86455.27.75.941.20.040.65
Min5.04.921,06542.15.44.325.30.010.09
10—Olive pomace
Median48.9 a2.3 b22,891 a53.9 a6.6 b1.3 c35.5 b0.06 a0.08 c
Mean44.32.722,87053.96.61.235.40.080.08
St. dev.15.81.75181.30.30.42.30.070.04
Max74.18.324,02457.27.22.740.10.340.17
Min8.91.021,04250.45.80.527.10.010.02
11—Olive stone
Median16.2 c0.7 c20,601 c51.8 c5.7 c0.2 e41.7 a0.01 bc0.02 d
Mean16.40.920,68851.45.30.242.10.010.02
St. dev.3.30.63400.91.60.12.30.010.01
Max21.72.021,14352.86.50.648.50.030.05
Min10.20.420,28950.10.70.139.90.010.01
Significance letters refer to Kruskal–Wallis one-way analysis of variance and relative Fisher’s least significant difference post hoc test and specify the differences or similarities between groups. M: moisture, A: ash, GCV: gross calorific value, C: carbon, H: hydrogen, N: nitrogen, O: oxygen, Cl: chlorine, S: sulfur.
Table 7. Descriptive analysis results of the subgroups belonging to WB.
MAGCVCHNOClS
12—Branches
Median22.3 b3.7 b19,073 c48.0 cd5.6 c0.7 a42.2 b0.05 a0.06 a
Mean23.54.819,17147.85.60.741.20.060.07
St. dev.11.52.36522.30.30.23.80.040.04
Max45.810.020,92852.36.21.047.90.120.14
Min8.52.818,28043.25.00.431.40.010.03
13—Orchard residues
Median28.6 b1.8 d19573 b49.0 bc5.6 c0.3 c43.5 a0.00 c0.01 d
Mean29.71.919,63949.05.60.343.20.010.01
St. dev.4.90.62350.90.10.11.10.010.01
Max39.43.320,17751.85.80.544.90.030.06
Min21.21.119,26547.35.30.140.30.010.01
14—Bark
Median39.5 a8.8 a18,595 c47.3 cd5.4 c0.5 b38.2 c0.01 c0.06 b
Mean37.78.818,83747.65.40.537.60.010.05
St. dev.15.43.410983.10.50.23.10.000.03
Max56.313.121,37152.66.20.842.60.010.11
Min9.63.517,63342.14.60.130.20.010.01
15—Wood chips
Median38.1 a2.4 c19,738 b49.3 b5.8 b0.3 c42.1 b0.01 b0.02 c
Mean37.52.719,71449.35.70.342.00.020.02
St. dev.9.41.46061.60.30.21.50.020.02
Max57.78.421,93754.56.41.646.20.170.18
Min12.20.617,40840.44.60.136.70.010.01
16—Pruning of urban greenery
Median35.1 a10.4 a18,052 c44.7 d5.5 c1.6 a36.7 c0.35 a0.11 a
Mean42.610.718,28145.35.41.736.40.440.14
St. dev.20.65.111753.70.50.74.80.390.08
Max77.720.520,28250.16.02.843.91.190.31
Min11.42.616,43838.64.40.528.40.010.03
17—Stem wood residues
Median6.5 c0.5 e20,304 a50.5 a6.0 a0.1 d42.9 a0.01 b0.01 c
Mean6.80.520,18750.26.00.343.00.010.02
St. dev.1.30.26201.10.20.61.30.000.01
Max10.81.020,84651.86.53.948.90.040.08
Min4.60.216,45844.65.60.039.70.010.01
Significance letters refer to Kruskal–Wallis one-way analysis of variance and relative Fisher’s least significant difference post hoc test and specify the differences or similarities between groups. M: moisture, A: ash, GCV: gross calorific value, C: carbon, H: hydrogen, N: nitrogen, O: oxygen, Cl: chlorine, S: sulfur.
Disclaimer/Publisher’s Note: The statements, opinions and data contained in all publications are solely those of the individual author(s) and contributor(s) and not of MDPI and/or the editor(s). MDPI and/or the editor(s) disclaim responsibility for any injury to people or property resulting from any ideas, methods, instructions or products referred to in the content.

