Article

Warming Air Temperature Impacts Snowfall Patterns and Increases Cold-Season Baseflow in the Liwiec River Basin (Poland) of the Central European Lowland

by
Urszula Somorowska
Department of Hydrology, Faculty of Geography and Regional Studies, University of Warsaw, Krakowskie Przedmieście 30, 00-927 Warsaw, Poland
Resources 2023, 12(2), 18; https://doi.org/10.3390/resources12020018
Submission received: 29 October 2022 / Revised: 12 January 2023 / Accepted: 13 January 2023 / Published: 17 January 2023

Abstract

:
The rapidly changing climate affects vulnerable water resources, which makes it important to evaluate multi-year trends in hydroclimatic characteristics. In this study, the changes in cold-season temperature (November–April) were analyzed in the period of 1951–2021 to reveal their impacts on precipitation and streamflow components in the Liwiec River basin (Poland). The temperature threshold approach was applied to reconstruct the snowfall/rainfall patterns. The Wittenberg filter method was applied to the hydrograph separation. The Mann–Kendall test and Sen’s slope were applied to estimate the significance and magnitude of the trends. An assessment of the similarity between trends in temperature and hydroclimatic variables was conducted using the Spearman rank-order correlation. The shift-type changes in river regime were assessed via the Kruskal–Wallis test. The results revealed that temporal changes in both snowfall, rainfall, and baseflow metrics were significantly associated with increasing temperature. Over 71 years, the temperature rose by ~2.70 °C, the snowfall-to-precipitation ratio decreased by ~16%, the baseflow increased with a depth of ~17 mm, and the baseflow index rose by ~18%. The river regime shifted from the snow-dominated to the snow-affected type. Overall, this study provides evidence of a gradual temperature increase over the last seven decades that is affecting the precipitation phase and streamflow component partitioning in the middle-latitude region.

1. Introduction

The warming climate, which is considered one of the most important factors that affects stream-flow regimes in many regions of the world, has environmental and socioeconomic implications, particularly with respect to the vulnerability of water resources [1,2,3]. With the increasing air temperature, altered precipitation patterns change the water quantities, thereby contributing to runoff components as quick flow and baseflow [4,5]. In addition to the amount of precipitation, the precipitation phase (snowfall or rainfall) plays a critical role in runoff generation [6,7]. Snowfall, if persistent, stores cold-season precipitation into the spring months and keeps the hydrological system dormant, while rainfall infiltrates soils, recharges aquifers, and feeds streams and rivers. The warming air temperature might reduce snowfall and amplify snow melt, thereby resulting in a decline in water storage in snowpacks, earlier snow, and soil thawing, and, as a consequence, causing a shift in the hydrological regime [8,9,10]. Since the warming climate modifies the ratio of snow to precipitation (S/P ratio) in many parts of the world [11,12,13], the detailed characterization of temperature and precipitation changes is a high priority in ongoing research [14,15,16]. However, significant uncertainties remain regarding the current and future trends in the hydrologic implications of warming due to the high sensitivity of hydrological processes to climate variability and change [17].
Divergent trends in snow characteristics occur in different regions of the world. When considering snowfall, climate warming might increase humidity, which enhances extreme snowfall, whereas the rising temperature reduces the likelihood of snowfall [18]. For example, the authors of [19] found that the frequency of daily snowfall events tended to decrease across much of the Northern Hemisphere except at the highest latitudes such as in northern Canada, northern Siberia, and Greenland. Divergent snowfall patterns were also uncovered in [18]; it was found that while higher-latitude regions experience increasing extreme snowfall percentiles, decreasing extreme snowfall percentiles are characteristic of lower-latitude regions in Western Europe. Observational evidence from the pan-European in situ data was provided in [20]; it was revealed that over the period of 1951–2017, the mean snow depth decreased more than the extreme snow depth, and widespread decreases in the maximum and mean snow depth were found over Europe except in the coldest climates. It is worth noting that interannual variability in the extent of snow is high, and new extremes in maximum snow metrics over Eurasia have occurred in recent years [16,21]. Generally, the increases in winter temperatures have resulted in a decrease in the S/P ratio and an increase in winter snowmelt for most of the Northern Hemisphere; this was particularly significant in the middle-latitude regions [11,22].
Divergent assessments also concern the hydrologic implications of rising temperature reported in global and regional studies. In the coldest river basins, the response to warming is manifested by an increase in the spring streamflow peak, whereas for the transitional basins, the spring runoff decreases [1]. This is because transitional river basins face large increases in winter streamflow. While many studies have generally focused on mountainous and arctic regions [23,24,25,26], relatively fewer studies have reported on snow hydrology changes across low-relief topography regions [27,28]. These are regions in which the river runoff is also sensitive to the effects of the changing patterns of snow accumulation and melt. In [1], regions with snowmelt-dominated runoff were selected using the ratio of accumulated annual snowfall divided by annual runoff (S/QT ratio or snowfall-to-runoff ratio), and the criterion of S/QT > 0.5 over the global land regions was applied. According to this criterion, vast areas of the Central European Lowland located within the borders of Poland are not classified as snowmelt-dominated areas. However, this may be due to the short observation period, which covered the years 1980–1999, and the coarse spatial resolution of the gridded data (0.5° × 0.5° latitude/longitude) used in the analysis. Therefore, it seems reasonable to evaluate the S/QT ratio using ground-based data with a higher spatial resolution for a longer period of time. Such an analysis might unmask multi-year changes in the S/QT ratio over time. In the east and northeast parts of Poland, the hydrological regime of lowland rivers is influenced by relatively persistent seasonal snowpack in winter, with the highest streamflow occurring in spring when the snow mass melts and feeds the rivers. The strong influence of the snowmelt-dominated river regime is manifested by the relatively high Pardé coefficient in the spring months, which reaches or exceeds 180%. Therefore, it is unclear whether this region also did not have a snowmelt-dominated character before the 1980s. While some previous studies investigated selected aspects of decreases in snow-cover depth driven by the rising winter temperature in Poland in the years 1966/1967–2019/20 [29], no studies have considered the trends in wintertime runoff components and their dependence on rising temperatures and changing snowfall patterns. To fill this gap, this paper focused on quantifying the changes in snowfall, rainfall, baseflow, and quick flow, as well as their association with temperature during the cold season. The multi-year trends were examined in an exemplary typical mesoscale river basin of the Central European Lowland. This basin is situated in the middle eastern region of Poland, where the most intensive temperature increase was recorded at selected weather stations followed by a decrease in snow cover depth [29]. Decreasing tendencies were found in the snow metrics; however, the variability in the snow characteristics within both the winter season and the multi-year period was high [30].
The key scientific questions that needed to be answered in this study were as follows:
(1)
What are the signals of warming climate revealed by the changes in seasonal air temperature at the river basin scale?
(2)
What is the contribution of snowfall to the total precipitation? How does this change over a multi-year period, and what are the magnitude of the changes?
(3)
How does the temperature change impact the streamflow and the river regime?
It was hypothesized that the snowfall has remarkably decreased in the last seven decades, thereby leading to a decrease in S/P ratio. It was also hypothesized that the increasing trends in cold-season temperature are responsible for the changes in streamflow, with a higher component of baseflow being recharged by the increased fraction of rainfall to total precipitation.

2. Materials and Methods

2.1. Study Area

This study concerned the Liwiec River basin, a left tributary of the Bug River, which is situated in the Mazovian Lowland in central eastern Poland (Figure 1). The study area is located between 52°00′ N–52°30′ N and 21°30′ E–22°0′ E and belongs to the Central Poland Lowland, which is a part of the Central European Lowland [31]. The stream gauge is situated at the Łochów cross-section and closes the river basin at 2471 km2. The elevation ranges from 83 m a.s.l. near the outlet to 227 m a.s.l. in the southern part of the basin. The Liwiec River is about 142 km in length. The basin is influenced by a snowy, humid climate (Dfb) with a warm summer (see the updated Köppen–Geiger classification [32]). Monthly precipitation and air temperature are evenly distributed across the catchment and differentiate seasonally in four meteorological seasons: spring (March–May), summer (June–August), autumn (September–November), and winter (December–February). The annual precipitation is about 550 mm, of which 250–300 mm falls in the winter half-year (November–April). The average annual air temperature is 7.5 °C. The lowest temperatures are recorded in January; the average monthly temperature for this month is −4 °C. The highest values are recorded in July (an average monthly value of 19 °C). The studied area is characterized by a greater amplitude of air temperature compared to central and western Poland due to moderate continental impacts. The river regime is considered to be nival, with the highest streamflow rates usually occurring in March; the lowest streamflow rates usually occur in July and August and sometimes continue throughout September–October. Low flows might also occur in winter when snow cover blocks the groundwater recharge and the groundwater resource gradually depletes. When snow melts, a pronounced peak flow occurs. The aquifers are found in the Quaternary formations. They are directly recharged by precipitation, and the Liwiec River and its tributaries constitute a zone of natural drainage. The depth of the first groundwater table varies depending on the lithology of the surface formations, but in most of the area it does not exceed 5 m. In the highlands, aquifer sands are often found under less permeable loams. In the river valleys and in the flat areas in the north and south of the basin area, the unconfined aquifers form the subsurface. The land use is dominated by agricultural land (63%), which includes arable land (48%) and meadows (15%). The forest type is the second-most dominant (33%), while the rest of the territory is covered by artificial surfaces (3%) and other categories (1%).

2.2. Datasets

For the analysis of climate conditions, the air temperature and precipitation dataset was employed for 1950–2021 from version 25.0e of the station-based E-OBS gridded dataset (https://www.ecad.eu; accessed on 19 June 2022) available from the European Climate Assessment and Dataset Project [33]. It comprised daily precipitation (P) and air temperature (T) values acquired from a regular latitude/longitude grid of 0.1° × 0.1° (Figure 1b). For the Liwiec River basin, the data subset was extracted as a 3D-gridded dataset of 6 × 12 × 25,933 dimensions, which corresponded to 6 latitude grid cells, 12 longitude grid cells, and 25,933 daily solutions. Using the daily gridded values, the basin scale, monthly air temperature, and precipitation estimates were calculated, and then the average values for the months November–April were calculated to represent the cold-season conditions. This approach followed the convention of the water year, which was designated in Poland as a 12-month period (November–October) that consists of the “winter half-year” (cold season) and “summer half-year” (warm season) [34,35]. It is worth noting that the cold season is considered to be the 6-month period starting on November 1 of a particular year and lasting until the end of April in the next calendar year. For example, the values representing the cold season of the year 1951 were calculated using the monthly values starting in November 1950 and ending in April 1951. Using these monthly values, the cold-season precipitation and air-temperature time series were calculated and tested for the presence of a trend as explained in Section 2.3.2.
For the analysis of snowfall patterns, the air-temperature threshold approach was applied to partition the precipitation into rain and snow fractions [36]. Since the E-OBS data did not differentiate between rain and snow, it was assumed that all precipitation fell as snow below a threshold of 1.20 °C and as rain above this threshold. This threshold is near the upper bound of the transition temperature across the Liwiec River basin as revealed in [36]. The threshold temperature across the basin is evenly distributed in a narrow range of 1.19 to 1.22 °C. The threshold data covering the territory of Poland were prepared at a resolution of 0.5° × 0.625° (latitude × longitude) based on 89 meteorological stations distributed across the country. The spatial resolution of the threshold temperature data was coarser than the E-OBS dataset; thus, resampling to a common resolution of 0.1° × 0.1° was required to keep the information from the finest layers. Using the 3D-gridded air-temperature dataset of 6 × 12 × 25,933 dimensions, a binary mask was prepared; grids with a temperature above the threshold were set to zero while the remaining grids received a value of 1. This binary representation of snowfall occurrence was used to differentiate between snow and rain in daily precipitation data stored in the 3D matrix of 6 × 12 × 25,933 dimensions. Moreover, the daily snowfall and rainfall values were accumulated into monthly values and averaged for the entire river basin. For the 6-month cold season, the air temperature (T), snowfall (S), and rainfall (R) time series consisted of 71 values covering the period of 1951–2021.
To analyze the possible impacts of the warming climate on the river regime, the daily streamflow data for gauging station no. 152210120 (Liwiec River, Łochów cross-section) were acquired for the water years of 1951–2021 from https://danepubliczne.imgw.pl/data (accessed on 30 August 2022). The data were prepared and verified by the Institute of Meteorology and Water Management—National Research Institute in Warsaw, Poland (IMGW-PIB). The procedure used to separate the hydrograph into baseflow and quick flow is described in Section 2.3.1. For the cold season, the streamflow (QT), baseflow (QB), and quick flow (QQ) time series were tested for the presence of trends as explained in Section 2.3.2.

2.3. Methods

2.3.1. Hydrograph Separation into Quick Flow and Baseflow Components

The daily streamflow (QT) time series were analyzed for the water years of 1951–2021, and the two components of baseflow (QB) and quick flow (QQ) were separated from the total flow (QT). The HYDRORECESSION toolbox was used for the streamflow recession analysis [37]. Aksoy and Wittenberg’s method [38] was applied to the extraction of recession segments, in which negative dQT/dt values were considered to represent the recession of the hydrograph composed of the baseflow. Here, the minimum duration of the recession segment was set to 10 days, and the filter criterion (removed days) was assumed to be 5 days. The Wittenberg filter method was applied to the daily streamflow for baseflow separation, which assumed that the baseflow recession segment satisfied the nonlinear relationship of S = aQb. The optimal model parameters were determined via linear regression (least squares). The cold-season and monthly values of QB and QQ were extracted and examined. Then, the baseflow index was calculated as BFI = QB/QT, and the quick flow index was determined as QFI = QQ/QT.

2.3.2. Trend Detection

A non-parametric Mann–Kendall (MK) test [39,40] was applied to detect trends in the precipitation, air temperature, and streamflow data time series. Moreover, the components of precipitation (snowfall and rainfall) and streamflow (baseflow and quick flow) were also tested for the presence of temporal trends. The MK test was used to test the null hypothesis of no trend (H0) against the alternative hypothesis (H1) that there was an increasing or decreasing monotonic trend. The trends were tested at a significance level of alpha = 0.05. The magnitude (slope) of an existing trend (as change per year) was calculated using the directional coefficient expressed by the Theil–Sen estimator [41,42]. A positive slope value suggested an increasing trend, and a negative slope value indicated a decreasing trend. If change was not statistically significant but showed an inclination, it was called a tendency. The Climate Data Toolbox (CDT) for MATLAB [43] was used to calculate the MK standardized test statistic (Z) and the p-value.

2.3.3. Spearman Rank-Order Correlation for Similarity Assessment between Trends

As a measure of the strength of the link between trends in the monthly time series of temperature and other variables (including snowfall, rainfall, baseflow, and quick flow), a non-parametric Spearman’s rank-order correlation coefficient (RS) was calculated and evaluated at a significance level of alpha = 0.05. This assessed the relationship between two variables without making any assumptions about the frequency distribution of the variables. The Spearman rank-order correlation was equal to the Pearson correlation between the rank values of the two variables and ranged between −1 and 1. For each variable, the monthly trend rates were ranked and the strength of the link between trends in air temperature and other variables was assessed. The tested hypothesis was that with the rising temperature, snowfall would decrease, rainfall would increase, and significantly more baseflow would occur. Statistically significant results were given a p-value < 0.05. The pairs with positive-correlation coefficients tended to increase or decrease together, while negative-correlation coefficients indicated a relationship between two variables in which an increase in one variable was associated with a decrease in the other. The MATLAB Statistics and Machine Learning Toolbox (Release 2021) was used for all statistical analyses.

2.3.4. Shift-Type Changes in the River Regime

In this study, the ratio of the accumulated annual snowfall to the annual total runoff (S/QT ratio) was used to examine the role of snowmelt in the seasonal streamflow patterns. This metric was introduced in [1] to determine whether or not runoff was snowmelt-dominated using the criterion of S/QT > 0.5. The shift-type changes were analyzed, and the time series of S/QT was partitioned into two subseries. The separation into two subperiods was achieved by minimizing the sum of the residual (squared) error of each subset from its local mean and finally returning the index, which in this case was the year in which the change occurred. The change point was identified using the MATLAB function “findchangepts”. A complete 71-element S/QT time series was divided into subperiods of differing lengths that consisted of 20 and 51 records covering the years of 1951–1970 and 1971–2021, respectively. Finally, a Kruskal–Wallis test was applied to test for statistically significant differences between the subseries in the two selected subperiods [44,45]. This was a non-parametric test that compared the mean ranks (i.e., medians). For this test, the null hypothesis was that the subseries medians would be equal (versus the alternative of a difference between them).

3. Results

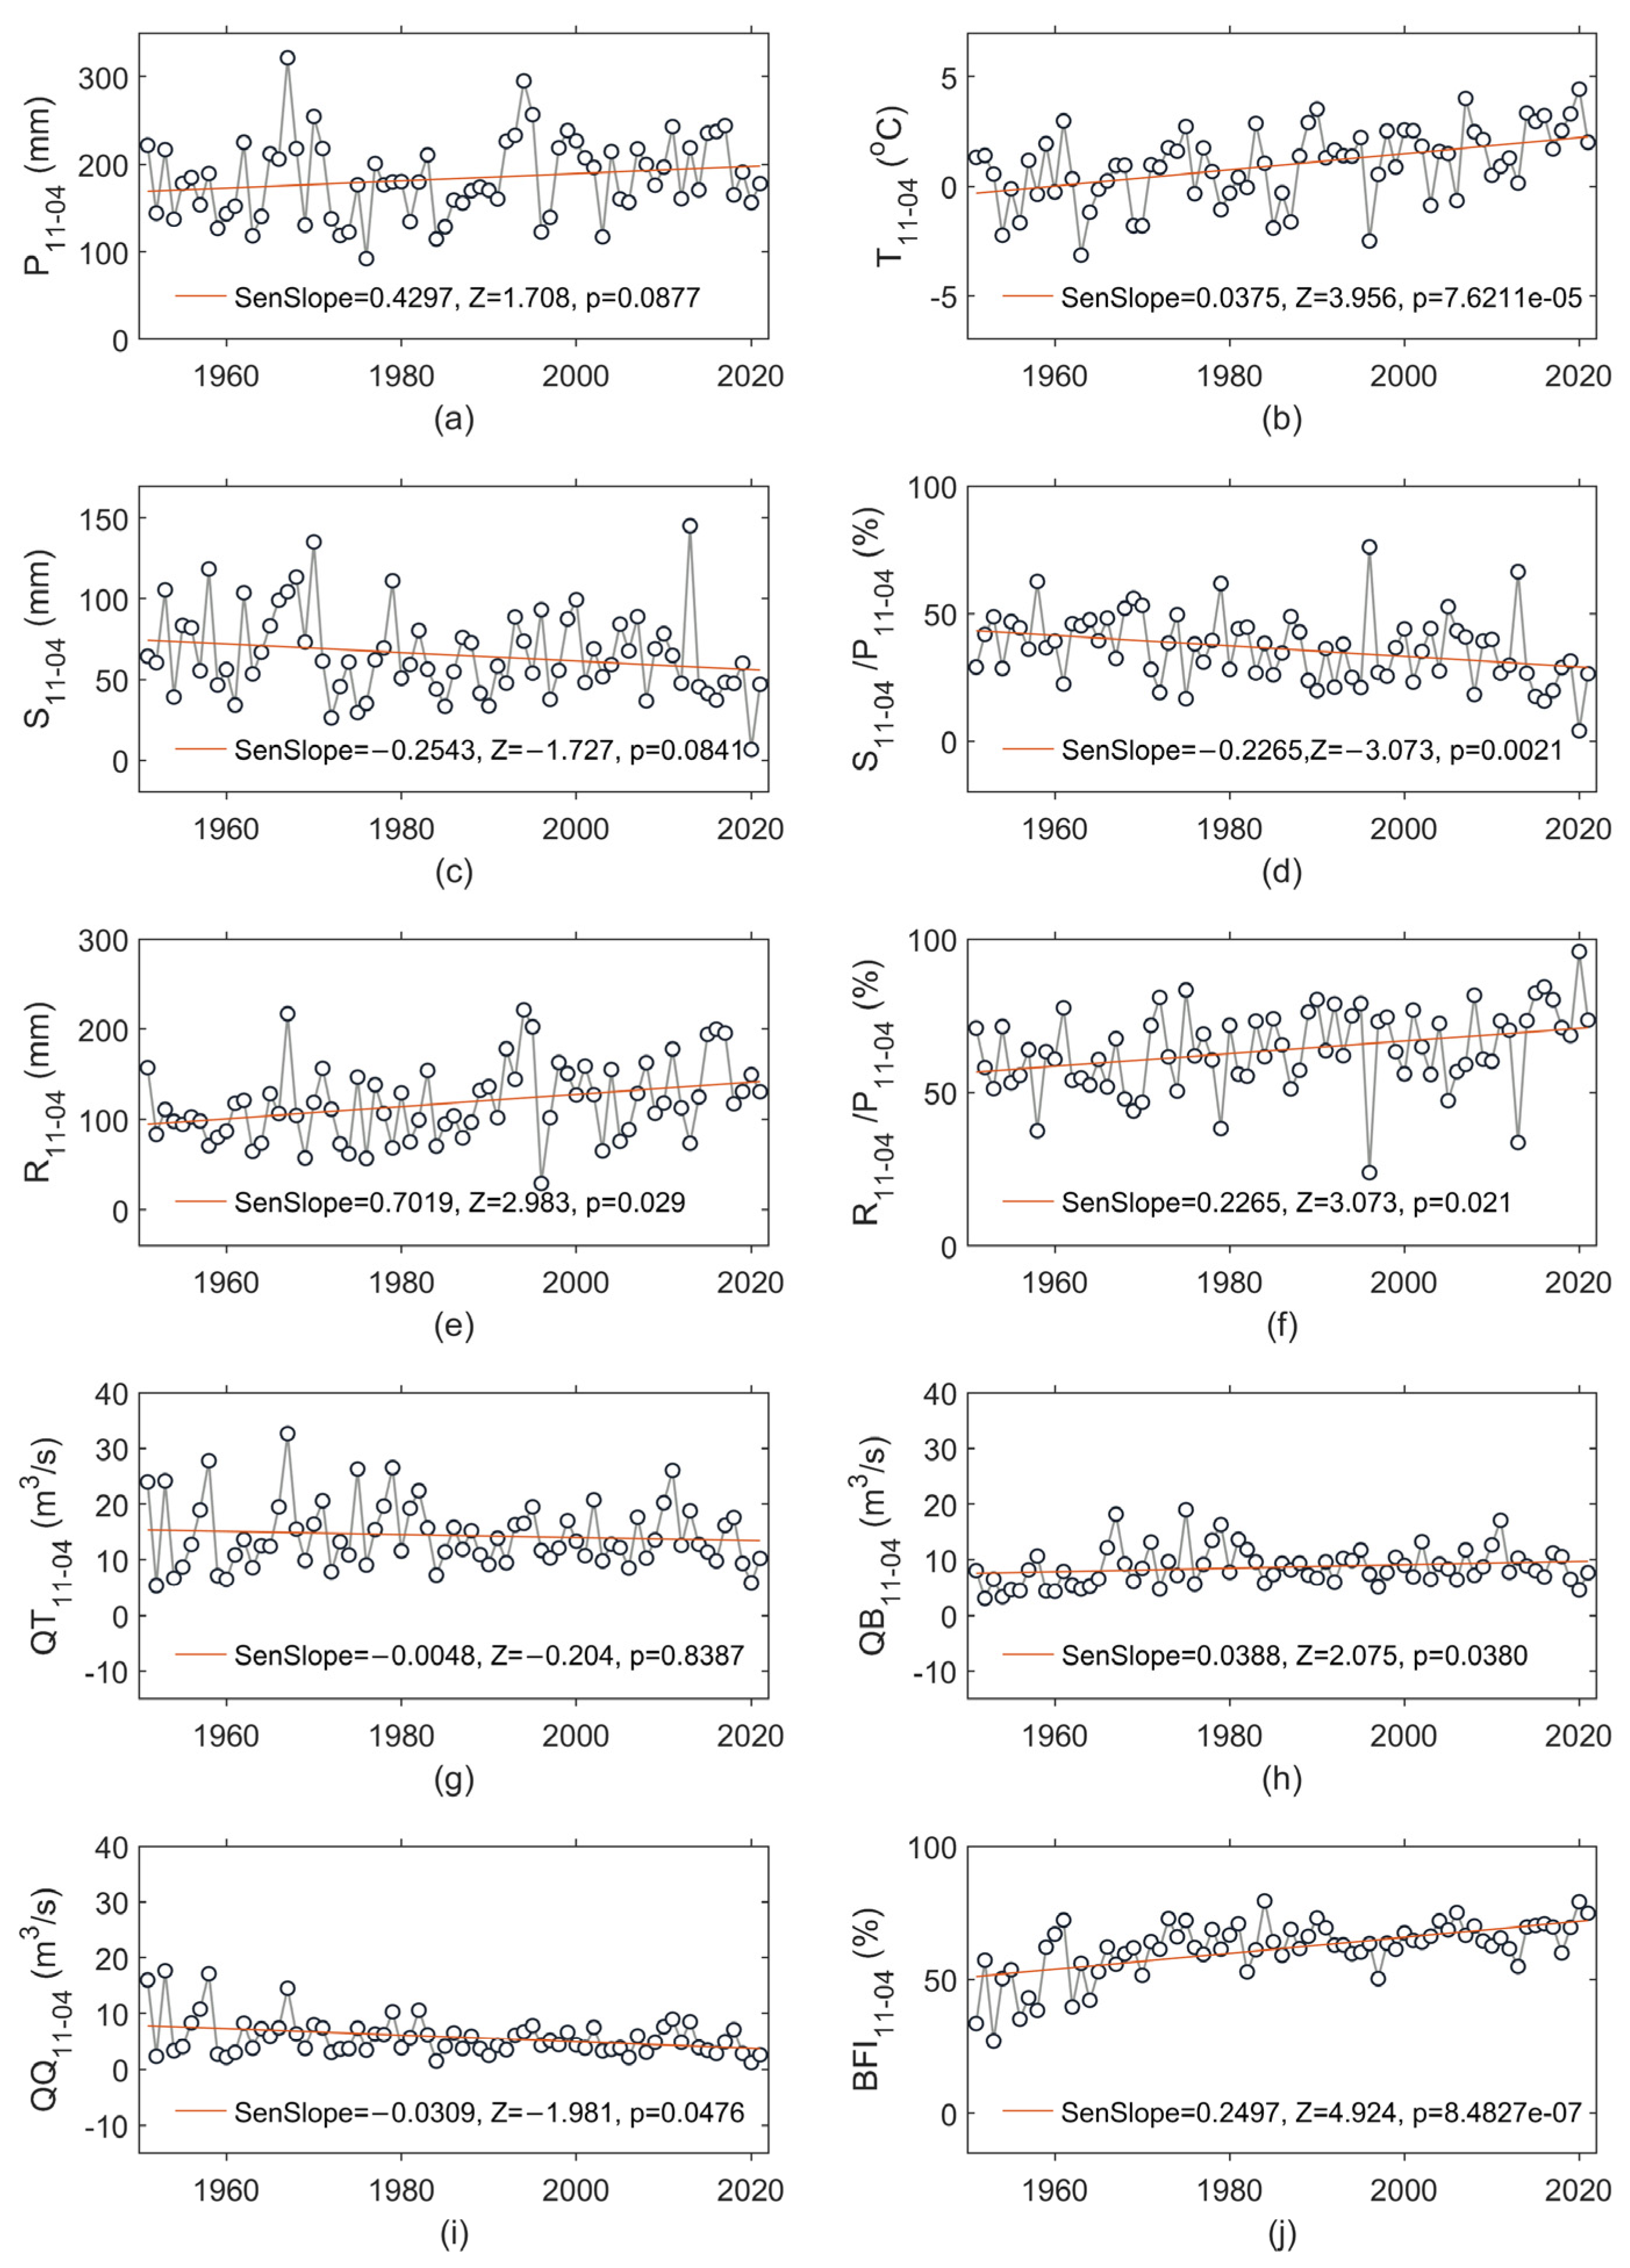
3.1. Cold-Season Trends in Hydroclimatic Variables over the Period of 1951–2021

Figure 2 shows the course of the cold season’s hydrometeorological variables over the years of 1951-2021, including the precipitation (P11-04), air temperature (T11-04), snowfall (S11-04), snowfall-to-precipitation ratio (RSP11-04 = S11-04/P11-04), rainfall (R11-04), rainfall-to-precipitation ratio (RRP11-04 = R11-04/P11-04), streamflow (QT11-04), baseflow (QB11-04), quick flow (QQ11-04), and baseflow index (BFI11-04). Statistically significant changes occurred in the time series of air temperature (increasing trend; Figure 2b), snowfall-to-precipitation ratio (decreasing trend; Figure 2d), rainfall-to-precipitation ratio (increasing trend; Figure 2f), baseflow (increasing trend; Figure 2h), quick flow (decreasing trend; Figure 2i), and baseflow index (increasing trend; Figure 2j). The T11-04 showed a trend rate of ~0.38 °C/decade, while a trend rate of ~−2.27%/decade was detected in RSP11-04. Consequently, RRP11-04 showed an increase of ~2.27%/decade. Thus, the gradual temperature increase was accompanied by a decrease in the snow-to-precipitation ratio and an increase in the proportion of the liquid phase in the precipitation (RRP). The warmest cold season occurred in 2020 with a T11-04 of 4.4 °C, while the coldest occurred in 1963 with a T11-04 of −3.2 °C (Figure 2b). Generally, the lowest values of T11-04 were recorded in the first half of the analyzed period, while the highest were recorded in the last two decades. In response to the slightly increasing tendency in P11-04 and the significant increase in T11-04, QT11-04 did show a slight decreasing tendency of ~0.048 m3s−1/decade (Figure 2g), which was equivalent to 0.06 mm/decade, while QB11-04 increased with a trend rate of ~0.39 m3s−1/decade (Figure 2h), which was equivalent to 2.46 mm/decade. Thus, the changes in QB11-04 reached ~17.44 mm over 71 years.

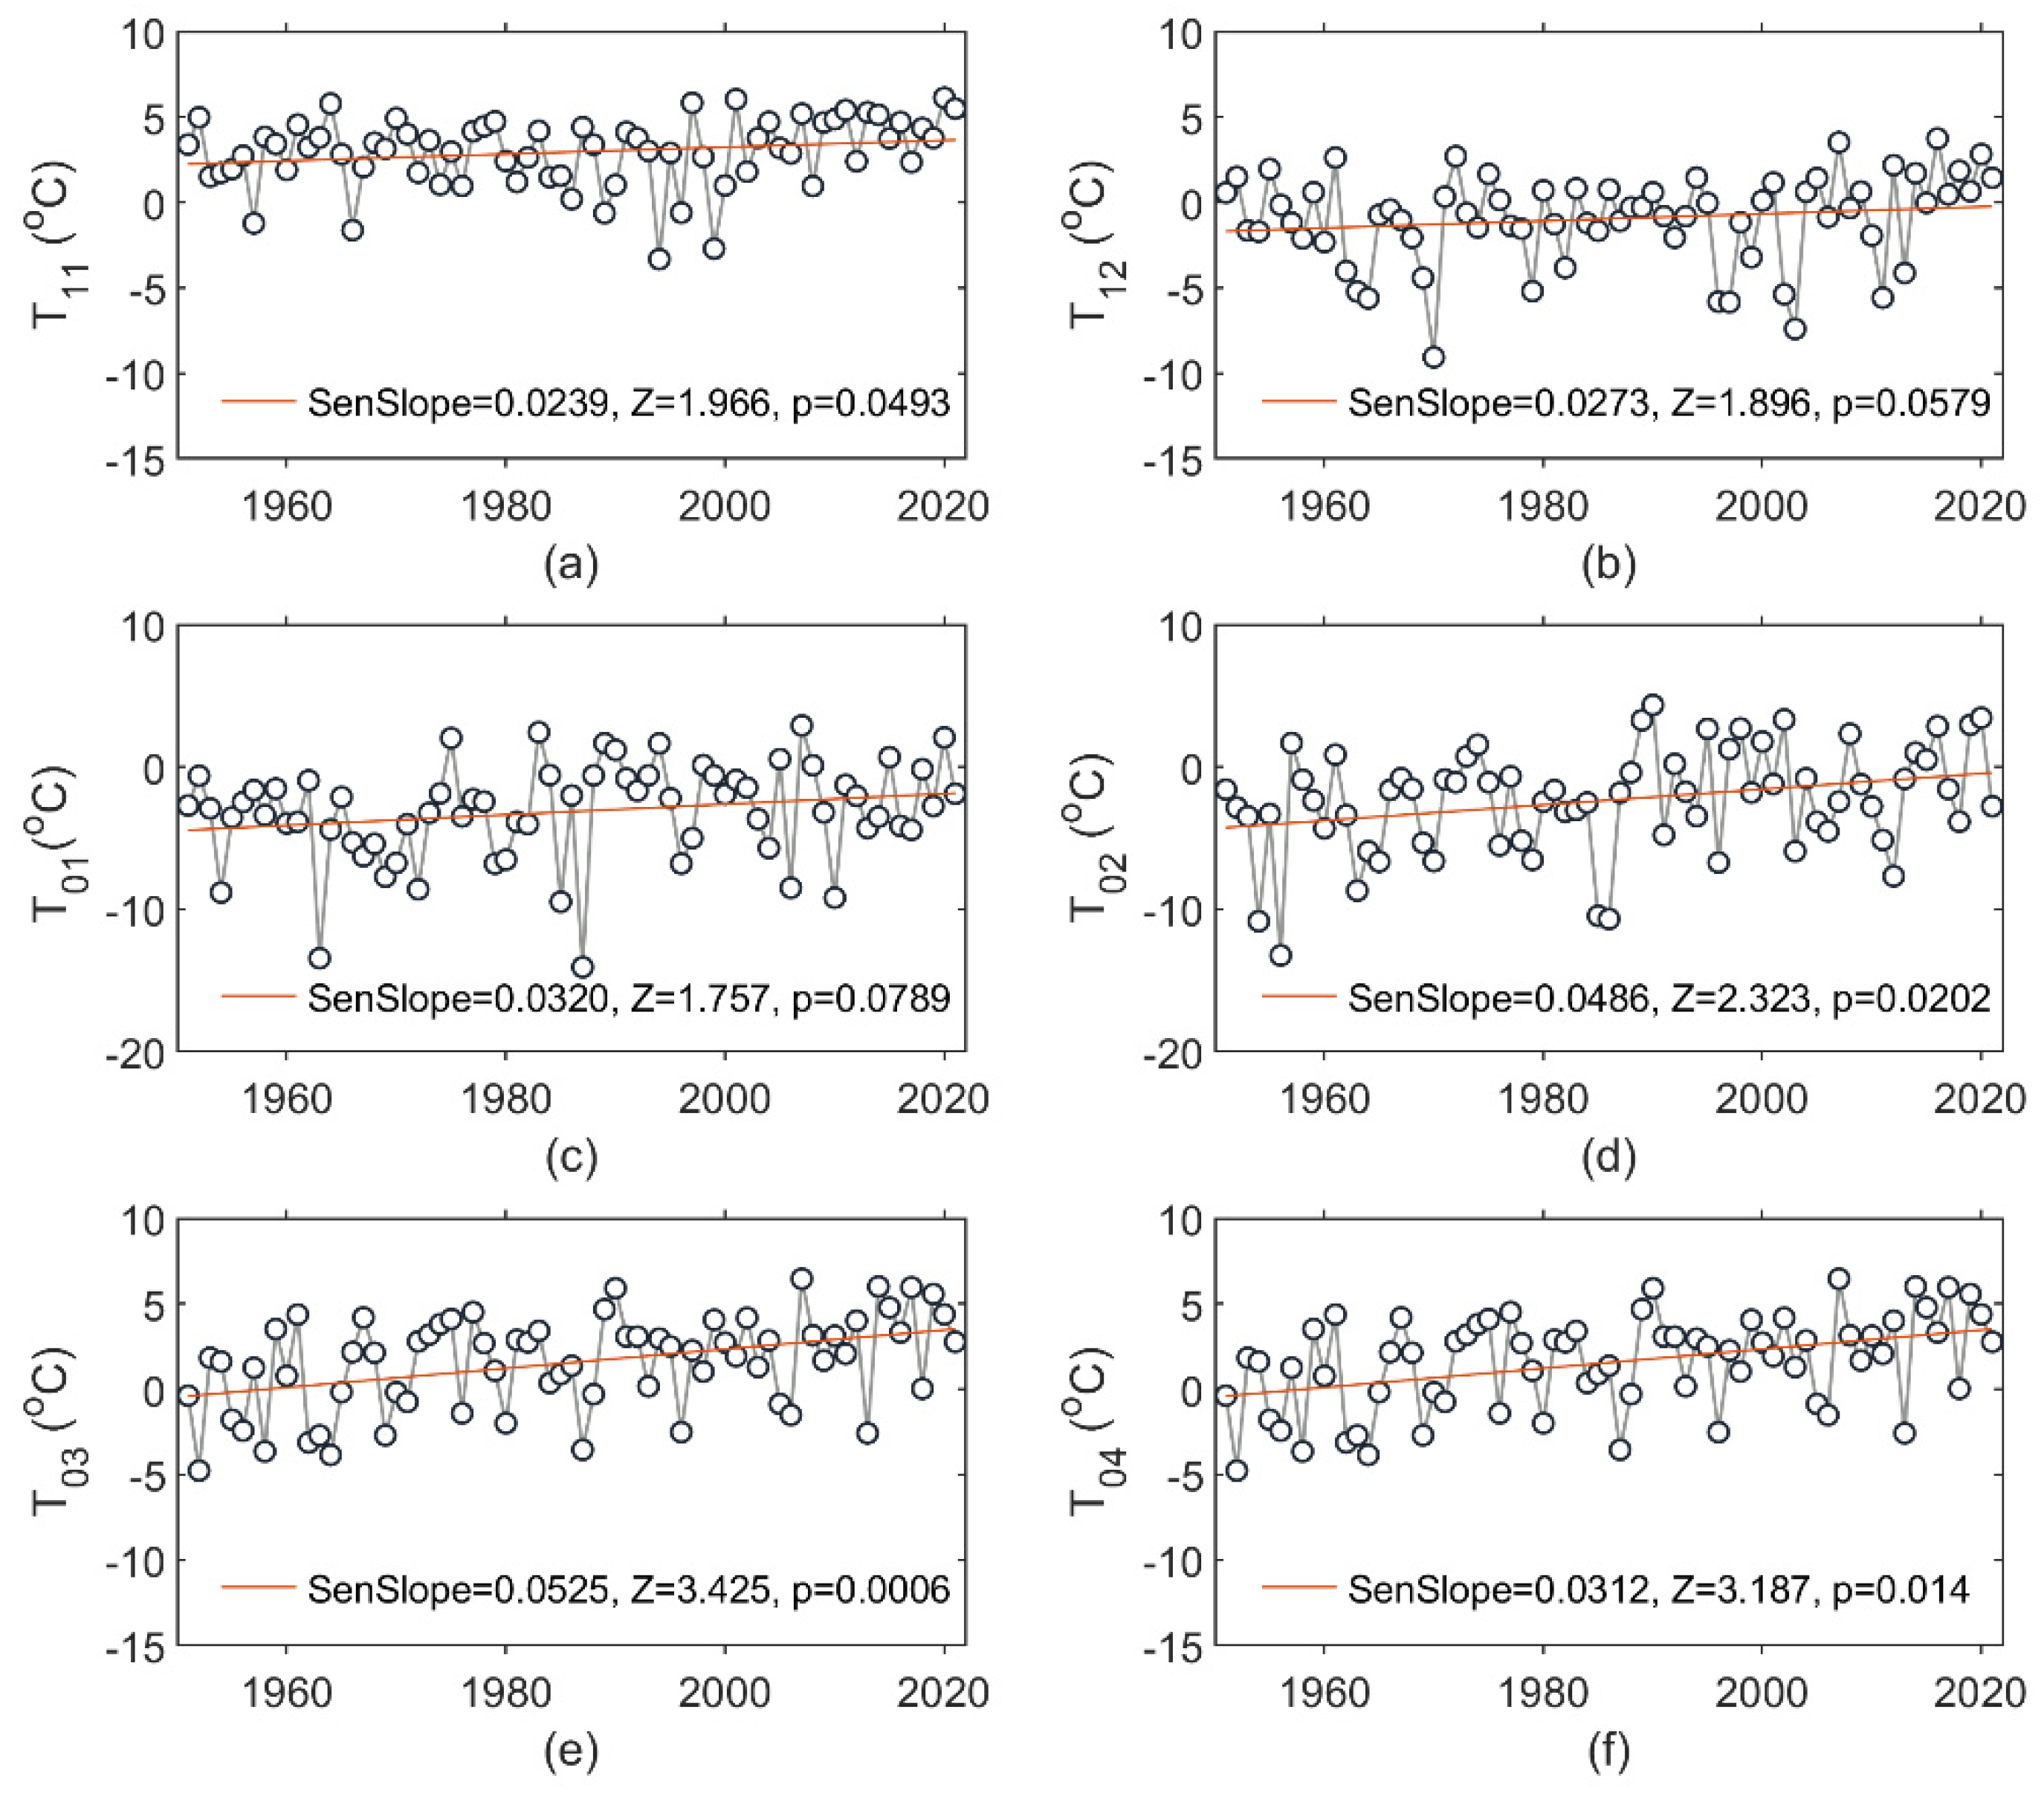
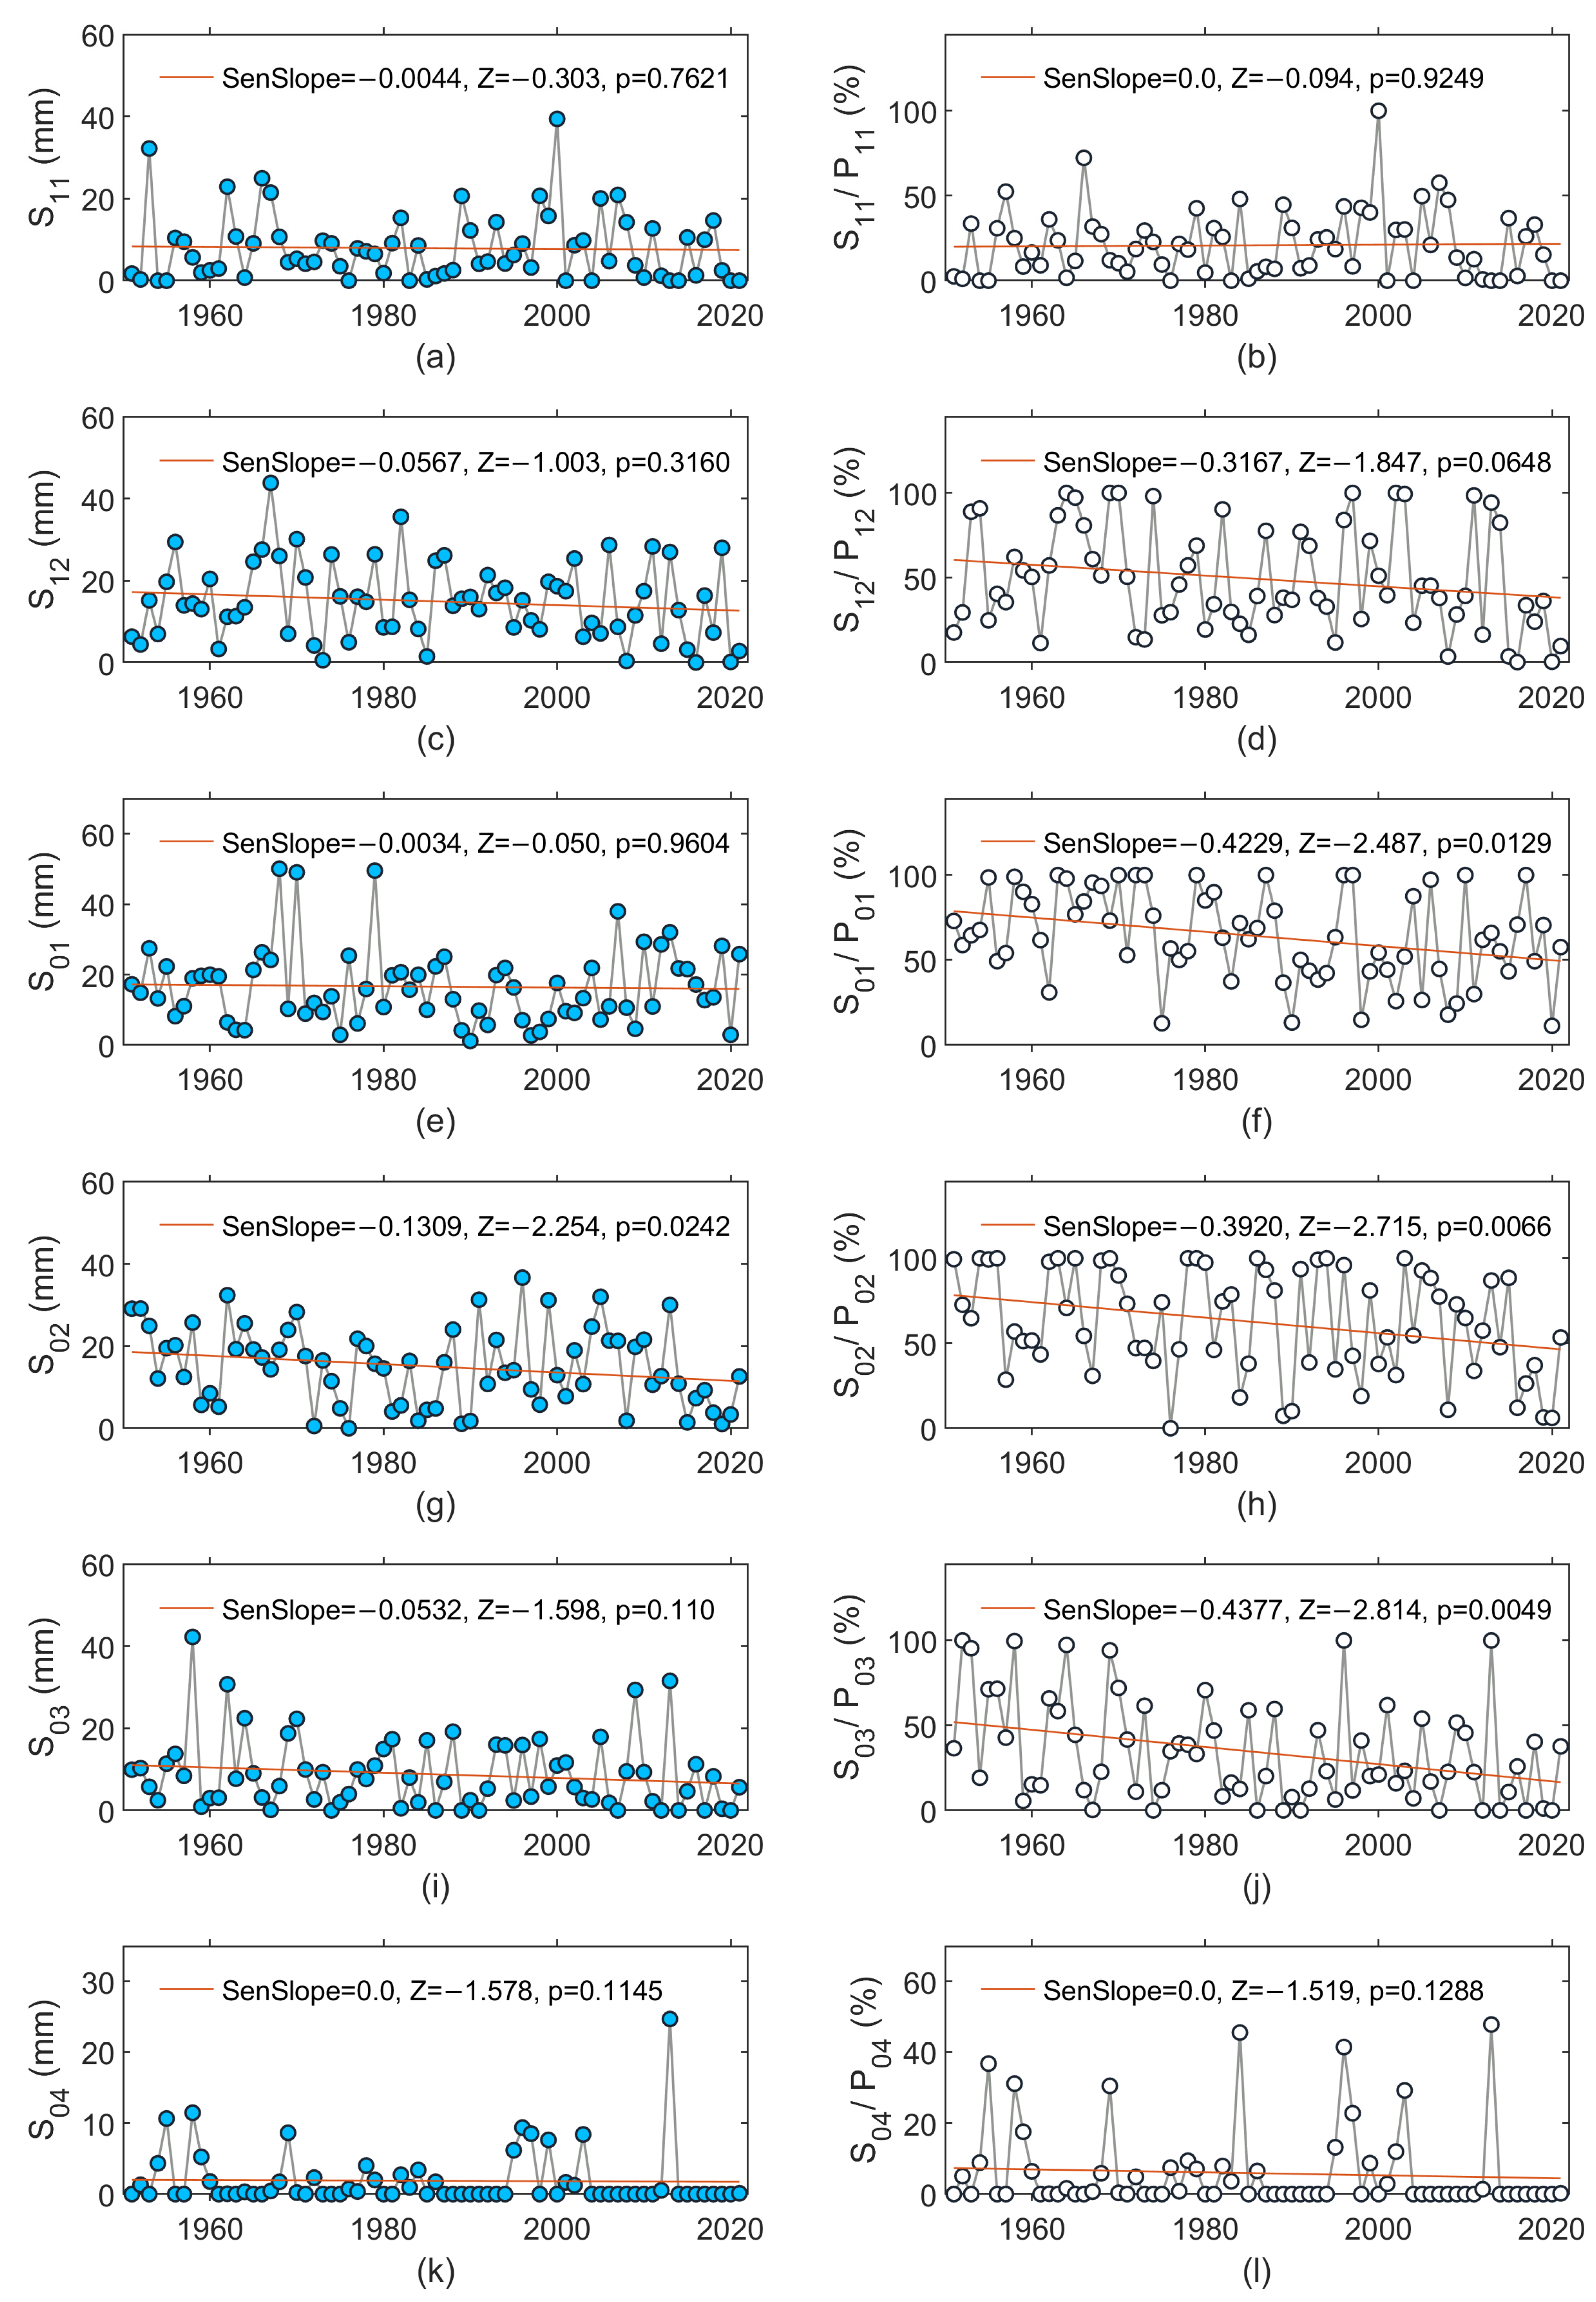
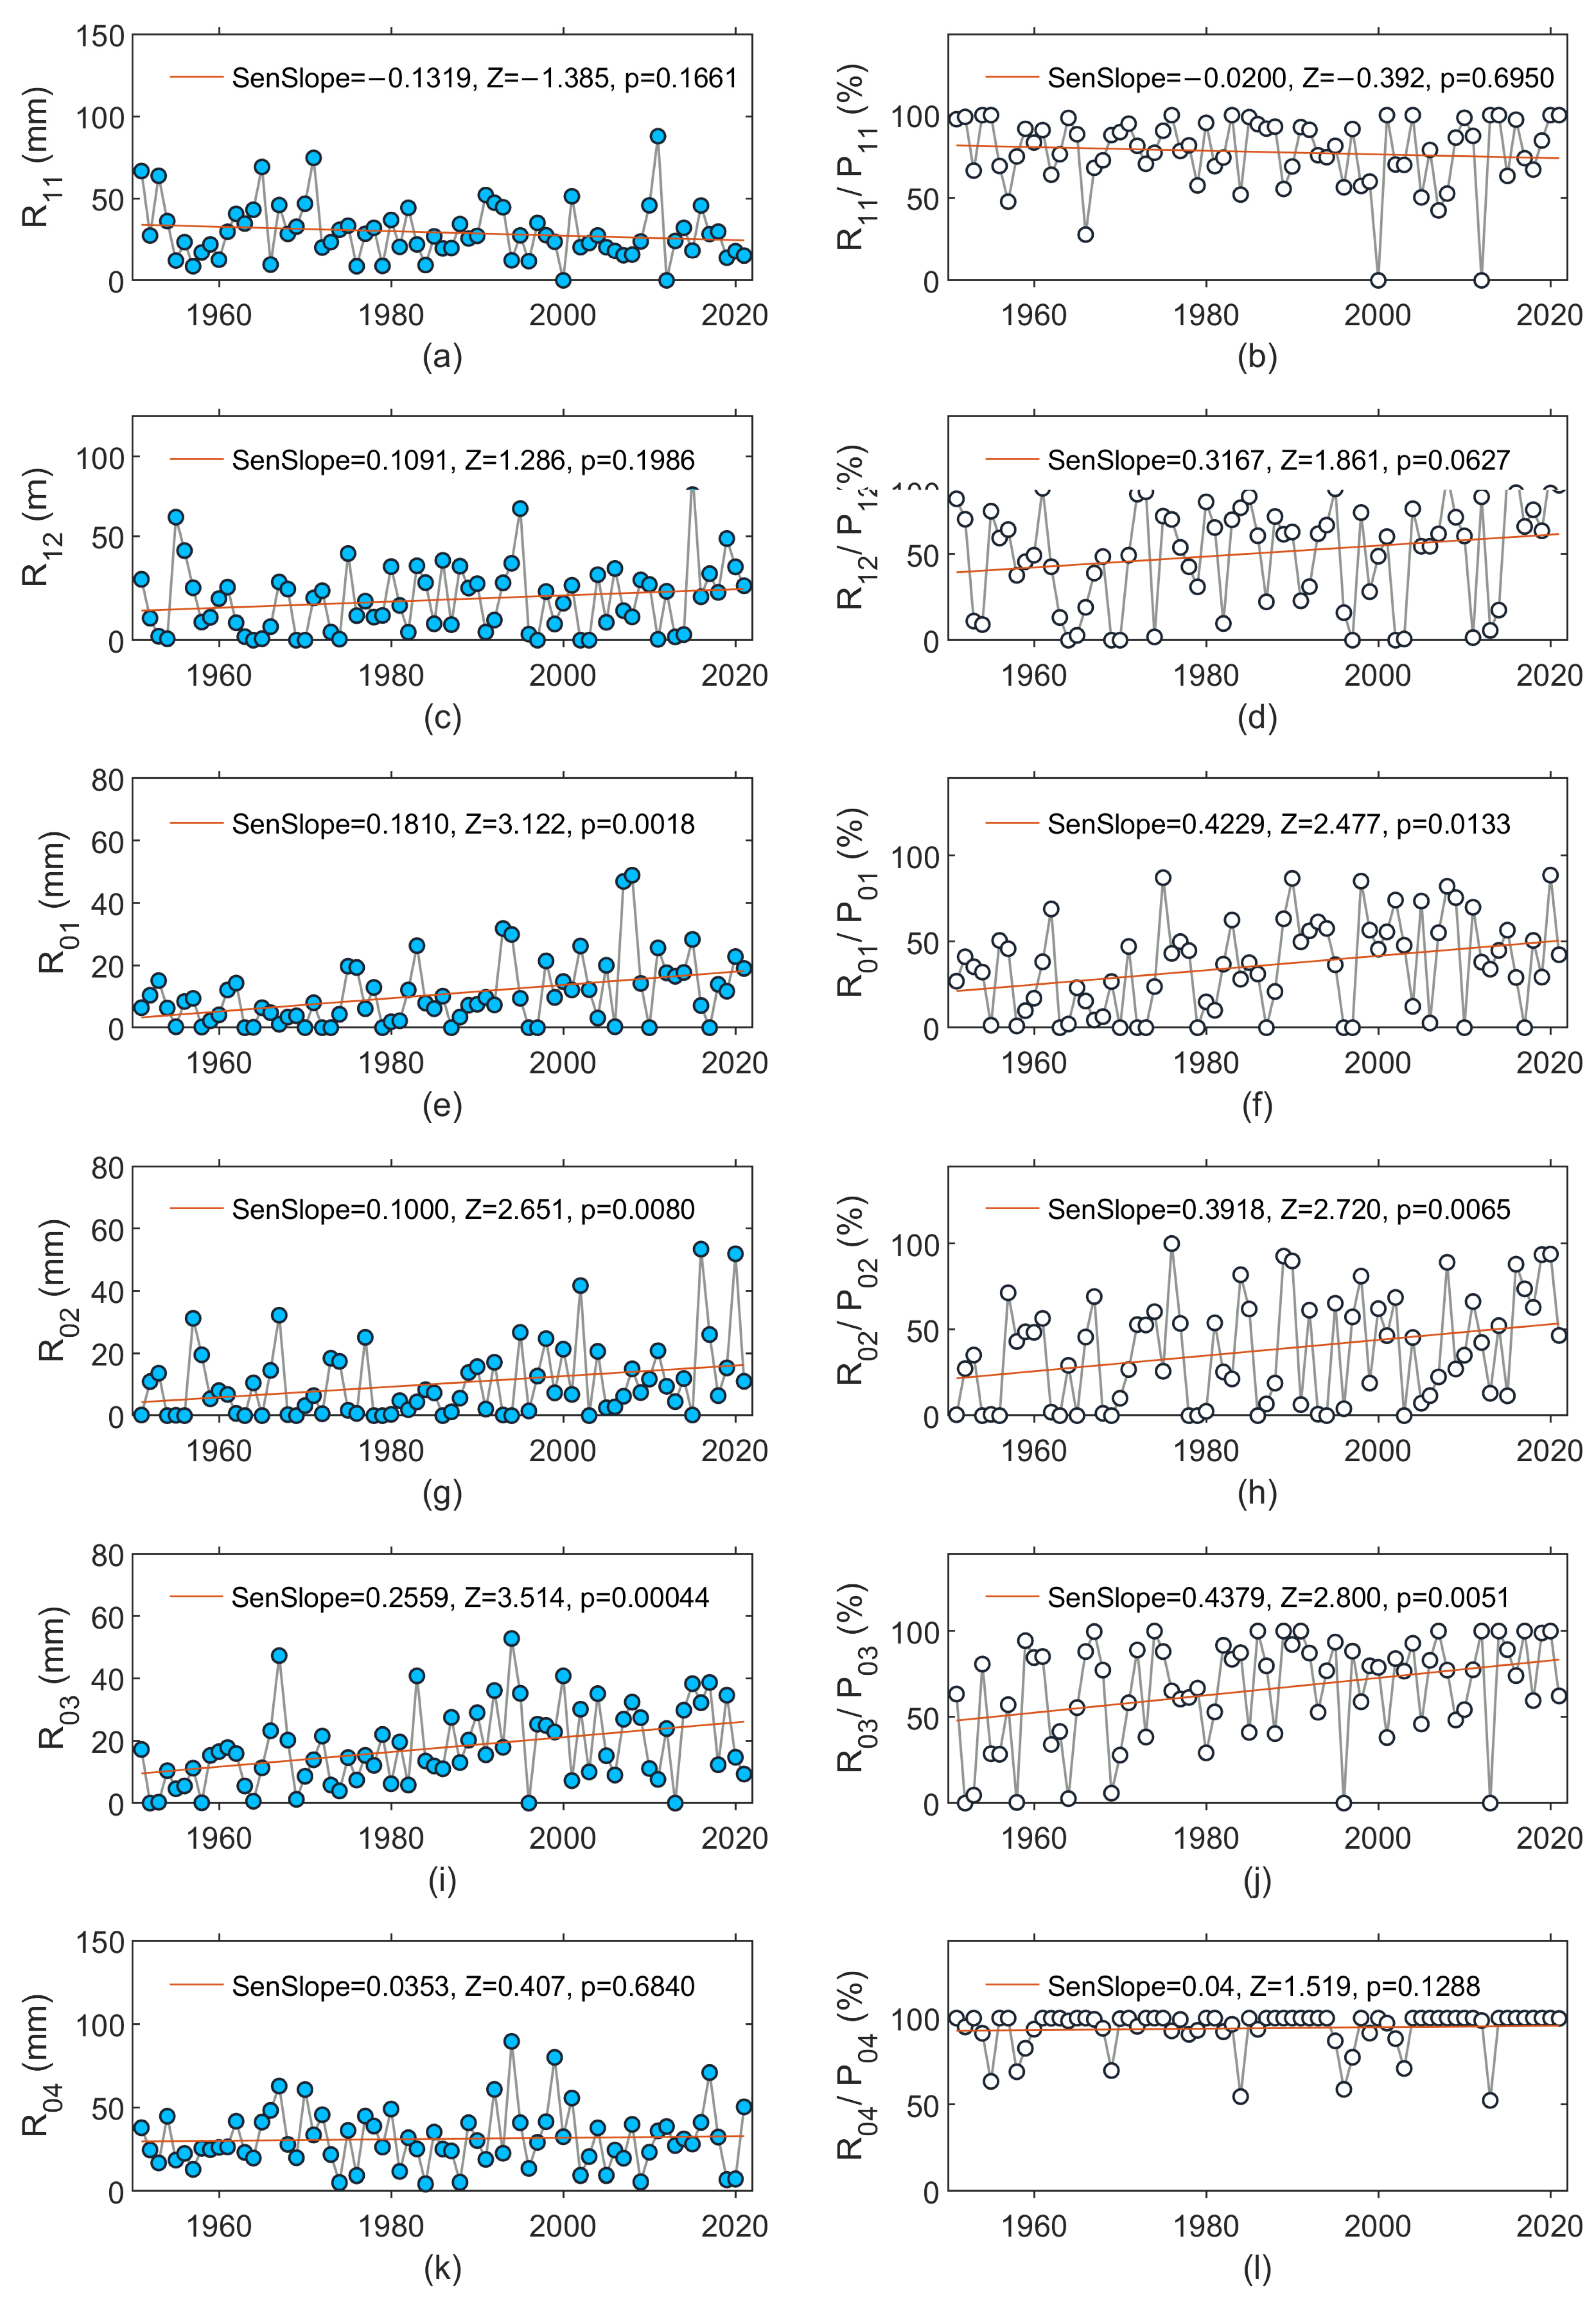
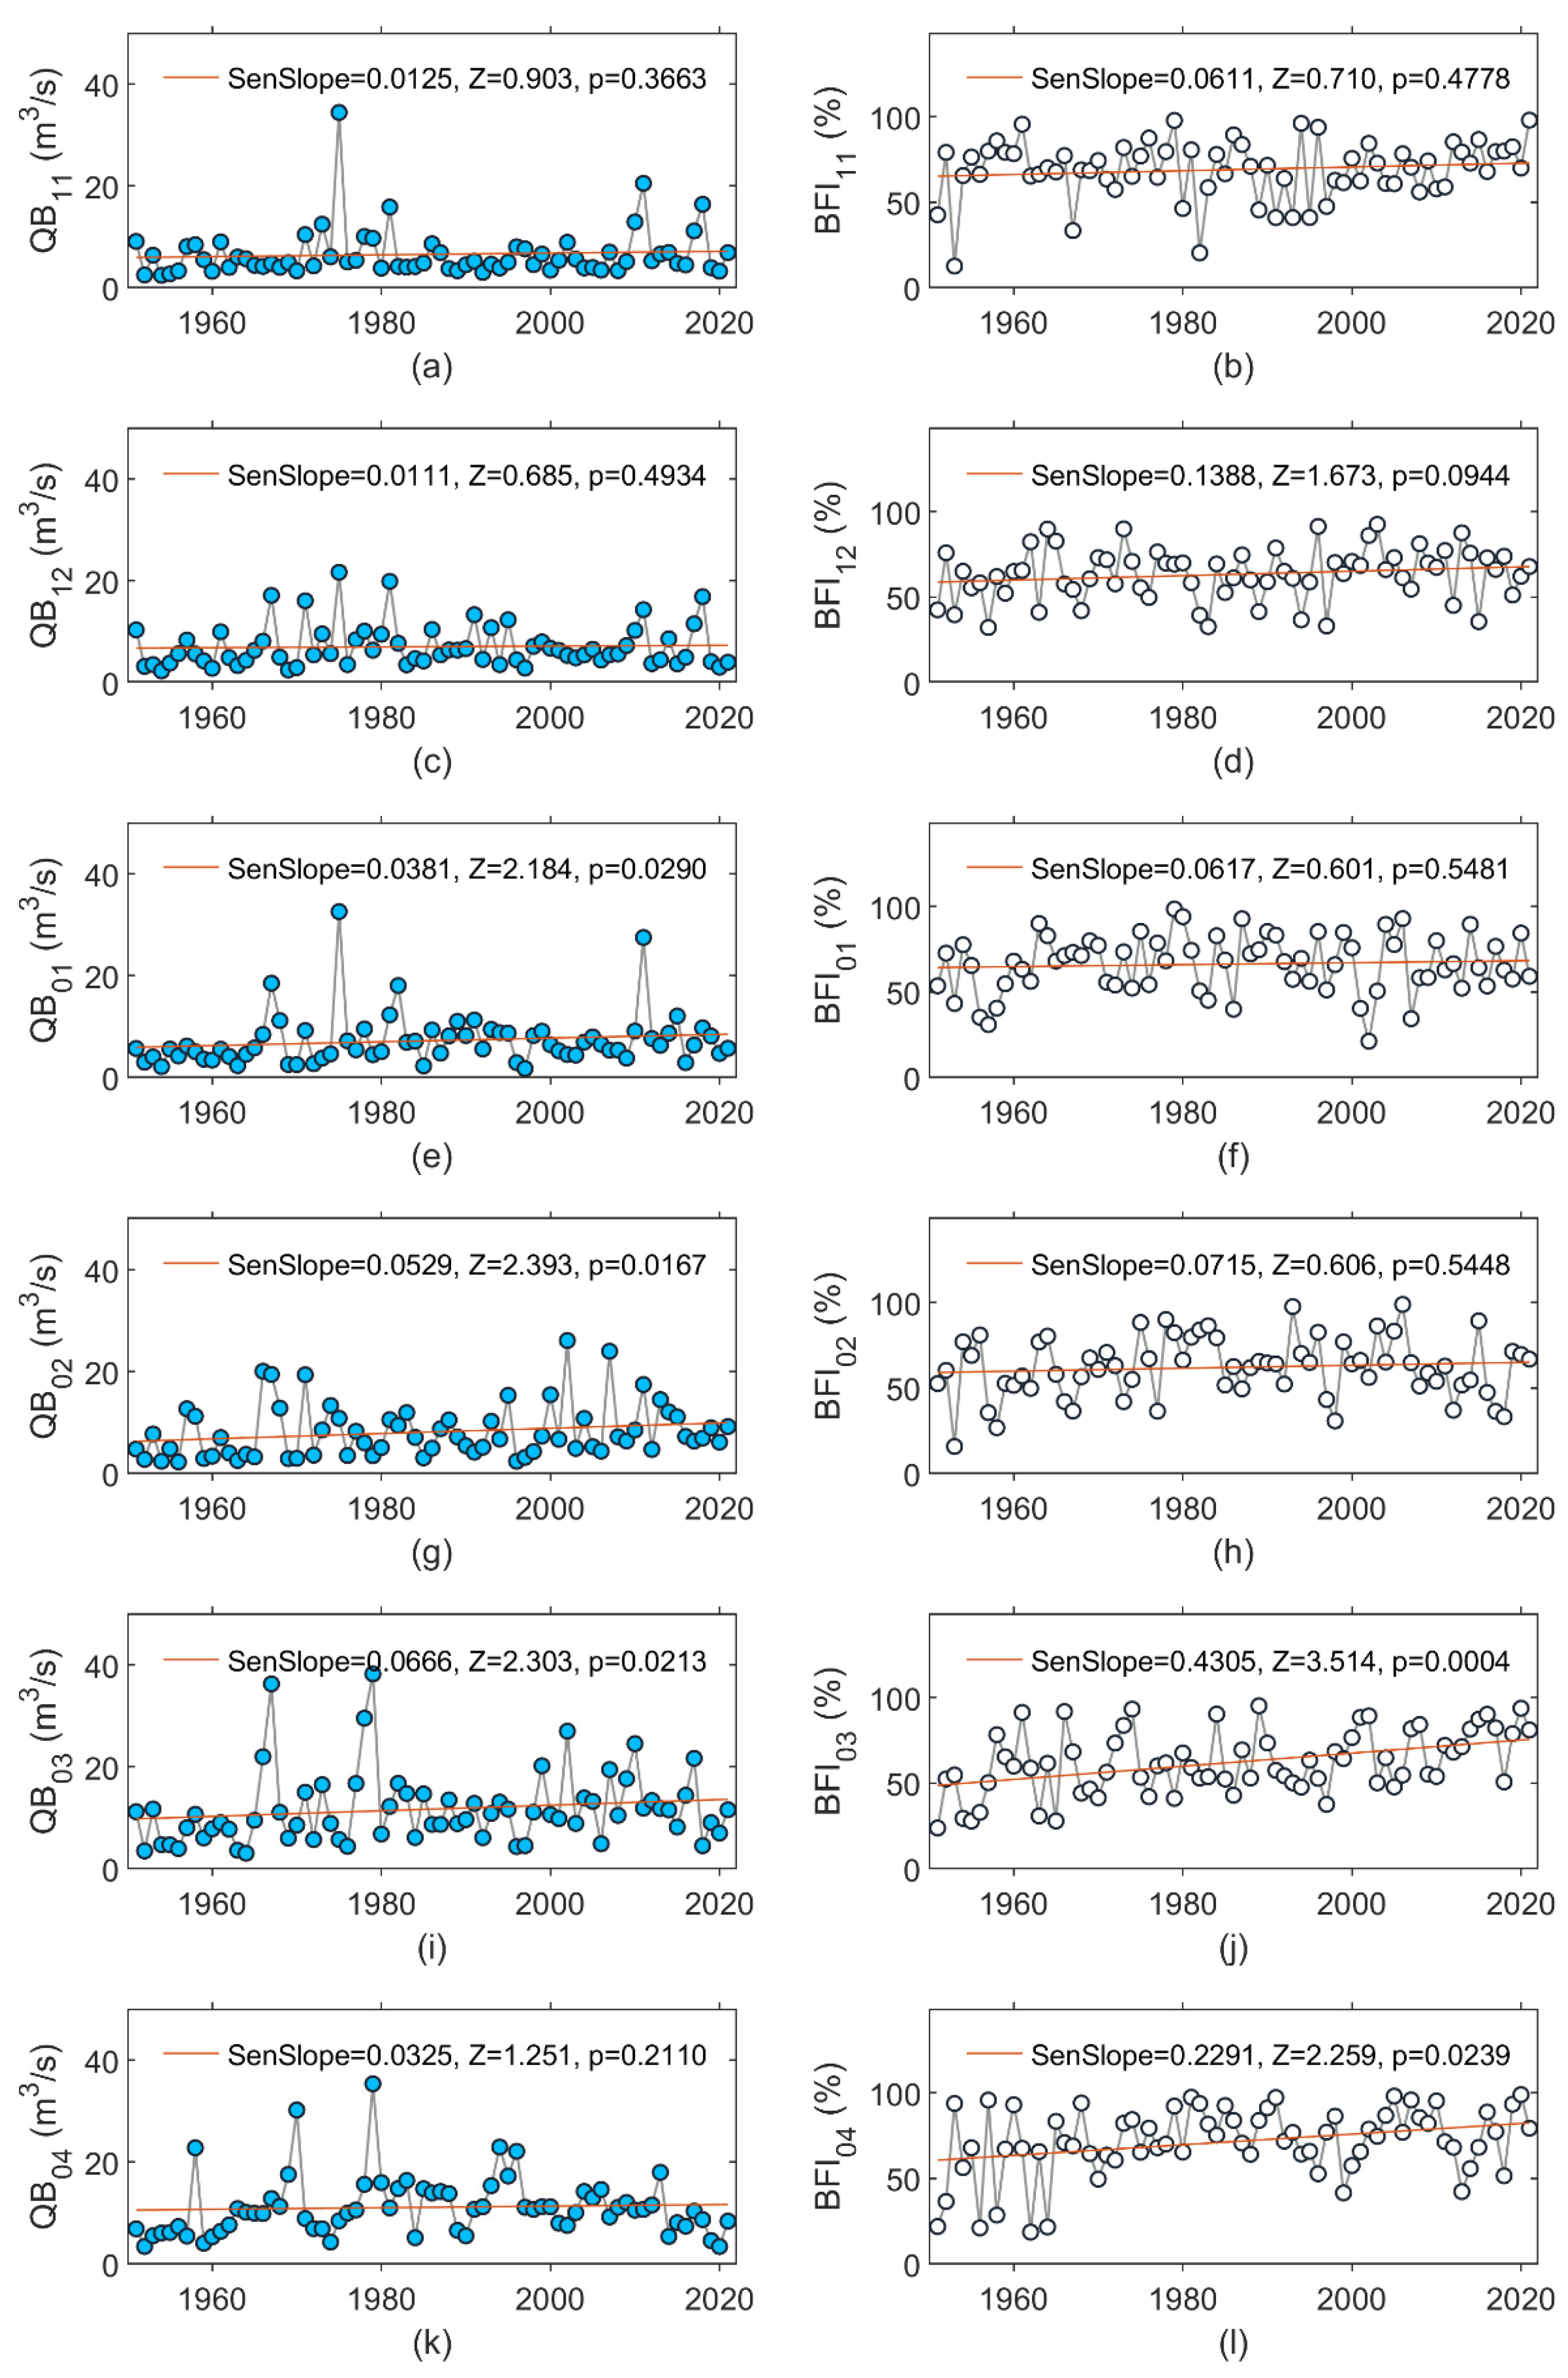
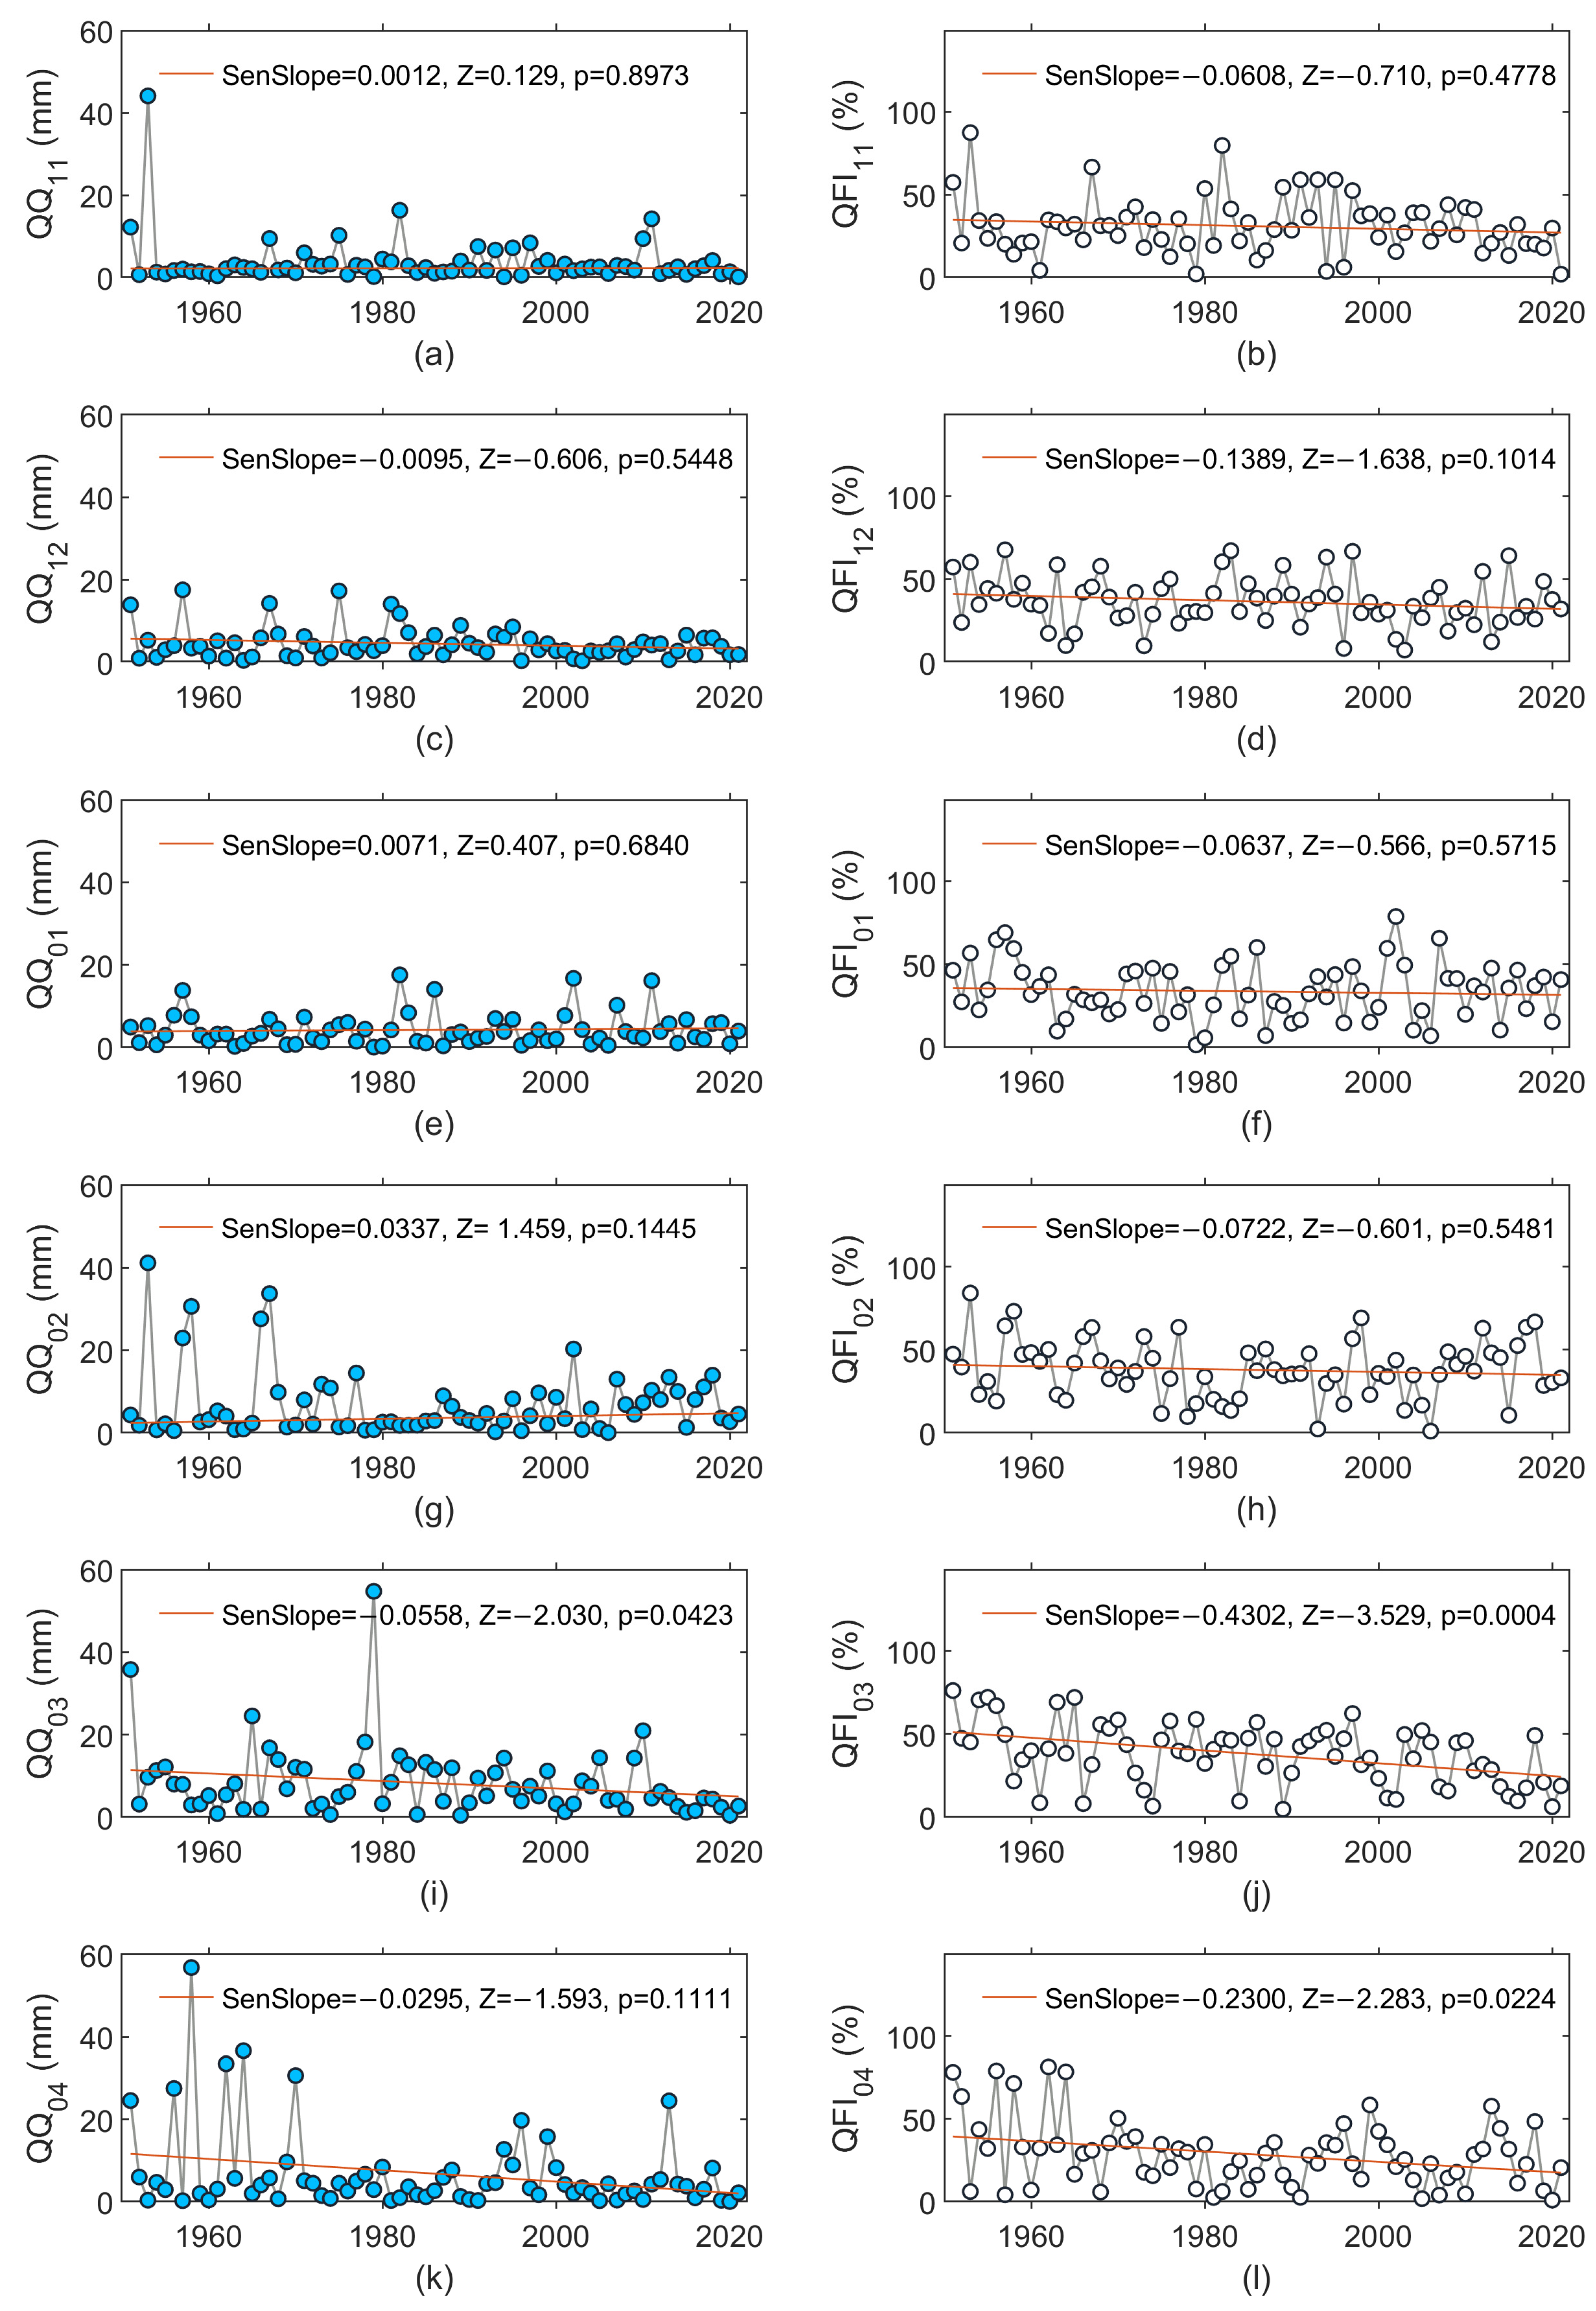
3.2. Trends in Monthly Hydroclimatic Variables over the Period of 1951–2021

Temperature is a prime factor that determines the occurrence of precipitation as rain or snow [46]. Therefore, this study primarily examined the air-temperature trends over the multi-year period of 1951−2021 as an area-weighted average across the entire river basin. Figure 3 shows the course of monthly air temperature (T) in the cold season that lasted from November to April. The multi-year rate of change in the monthly T was equal to 0.24, 0.27, 0.32, 0.49, 0.53, and 0.31 °C/decade for consecutive months of the cold-season period, respectively.
For the months of November, February, March, and April, these changes were statistically significant; the highest rates occurred in February and March. In December and January, the change also showed an increase.
Examining changes in the monthly snowfall and snowfall-to-precipitation ratio yielded substantially consistent results (Figure 4). With an increasing temperature, in all six months of the cold season, a decreasing tendency was seen regarding the snowfall amount, which was statistically significant in February. In January, February, and March, the snowfall-to-precipitation ratio decreased ~4%/decade in each month (Figure 4f,h,j); therefore, in 71 years, it decreased by ~28%. When considering the change in the six-month cold season, S11-04 decreased at a rate of ~2.5mm/decade (Figure 2c) for a total decrease of ~18 mm in 71 years, and RSP11-04 decreased by 2.3%/decade (Figure 2d), which accounted for 16% in 71 years. Consequently, the monthly rainfall increased in five of the six months of the cold season (from December to April, with the highest increase in March) by ~2.56 mm/decade (Figure 5i), which represented a rate of ~18 mm in 71 years. The highest increase in RRP occurred in the months of December, January, February, and March within a range of ~3.2–4.4%/decade (Figure 5d,f,h,j), which represented a range of 23–31% in 71 years.
Changes in the monthly baseflow and BFI are shown in Figure 6, while the changes in the quick flow and QFI are presented in Figure 7. A statistically significant increase in QB occurred in January, February, and March; while in November, December, and April, growing tendencies were registered. In all six months, BFI showed an increase that was statistically significant in March and April (Figure 6j,l). Inverse changes were noted for QFI, which showed statistically significant decreasing changes in March and April (Figure 7j,l).

3.3. Similarity between Trends over the Period of 1951–2021

The Spearman rank-order correlation coefficients (RS) expressed the strength of a link between trends in the monthly temperature time series and other variables, including snowfall, rainfall, baseflow, and quick flow (Table 1). With the rising temperature, the tendency toward increases in the rainfall, rainfall-to-precipitation ratio, baseflow, and baseflow index was confirmed by the positive values of RS. Negative values of RS manifested that rising temperature where the snowfall, snowfall-to-precipitation ratio, quick flow and quick flow index had a tendency to decrease. Strong statistically significant results were revealed for the snowfall-to-precipitation ratio, rainfall-to-precipitation ratio, and baseflow.

3.4. Shift in River Regime

A shift-type change in the snow-to-runoff ratio (S/QT) occurred in 1971 as detected by the change point analysis (Figure 8). The Kruskal–Wallis test confirmed the significance of the difference between the median values of S/QT in the two subperiods. The mean values decreased from 0.61 in the subperiod of 1951–1970 to 0.44 in the subperiod of 1971–2021. In the first snowy period (1951–1970), the highest values of S/QT reached 0.95, while the lowest reached 0.35. In 1971–2021, the highest S/QT did not exceed 0.82 and very often dropped below 0.35; the lowest value of 0.09 occurred in 2020. When considering the mean S/QT in the two subperiods and the threshold criterion of S/QT = 0.5 applied in [1], it was concluded that the river regime shifted from the snow-dominated to the snow-affected type with a mixed recharge by both the snow and rainfall precipitation phases.
It is worth noting that the term “snow-dominated” refers to the S/QT ratio. As shown in Figure 2d, the snowfall (S11-04) rarely exceeded rainfall (R11-04). In the subperiod of 1951–1970, the S11-04/P11-04 ratio exceeded 50% in 1958 (63%), 1968 (53%), 1969 (56%), and 1970 (53%); the multi-year mean value was 43%. In the subperiod of 1971–2021, the mean of S11-04/P11-04 dropped to 33%. The S11-04/P11-04 had maximum values in 1979 (62%), 1996 (76%), 2005 (53%), and 2013 (66%) and exhibited strong interannual variations. On average, rainfall (R11-04) exceeds snowfall (S11-04) (Figure 2f), and the S11-04/P11-04 ratio gradually decreased (Figure 2d).

4. Discussion

This study demonstrated that the air temperature remarkably increased in the last seven decades at both seasonal and monthly time scales over the cold season of 1951–2021. The results of the analyses supported the study’s hypotheses. Warming winters have gradually reduced the snowfall amount and snowfall fraction of total precipitation. However, this did not exclude the occurrence of extremely snowy winters, an example of which was the snowfall in 2012/2013, which was the highest in the entire 70 years in this river basin (Figure 2c). However, the 2019/2020 season was marked by extremely low snowfall and the lowest share of snow in the precipitation, which was caused by the exceptionally high temperatures that occurred throughout the cold season. This was the mildest winter on record across Europe, particularly in the north and east [47]. Overall, in the Liwiec River basin, the cold-season temperature rose by ~2.70 °C over 71 years, and the snowfall-to-precipitation ratio (S/P ratio) decreased by ~16% over 71 years. The warming winter temperatures across Poland were previously confirmed; it was found that at the majority of weather stations in Poland, the snow-cover depth significantly decreased in recent decades [29,30]. It is worth mentioning that atmospheric thaws alternately occur with cool and frosty periods and are characteristic features of the climate of Poland. These are caused by the variable weather conditions in winter seasons [48]. In the analyzed river basin, in the years of 1960/1961–2009/2010, the mean number of days with atmospheric thaw in December–February was in the range of 10–12 days [48]. However, the extreme thaw-start and thaw-end dates could differ by more than three months due to the high interannual variability. Thus, with increasing temperatures, it might be expected that the frequency of atmospheric thaws would increase, thereby accelerating snowmelt and making the snow cover less persistent. An increased activity of the hydrological system is expected to manifest with the amplified infiltration process occurring on large flat surfaces, which recharges the groundwater from which an increased baseflow is generated.
The follow-up hypothesis was also confirmed; it was found that the relationship between the monthly trends in air temperature and baseflow was strong and statistically significant. Hence, the increasing cold-season temperature trend contributed to the changes in streamflow marked by an increase in baseflow and baseflow index (BFI). The baseflow component of streamflow increased to a depth of ~17 mm over 71 years, and the baseflow index rose by ~18% in 71 years. The BFI increased from 0.51 in the subperiod of 1951–1970 to 0.66 in the subperiod of 1971–2021. The opposite results were found regarding the quick flow metrics (QFI); the time series of the quick flow and quick flow index showed decreasing trends. This may have been due to more frequent snow- and soil-thawing periods and the lack of a sudden amount of melting snow quickly entering the river in the form of overland flow. The results of this study seemed to be consistent with findings in [49], in which it was proved that runoff along the Vistula River in the winter season has become more uniform and shows decreasing maxima and increasing minima of daily flows and a stable mean runoff volume. The study in [4] also made significant contributions to the knowledge of global trends by showing that changes in both the baseflow and BFI were significantly region-dependent. The rivers in the eastern part of Poland were not examined, but the western part (covering the Oder River basin) showed a decreasing baseflow and BFI for the winter season (December–January–February) when evaluated for the period of 1970–2016. Such contrasting results were, as proved in [4], region-dependent; the eastern part of Poland where the Liwiec River basin is situated has a much cooler and humid climate than the western part.

5. Conclusions

The main conclusions of this work can be summarized as follows:
(1)
The lowland, mesoscale river basin in the humid middle-latitude climate rapidly warmed by ~0.38 °C/decade (p < 0.05) in the cold season of the water years (November–April) of 1951–2021, and the strongest warming was observed in recent decades. The highest level of warming occurred in February and March, reaching 0.49 and 0.53°C/decade, respectively.
(2)
The warming climate has directly affected the hydrological system, thereby leading to decreases in the snowfall and snowfall fraction (p < 0.05), increases in the rainfall and rainfall fraction (p < 0.05), increases in the river baseflow and baseflow index (p < 0.05), and a slight decrease in the total runoff (p > 0.05).
(3)
A warmer cold season of the water year and related changes in snowfall/rainfall patterns threaten the river regime by shifting it from the snow-dominated to snow-affected type as defined by the snowfall-to-runoff ratio. A change in river regime occurred in the 1970s, thereby transforming the river system into a less snowy and more rain-dependent system.
Overall, this study provided evidence of the link between trends in temperature and other hydroclimatic characteristics. However, the obtained results only applied to the analyzed river basin and require further verification for a broader range of geographic and climatic conditions in the middle-latitude region. Thus, future studies should consider other river basins. In Poland, the existing historical climate and hydrometric data enable further analysis of this area. Comparative studies that examine other river basins could explain the regional similarities or differences related to snow-hydrology and river-regime transitions. Such research could provide an answer regarding which river basins are still characterized by a snow regime and which have already undergone this transformation.
The changes in the hydrological regime analyzed in this paper only concerned the amount of snowfall related to the total annual runoff as expressed by the snowfall/runoff ratio. When considering the river regime changes, shifts in the time of the maximum winter/spring flows and their impact on the occurrence of low summer flows are also important. Such an analysis would be particularly valuable from the perspective of seasonal water resource availability.
The obtained results suggested that diminishing snowfall is expected to alter the groundwater recharge and streamflow dynamics if warming trends continue. Thus, the analysis presented here could be followed by a consideration of climate change scenarios and their impacts on snowfall and streamflow seasonality. Although this analysis was limited to showing similarities in the studied hydroclimatic variable trends, it seemed to provide valuable insights into the drivers and causes of changes in the river regime in the middle-latitude lowland region.

Funding

This research was funded by the Faculty of Geography and Regional Studies, University of Warsaw, Poland, under grant nos. SWIB66/2022 and SWIB85/2022.

Data Availability Statement

All of the data used during this study are available at the locations cited in the Acknowledgements section.

Acknowledgments

The author thanks the editors and reviewers for their insightful comments and suggestions. The author acknowledges the E-OBS dataset (version 23.1e) from the EU-FP6 project ENSEMBLES (http://ensembles-eu.metoffice.com) and the data providers in the ECA&D project (http://www.ecad.eu); version 25.0e of the dataset was downloaded from the Copernicus Climate Change Service (https://surfobs.climate.copernicus.eu/dataaccess/access_eobs.php) (accessed on 19 June 2022). The author also acknowledges the gridded Northern Hemisphere 50% rain–snow Ts threshold product (a formatted version of the observational dataset) that was downloaded from the DRYAD: spatial variations in the rain–snow temperature threshold across the Northern Hemisphere (https://doi.org/10.5061/dryad.c9h35) (accessed on 31 January 2022). The author also acknowledges the streamflow dataset that was prepared and verified by the Institute of Meteorology and Water Management—National Research Institute in Warsaw, Poland (IMGW-PIB) and downloaded from https://danepubliczne.imgw.pl/data (accessed on 30 August 2022).

Conflicts of Interest

The author declares no conflict of interest. The funder had no role in the design of the study; in the collection, analyses, or interpretation of data; in the writing of the manuscript; or in the decision to publish the results.

References

  1. Barnett, T.P.; Adam, J.C.; Lettenmaier, D.P. Potential impacts of a warming climate on water availability in snow-dominated regions. Nature 2005, 438, 303–309. [Google Scholar] [CrossRef] [PubMed]
  2. Nijssen, B.; O’Donnell, G.M.; Hamlet, A.F.; Lettenmaier, D.P. Hydrologic Sensitivity of Global Rivers to Climate Change. Clim. Chang. 2001, 50, 143–175. [Google Scholar] [CrossRef]
  3. Wieder, W.R.; Kennedy, D.; Lehner, F.; Musselman, K.N.; Rodgers, K.B.; Rosenbloom, N.; Simpson, I.R.; Yamaguchi, R. Pervasive alterations to snow-dominated ecosystem functions under climate change. Proc. Natl. Acad. Sci. USA 2022, 119, e2202393119. [Google Scholar] [CrossRef]
  4. Tan, X.; Liu, B.; Tan, X. Global Changes in Baseflow Under the Impacts of Changing Climate and Vegetation. Water Resour. Res. 2020, 56, e2020WR027349. [Google Scholar] [CrossRef]
  5. Lilhare, R.; Déry, S.J.; Stadnyk, T.A.; Pokorny, S.; Koenig, K.A. Warming soil temperature and increasing baseflow in response to recent and potential future climate change across northern Manitoba, Canada. Hydrol. Process. 2022, 36, e14748. [Google Scholar] [CrossRef]
  6. Dierauer, J.R.; Allen, D.M.; Whitfield, P.H. Snow Drought Risk and Susceptibility in the Western United States and Southwestern Canada. Water Resour. Res. 2019, 55, 3076–3091. [Google Scholar] [CrossRef]
  7. Moraga, J.S.; Peleg, N.; Fatichi, S.; Molnar, P.; Burlando, P. Revealing the impacts of climate change on mountainous catchments through high-resolution modelling. J. Hydrol. 2021, 603, 126806. [Google Scholar] [CrossRef]
  8. Kang, D.H.; Gao, H.; Shi, X.; Islam, S.U.; Déry, S.J. Impacts of a Rapidly Declining Mountain Snowpack on Streamflow Timing in Canada’s Fraser River Basin. Sci. Rep. 2016, 6, 19299. [Google Scholar] [CrossRef] [Green Version]
  9. Dierauer, J.R.; Allen, D.M.; Whitfield, P.H. Climate change impacts on snow and streamflow drought regimes in four ecoregions of British Columbia. Can. Water Resour. J. Rev. Can. Ressour. Hydr. 2021, 46, 168–193. [Google Scholar] [CrossRef]
  10. Musselman, K.N.; Addor, N.; Vano, J.A.; Molotch, N.P. Winter melt trends portend widespread declines in snow water resources. Nat. Clim. Chang. 2021, 11, 418–424. [Google Scholar] [CrossRef]
  11. Aygün, O.; Kinnard, C.; Campeau, S. Impacts of climate change on the hydrology of northern midlatitude cold regions. Prog. Phys. Geogr. Earth Environ. 2019, 44, 338–375. [Google Scholar] [CrossRef]
  12. Dong, W.; Ming, Y. Seasonality and Variability of Snowfall to Total Precipitation Ratio over High Mountain Asia Simulated by the GFDL High-Resolution AM4. J. Clim. 2022, 35, 5573–5589. [Google Scholar] [CrossRef]
  13. Yao, J.; Chen, Y.; Guan, X.; Zhao, Y.; Chen, J.; Mao, W. Recent climate and hydrological changes in a mountain–basin system in Xinjiang, China. Earth-Sci. Rev. 2022, 226, 103957. [Google Scholar] [CrossRef]
  14. Sippel, S.; Fischer, E.M.; Scherrer, S.C.; Meinshausen, N.; Knutti, R. Late 1980s abrupt cold season temperature change in Europe consistent with circulation variability and long-term warming. Environ. Res. Lett. 2020, 15, 94056. [Google Scholar] [CrossRef]
  15. Mudryk, L.R.; Kushner, P.J.; Derksen, C.; Thackeray, C. Snow cover response to temperature in observational and climate model ensembles. Geophys. Res. Lett. 2017, 44, 919–926. [Google Scholar] [CrossRef]
  16. Mudryk, L.; Santolaria-Ot\’\in, M.; Krinner, G.; Ménégoz, M.; Derksen, C.; Brutel-Vuilmet, C.; Brady, M.; Essery, R. Historical Northern Hemisphere snow cover trends and projected changes in the CMIP6 multi-model ensemble. Cryosphere 2020, 14, 2495–2514. [Google Scholar] [CrossRef]
  17. Hattermann, F.F.; Vetter, T.; Breuer, L.; Su, B.; Daggupati, P.; Donnelly, C.; Fekete, B.; Flörke, F.; Gosling, S.N.; Hoffmann, P.; et al. Sources of uncertainty in hydrological climate impact assessment: A cross-scale study. Environ. Res. Lett. 2018, 13, 15006. [Google Scholar] [CrossRef]
  18. Quante, L.; Willner, S.N.; Middelanis, R.; Levermann, A. Regions of intensification of extreme snowfall under future warming. Sci. Rep. 2021, 11, 16621. [Google Scholar] [CrossRef]
  19. Danco, J.F.; DeAngelis, A.M.; Raney, B.K.; Broccoli, A.J. Effects of a Warming Climate on Daily Snowfall Events in the Northern Hemisphere. J. Clim. 2016, 29, 6295–6318. [Google Scholar] [CrossRef]
  20. Fontrodona Bach, A.; van der Schrier, G.; Melsen, L.A.; Klein Tank, A.M.G.; Teuling, A.J. Widespread and Accelerated Decrease of Observed Mean and Extreme Snow Depth Over Europe. Geophys. Res. Lett. 2018, 45, 12312–12319. [Google Scholar] [CrossRef]
  21. Walsh, J.E.; Ballinger, T.J.; Euskirchen, E.S.; Hanna, E.; Mård, J.; Overland, J.E.; Tangen, H.; Vihma, T. Extreme weather and climate events in northern areas: A review. Earth-Sci. Rev. 2020, 209, 103324. [Google Scholar] [CrossRef]
  22. Lin, W.; Chen, H. Changes in the spatial–temporal characteristics of daily snowfall events over the Eurasian continent from 1980 to 2019. Int. J. Climatol. 2022, 42, 1841–1853. [Google Scholar] [CrossRef]
  23. Clifton, C.F.; Day, K.T.; Luce, C.H.; Grant, G.E.; Safeeq, M.; Halofsky, J.E.; Staab, B.P. Effects of climate change on hydrology and water resources in the Blue Mountains, Oregon, USA. Clim. Serv. 2018, 10, 9–19. [Google Scholar] [CrossRef]
  24. Santolaria-Otín, M.; Zolina, O. Evaluation of snow cover and snow water equivalent in the continental Arctic in CMIP5 models. Clim. Dyn. 2020, 55, 2993–3016. [Google Scholar] [CrossRef]
  25. Kraaijenbrink, P.D.A.; Stigter, E.E.; Yao, T.; Immerzeel, W.W. Climate change decisive for Asia’s snow meltwater supply. Nat. Clim. Chang. 2021, 11, 591–597. [Google Scholar] [CrossRef]
  26. Notarnicola, C. Overall negative trends for snow cover extent and duration in global mountain regions over 1982–2020. Sci. Rep. 2022, 12, 13731. [Google Scholar] [CrossRef]
  27. Ford, C.M.; Kendall, A.D.; Hyndman, D.W. Effects of shifting snowmelt regimes on the hydrology of non-alpine temperate landscapes. J. Hydrol. 2020, 590, 125517. [Google Scholar] [CrossRef]
  28. Ford, C.M.; Kendall, A.D.; Hyndman, D.W. Snowpacks decrease and streamflows shift across the eastern US as winters warm. Sci. Total Environ. 2021, 793, 148483. [Google Scholar] [CrossRef]
  29. Tomczyk, A.M.; Bednorz, E.; Szyga-Pluta, K. Changes in air temperature and snow cover in winter in poland. Atmosphere 2021, 12, 68. [Google Scholar] [CrossRef]
  30. Szwed, M.; Pińskwar, I.; Kundzewicz, Z.W.; Graczyk, D.; Mezghani, A. Changes of snow cover in Poland. Acta Geophys. 2017, 65, 65–76. [Google Scholar] [CrossRef]
  31. Solon, J.; Borzyszkowski, J.; Bidłasik, M.; Richling, A.; Badora, K.; Balon, J.; Brzezińska-Wójcik, T.; Chabudziński, Ł.; Dobrowolski, R.; Grzegorczyk, I.; et al. Physico-geographical mesoregions of Poland: Verification and adjustment of boundaries on the basis of contemporary spatial data. Geogr. Pol. 2018, 91, 143–170. [Google Scholar] [CrossRef]
  32. Beck, H.E.; Zimmermann, N.E.; McVicar, T.R.; Vergopolan, N.; Berg, A.; Wood, E.F. Present and future köppen-geiger climate classification maps at 1-km resolution. Sci. Data 2018, 5, 180214. [Google Scholar] [CrossRef] [PubMed] [Green Version]
  33. Cornes, R.C.; van der Schrier, G.; van den Besselaar, E.J.M.; Jones, P.D. An Ensemble Version of the E-OBS Temperature and Precipitation Data Sets. J. Geophys. Res. Atmos. 2018, 123, 9391–9409. [Google Scholar] [CrossRef] [Green Version]
  34. IMGW-PIB Water Yearbook 2021 (Rocznik hydrologiczny 2021). Available online: https://danepubliczne.imgw.pl/data/dane_pomiarowo_obserwacyjne/Roczniki/Rocznikhydrologiczny/RocznikHydrologiczny2021.pdf (accessed on 28 October 2022).
  35. IMGW-PIB Bulletin of the National Hydrological and Meteorological Service (Biuletyn Państwowej Służby Hydrologiczno-Meteorologicznej). Available online: https://danepubliczne.imgw.pl/data/dane_pomiarowo_obserwacyjne/Biuletyn_PSHM/Biuletyn_PSHM_2021_ROCZNY.pdf (accessed on 28 October 2022).
  36. Jennings, K.S.; Winchell, T.S.; Livneh, B.; Molotch, N.P. Spatial variation of the rain-snow temperature threshold across the Northern Hemisphere. Nat. Commun. 2018, 9, 1148. [Google Scholar] [CrossRef] [Green Version]
  37. Arciniega-Esparza, S.; Breña-Naranjo, J.A.; Pedrozo-Acuña, A.; Appendini, C.M. HYDRORECESSION: A Matlab toolbox for streamflow recession analysis. Comput. Geosci. 2017, 98, 87–92. [Google Scholar] [CrossRef]
  38. Aksoy, H.; Wittenberg, H. Nonlinear baseflow recession analysis in watersheds with intermittent streamflow. Hydrol. Sci. J. 2011, 56, 226–237. [Google Scholar] [CrossRef]
  39. Mann, H.B. Nonparametric Tests Against Trend. Econometrica 1945, 13, 245–259. [Google Scholar] [CrossRef]
  40. Kendall, M.G. A New Measure of Rank Correlation. Biometrika 1938, 30, 81–93. [Google Scholar] [CrossRef]
  41. Sen, P.K. Estimates of the Regression Coefficient Based on Kendall’s Tau. J. Am. Stat. Assoc. 1968, 63, 1379–1389. [Google Scholar] [CrossRef]
  42. Radziejewski, M.; Kundzewicz, Z.W. Detectability of changes in hydrological records. Hydrol. Sci. J. 2004, 49, 39–51. [Google Scholar] [CrossRef]
  43. Greene, C.A.; Thirumalai, K.; Kearney, K.A.; Delgado, J.M.; Schwanghart, W.; Wolfenbarger, N.S.; Thyng, K.M.; Gwyther, D.E.; Gardner, A.S.; Blankenship, D.D. The Climate Data Toolbox for MATLAB. Geochem. Geophys. Geosystems 2019, 20, 3774–3781. [Google Scholar] [CrossRef] [Green Version]
  44. Kruskal, W.H.; Wallis, W.A. Use of Ranks in One-Criterion Variance Analysis. J. Am. Stat. Assoc. 1952, 47, 583–621. [Google Scholar] [CrossRef]
  45. Kundzewicz, Z.W.; Robson, A.J. Change detection in hydrological records—A review of the methodology. Hydrol. Sci. J. 2004, 49, 7–19. [Google Scholar] [CrossRef]
  46. Kunkel, K.E.; Robinson, D.A.; Champion, S.; Yin, X.; Estilow, T.; Frankson, R.M. Trends and Extremes in Northern Hemisphere Snow Characteristics. Curr. Clim. Chang. Rep. 2016, 2, 65–73. [Google Scholar] [CrossRef] [Green Version]
  47. The Copernicus Climate Change Service (C3S). Available online: https://climate.copernicus.eu/boreal-winter-season-1920-was-far-warmest-winter-season-ever-recorded-europe-0 (accessed on 20 October 2022).
  48. Czarnecka, M.; Nidzgorska-Lencewicz, J. The occurrence of atmospheric thaw in Poland over the last 50 years. Geogr. Pol. 2013, 86, 327–340. [Google Scholar] [CrossRef] [Green Version]
  49. Bogdanowicz, E.; Karamuz, E.; Romanowicz, R.J. Temporal changes in flow regime along the river vistula. Water 2021, 13, 2840. [Google Scholar] [CrossRef]
Figure 1. (a) Geographic location of the study area. (b) Elevation map of the Liwiec River basin according to EU-DEM v1.1 (acquired from https://land.copernicus.eu; accessed on 13 October 2022), and distribution of the E-OBS gridded temperature and precipitation points (acquired from https://www.ecad.eu; accessed on 19 June 2022).
Resources 12 00018 g001
Figure 2. Changes in cold-season (a) precipitation (P11-04), (b) air temperature (T11-04), (c) snowfall (S11-04), (d) snowfall-to-precipitation ratio (RSP11-04 = S11-04/P11-04), (e) rainfall (R11-04), (f) rainfall-to-precipitation ratio (RRP11-04 = R11-04/P11-04), (g) streamflow (QT11-04), (h) baseflow (QB11-04), (i) quick flow (QQ11-04), and (j) baseflow index (BFI11-04). The MK test statistic is denoted as Z. The presence of a trend was determined at a significance level of alpha = 0.05; in cases with a p-value > 0.05, the changes were not statistically significant. Sen’s slope is expressed in the variable unit per year.
Resources 12 00018 g002
Figure 3. Changes in monthly air temperature in (a) November (T11), (b) December (T12), (c) January (T01), (d) February (T02), (e) March (T03), and (f) April (T04). The MK test statistic is denoted as Z. The straight red line in each figure represents the linear trend (Sen’s slope) of the monthly average temperature (expressed in °C/y).
Resources 12 00018 g003
Figure 4. Changes in monthly snowfall in (a) November (S11), (c) December (S12), (e) January (S01), (g) February (S02), (i) March (S03), and (k) April (S04); and changes in the monthly snowfall-to-precipitation ratio in (b) November (S11/P11), (d) December (S12/P12), (f) January (S01/P01), (h) February (S02/P02), (j) March (S03/P03), and (l) April (S04/P04)). The MK test statistic is denoted as Z. The straight red line in each figure represents the linear trend (Sen’s slope) of monthly snowfall (expressed in mm/y) or the monthly snowfall-to-precipitation ratio (expressed in %/y).
Resources 12 00018 g004
Figure 5. Changes in monthly rainfall in (a) November (R11), (c) December (R12), (e) January (R01), (g) February (R02), (i) March (R03), and (k) April (R04), and changes in monthly rainfall-to-precipitation ratio in (b) November (R11/P11), (d) December (R12/P12), (f) January (R01/P01), (h) February (R02/P02), (j) March (R03/P03), and (l) April (R04/P04). The MK test statistic is denoted as Z. The straight red line in each figure represents the linear trend (Sen’s slope) of monthly rainfall (expressed in mm/y) or monthly rainfall-to-precipitation ratio (expressed in %/y).
Resources 12 00018 g005
Figure 6. Changes in monthly baseflow in (a) November (QB11), (c) December (QB12), (e) January (QB01), (g) February (QB02), (i) March (QB03), and (k) April (QB04), and changes in monthly baseflow index in (b) November (BFI11), (d) December (BFI12), (f) January (BFI01), (h) February (BFI02), (j) March (BFI03), and (l) April (BFI04). The MK test statistic is denoted as Z. The straight red line in each figure represents the linear trend (Sen’s slope) of the monthly baseflow (expressed in m3s−1/y) or monthly baseflow index (expressed in %/y).
Resources 12 00018 g006
Figure 7. Changes in monthly quick flow in (a) November (QQ11), (c) December (QQ12), (e) January (QQ01), (g) February (QQ02), (i) March (QQ03), and (k) April (QQ04); and changes in quick flow index in (b) November (QFI11), (d) December (QFI12), (f) January (QFI01), (h) February (QFI02), (j) March (QFI03), and (l) April (QFI04). The MK test statistic is denoted as Z. The straight red line in each figure represents the linear trend (Sen’s slope) of the monthly quick flow (expressed in m3s−1/y) or the monthly quick flow index (expressed in %/y).
Resources 12 00018 g007
Figure 8. Snow-to-runoff ratio (S/QT) in two subperiods (1951–1970 and 1971–2021) separated by a change point in 1971.
Resources 12 00018 g008
Table 1. Spearman rank-order correlations (Rs) between multi-year trends (Sen’s slopes) in the monthly temperature (T) and hydroclimatic variables of snow (S), snow-to-precipitation ratio (S/P), rainfall (R), rainfall-to-precipitation ratio (R/P), baseflow (QB), baseflow index (BFI), quick flow (QQ), and quick flow index (QFI).
VariableSS/PRR/PQBBFIQQQFI
T−0.2571−0.8407 10.71420.8857 10.9429 10.5429−0.0857−0.5429
1 Correlation was statistically significant at a significance level of alpha = 0.05.
Disclaimer/Publisher’s Note: The statements, opinions and data contained in all publications are solely those of the individual author(s) and contributor(s) and not of MDPI and/or the editor(s). MDPI and/or the editor(s) disclaim responsibility for any injury to people or property resulting from any ideas, methods, instructions or products referred to in the content.

