Article

Development of a SEM-EDS-XRD Protocol for the Physicochemical and Automated Mineralogical Characterisation of Coal Dust Particles

by
Conchita Kamanzi
1,2,*,
Megan Becker
1,2,
Johanna Von Holdt
3 and
Jennifer Broadhurst
1
1
Minerals to Metals Initiative, Department of Chemical Engineering, University of Cape Town, Cape Town 7700, South Africa
2
Centre for Minerals Research, Department of Chemical Engineering, University of Cape Town, Cape Town 7700, South Africa
3
Department of Environmental and Geographical Science, University of Cape Town, Cape Town 7700, South Africa
*
Author to whom correspondence should be addressed.
Resources 2022, 11(12), 114; https://doi.org/10.3390/resources11120114
Submission received: 4 November 2022 / Revised: 27 November 2022 / Accepted: 30 November 2022 / Published: 5 December 2022

Abstract

:
Exposure to coal dust from mining-related activities has historically been linked to several preventable but incurable respiratory diseases. Although the findings of numerous biological studies have determined that the physicochemical and mineralogical aspects of dust particles greatly influence both cytotoxic and proinflammatory pathways, robust datasets which quantitatively define these characteristics of coal dust remain limited. This study aims to develop a robust characterisation routine applicable for real-world coal dust, using an auto-SEM-EDS system. In doing so, the study addresses both the validation of the particle mineralogical scans and the quantification of a range of coal particle characteristics relevant to respiratory harm. The findings presented demonstrate the application of auto-SEM-EDS-XRD systems to analyse and report on the physicochemical and mineralogical characteristics of thousands of dust-sized particles. Furthermore, by mineralogically mapping the particles, parameters such as liberation, mineral association and elemental distribution can be computed to understand the relationships between elements and minerals in the particles, which have yet to be quantified by other studies.

1. Introduction

The exposure to coal dust has been well recognised as a critical health issue for both mine workers and communities proximal to collieries. Through epidemiological research, links have been established between coal dust exposure and various preventable but incurable diseases. These include coal workers’ pneumoconiosis, chronic obstructive pulmonary disease, and emphysema [1,2,3,4,5].
Previous studies have shown that particle-cell reactions and their products play a vital role in the pathway of disease development [6,7,8,9,10]. In particular, the biologically reactive mineralogy present in coal particle composites has been established as a trigger for inflammatory reactions [11,12,13,14]. Thus, it is generally understood that a detailed physicochemical and mineralogical characterisation of the dust is needed to effectively understand the inter-relationships between the inherent properties of the particles and their impact on lung physiology. However, datasets quantitatively describing coal dust characteristics remain limited in the range of characteristics considered. This has contributed to the lack of consensus regarding the toxic agents leading to coal dust related diseases [15,16,17,18,19].
The ability to assess the individual particle characteristics of coal dust has been explored by studies using SEM-EDS (scanning electron microscopy coupled with energy dispersive X-ray spectroscopy) analysis to manually assess the particle size, shape, and composition of particle populations [20,21,22,23]. However, obtaining high particle counts for statistical analysis using such methods can be time consuming. Other studies have used a semi-automated Computer Controlled-SEM-EDS routine [24,25,26] for the selection of particles and extraction of raw data on physicochemical particle characteristics. This routine reports on the physical characteristics of the particles, but the mineralogy only considers phase abundances without describing their texture. There are also studies which use automated mineralogical analysis systems that identify and classify particles scanned across a predefined area using commercial software packages [27,28,29,30,31,32,33]. The software developed for auto-SEM-EDS systems provides additional functionality to mineralogically map particles and quantitatively assess textural aspects of particles [32,34,35]. The FEI QEMSCAN (Quantitative Evaluation of Minerals by Scanning Electron Microscopy) has been used to mineralogically map particles [31,35,36,37,38]. However, the application has mainly been in the context of natural dust, mineral processing, and the geo- and material sciences. Recent studies have utilised the FEI Mineral Liberation Analyser to assess physical and mineralogical characteristics of coal dust [29,30]. However, to date the application of such systems has focused on extracting particle size and composition-related information.
These studies highlight the potential for automated mineralogical systems to serve as a robust tool for providing quantitative reporting of mineral specific characteristics of coal dust. As particle reactivity has been linked to pulmonary responses, this should provide additional dimensions for assessing the bio-reactivity of problematic minerals. Currently, no study has presented a description of a rigorous and generalisable characterisation routine using an auto-SEM-EDS system to analyse coal dust or dust-sized particles. This is despite its potential to provide both rapid analyses of thousands of particles and detailed particle characterisation datasets. In this study, an auto-SEM-EDS workflow was conceptualised for coal dust particles utilising an FEI QEMSCAN instrument. In this context, this study aims to develop and demonstrate: (1) quantitative definitions for a range of coal particle characteristics relevant to respiratory harm for application to real-world coal dust; (2) an auto-SEM-EDS protocol to analyse dust-sized coal particles as a case study; and (3) a demonstration of the application and rigorous validation of the characterisation data reported.

2. Protocol Description and Setup

2.1. Approach

As all auto-SEM-EDS systems operate through a combination of a hardware and software platforms, to perform image analysis and data processing the development of a workflow for a given material should consider: (1) what information is to be extracted from the measurement? (2) which settings/choices need to be defined to reliably obtain this information? and (3) how confidence in the reported data can be increased? In this context, a generalised workflow is presented to highlight the key steps taken to perform a successful particle analysis measurement across auto-SEM-EDS systems (see Figure 1).
Based on this workflow, the two primary considerations to inform aspects of the measurement setup are the bulk material and objective particle properties. This is particularly relevant for the sample mounting, measurements settings and mineral identification. To perform mineral identification of the sample, auto-SEM-EDS systems employ a user-defined reference list of mineral compositions. This needs to be developed based on the material, and further requires the use of complementary analyses to provide a positive identification for the major phases present.
In addition to the primary analysis of the sample, the complementary analyses provide an objective set of information with which to optimise the mineral identification list and assess the performance of the measurement.
Ultimately the study provides a demonstration of the discussed workflow utilising the FEI QEMSCAN as the auto-SEM-EDS system. However, such a workflow can also be applied to similar tools such as the FEI Mineral Liberation Analyser, TESCAN TIMA-X mineral analyser or the ZEISS Mineralogic, thus highlighting its broader applicability across different instruments.

2.2. Outline of Particle Characteristics Investigated

To address the objective output of the workflow, a description of the key particle characteristics relevant to particle toxicity and inflammation in the lung was first outlined (see Table 1). Based on this, sets of rules were then defined to extract mineral grades, element distributions and both general and mineral specific data from the particle scans. To provide a quantitative definition for each characteristic, the equations are further described for the various characteristics as listed in Table 1.

2.2.1. Mineral and Element Distributions

To quantify the mineral compositions and element distributions of scanned particles, the QEMSCAN and similar software-based auto-SEM-EDS initially isolate particles from the background by utilising differences in the BSE (backscattered electron) brightness. Following this, each particle is overlayed on a predetermined grid defining the pixel size and the point spacing where X-ray analysis is conducted. Utilising the collected spectra, each pixel is assigned a mineral/phase identity based on predetermined criteria, for the QEMSCAN this is defined as a Species Identification Profile (SIP) list.
To determine both the abundance of the minerals/phases present and elemental distribution, the user must provide specific detail on the basic characteristics of each mineral/phase such as the density and chemical composition (see Supplementary Section S1).
These characteristics are computed in a “primary list” which consolidates multiple SIP entries into mineral or chemical groupings to which the composition and specific gravity of each mineral/phase can be assigned. Once assigned, both the mineral mass and the elemental distributions can be calculated by the software. As the primary list tends to be extensive, a user-defined “secondary list” is created to further consolidate the minerals into the most abundant phases and high-level groups constituting the bulk mineralogy.
In the case of the elemental distribution, each element listed is computed by back-calculating the element chemistry from the mineral formula defined in the primary list, relative to their respective abundances (see Supplementary Section S1 for detail on the mineral compositions used). Based on this, the weight percentage of each element is computed as the sum of the percentage element of interest in each of its host minerals, multiplied by the respective mass abundance of each host mineral.

2.2.2. Particle Size

The reporting of particle size is highly dependent on the technique employed, however, for two-dimensional image analysis of particles the Equivalent Circular Diameter (ECD)—represented in Equation (1)—is the most widely used parameter [46]. To account for the resolution at which the scan is set, the area of a given particle is multiplied by the area of a single pixel. This was done to obtain a more accurate representation of the particle area, scaled by resolution.
Particle size = 2 × √((n pixels × Area of 1 pixel)/π)

2.2.3. Particle Shape

Currently, studies utilising Computer-Controlled SEM-EDS routines to define the shape of coal dust particles primarily assess this by quantifying the aspect ratio of the particle [24,25,47]. While this may give the user an idea of how needle-like or circular a particle is, a metallurgical-based study using the QEMSCAN proposed a categorisation of particle shape using the parameters roundness and aspect ratio [37] (further defined in Table 2). Their analysis showed that by a combination of these two parameters, the resulting data matrix could be used to define zones of particles with similar shape properties that describe more than just particle elongation (represented in Table 3). This study demonstrates the broader applicability of this alternative particle shape description on dust-sized particles.

2.2.4. Particle Roughness

In addition to the matrix defining shape (based on ranges of aspect ratio and roundness), a “diagonal division” of the matrix was suggested to distinguish roughness as a textural characteristic over a range of aspect ratios [48]. This division takes the form of a straight line, representing the shape matrix as a Cartesian plane, where roundness and aspect ratio are a function of one another.
For the gradient and constants, values were chosen based on a qualitative assessment of the particle divisions. This resulted in three roughness categories namely, Jagged, Intermediate and Smooth (Equations (2)–(4), respectively).
Jagged = Roundness > 0.75 × Aspect ratio + 0
Intermediate = Roundness ≤ 0.75 × Aspect ratio − 0.05
Smooth = Roundness > 0.75 × Aspect ratio + 0.05

2.2.5. Mineral Liberation and Association

The liberation of potentially harmful phases from geological materials and their associations with otherwise inert or soluble phases have been discussed as influential factors relating to the bioaccessibility of potentially toxic elements from mineral assemblages [44,45]. While no study has defined liberation in this biological context, the concept of mineral liberation is well-established in the field of process mineralogy.
In its classical definition, liberation is defined by the percentage volume occupied by a mineral of interest (MOI) in the total volume of a particle [49]. For auto-SEM-EDS systems, liberation is classed by bound ranges in the percentage area of a target phase [50]. By adapting this concept to understand the potential bioreactivity of minerals, based on their accessibility, this study developed a measure for the degree to which a target phase is either liberated or encapsulated (further defined in Table 4).

2.3. Instrumentation

For this study, the basic elements of the auto-SEM-EDS system used included: a QEMSCAN 650F field emission gun-scanning electron microscope (FEG-SEM); two Bruker ASX XFlash 6 series Energy Dispersive Spectrometers (EDS); and commercial image analysis and processing software packages.
As auto-SEM-EDS systems may be fitted with different SEMs, it should be noted that the use of a FEG-SEM over a tungsten filament-SEM greatly improves both the stability and reproducibility of the delivered electron beam over several hours [51]. As a result, FEG-SEMs can acquire high-resolution and better-quality BSE scans than their counterparts.
Furthermore, by coupling the SEM hardware with EDS detectors, the software developed for auto-SEM-EDS systems facilitates the communication between the SEM and EDS detector, allowing for the high-speed acquisition of X-ray spectra for element identification from silicon drift detectors [52] (such as the Bruker ASX XFlash 6 series detector).
In combining the two sets of scan information (BSE and X-ray) as a raster matrix, auto-SEM-EDS systems are able to develop mineral maps of the scan based on the classification of the measured spectra to a reference library of synthesised X-ray spectra of minerals and their expected BSE grey level ranges.

2.4. Measurement Setup

2.4.1. Sample Mounting Methodology

To prepare the material for auto-SEM-EDS analysis, the sample must be mounted in a material that provides adequate contrast from the sample when imaged on a BSE (Backscattered electron) greyscale. Unlike more conventional ore/rock preparation methods using epoxy resin, the BSE contrast between the epoxy and the carbonaceous matter is nearly identical [53]. Without a significant level of discrimination between the background and the carbonaceous matter, both the volume of carbonaceous matter and the definition of particle boundaries may be misidentified or inaccurate. As a result, carnauba wax has been favoured in the preparation of coal for SEM analysis, due to its low BSE contrast relative to carbonaceous matter [32,53] (see Figure 2 for an example image of blocks).
In addition to the specific use of wax over epoxy for the mounting coal samples, the incorporation of graphite particles as a ‘filler’ to separate touching particles cannot be used for coal as this would affect the estimation of carbonaceous matter. Thus, the sample preparation is aimed at producing a monolayer of the material.
For this study, 0.2 g of the coal particle samples were cast in 25 mm diameter carnauba wax moulds that were subsequently recast in epoxy resin to generate 30 mm diameter blocks (recasting in epoxy was used to provide stability to the sample block). The blocks were subsequently polished to reveal the surface of the block and smoothen the surface to a flat and level finish (see Supplementary Section S2 for a full description of the wax block preparation procedure).

2.4.2. SEM Measurement Conditions

In execution of the measurement, the QEMSCAN was set to run at a beam energy of 15 keV, accelerating current of 9 nA, working distance of 13 mm and 1000 times magnification across all the samples. Prior to analysis, the BSE detector was calibrated on the quartz, copper, and gold standards. Additionally, the brightness and contrast of the scan was calibrated against the gold standard and faraday cup. Both calibration steps were conducted to ensure confidence in the BSE measurement. A further X-ray calibration was conducted on the copper standard to ensure confidence in the X-ray spectra captured by the EDS detector.
Apart from the operational setup for the SEM, the software requires the user to define the scanning and field parameters. For this study, the field of view was divided into areas sized at 500 µm with a 200 µm overlap (see Figure 3a,b for visual context). With respect to the scan, a resolution of 0.98 × 0.98 µm pixels with a point spacing of 1 µm was chosen to aid in the identification of features in the particles, given that they ranged between 25 and ~2 µm (see Figure 3c for visual context of the point spacing).
To ensure that the scan could effectively select particles, both size exclusion criteria and a “separate touching particles” processor were included to refine the selection of particles during the measurement. Based on repeat measurement runs (data not shown) it was determined that defining a minimum limit for the exclusion criteria is important for dust-sized material. This was observed from measurements which ran with no lower limit and were subsequently shown to contain a high proportion of single pixel artefacts.
To improve on this, the size exclusion criteria were set in the particle range between 30 and 2.5 µm. Furthermore, as the QEMSCAN cannot confidently determine detailed information on particles with less than 5 pixels, due to its maximum theoretical pixel spacing and interaction volume of the electron beam, a post-processing filter removing all particles less than 5 pixels was used to remove particles which would otherwise produce pixel-based artefacts. Additionally, a separate post-processing rule was applied to remove the wax pixels from the scan and further disaggregate touching particles from the process.

2.4.3. Optimising Mineral Identification: Development of Pixel Classifiers

The cornerstone of developing mineral maps for auto-SEM-EDS relies on a combination of the BSE and X-ray information acquired. For the QEMSCAN this is a result of a two-stage process. The first stage involves spectral analysis and element identification from the X-ray data using what is known as the spectral analysis engine [45]. During the measurement, the EDS detector collects fast and reliable low-count energy spectra for each pixel, to be used in the classification of minerals. Using this as the raw spectrum, the spectral analysis engine fits a synthesised X-ray spectrum to the raw spectrum which allows the software to report the element concentrations of the synthesised spectrum.
In the second stage, a Species Identification Protocol (SIP) list is used to translate the element concentrations reported by the spectral analysis engine to minerals and compare the element ranges in mineral compositions to those defined for each pixel. As the EDS information captured reflects multiple iterations of low count spectra (<1000 photons) of a single high-count spectrum, statistical variation may occur in the reported element concentrations [54]. Additionally, element ranges may differ from ideal compositions due to natural chemical variation in the minerals. Thus, the SIP list displays the composition as element ranges to account for such variation. To develop a robust and reliable SIP, various optimisation stages were employed to refine the mineral definitions used in the final maps.
Primarily, the basis of the minerals reported in the SIP originated from the minerals commonly reported in coal [55]. Compositions for each mineral were extracted from the built-in reference library and were duplicated for each mineral to create a “simulated” and “measured” entry (where the measured entry was manually altered based on the element ranges observed in the sample). Initially, a drill core sample from a local mine was used to develop compositional entries for the carbonaceous matter (this was not present in the reference library) and to adjust the measured entries for quartz and clays, such as kaolinite and illite (as these comprised ~ 90% of the mineral matter in the drill core analysed).
Figure 4a highlights the classification performance of the generated SIP in distinguishing the carbonaceous matter versus mineral matter in the drill core standard. A coarse sample of wash product ultrafines (<180 µm in size) was subsequently set in the carnauba wax to generate compositional ranges to differentiate the wax background from the carbonaceous matter (Figure 4c further highlights the classification performance of the SIP and contrast between background and sample).
In combination with the mineral composition refinement, the BSE ranges were compared for the main phases (carbonaceous matter, quartz, and clays) and the background to define another degree of discrimination in cases where element ranges may be similar. This was particularly evident when analysing the dust-sized samples, as the balance between composition-based discriminators and the BSE difference between background and sample played a critical role in the mapping of the sample.
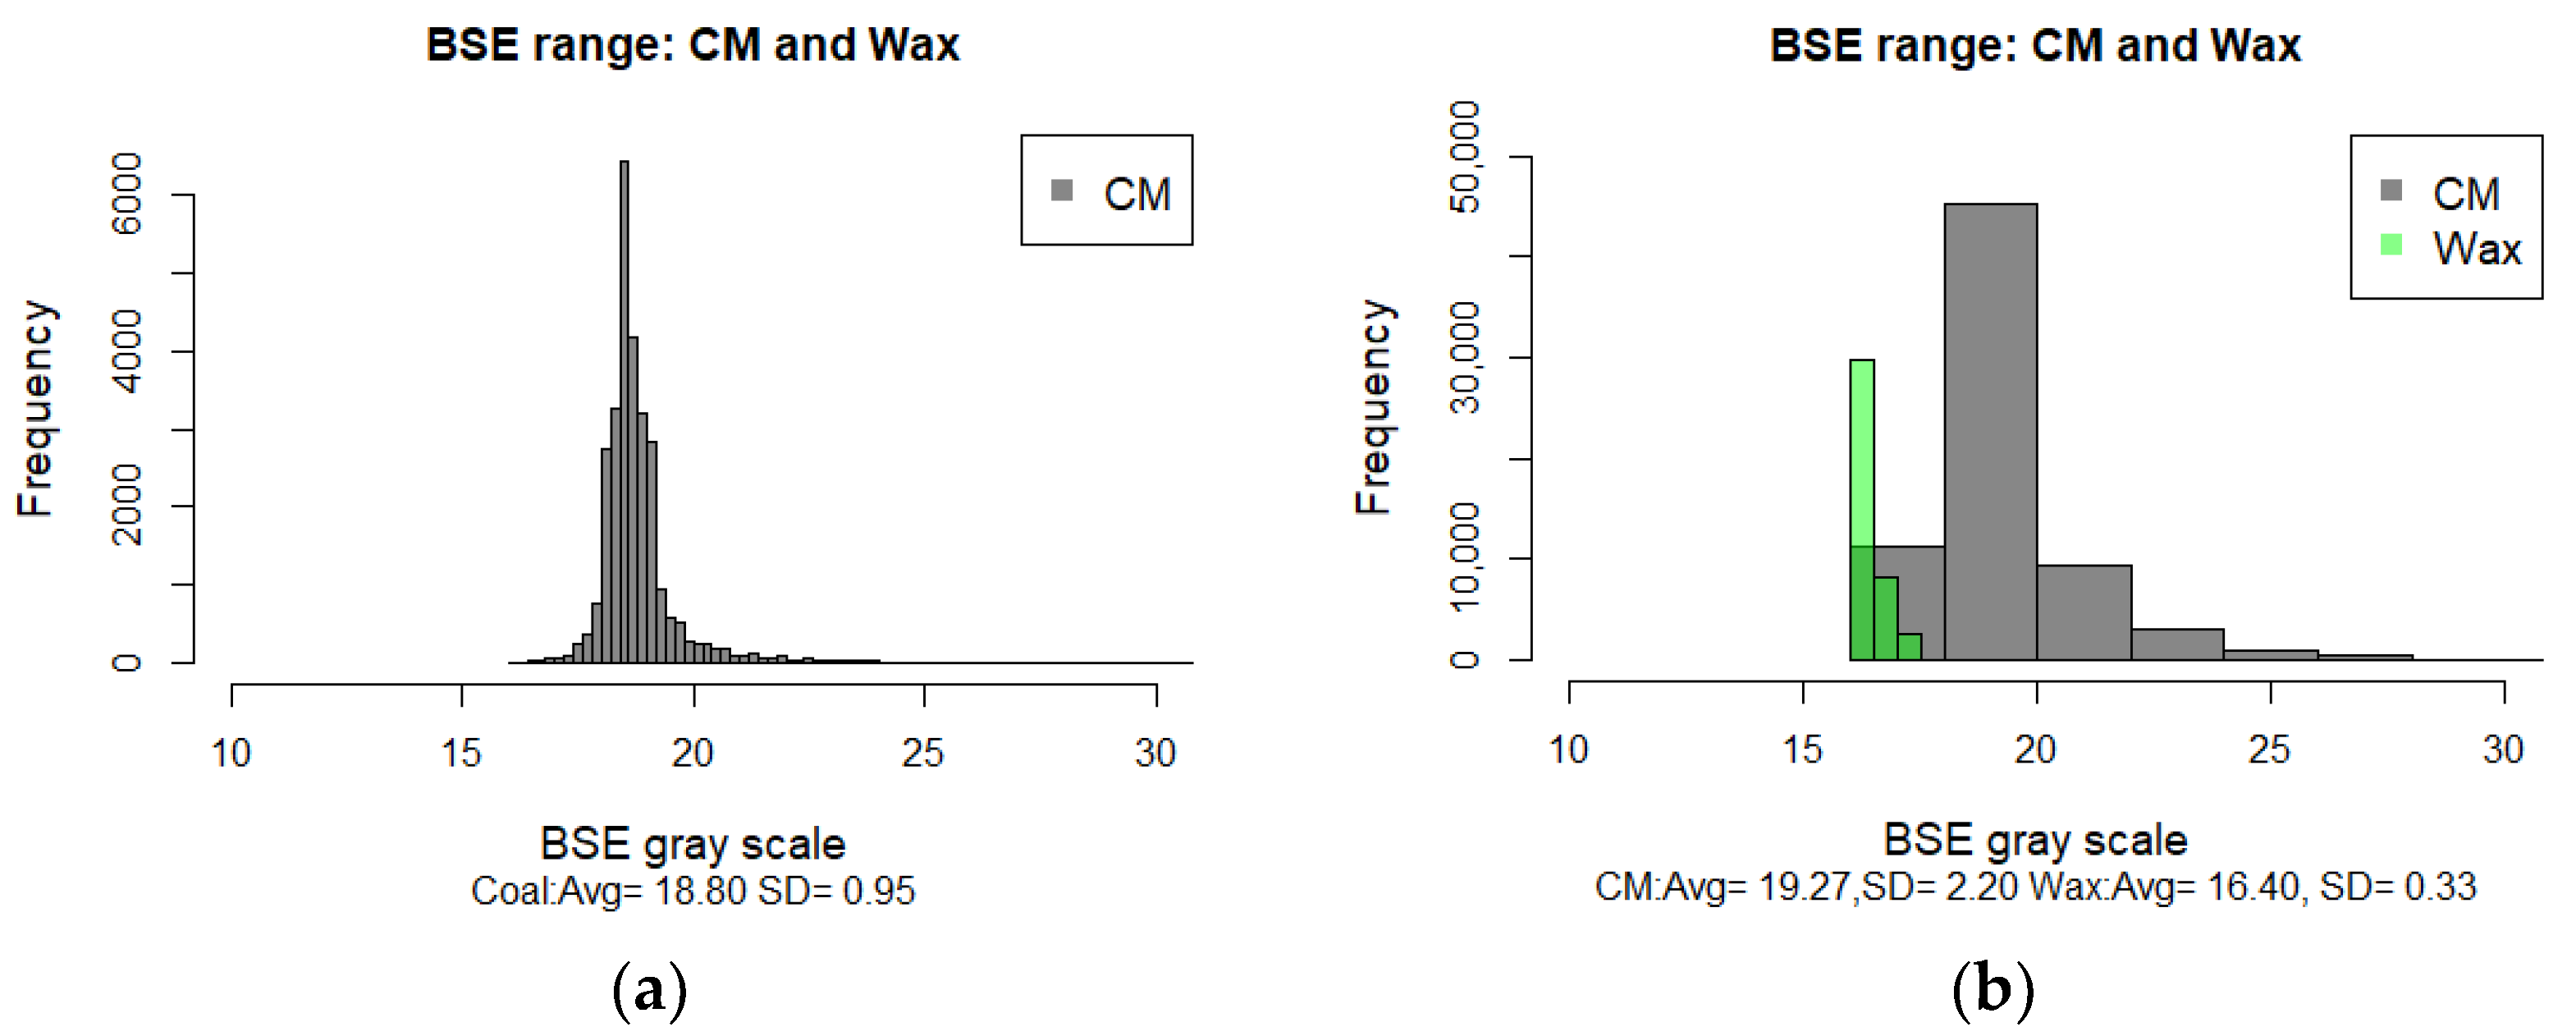
The drill core and coarse particle standards were again used to extract individual pixel information of the BSE ranges of the phases mentioned above. In Figure 5a, the BSE information from 33,307 pixels—extracted from a field image of the drill core (Figure 4a)—showed a narrow and unimodal BSE distribution range for carbonaceous matter.
To contrast this with the ranges of the wax background, BSE information extracted from the coarse particle standard (194,615 pixels, based on Figure 5) revealed a slight overlap in ranges between the carbonaceous matter and wax (Figure 5b). However, the overlap was considered marginal and by determining the cut-off ranges between the elements present in carbonaceous matter versus wax, proper discriminations could be made between the background and the carbonaceous matter.

2.5. Complementary XRF and XRD Data

To assess the accuracy of the measurement two levels of data validation were employed. In the first level, the major element chemistry measured by the QEMSCAN was compared against an externally measured major element chemical assay using X-ray fluorescence spectrometry (XRF). The measurement was conducted by the Central Analytical Facilities, Stellenbosch University, Stellenbosch, South Africa, using a PANalytical Axios Wavelength Dispersive spectrometer on homogenised fusion disks. Major elements were analysed on a fused glass disk using a 2.4 kW Rhodium tube. Matrix effects in the samples were corrected by applying theoretical alpha factors and measured line overlap factors to the raw intensities measured with the SuperQ PANalytical software.
Secondly, the mineral abundances quantified by the QEMSCAN measurement were compared against mineral abundances determined through X-ray diffraction (XRD). The measurement was conducted by XRD Analytical and Consulting using a Malvern Panalytical Aeris diffractometer with a PiXcel detector and fixed slits with Fe-filtered Co-Kα radiation. A randomly ordered powder mount of the sample was prepared for analysis using the back-loading method. From this, the diffraction patterns were measured in the scan range 5.0000–80.0002° of 20 with a step size 0.0217° and a count time of 48.195 s per step. To identify and quantify the crystalline phases from the diffractogram, the Bruker DIFFRAC.EVA software was used by applying the Rietveld refinement method [56]. The amount of carbonaceous matter could not be quantified by the diffractogram due to its amorphous structure. Hence, to determine an estimate of the carbonaceous matter, the XRD results were normalised to the percentage of mineral matter using (Equation (5)) established in [57].
% mineral matter = %ash(SO3 free) × 100/(100 − (%CO2 + %H2O + %S))
In applying this method, the ash content of the coals was determined using the ASTM D3174-12 methodology for obtaining the ash in coal. Furthermore, the percentages of CO2, H2O and S in the relevant minerals identified were obtained from the Webmineral mineralogy database [58].

3. Application and Evaluation of the Auto-SEM-EDS-XRD Protocol: A Case Study

3.1. Sample Description and Preparation

For this study, a sample set of bituminous coals from South Africa, Brazil and Mozambique were used as a case study to obtain a variety of particle populations and particle characteristics. For context, the description of each sample is represented in Table 5.
Upon receipt, the samples were coarse (ranging from 5 cm to 180 µm) and thus required milling to reduce the particle size to the size range of dust. To achieve this, a process was developed to reduce the final particle size of the population to approximately 25 µm or less applying methods defined by previous authors [12,59,60,61] (further described in Supplementary Section S3).
Although this study acknowledges that applying laboratory-based methods to generate dust-sized particles may not be representative of real-world coal dust, the practicality of using dust-sized coal particles was viewed as sufficient to develop critical aspects of the workflow, namely, the composition classification and size requirements needed to successfully run the measurement.
To cross-check the relevance of the samples as representative of an inhalable fraction, the relative proportion of sub-10 µm particles was quantified using the Malvern Mastersizer 2000. In all cases, the particle size reduction methods used produced particle populations with approximately 50 percent of the final sample containing particles <10 µm in size (tested on 17 independent coals, data not shown). Reliable Malvern measurements were not possible to obtain for some of the coal samples due to their natural hydrophobicity, which impaired the Malvern measurement. Instead, these samples were assumed to follow the trend of the non-hydrophobic coals as they were prepared using the same methods. All samples could be classified as dust-sized. Sub-samples of each coal were prepared for the QEMSCAN analysis using a benchtop rotary sample divider and micro rotary riffle splitter.
To evaluate the performance of the characterisation data reported, a subset of wax blocks was chosen to assess the representativity between replicate scans and blocks (refer to Table 5). Based on an analysis of these samples, the relevance of measurement representativity is discussed with respect to a validation of the mineralogical and chemical analyses using the complementary XRD and XRF data.

3.2. Measurement Validation

In assessing the consistency and accuracy of auto-SEM based reports, an understanding of the representativity of the measurement is important in the context of potential sources of uncertainty. The bulk mineralogy or mineral grades, as reported by QEMSCAN, (see Figure 6) represents a baseline for understanding the representativity of the measurement.
For the samples analysed, the combination of carbonaceous matter, quartz, clays, and pyrite accounted for approximately 80–95 percent of the sample by mass%. To assess the reliability of these reported abundances, the 95% confidence limits were calculated for each mineral based on the number of points analysed [62] (see Figure 6). Through the uncertainty assessment, an error of less than 1% mass abundance was reported for all the phases identified. By assessing the uncertainty related to the mineral grades it was generally found that when the grades were lower the magnitude of the uncertainty was higher relative to the value, as displayed in Figure 6.
To provide a means of validating the representativity of measurements, two assessments relating to the mineral abundances and major element chemistry were made. The first assessment involved comparing the abundance of the major phases between the QEMSCAN and XRD analyses (see Figure 7).
Based on the comparison reported in Figure 7, a reasonable level of similarity for both sets of replicate measurements was established (R2 > 0.8 for M1 and 2). Furthermore, by assessing the mean differences between the two analysis methods per phase, it was found that measurement 1 (M1) presented a lower percentage difference with respect to the XRD abundances than measurement 2 (M2). Sample SA-UF2 displayed the greatest disparity between measurements, with M2 reporting 16, 6, and 4 mass% more carbonaceous matter, clays, and quartz, respectively, than M1. As the measurements were conducted on two separate blocks, processed from different preparation batches, it can be assumed that the variation observed could be attributed to sub-sampling of batches from the starting bulk.
For the performance of measurements 1 and 2 in identifying pyrite, it was observed that sample Br-PyC showed the greatest disparity between measurements compared to the other samples (3 mass% difference between measurements 1 and 2). As the measurements were acquired from the same block, the discrepancies relating to the composition between scans could be a result of the number of points analysed. Further analysis on the level of confidence expressed by the number of points counted revealed that for M1 with 35,056 pyrite points an error of ~1 mass% was determined. By contrast, M2 with 9045 points displayed an error of ~3 mass%. This confirms that the deviation in pyrite content in M2 could be because of sampling-related errors based on the number of points analysed.
Ultimately, based on the comparative deviation between the QEMSCAN and XRD analyses coupled with an understanding of the source of uncertainty, the measurements analysed can be considered representative of the bulk sample within 3.6% error by mass on average.
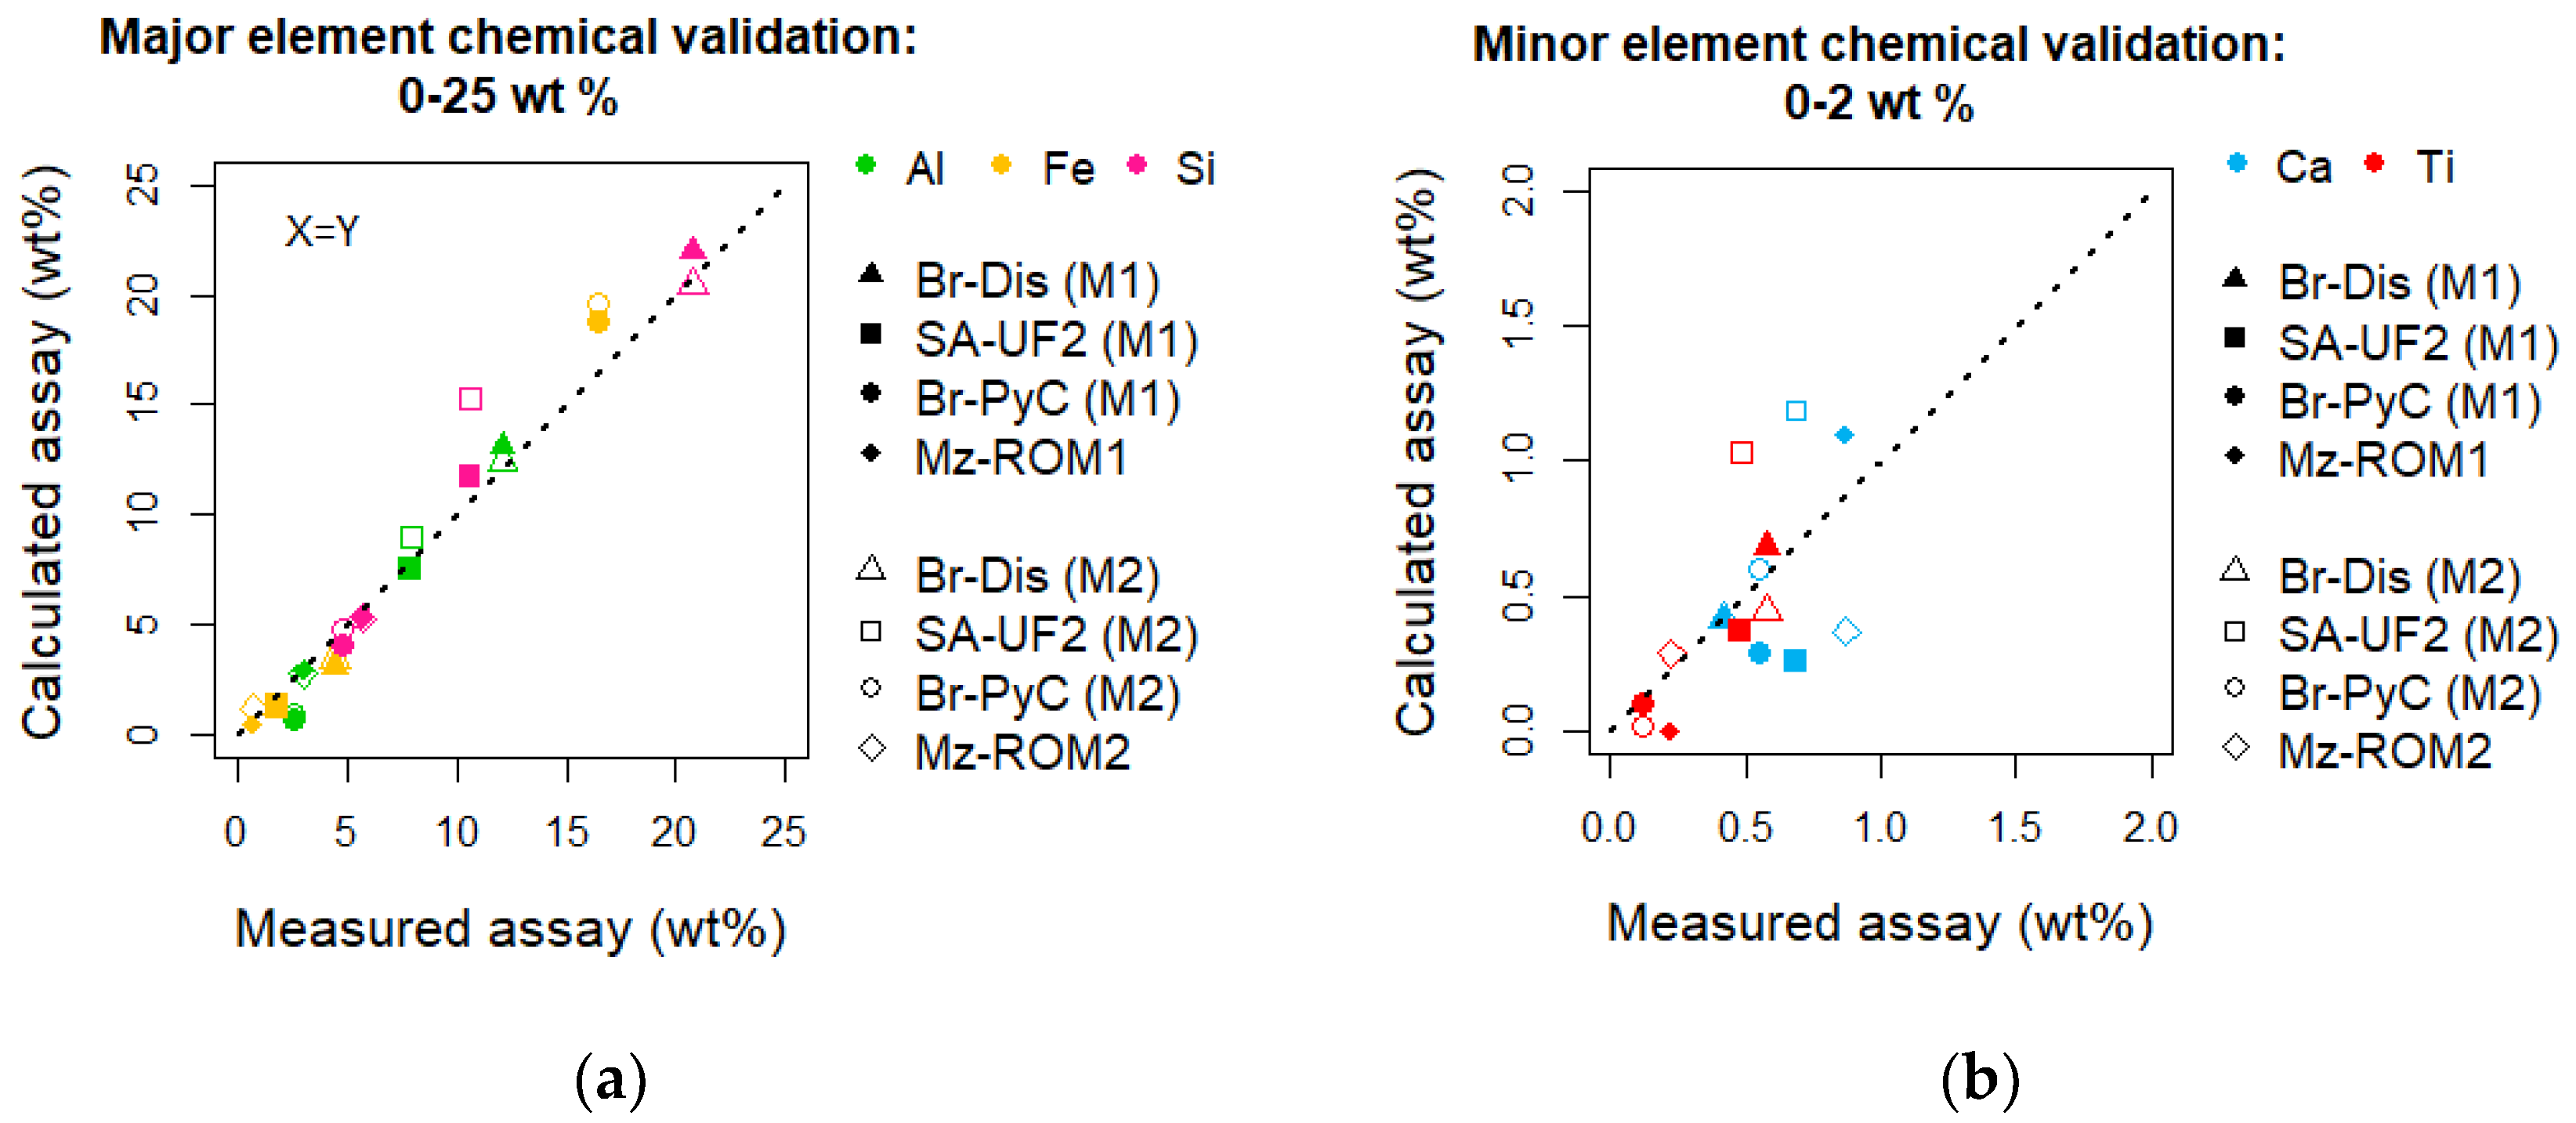
For the second validation assessment, the major element chemistry back-calculated by the QEMSCAN using supplied mineral compositions (see Supplementary Section S3), and a measured chemical assay conducted by XRF analysis were compared. For Al, Si and Fe (Figure 8a), it was generally found that there was a reasonable level of similarity for both sets of replicate measurements (R2 > 0.9).

3.3. Elemental Distributions

The mean difference reported for Al, Si, and Fe between the two analysis methods was 0.84, 0.85, and 1.1 wt.%, respectively, for measurement 1 and 0.83, 1.35, 1.29 wt.%, respectively, for measurement 2. As the differences were found to be less than 2 wt.%, the compositions were determined to be representative relative to the standard chemistry.
Parity charts for the minor elements Ti and Ca (<1.5 wt%) are shown in Figure 8b. The Pearson coefficient between the calculated and measured assay for Ti was 0.77 for M1 and 0.54 for M2, suggesting that Ti may not be fully accounted for in the defined mineral compositions.
The Pearson coefficient for Ca showed a poor indication of agreement with the measured and calculated assay data. The random nature of the errors further suggests that the error is neither related to measurement nor identification related errors. As Ca can be found in multiple minerals, as opposed to Ti (which was accounted for in rutile), the uncertainty derived from the calculation of Ca may be compounded by the uncertainty of its host minerals.
Ultimately, the mean deviation in Ca reported between the calculated and measured assay were found to be 0.56 (±0.28) and 0.65 (±0.29) wt.% on average for M1 and M2, respectively. In the context of these results, it should be acknowledged that the parities reported are mostly indicative of the accuracy between major and minor phases, as derived from the four samples. Ultimately, the mineral and element distributions are optimised to obtain a general best fit for the major element chemistry. As such, this entails a compromise between the overall fit and the fit of major and minor phases.
By extracting the contribution of selected elements (Si, Fe and Ca) within each mineral identified, the elemental deportment amongst host minerals was extracted as a percentage of the total element content (see Table 6). To obtain a more accurate indication of the element distributions, the percentages were normalised to the element concentration measured by XRF. By normalising the data, confidence in the accuracy of the element distributions was strengthened by utilising the XRF chemistry.
Regarding the distributions of Si, which mainly was reported in quartz and clays, the Ca and Fe were found to be distributed amongst several host mineral groups (see Table 6 and Supplementary Section S1 for reference on mineral groups and chemical formula). As the presence of some minerals may be difficult to distinguish based on the nature of how the mineral identification is performed, XRD analysis was used to positively confirm the presence of the minerals described. In the case of minerals identified by the QEMSCAN but present at levels too low to be detected by XRD (chalcopyrite, goethite, hematite, siderite, sphalerite, ankerite and apatite), the composition was tightly constrained to the reference mineral chemistry to ensure confidence in their presence.

3.4. General Particle Characteristics

3.4.1. Size Distributions

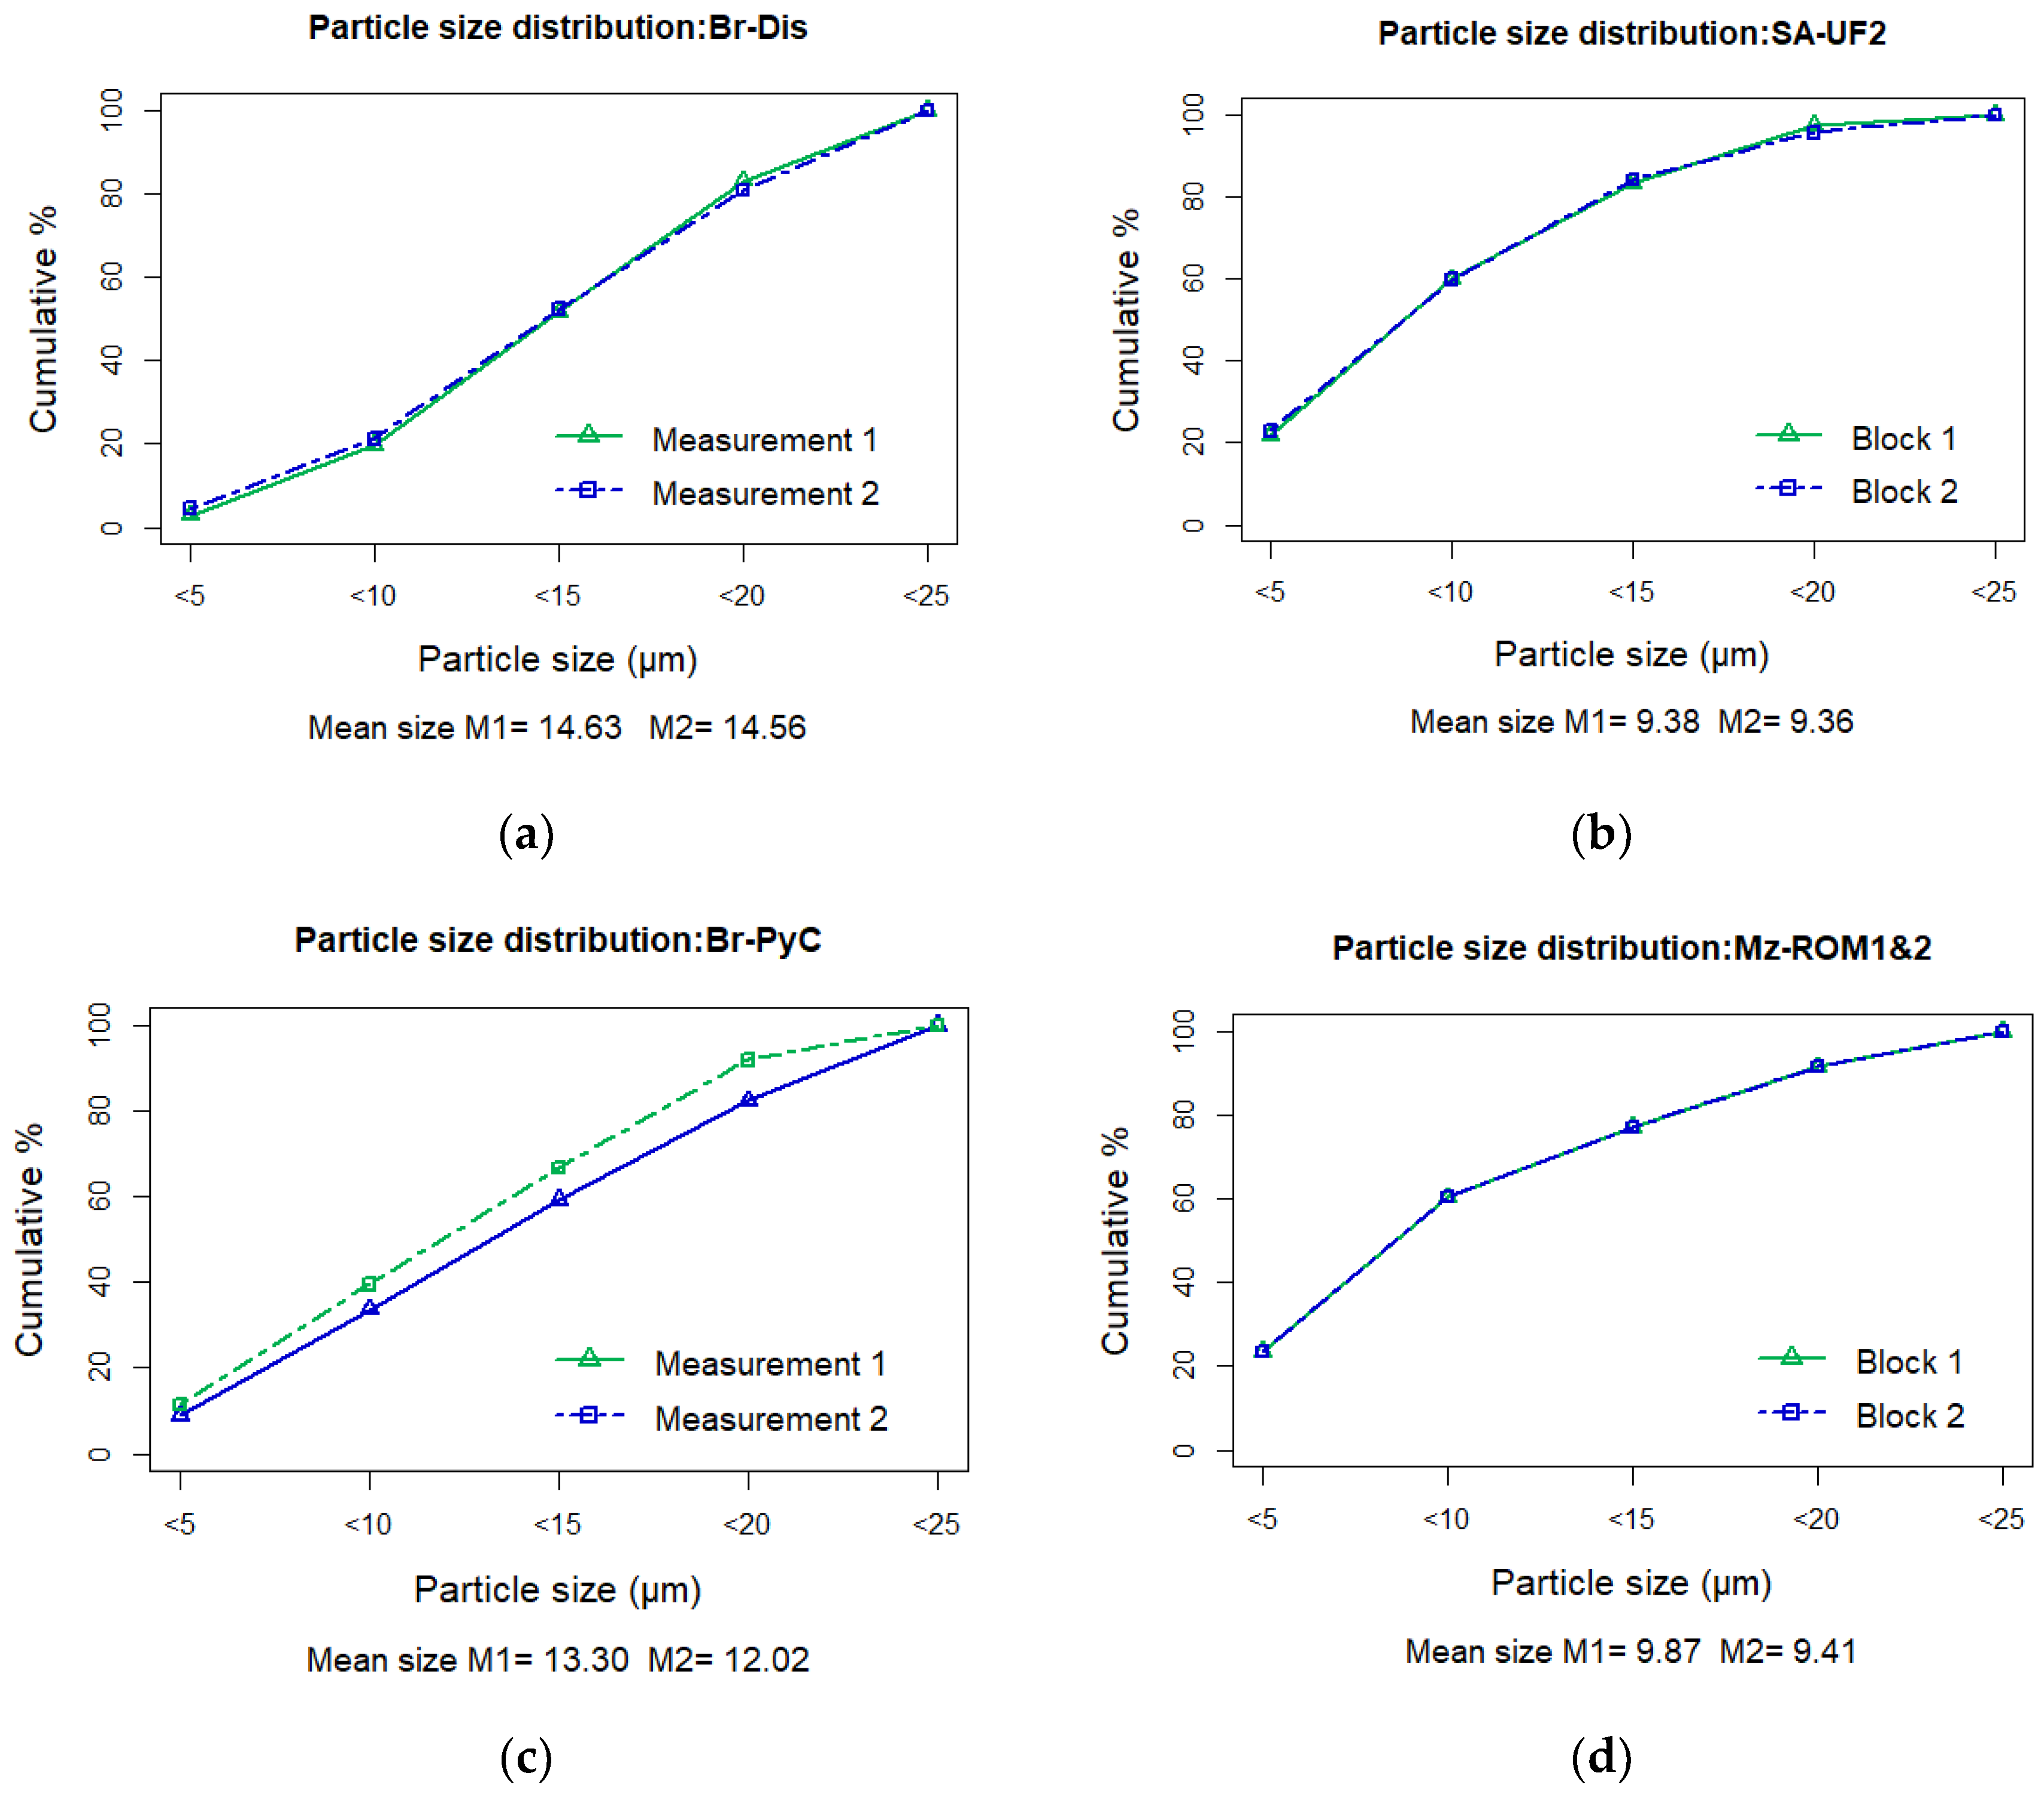
To assess the reliability of the QEMSCAN in providing a consistent analysis of the particle sizes and their distributions for dust-sized particles, the distribution of particle sizes was assessed for each sample by determining the cumulative frequency of particles reporting to size categories (<5, <10, <15, …, <25).
The results in Figure 9 indicate that for Br-Dis, and Mz-ROM1&2, the particle size distributions were nearly the same for both sets of replicate measurements (Figure 9a,d, respectively). Similarly, the size distributions between blocks 1 and 2 of SA-UF2 were found to be highly similar, even though the resulting measurements were found to be compositionally dissimilar (see Figure 9b). Such findings support the notion that for sample SA-UF, the differences between measurements can be related to the variability in the sample batches and not measurement-related errors. For sample with Br-PyC, the particle size distributions were found to differ on average by 5 mass%, resulting in a 1.28 µm difference in the mean size. This may again be a result of the difference in the number of particles between measurements.
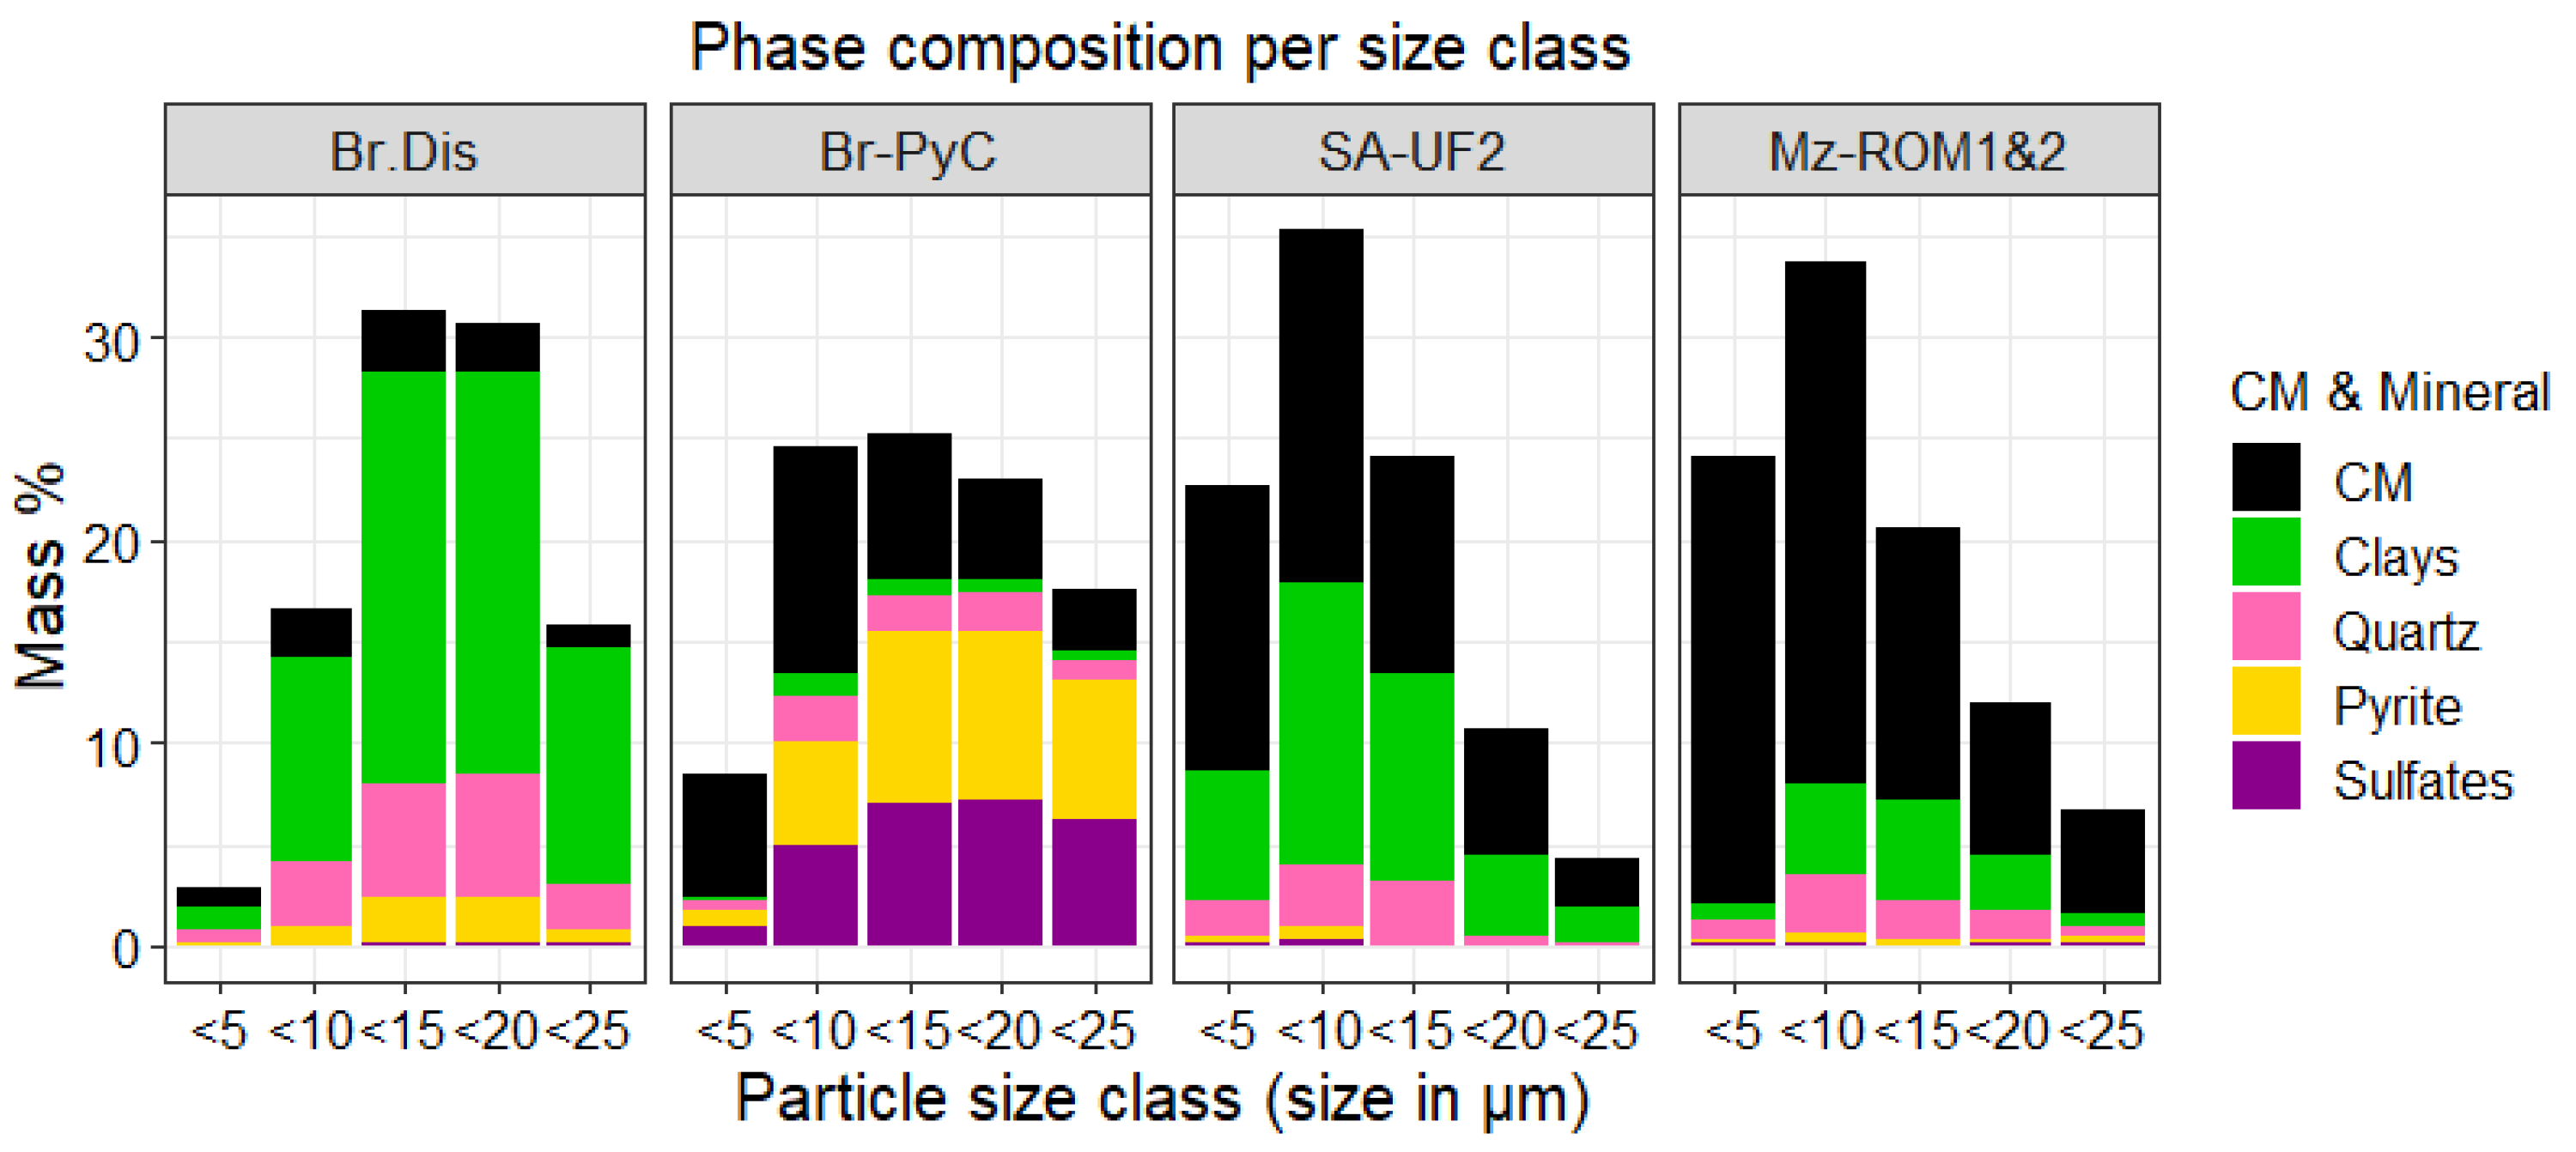
It was also observed that the particles in Br-Dis and Br-PyC were coarser on average than the particles in SA-UF2 and Mz-ROM1&2 (see Figure 9). In accordance with this observation, it was determined that samples SA-UF2 and Mz-ROM1&2 produced a greater proportion of particles less than 5 µm than samples Br-Dis and Br-PyC. Considering that the parental coals were crushed, and both SA-UF2 and Mz-ROM1&2 contain appreciable amounts of carbonaceous matter, it was suggested that a higher abundance of more easily friable carbonaceous matter may result in a greater proportion of fines. This was tested by assessing the mass% of carbonaceous matter in the fine particles (<5 µm class) compared to the coarser particles (>5 µm) (see Figure 10).
A high abundance of fines was reported for coals which composed >50 mass% carbonaceous matter (51 mass% for SA-UF2 and 74 mass% for Mz-ROM1&2, respectively), relative to the other samples (mass% fines was 22 and 24%, respectively). Furthermore, a significant proportion of these particles were found to compose of carbonaceous matter (61 and 90% for samples SA-UF2 and Mz-ROM1&2, respectively). While it was clear that the fines mostly comprise carbonaceous matter in Mz-ROM1&2, SA-UF2 displayed appreciable amounts of clays in the fines (see Figure 10). Considering that the bulk composition of SA-UF2 comprised of ~36% clays, such observations may suggest that either a portion of the fines may be composed of clay grains or that there is a strong association of the carbonaceous matter with the clays.
Between the coals which contained the lowest mass of carbonaceous matter (33 and 10 mass% for Br-PyC and Br-Dis, respectively) a low abundance of fines was reported (10 mass% for Br-PyC and 3 mass% Br-Dis, respectively). By assessing the composition of fines, approximately 70% and 33% of the fines were composed of carbonaceous matter for Br-PyC and Br-Dis, respectively. Considering that Br-Dis contained extremely low abundances of carbonaceous matter in the bulk (~12 mass%), this may account for the low proportion of carbonaceous matter in the fines relative to other minerals such as clays and quartz.
Based on the observations described, the abundance of carbonaceous matter in a coal may impact its propensity to generate fines. However, samples SA-UF2 and Br-Dis highlight that when coals are crushed, inherently fine-grained minerals such as clays can additionally contribute to the proportion of fines. The presence of associations or texture needs to be considered when assessing the composition as a function of particle size, since the particle population includes both grains (particles containing a single phase) and composites (particles containing a mixture of phases).

3.4.2. Shape and Roughness

In this study, the total population of particles per sample was classified using the shape and roughness categories defined in Section 2.2.3 and Section 2.2.4, respectively. The percentage of particles reporting to each class was subsequently determined for both shape and roughness (see Table 7 and Table 8, respectively).
For particle shape, the results from Table 7 show that most of the particles were reported as equant (roughly box-like or ball-like) or angular across all the samples (mean across samples: 64 (±11.34), 28 (±11.58) mass% for equant and angular particles, respectively). This may be a result of the milling processes, which in turn fracture the material to produce such shapes.
Based on the results on particle roughness in Table 8, the majority of the population analysed reported to the jagged and intermediate classes, while only a minor percentage of particles reported smooth (mean abundance across samples 67 (±4.24), 22 (±1.12) and 10 (±3.49) mass%, respectively). Such observations are consistent with the particle shapes reported as a function of the breakage mechanism involved in the milling process [63,64].

3.5. Mineral Specific Particle Characteristics: Liberation and Association

In addition to determining the bulk mineralogy in the particle population, the QEMSCAN software allows users to quantitatively determine the composition of the individual particles within the population. For this study, the degree to which the main minerals (clays, quartz, and pyrite) were liberated was assessed by determining the cumulative liberation yield (CLY) based on the liberation classes defined in Section 2.2.5. Additionally, 95% confidence limits were computed for each class using methods outlined in [65].
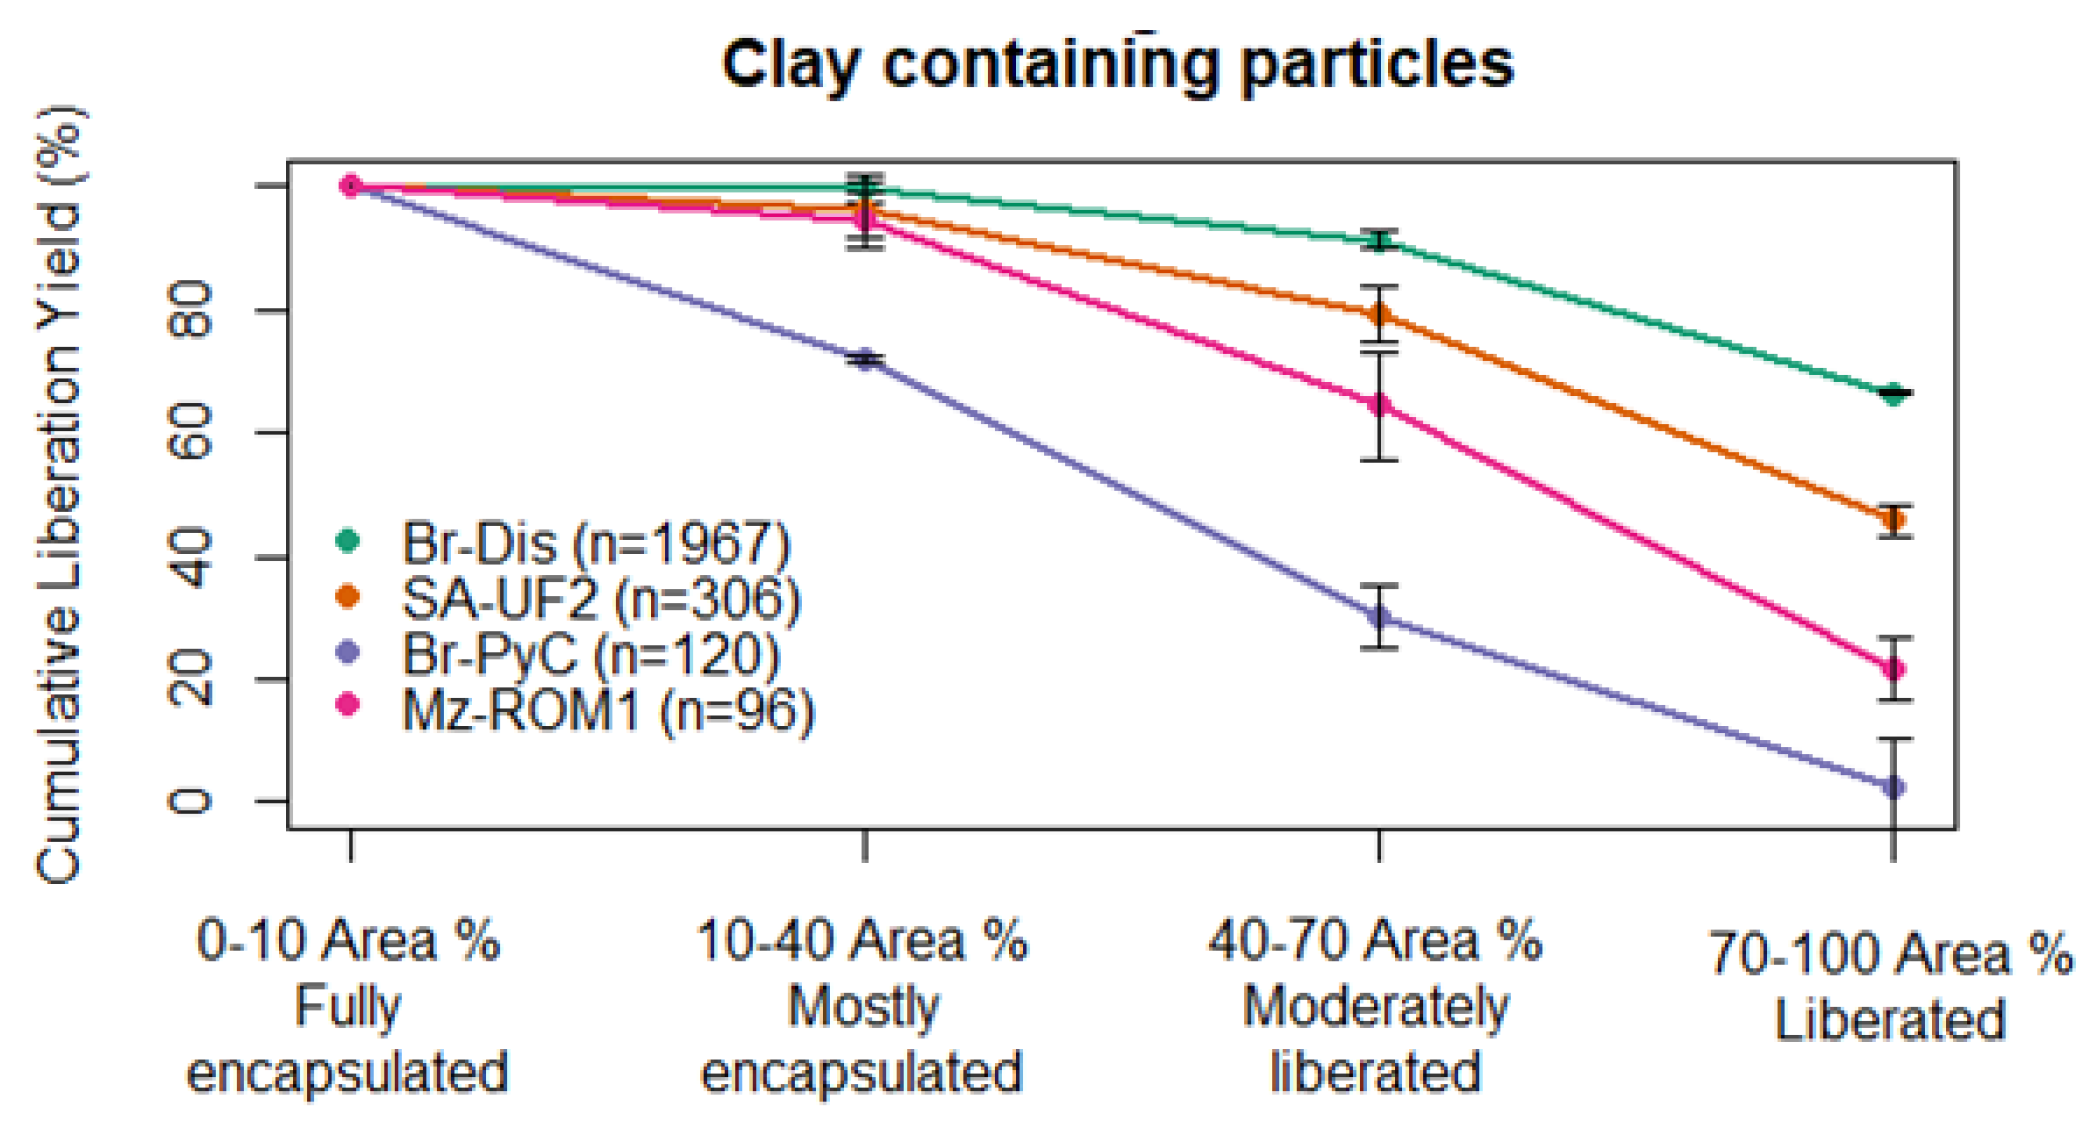
Across the samples analysed, the liberation of particles containing clays was found to vary based on the CLY profiles for each sample (see Figure 11). For Br-Dis, SA-UF2, Br-PyC and Mz-ROM1, the percent of liberated particles was 64 (±0.33), 46 (±2.42), 3 (±7.65), and 22 (±4.92)%, respectively. This suggests that when some coals are crushed a substantial portion of the clays may occur as liberated grains, while for others the clays more readily occur as composites.
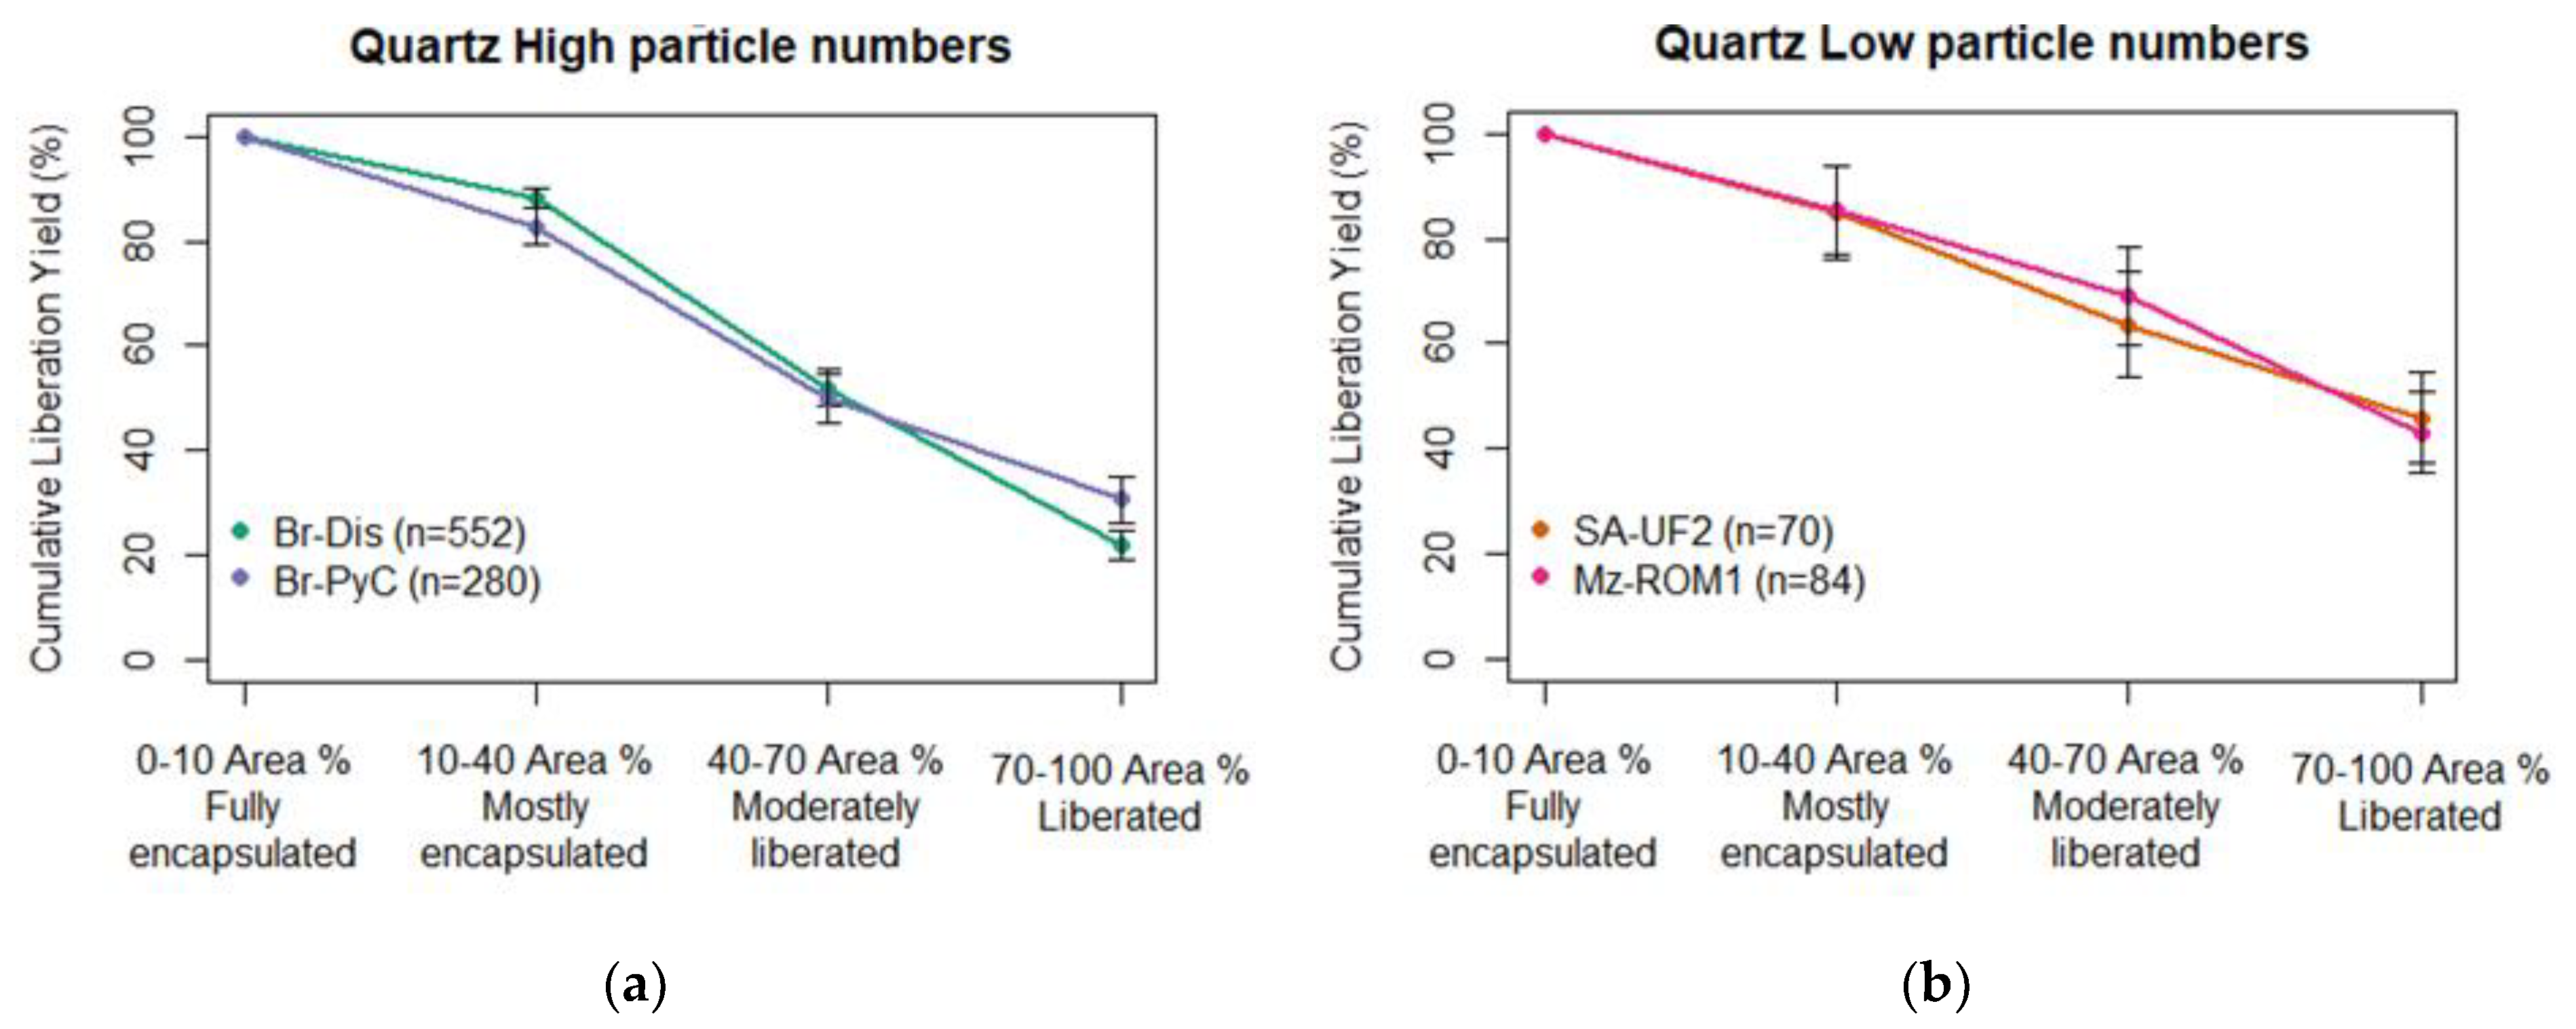
Regarding the liberation of quartz, represented in Figure 12, little variation was reported across the samples (the percent of liberated quartz was found to be 22 (±2.85), 46 (±8.69), 31 (±4.46), and 43 (±7.61) mass% for samples Br-Dis, SA-UF2, Br-PyC and Mz-ROM1, respectively). These results indicate that quartz derived from pulverised coal tends to mostly occur in composite particles.
Furthermore, it was observed that the magnitude of the confidence limits displayed a dependence based on the number of particles containing quartz. For samples Br-Dis and Br-PyC, which obtained relatively high particle numbers, the confidence limits displayed no overlap between liberation classes (see Figure 12a). However, for samples SA-UF2 and Mz-ROM1, with considerably lower particle numbers, a higher magnitude of error resulted in an overlap between liberation classes (see Figure 12b).
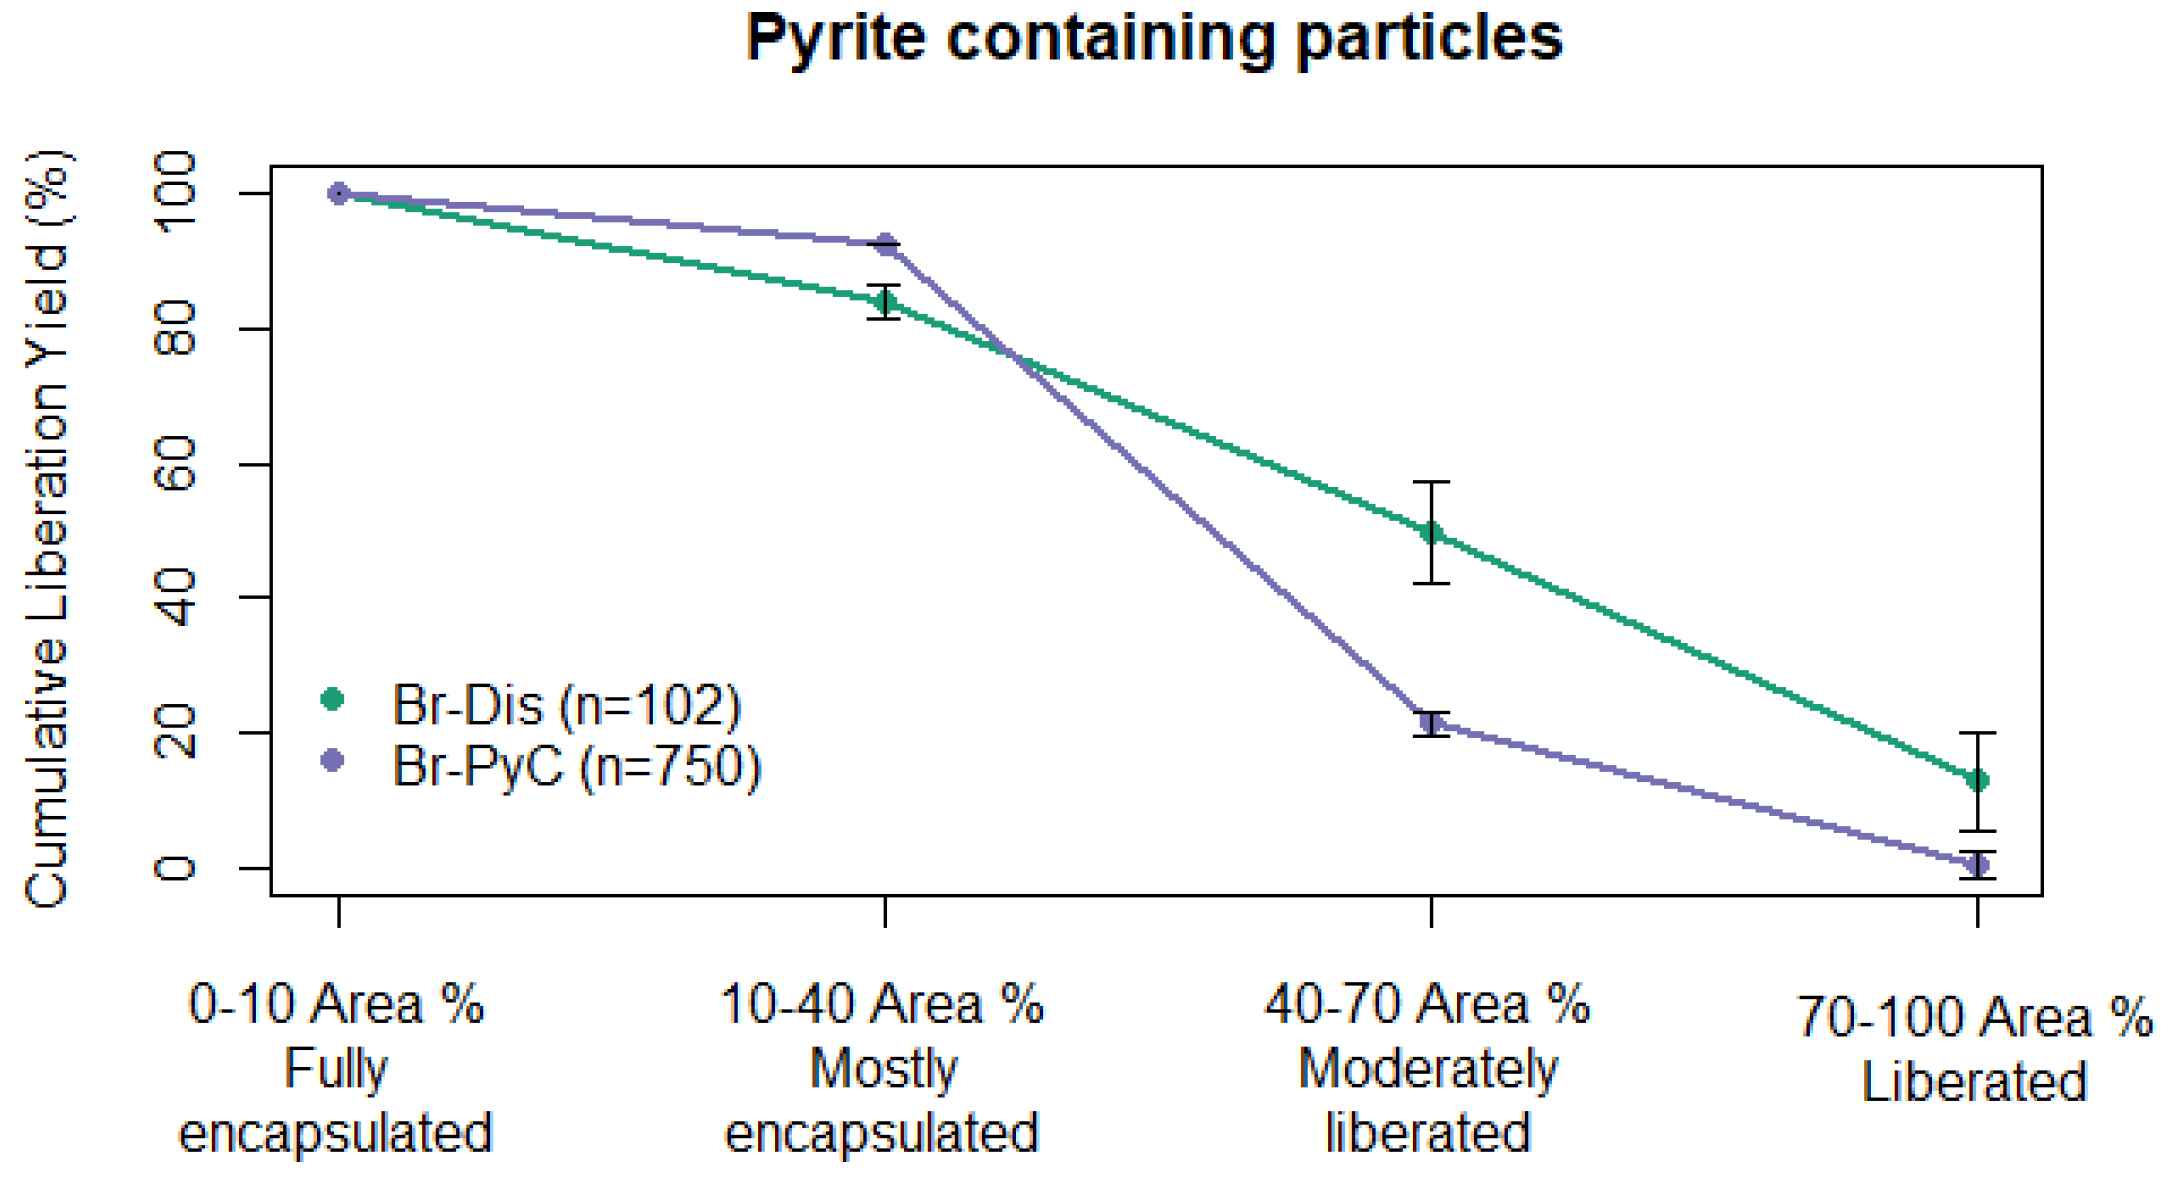
For samples SA-UF2 and Mz-ROM1 the liberation of particles containing pyrite could not be reliably determined as the particle numbers were too low (2 and 7 particles, respectively). The results for samples Br-Dis and Br-PyC in Figure 13 show that Br-Dis displayed a higher proportion of liberated pyrite grains than Br-PyC (13 (±7.32) and 0.44 (±2.03) mass%, respectively). Even though Br-Dis displays a slightly higher liberation than Br-PyC, the majority of the particles containing pyrite were still composites.
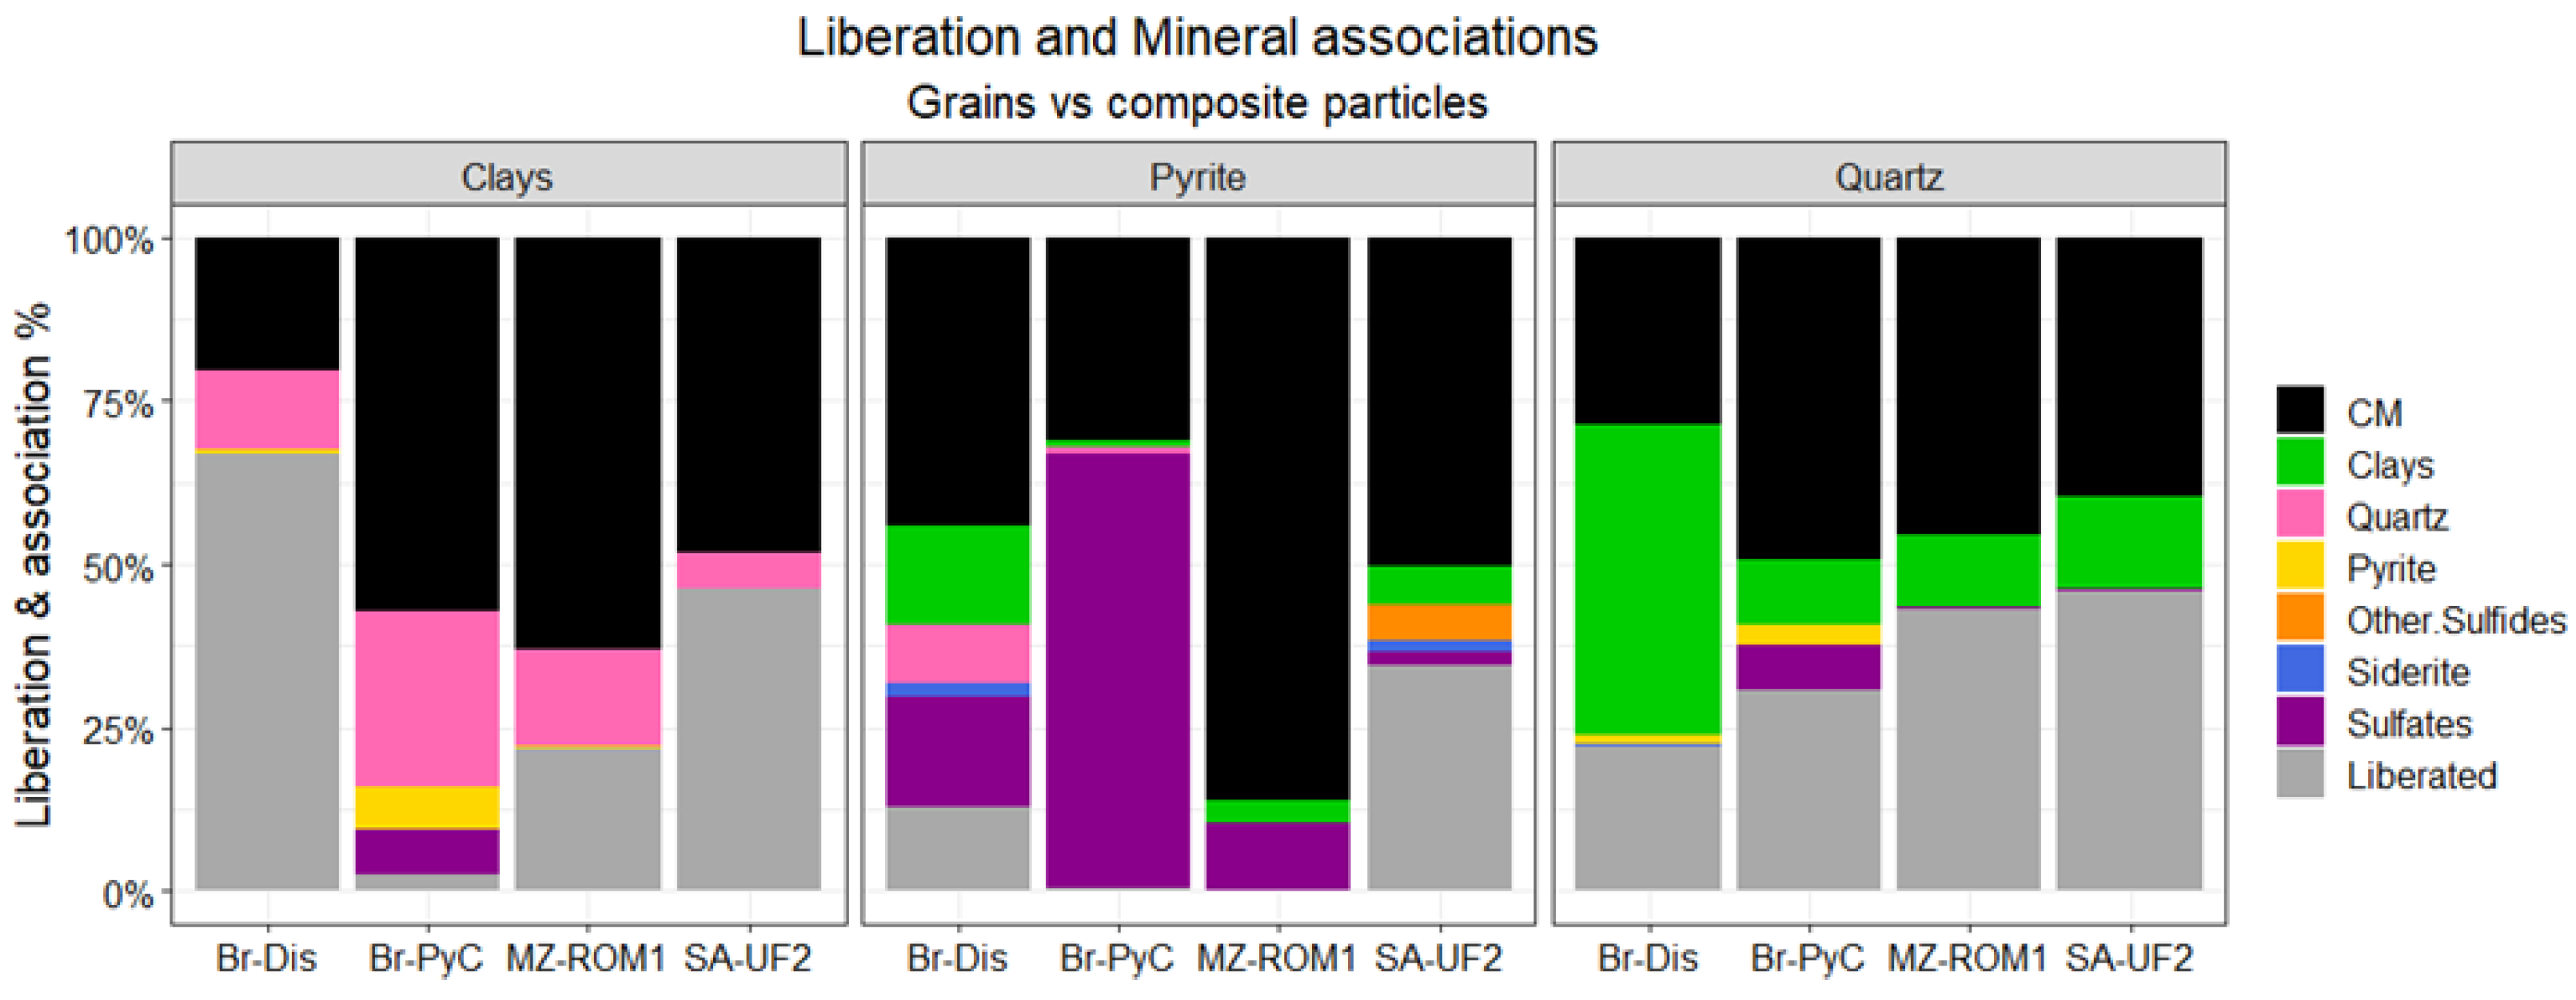
Mineral associations for the non-liberated fraction as well as the percentage of liberated particles were computed and are presented in Figure 14. The results indicate that the composite particles containing clays are mostly associated with carbonaceous matter. However, in some coals, notable associations between the clays and quartz were also observed (36, 28, and 19% association for Br-Dis, Br-PyC, and Mz-ROM1, respectively). Additionally, for Br-PyC, minor associations of the clays with pyrite and sulfates were reported (~7% association for both minerals).
Particles containing pyrite were mostly associated with carbonaceous matter, as well as sulfates. The latter association was particularly significant in the case of Br-PyC (67% association) but was found to vary across the samples (19, 10, 3% association for Br-Dis, Mz-ROM1 and SA-UF2, respectively). As pyrite can readily oxidise to sulfates in the presence of oxygen and water, such an association may allude to the state of weathering the mineral has undergone. Apart from sulfates, the pyrite-containing composites showed minor associations with additional minerals such as quartz, clays, and siderite in Br-Dis (10, 17 and 2% association, respectively) and clays, other sulfides, and siderite in SA-UF2 (9, 9 and 3% association, respectively).
Concerning the associations with quartz composites, carbonaceous matter was determined to be the predominantly associated phase with quartz across the samples. This was with the exception of sample Br-Dis, which showed only 36% association of carbonaceous matter with quartz. For this sample, the quartz was strongly associated with clays (60% association) in comparison to the other samples where this association was only weak (14, 19 and 25% association for Br-PyC, Mz-ROM1 and SA-UF2, respectively). Additionally, it was found that the quartz displayed minor associations with pyrite and sulfates for Br-PyC (5 and 10% association, respectively).

3.6. Limitations and Broader Implications of the Dataset

Through this study, an auto-SEM-EDS-XRD protocol was developed for the particle analysis of coal dust using the dust-sized coal particles. By applying laboratory-based methods to generate dust-sized particles, this study recognises that the particles analysed may not be representative of real-world coal dust. However, the analysis of dust-sized coal particles in the absence of real-world dust provided a practical means with which to develop the protocol to suit both the composition classification and size requirements needed to successfully run the measurement. Thus, despite such a limitation, the applicability of the protocol renders itself useful to real-world samples and the analysis of several coals which can be used to develop large datasets of particle information as a prerequisite for future biological testing of the material.
Through recent research, it has been demonstrated that geoanthropogenic activities at collieries can produce variation in the characteristics of coal dust [30,47]. The results of this study have indicated that the amount of carbonaceous matter—and in some cases clays—may influence the proportion of fines produced when coal is crushed. Furthermore, it was proposed that the breakage induced by crushing and milling coal produces particles that are mainly equant and angular. Ultimately, these properties could have significant implications in terms of potential health risks post-exposure.
In the context of developing a nuanced understanding of bio-accessibility, auto-SEM-EDS systems such as the QEMSCAN provide a quantitative measurement for mineral liberation and associations. As mineral associations have been found to impact the way certain reactive minerals behave in biological systems, the quantification of such information may prove useful in the interpretation of dose–response testing. Similarly, information of the element distributions within host minerals provides a more nuanced understanding of the bio-accessibility of potentially harmful elements than a standard chemical assay.
Despite these advantages and opportunities, the QEMSCAN system (or any equivalent platform) requires a substantial initial time investment to set up a robust SIP list, as well as repeated scans to optimise field and scan parameters to the size range of dust particles. Additionally, the data need to be validated to understand whether the measurement is representative of the bulk sample, and if sufficient particles were analysed to obtain the level of accuracy needed for the application.
As a result, it is recommended that an auto-SEM-EDS-based protocol should include the collection of independently analysed mineralogical (e.g., QXRD) and elemental data (supporting chemistry datasets). Recent work aimed at understanding the uncertainties in quantitative mineralogy from auto-SEM-EDS analyses demonstrated the effectiveness of bootstrap resampling methods to determine uncertainties in the reported data [66].
Ultimately, such exercises should be considered essential components of a dust characterisation routine, as such datasets can form critical primary information for decision-making. While the accuracy of the measurement can be verified based on its mineral grades and element composition, it should be recognised that the auto-SEM-EDS scans generated from polished blocks generate cross-sectional images of the particles. This entails that the results obtained for general physical characteristics such as particle size will not be comparable with other methods which have a fundamental difference in the way the particle image is acquired [67]. As such, the particle information extracted from auto-SEM-EDS should be carefully considered for its intended application and should be compared against complementary datasets, where possible, to ensure a robust analysis.

4. Conclusions

Previous studies, utilising auto-SEM-EDS systems to characterise coal dust particulates, have mainly focused on determining mineral compositions and establishing size distributions for a population of particles. While such information can be considered as baseline characteristics to establish an understanding of the potential risk associated with the dust, the auto-SEM-EDS protocol developed in this study targets a much wider range and provides a quantitative definition of particle properties—such as host mineral chemistry represented as element deportment, particle shape, and mineral liberation and association data.
Considering that toxicological studies have found direct and indirect relationships between these characteristics and respiratory damage, the ability to characterise a wide array of particle-related properties has significance for both assessment and management of coal dust related health risks and as prerequisite information for further biological testing.
Through an applied demonstration of the protocol, data reports from repeat measurements were rigorously validated. Based on an assessment of the sources of uncertainty, it was determined that errors in the protocol may arise from sampling-related uncertainty determined by the number of particles analysed. Ultimately, the results presented show the use of the developed protocol to effectively determine both general and mineral specific particle characteristics from auto-SEM-EDS systems similar to the QEMSCAN, highlighting how such tool can be utilised for the reliable analysis of dust-sized coal.

Supplementary Materials

The following supporting information can be downloaded at: https://www.mdpi.com/article/10.3390/resources11120114/s1, Supplementary Section S1: Mineral and carbonaceous matter formulae used in study [58,68,69]; Supplementary Section S2: Wax block preparation: general casting methodology; Supplementary Section S3: Particle breakdown methods; Supplementary Section S4: Ash methodology and Supplementary Section S5: XRF analysis information; Sheet 1: Mineral distributions, Sheet 2: CM estimation for XRD analysis, Sheet 3: Liberation and confidence intervals.

Author Contributions

Conceptualization, C.K. and M.B.; formal analysis, C.K.; investigation, C.K.; writing—original draft preparation, C.K.; writing—review and editing, C.K., M.B., J.B. and J.V.H.; supervision, M.B., J.B. and J.V.H.; funding acquisition, J.B. All authors have read and agreed to the published version of the manuscript.

Funding

This work is based on the research in part supported by the National Research Foundation of South Africa (Grant UID 120150) and the University of Cape Town.

Data Availability Statement

Not applicable.
The data presented in this study are available in the supplementary materials provided.

Acknowledgments

Grateful thanks are given to Keshree Pillay, Lorraine Nkemba and Gaynor Yorath for your time spent assisting and training with regards to the block preparation and measurement setup. Additional thanks are extended to the staff of the CMR and Minerals to Metals research groups at the Department of chemical engineering. The authors would also like to acknowledge the Central Analytical Facility at Stellenbosch University and XRD Analytical & Consulting for the analysis of the XRF and XRD data, respectively.

Conflicts of Interest

The authors declare no conflict of interest. The Grantholder acknowledges that opinions, findings and conclusions or recommendations expressed in any publication generated by the NRF supported research is that of the author(s) and that the NRF accepts no liability whatsoever in this regard.

References

  1. Leonard, R.; Zulfikar, R.; Stansbury, R. Coal Mining and Lung Disease in the 21st Century. Curr. Opin. Pulm. Med. 2020, 26, 135–141. [Google Scholar] [CrossRef] [PubMed]
  2. Hurley, J.F.; Burns, J.; Copland, L.; Dodgson, J.; Jacobsen, M. Coalworkers’ Simple Pneumoconiosis and Exposure to Dust at 10 British Coalmines. Br. J. Ind. Med. 1982, 39, 120–127. [Google Scholar] [CrossRef] [PubMed] [Green Version]
  3. Heppleston, A.G. Coal Workers’ Pneumoconiosis: A Historical Perspective on Its Pathogenesis. Am. J. Ind. Med. 1992, 22, 905–923. [Google Scholar] [CrossRef]
  4. Petsonk, E.L.; Rose, C.; Cohen, R. Coal Mine Dust Lung Disease: New Lessons from an Old Exposure. Am. J. Respir. Crit. Care Med. 2013, 187, 1178–1185. [Google Scholar] [CrossRef] [PubMed]
  5. Cohen, R.A. Resurgent Coal Mine Dust Lung Disease: Wave of the Future or a Relic of the Past? Occup. Environ. Med. 2016, 73, 715–717. [Google Scholar] [CrossRef]
  6. Vallyathan, V.; Shi, X.; Dalal, N.S.; Irr, W.; Castranova, V. Generation of Free Radicals from Freshly Fractured Silica Dust. Potential Role in Acute Silica-Induced Lung Injury. Am. Rev. Respir. Dis. 1988, 138, 1213–1219. [Google Scholar] [CrossRef]
  7. Harrington, A.D.; Tsirka, S.E.; Schoonen, M.A.A. Inflammatory Stress Response in A549 Cells as a Result of Exposure to Coal: Evidence for the Role of Pyrite in Coal Workers’ Pneumoconiosis Pathogenesis. Chemosphere 2013, 93, 1216–1221. [Google Scholar] [CrossRef] [Green Version]
  8. Harrington, A.D.; Smirnov, A.; Tsirka, S.E.; Schoonen, M.A. Metal-Sulfide Mineral Ores, Fenton Chemistry and Disease—Particle Induced Inflammatory Stress Response in Lung Cells. Int. J. Hyg. Environ. Health 2015, 218, 19–27. [Google Scholar] [CrossRef] [Green Version]
  9. Castranova, V.; Vallyathan, V. Silicosis and Coal Workers’ Pneumoconiosis. Environ. Health Perspect. 2000, 108, 675–684. [Google Scholar]
  10. Vallyathan, V.; Shi, X.; Castranova, V. Reactive Oxygen Species: Their Relation to Pneumoconiosis and Carcinogenesis. Environ. Health Perspect. 1998, 106, 1151–1155. [Google Scholar]
  11. Cohn, C.A.; Laffers, R.; Simon, S.R.; O’Riordan, T.; Schoonen, M.A. Role of Pyrite in Formation of Hydroxyl Radicals in Coal: Possible Implications for Human Health. Part. Fibre Toxicol. 2006, 3, 1–10. [Google Scholar] [CrossRef] [Green Version]
  12. Harrington, A.D.; Hylton, S.; Schoonen, M.A. Pyrite-Driven Reactive Oxygen Species Formation in Simulated Lung Fluid: Implications for Coal Workers’ Pneumoconiosis. Environ. Geochem. Health 2012, 34, 527–538. [Google Scholar] [CrossRef]
  13. Zhang, Q.; Dai, J.; Ali, A.; Chen, L.; Huang, X. Roles of Bioavailable Iron and Calcium in Coal Dust-Induced Oxidative Stress: Possible Implications in Coal Workers Lung Disease. Free Radic. Res. 2002, 36, 285–294. [Google Scholar] [CrossRef]
  14. Schoonen, M.A.; Harrington, A.D.; Laffers, R.; Strongin, D.R. Role of Hydrogen Peroxide and Hydroxyl Radical in Pyrite Oxidation by Molecular Oxygen. Geochim. Cosmochim. Acta 2010, 74, 4971–4987. [Google Scholar] [CrossRef]
  15. Gormley, I.P.; Collings, P.; Davis, J.M.G.; Ottery, J. An Investigation into the Cytotoxicity of Respirable Dusts from British Collieries. Br. J. Exp. Path. 1979, 60, 526–536. [Google Scholar]
  16. Reisner, M.T.R.; Bruch, J.; Hilscher, W.; Kriegseis, W.; Prajsnar, D.; Robock, K.; Rosmanith, J.; Scharmann, A.; Schlipköter, H.W.; Strübel, G.; et al. Specific Harmfulness of Respirable Dusts from West German Coal Mines VI: Comparison of Experimental and Epidemiological Results. Ann. Occup. Hyg. 1982, 26, 527–539. [Google Scholar] [CrossRef]
  17. Bouffant, L.L.; Bruyet, B.; Daniel, H.; Demarez, J.; Kovacs, P.; Martin, J.C.; Addison, J.; Bolton, R.E.; Bruch, J.; Davis, J.M.G.; et al. Compared in Vitro and in Vivo Toxicity of Coalmine Dusts. Relationship with Mineralogical Composition. Ann. Occup. Hyg. 1988, 32, 611–620. [Google Scholar] [CrossRef]
  18. Zosky, G.R.; Bennett, E.J.; Pavez, M.; Beamish, B.B. No Association between Pyrite Content and Lung Cell Responses to Coal Particles. Sci. Rep. 2021, 11, 8193. [Google Scholar] [CrossRef]
  19. Sun, Y.; Kinsela, A.S.; Waite, T.D. Elucidation of Alveolar Macrophage Cell Response to Coal Dusts: Role of Ferroptosis in Pathogenesis of Coal Workers’ Pneumoconiosis. Sci. Total Environ. 2022, 823, 153727. [Google Scholar] [CrossRef]
  20. Huertas, J.I.; Huertas, M.E.; Solis-Casados, D.A. Characterization of Airborne Particles in an Open Pit Mining Region. Sci. Total Environ. 2012, 423, 39–46. [Google Scholar] [CrossRef]
  21. Trechera, P.; Moreno, T.; Córdoba, P.; Moreno, N.; Zhuang, X.; Li, B.; Li, J.; Shangguan, Y.; Kandler, K.; Dominguez, A.O.; et al. Mineralogy, Geochemistry and Toxicity of Size-Segregated Respirable Deposited Dust in Underground Coal Mines. J. Hazard. Mater. 2020, 399, 122935. [Google Scholar] [CrossRef]
  22. Ram, S.S.; Majumdar, S.; Chaudhuri, P.; Chanda, S.; Santra, S.C.; Maiti, P.K.; Sudarshan, M.; Chakraborty, A. SEMEDS: An Important Tool for Air Pollution Bio-Monitoring. Micron 2012, 43, 490–493. [Google Scholar] [CrossRef]
  23. Liu, T.; Liu, S. The Impacts of Coal Dust on Miners’ Health: A Review. Environ. Res. 2020, 190, 109849. [Google Scholar] [CrossRef] [PubMed]
  24. Sellaro, R.; Sarver, E.; Baxter, D. A Standard Characterization Methodology for Respirable Coal Mine Dust Using SEM-EDX. Resources 2015, 4, 939–957. [Google Scholar] [CrossRef]
  25. Johann-Essex, V.; Keles, C.; Sarver, E. A Computer-Controlled SEM-EDX Routine for Characterizing Respirable Coal Mine Dust. Minerals. 2017, 7, 15. [Google Scholar] [CrossRef] [Green Version]
  26. Bharti, S.K.; Kumar, D.; Anand, S.; Poonam; Barman, S.C.; Kumar, N. Characterization and Morphological Analysis of Individual Aerosol of PM10 in Urban Area of Lucknow, India. Micron 2017, 103, 90–98. [Google Scholar] [CrossRef] [PubMed]
  27. Petruk, W. Applied Mineralogy in the Mining Industry. In Applied Mineralogy in the Mining Industry; Elsevier: Amsterdam, The Netherlands, 2000; pp. 198–199. [Google Scholar]
  28. Petruk, W.; Skinner, H.C.W. Characterizing Particles in Airborne Dust by Image Analysis. Rev. Extr. Process. 1997, 49, 58–61. [Google Scholar] [CrossRef]
  29. LaBranche, N.; Keles, C.; Sarver, E.; Johnstone, K.; Cliff, D. Characterization of Particulates from Australian Underground Coal Mines. Minerals 2021, 11, 447. [Google Scholar] [CrossRef]
  30. LaBranche, N.; Teale, K.; Wightman, E.; Johnstone, K.; Cliff, D. Characterization Analysis of Airborne Particulates from Australian Underground Coal Mines Using the Mineral Liberation Analyser. Minerals 2022, 12, 796. [Google Scholar] [CrossRef]
  31. Elmes, M.; Delbem, I.; Gasparon, M.; Ciminelli, V. Single-Particle Analysis of Atmospheric Particulate Matter Using Automated Mineralogy: The Potential for Monitoring Mine-Derived Emissions. Int. J. Environ. Sci. Technol. 2020, 17, 2743–2754. [Google Scholar] [CrossRef]
  32. French, D.; Ward, C.; Butcher, A.R. QEMSCAN for Characterisation of Coal and Coal Utilisation By-Products, Cooperative Research Centre for Coal in Sustainable Development. Aust. Res. Rep. 2008, 93, 20088. [Google Scholar]
  33. French, D.; Ward, C.R. The Application of Advanced Mineralogical Techniques to Coal Combustion Product Characterisation. In Proceedings of the 2009 World of Coal Ash Conference, Lexington, Kentucky, 5 May 2009. [Google Scholar]
  34. Pirrie, D.; Rollinson, G.K. Unlocking the Applications of Automated Mineral Analysis. Geol. Today 2011, 27, 226–235. [Google Scholar] [CrossRef]
  35. Schulz, B.; Sandmann, D.; Gilbricht, S. Sem-Based Automated Mineralogy and Its Application in Geo-and Material Sciences. Minerals 2020, 10, 1004. [Google Scholar] [CrossRef]
  36. Vickery, K.; Eckardt, F. A Closer Look at Mineral Aerosol Emissions from the Makgadikgadi Pans, Botswana, Using Automated SEM-EDS (QEMSCAN®). S. Afr. Geogr. J. 2021, 103, 7–21. [Google Scholar] [CrossRef]
  37. Little, L.; Becker, M.; Wiese, J.; Mainza, A.N. Auto-SEM Particle Shape Characterisation: Investigating Fine Grinding of UG2 Ore. Miner. Eng. 2015, 82, 92–100. [Google Scholar] [CrossRef]
  38. Williamson, B.J.; Rollinson, G.; Pirrie, D. Automated Mineralogical Analysis of PM10: New Parameters for Assessing PM Toxicity. Environ. Sci. Technol. 2013, 47, 5570–5577. [Google Scholar] [CrossRef]
  39. Schoonen, M.A.; Roemer, E.J.; Simon, S. Mineral-Induced Formation of Reactive Oxygen Species Chemistry of Surfaces and Nanoparticles View Project. Rev. Mineral. Geochem. 2006, 64, 179–222. [Google Scholar] [CrossRef]
  40. Bair, W. The ICRP Human Respiratory Tract Model for Radiological Protection. Radiat. Prot. Dosim. 2000, 60, 307–310. [Google Scholar] [CrossRef]
  41. Maynard, A.D.; Kuempel, E.D. Airborne Nanostructured Particles and Occupational Health. J. Nanoparticle Res. 2005, 7, 587–614. [Google Scholar] [CrossRef]
  42. Fubini, B.; Otero Areán, C. Chemical Aspects of the Toxicity of Inhaled Mineral Dusts. Chem. Soc. Rev. 1999, 28, 373–381. [Google Scholar] [CrossRef]
  43. Plumlee, G.; Morman, S.; Ziegler, T. The Toxicological Geochemistry of Earth Materials: An Overview of Processes and the Interdisciplinary Methods Used to Understand Them. Rev. Mineral. Geochem. 2006, 64, 5–57. [Google Scholar] [CrossRef] [Green Version]
  44. Ruby, M.V.; Schoof, R.; Brattin, W.; Goldade, M.; Post, G.; Harnois, M.; Mosby, E.; Casteel, S.W.; Berti, W.; Carpenter, M.; et al. Advances in Evaluating the Oral Bioavailability of Inorganics in Soil for Use in Human Health Risk Assessment. Environ. Sci. Technol. 1999, 33, 3697–3705. [Google Scholar] [CrossRef]
  45. Plumlee, G.S.; Ziegler, T.L. The Medical Geochemistry of Dusts, Soils, and Other Earth Materials, 9th ed.; Elsevier: Amsterdam, The Netherlands, 2003. [Google Scholar]
  46. Li, M.; Wilkinson, D.; Patchigolla, K. Comparison of Particle Size Distributions Measured Using Different Techniques. Part. Sci. Technol. 2005, 23, 265–284. [Google Scholar] [CrossRef]
  47. Johann-Essex, V.; Keles, C.; Rezaee, M.; Scaggs-Witte, M.; Sarver, E. Respirable Coal Mine Dust Characteristics in Samples Collected in Central and Northern Appalachia. Int. J. Coal Geol. 2017, 182, 85–93. [Google Scholar] [CrossRef]
  48. Little, L. The Development and Demonstration of a Practical Methodology for Fine Particle Shape Characterisation in Minerals Processing; University of Cape Town: Cape Town, South Africa, 2016. [Google Scholar]
  49. Barbery, G. Liberation 1, 2, 3: Theoretical Analysis of the Effect of Space Dimension on Mineral Liberation by Size Reduction. Miner. Eng. 1992, 5, 123–141. [Google Scholar] [CrossRef]
  50. Fandrich, R.; Gu, Y.; Burrows, D.; Moeller, K. Modern SEM-Based Mineral Liberation Analysis. Int. J. Miner. Process. 2007, 84, 310–320. [Google Scholar] [CrossRef]
  51. Humphreys, F.J.; Brough, I. High Resolution Electron Backscatter Diffraction with a Field Emission Gun Scanning Electron Microscope. J. Microsc. 1999, 195, 6–9. [Google Scholar]
  52. Gatti, E.; Rehak, P.; Walton, J.T. Silicon Drift Chambers-First Results and Optimum Processing of Signals. Nucl. Inst. Methods Phys. Res. A 1984, 226, 129–141. [Google Scholar] [CrossRef]
  53. Straszheim, W.E.; Younkin, K.A.; Greer, R.T.; Markuszewski, R.; Younkinl, K.A. Mounting Materials for Automated Image Analysis of Coals Using Backscattered Electron Imaging. Scanning Microsc. Int. 1988, 2, 1257–1264. [Google Scholar]
  54. Haberlah, D.; Owen, M.; Botha, P.W.S.K.; Gottlieb, P. SEM-EDS-based protocol of subsurface drilling mineral identification and petrological classification. In Proceedings of the 10th International Congress for Applied Mineralogy (ICAM), Trondheim, Norway, 20 March 2012; pp. 265–266. [Google Scholar]
  55. Ward, C.R. Analysis, Origin and Significance of Mineral Matter in Coal: An Updated Review. Int. J. Coal Geol. 2016, 165, 1–27. [Google Scholar] [CrossRef]
  56. Scrivener, K.L.; Füllmann, T.; Gallucci, E.; Walenta, G.; Bermejo, E. Quantitative Study of Portland Cement Hydration by X-Ray Diffraction/Rietveld Analysis and Independent Methods. Cem. Concr. Res. 2004, 34, 1541–1547. [Google Scholar] [CrossRef]
  57. Ward, C.R.; Spears, D.A.; Booth, C.A.; Staton, I.; Gurba, L.W. Mineral Matter and Trace Elements in Coals of the Gunnedah Basin, New South Wales, Australia. Int. J. Coal Geol. 1999, 40, 281–308. [Google Scholar] [CrossRef]
  58. Barthelmy, D. Webmineral-Mineralogy Database. Available online: https://www.webmineral.com (accessed on 20 March 2019).
  59. Kaya, E.; Hogg, R.; Mutmansky, J.M. Evaluation of Procedures for Production of Dust Samples for Biomedical Research. Appl. Occup. Environ. Hyg. 1996, 11, 745–750. [Google Scholar] [CrossRef]
  60. León-Mejía, G.; Silva, L.F.O.; Civeira, M.S.; Oliveira, M.L.S.; Machado, M.; Villela, I.V.; Hartmann, A.; Premoli, S.; Corrêa, D.S.; Da Silva, J.; et al. Cytotoxicity and Genotoxicity Induced by Coal and Coal Fly Ash Particles Samples in V79 Cells. Environ. Sci. Pollut. Res. 2016, 23, 24019–24031. [Google Scholar] [CrossRef] [PubMed]
  61. Dalal, N.; Suryan, M.; Vallyathan, V.; Green, F.; Jafari, B.; Wheeler, R. Detection of Reactive Free Radicals In Fresh Coal Mine Dust and Their Implication for Pulmonary Injury. Ann. Occup. Hyg. 1989, 33, 79–84. [Google Scholar] [CrossRef]
  62. Van der Plas, L.; Tobi, A.C. A Chat for Judging the Reliability of Point Counting Results. Am. J. Sci. 1965, 263, 87–90. [Google Scholar] [CrossRef]
  63. Semsari, P.P.; Parian, M.; Rosenkranz, J. Breakage Process of Mineral Processing Comminution Machines—An Approach to Liberation. Adv. Powder Technol. 2020, 31, 3669–3685. [Google Scholar] [CrossRef]
  64. Little, L.; Mainza, A.N.; Becker, M.; Wiese, J.G. Using Mineralogical and Particle Shape Analysis to Investigate Enhanced Mineral Liberation through Phase Boundary Fracture. Powder Technol. 2016, 301, 794–804. [Google Scholar] [CrossRef]
  65. Leigh, G.M.; Sutherland, D.N.; Gottlieb, P. Confidence Limits for Liberation Measurements. Miner. Eng. 1993, 6, 155–161. [Google Scholar] [CrossRef]
  66. Blannin, R.; Frenzel, M.; Tuşa, L.; Birtel, S.; Ivăşcanu, P.; Baker, T.; Gutzmer, J. Uncertainties in Quantitative Mineralogical Studies Using Scanning Electron Microscope-Based Image Analysis. Miner. Eng. 2021, 167, 106836. [Google Scholar] [CrossRef]
  67. Little, L.; Becker, M.; Wiese, J.; Yorath, G.; Mainza, A.; Tonzetic, I. Shape Characterisation: Can Different Devices Produce Comparable Data for Particulate Samples? In Proceedings of the XXVIII the International Mineral Processing Congress, Quebec City, QC, Canada, 11 September 2016. [Google Scholar]
  68. Rasheed, M.A.; Rao, P.L.S.; Boruah, A.; Hasan, S.Z.; Patel, A.; Velani, V.; Patel, K. Geochemical Characterization of Coals Using Proximate and Ultimate Analysis of Tadkeshwar Coals, Gujarat. Geosciences 2015, 5, 113–119. [Google Scholar] [CrossRef]
  69. Deer, W.A.; Howie, R.A.; Zussman, J. An Introduction to the Rock Forming Minerals, 2nd ed.; Pearson Parentice Hall: Hoboken, NJ, USA, 1992; ISBN 0-582-30094-0. [Google Scholar]
Figure 1. Generalised workflow describing the key elements required for the analysis of the physicochemical and mineralogical characterisation of dust-sized particles using auto-SEM-EDS systems.
Resources 11 00114 g001
Figure 2. Annotated example of prepared sample blocks containing 25 mm diameter carnauba wax remounted in 30 mm diameter resin.
Resources 11 00114 g002
Figure 3. Visualisation of the simulated field and scan settings. (a) represents a view of the simulated block and the fields defined across the block, (b) displays a scaled image of the field sizes relative to a simulation of the expected particle sizes within a field, and (c) shows a representation of the point spacing across a given particle where each grid block shows a point where the X-ray spectra will be analysed.
Resources 11 00114 g003
Figure 4. Images of the coal standards prepared to calibrate the initial SIP list. (a) represents the false colour mineral map of the drill core, below is the corresponding Back Scattered Electron (BSE) image to assess how the features were captured (b). (c) represents the false colour mineral map of the coarse particle standard, which was used to distinguish and assess the carbonaceous matter from the wax and the clays from the quartz, accompanied by the BSE image below (d). Note the greyscale contrast for both BSE images was changed to aid visual interpretability.
Resources 11 00114 g004
Figure 5. Frequency distribution of the BSE ranges for carbonaceous matter (CM) and wax. (a) shows the BSE ranges for pixels defined as carbonaceous matter in the drill core standard. (b) shows the BSE ranges for pixels defined as carbonaceous matter in the coarse particle standard.
Resources 11 00114 g005
Figure 6. Mineral distribution across all the samples investigated. Reported errors show the 95% confidence in the reported abundance using methods in [62].
Resources 11 00114 g006
Figure 7. Parity charts for the main minerals and carbonaceous matter between the QEMSCAN and XRD analyses. (ad) show the parity for carbonaceous matter, clays, quartz, and pyrite, respectively, where the parity for both measurement 1 (M1) and measurement 2 (M2) have been contrasted.
Resources 11 00114 g007
Figure 8. Parity charts for the calculated assay of the major and minor elements derived from the QEMSCAN and an independently measured chemical assay performed by XRF. (a) shows elements within the range 0–25 wt.% and (b) shows elements in the range 0–2 wt.%.
Resources 11 00114 g008
Figure 9. Particle size distribution for the samples analysed. (ad) show the variability in the distribution of particle size between replicate scans/blocks. For each sample, the mean size was described based on the midpoint of the size classes <5 to <25.
Resources 11 00114 g009
Figure 10. Representation of the composition of particles reporting to the different size classes.
Resources 11 00114 g010
Figure 11. Assessment of the liberation for clay containing particles across the sample analysed using the cumulative liberation yield, where the uncertainty is expressed as the 95% confidence limits. For reference, the number of particles containing clays is represented per sample as “n”.
Resources 11 00114 g011
Figure 12. Assessment of the liberation for quartz-containing particles across the sample analysed using the cumulative liberation yield, where the uncertainty is expressed as the 95% confidence limits. For reference, the number of particles containing quartz is represented per sample as “n”. (a,b) contrast the impact of high and low particle numbers on uncertainty, respectively.
Resources 11 00114 g012
Figure 13. Assessment of the liberation for pyrite-containing particles across the sample analysed using the cumulative liberation yield, where the uncertainty is expressed as the 95% confidence limits. For reference, the number of particles containing pyrite is represented per sample as “n”.
Resources 11 00114 g013
Figure 14. Representation of the particle liberation and association grouped by clays, pyrite, and quartz-containing particles. The liberated fraction described grains of either clays, quartz, or pyrite, whereas the associations depict the proportion of boundary minerals/carbonaceous matter associated with unliberated grains in each mineral group.
Resources 11 00114 g014
Table 1. List of the particle characteristics considered in the study and their relevance to various biological factors related to toxicity and inflammation in the lung.
Characteristics
Investigated
Relevance to Respiratory Toxicity and InflammationReferences
Mineral and
element distributions
Minerals serve as hosts for reactive elements as well as providing surface reactive sites potentially producing harmful bio-reactive compounds. Elements can also be leached into the lung fluids where they can biogeochemically react depending on their form[12,13,39]
General particle characteristics
Particle sizeDetermines the probability of where the particle may be deposited and potentially phagocytosed (digestion of foreign material by defence cells called macrophages)[40,41]
Particle roughness and
shape
Surface texture and particle shape have been found to impact phagocytosis irrespective of the size and volume of the particles[42,43]
Mineral specific characteristics
Liberation and associationPhases which are encapsulated and/or associated with non-reactive phases will be rendered inert, thus the degree to which a phase is liberated will impact its potential bio-reactivity[44,45]
Table 2. Description of the formula and visual depiction for both aspect ratio and roundness.
DescriptorDescriptionFormulaVisual Description
RoundnessThe ratio of the surface area of an object over the area of a circle with a diameter equal to the maximum diameter of the object. Scaled to values between 0 and 1 4 × n   p i x e l s π × L o n g   a x i s 2 Resources 11 00114 i001
Aspect ratio (inverse)The ratio of an object’s length over width. The inverse of such can be taken to scale the values between 0 and 1 S h o r t   a x i s L o n g   a x i s Resources 11 00114 i002
Table 3. Shape categories as defined in [37]. Each category represents a zone in the matrix of aspect ratio and roundness values. Selected false colour images illustrate the different categories.
Shape CategoryRoundElongate and SmoothEquantAngularElongate and Angular
Resources 11 00114 i003Resources 11 00114 i004Resources 11 00114 i005Resources 11 00114 i006Resources 11 00114 i007
Aspect ratio0.5–10–0.50.5–10.5–10–0.5
Roundness0.75–10.4–0.750.4–0.750–0.40–0.4
Table 4. Description of the liberation classes defined for this study.
Liberation ClassesPercentage Area Range of Target PhaseExample of False Colour Particles
(MOI-Quartz)
Liberated% Area MOI ≤ 100 and% Area MOI ≥ 70Resources 11 00114 i008
Moderately liberated% Area MOI < 70 and% Area MOI ≥ 40Resources 11 00114 i009
Mostly encapsulated% Area MOI < 40 and% Area MOI ≥ 10Resources 11 00114 i010
Fully encapsulated% Area MOI < 10 and% Area MOI ≥ 0Resources 11 00114 i011
MOI-mineral of interest, Quartz-pink, Clays-green, Carbonaceous matter-black.
Table 5. Description of samples presented in the study, their replicate type and the D50 representing the median particle size determined from the Malvern Mastersizer 2000.
Sample NameReplicate TypeDescriptionD50
(µm)
Br-DisSingle block with duplicate scansBrazilian coal discard7.70
SA-UF2Repeat block was made, blocks represent two separate sampling batches of the parental coalSouth African ultrafine thickener underflow9.53
Br-PyCSingle block with duplicate scansBrazilian coal pyrite concentrate (waste product)10.42
Mz-ROM1 *,Repeat block was made, blocks represent a single batch of the parental coal sub-samples into two splitsMozambican coal run of mine-
Mz-ROM2 *, Mozambican coal run of mine-
* Coals Mz-ROM1 and Mz-ROM2 are from the same sampling batch but are different split samples; Coals that displayed hydrophobic properties, no reading size could be collected.
Table 6. Representation of the percentage distribution of Si, Fe and Ca between the various minerals calculated from the QEMSCAN dataset; errors reported are based on the deviation between measurement 1 and 2). The presence of the unmarked minerals was positively confirmed with XRD, while the remaining minerals classified by the QEMSCAN would have been present below the detection limit of XRD based on the abundance of each element.
Mean Element Distribution: Si (% in total)
MineralsBr-DisSA-UF2BR-PyCMz-ROM1&2
Clays61.91 (±0.32)62.43 (±0.51)18.11 (±0.11)4.13 (±0.00)
Quartz38.09 (±0.32)37.57 (±0.51)81.87 (±0.11)1.53 (±0.00)
Mean Element Distribution: Fe (% in total)
Ankerite0.02---
Chalcopyrite *,0.031.27 (±0.03)<0.01-
Goethite *,0.27 (±0.01)0.36 (±0.01)<0.01 *-
Hematite 0.49 (±0.01)8.89 (±0.22)0.06 (±0.01)-
Jarosite0.19-0.03-
Pyrite89.18 (±0.22)40.15 (±0.17)79.24 (±0.37)74.93 (±0.00)
Rhomboclase5.52 (±0.13)2.00 (±0.04)15.75 (±0.19)3.87 (±0.00)
Siderite 3.19 (±0.00)46.14 (±0.02)0.09 (±0.00)18.85 (±0.00)
Sphalerite *,0.03 (±0.00)0.30<0.01-
Szomolnokite2.301.05 (±0.02)4.83 (±0.18)2.31 (±0.00)
Mean Element Distribution: Ca (% in total)
Ankerite 0.26---
Apatite 6.33 (±0.02)0.36-0.48
Calcite85.57 (±0.00)50.44 (±0.03)35.85 (±0.17)87.91 (±0.00)
Dolomite-0.36 (±0.00)0.174.50 (±0.00)
Gypsum7.97 (±0.01)49.02 (±0.03)64.06 (±0.17)7.12 (±0.00)
* Trace abundance < 0.01%; Not confirmed by XRD but below detection limit.
Table 7. Percentage of particles reporting to each shape class defined as a proportion of the total population (errors reported are based on the deviation between replicates).
Particle Population: Distributed by Mean% Abundance Reporting to Shape Classes
Particle ClassesBr-DisSA-UF2Br-PyCMz-ROM1&2
% Round0.03 (±0.01)0.72 (±0.30)0.18 (±0.05)0.42 (±0.01)
% Equant47.26 (±5.08)70.50 (±4.57)65.84 (±5.44)71.74 (±0.77)
% Elongate and smooth0.02 (±0.00)0.11 (±0.04)0.04 (±0.00)0.13 (±0.00)
% Elongate and angular8.27 (±1.37)8.92 (±1.55)5.06 (±1.83)7.72 (±1.34)
% Angular44.43 (±3.70)19.78 (±2.76)28.91 (±3.73)19.97 (±0.58)
Total% abundance100 (±0.00)100 (±0.00)100 (±0.00)100 (±0.00)
Table 8. Percentage of particles reporting in each roughness class defined as a proportion of the total population (errors reported are based on the deviation between replicates).
Particle Population: Distributed by Mean% Abundance of Reporting to Particle Roughness Classes
Roughness ClassesBr-DisSA-UF2Br-PyCMz-ROM1&2
% Jagged83.03 (±5.06)51.96 (±10.87)78.46 (±2.43)54.92 (±1.40)
% Intermediate12.94 (±3.09)29.59 (±2.70)15.97 (±2.61)29.75 (±0.61)
% Smooth4.04 (±1.97)18.45 (±8.16)5.58 (±0.18)15.33 (±2.01)
Total% abundance100 (±0.00)100 (±0.00)100 (±0.00)100 (±0.00)
Publisher’s Note: MDPI stays neutral with regard to jurisdictional claims in published maps and institutional affiliations.