Article

Economic Indicators in Water and Wastewater Sector Contributing to a Circular Economy (CE)

1
Mineral and Energy Economy Research Institute, Polish Academy of Sciences, Wybickiego 7A Str., 31-261 Cracow, Poland
2
ERBEKA Foundation, Kazimierza Morawskiego 5/222C Str., 30-102 Cracow, Poland
*
Author to whom correspondence should be addressed.
Resources 2021, 10(12), 129; https://doi.org/10.3390/resources10120129
Submission received: 2 November 2021 / Revised: 6 December 2021 / Accepted: 13 December 2021 / Published: 16 December 2021

Abstract

:
Protection and sustainable management of water was indicated as one of the strategic tasks in the process of transformation towards a circular economy (CE) in the European Union (EU), therefore, the water and wastewater sector plays an important role in this process. At the same time, the European Commission (EC) strongly underlined the importance of the possibility to assess the transformation process toward the CE, and developed a set of CE indicators that are available on the Eurostat website. However, these indicators have limited ability to assess the transformation progress in the water and wastewater sector. This paper presents a set of indicators for assessing the economic progress of transformation towards the CE in this sector. The proposed economic CE indicators were grouped into the following actions of the CE model in the water and wastewater sector: reduction, reclamation (removal), reuse, recycling, recovery and landfilling. The selection of specific indicators was based on a systematic review of the literature presenting economic indicators developed by international organisations and researchers (covering different thematic areas, scopes and potential applications). The selected economic CE indicators were assigned to three groups of the cash flow: income (revenues, expenses), costs, and investment financing. The proposed CE indicators can be used by water supply and sewage companies (i.e., supplying water to the public and wastewater treatment plants, and companies that use water in their production processes) to assess the level of the transformation toward the CE at a microeconomic level. An important aspect of future application and usage of the proposed set of CE economic indicators is the collection and processing of data needed for their reporting. The proposed set of CE economic indicators refers to information that are reported by the companies to prove its revenues, costs and investment outlays, and are collected by companies anyway. The proposed set of economic CE indicators is flexible, allowing the adaptation of indicators and areas of interest to maintain effectiveness throughout the transition period from linear to the CE model.

1. Introduction

A circular economy (CE) is defined as a regenerative system [1] where the value of materials, products and resources is maintained as long as possible in the economy and the production of waste is minimized [2]. The CE enables more efficient use of available resources, but also promotes a more sustainable management of waste. The integrated initiatives along the entire life cycle of raw materials [3], from extraction to the circular final processing are more and more often and successfully introduced in various industries [4]. It has to be underlined that the CE refers not only to raw materials ( such as animal, vegetable or mineral), but also to water [5], which is an irreplaceable resource with life-giving property for nature, people and the economy [6].
Water resources are currently under unprecedented pressure in most countries [7]. The problem of water stress (reaching the level above 70%) occurs mainly in the regions of the world such as Northern Africa, Middle East, Western, Central and Southern Asia [8]. However, this problem also affects the European Union (EU), as the water scarcity was estimated to have affected at least 17% of the EU territory and at least 11% of the European population [9]. Moreover, next to water scarcity, an important issue in water management in Europe is water pollution, from industry and agriculture. To minimize the effects of anthropogenic use of water, both in agriculture and in industry, the European Commission (EC) announced further initiatives focused on water management in the second CE Action Plan [10]. This new Action Plan is one of the main blocks of the European Green Deal (EGD)-new agenda for sustainable growth of the EU. The main goal of the EGD is to achieve climate neutrality in Europe by 2050 [11] by turning climate and environmental challenges into new opportunities across all policy areas, and ensuring that the transition is fair and inclusive. In the coming years, the EC plans to facilitate water reuse and efficiency in both industrial processes and agriculture [10].
The protection and sustainable management of water and water-based waste (as wastewater, sewage sludge or sewage sludge ash) are indicated as one of the strategic tasks in the transformation process towards CE [12]. In the White Paper “Water and the Circular Economy” [13], common characteristics, ideas and approaches between the CE initiatives being implemented by organizations and Water System Management were identified. The three key dimensions of water use were grouped into the three themes of: (i) water as service (consumptive use, production use, process use), (ii) water as source of energy (kinetic, thermal, bio-thermal), and (iii) water as carrier (nutrients, chemicals, minerals). The main areas of the transformation of water and wastewater sector to the CE model have been also indicated by the International Water Association (IWA) [14]. The IWA also proposed three pathways to support the water utility leaders in boosting their progress towards CE: (i) water pathways (upstream investments, rainwater harvesting, water recycling for non-potable use, water reuse for agriculture/aquaculture/industry), (ii) materials pathways (resource efficiency, used water sludge and products for agriculture, bioplastics, fertilizer and other materials), and (iii) energy pathways (energy saving, energy reduction and recovery, biosolids to energy production, renewable energy). In turn, the EC assumed that in applying the CE main principles—reduce, reuse and recycle—in the water and wastewater sector will accelerate the process of transition to the CE model in the EU. However, at the moment it is not possible to determine whether the subsequent actions are bringing the intended effects, whether environmental, social or economic. This is due to the lack of a dedicated CE monitoring framework for the water and wastewater sector, which would take into account indicators and measures allowing the assessment of the level of transformation towards CE in this sector. In 2018, the EC proposed the CE monitoring framework with ten CE indicators grouped in four thematic areas: production and consumption, waste management, secondary raw materials, competitiveness and innovation [15]. However, the potential application of these indicators in water and wastewater sector is limited, and does not evaluate all sector elements. Despite the fact that the EC underlined that the monitoring such important areas as production and consumption is essential for understanding progress towards the CE, the presented data does not take into account the water usage. Moreover, apart from the environmental benefits (resulting from the protection of water resources) and social benefits (securing drinking water supplies), the economic benefits of taking measures to implement CE in the water and wastewater sector should be also demonstrated [16]. In this area, the EC indicated that water savings in all sectors in the EU could lead up to 5% of reduced total primary energy consumption, which bring economic benefits for individual players [4]. To encourage companies to implement CE measures, which could generate greater value and commercial opportunity [13], economic indicators that allow for the assessment of the level of transformation towards the CE in different sectors should be identified. Therefore, the objective of the current paper was to present an inventory of economic indicators that can be used for the evaluation of the progress toward CE in the water and wastewater sector. In the previous years, several indicators have been proposed to access water-related aspects in the economy; however, their goals, scope and potential application for the assessment of level of transformation toward CE in water and wastewater sector must be analyzed and evaluated from the point of view of the possibility of their monitoring at the microeconomic and macroeconomic levels.

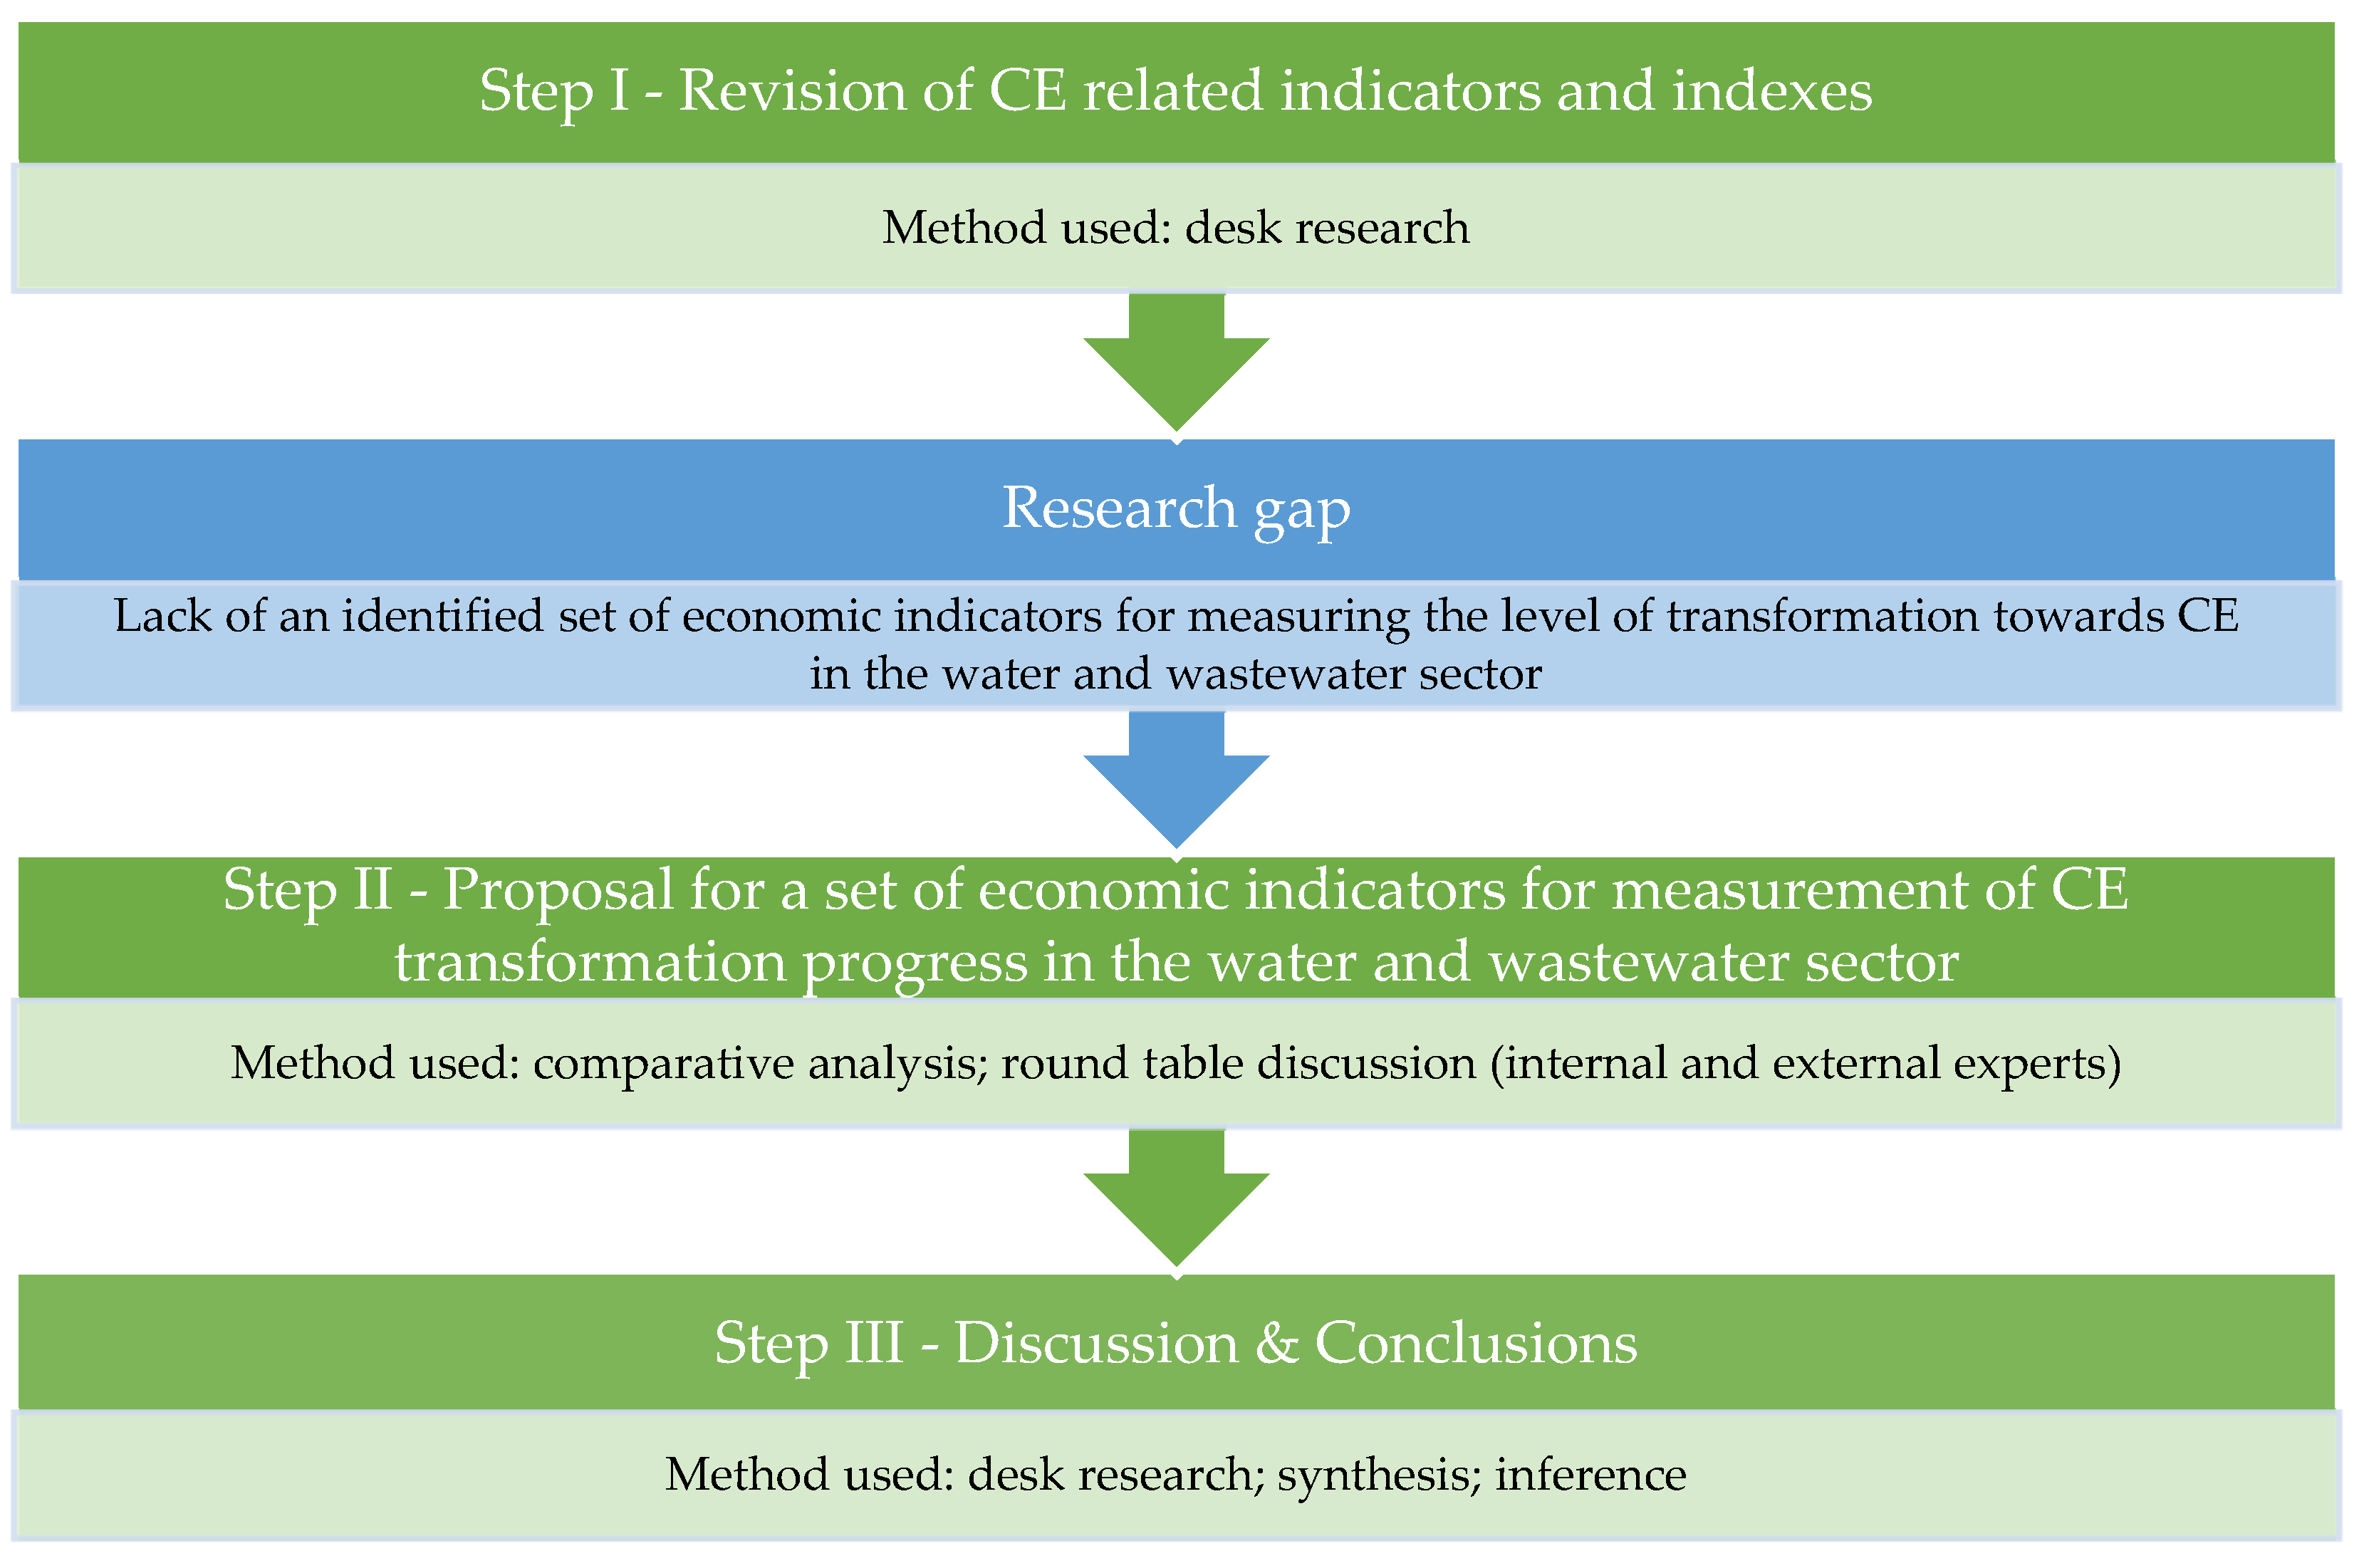
2. Materials and Methods

The current research includes three steps of collecting and processing data. The research framework is presented on Figure 1.
In the first step, a detailed analysis of the published research was conducted with the use of the desk research method. This state of the art analysis was based on the review approaches used in [17,18] to conduct searching and eligibility screening of available literature while retaining the procedural scope of analysis, and ensuring that that the review process is objective, repeatable and. The objective of this step of research was to review the indicators (economic, social, technological and environmental) from national and international organizations. The analyzed indicators regarded different aspects related to the CE and sustainability. Moreover, from the list of identified CE-related indicators, the specific indicators that can be used in the water and wastewater sector were also analyzed. The following data sources were analyzed: international and European official documents related to the water and wastewater sector and circular economy, published in EUR-Lex (eur-lex.europa.eu) and the official webpage of the EC (ec.europa.eu). The analysis also included the review of the statistical documents at the international and European levels (Organization for Economic Cooperation and Development—OECD, United Nations—UN, World Bank, European Investment Bank, Eurostat, European Environment Agency—EEA) and selected reviewed articles available in the scientific databases Elsevier Scopus, Elsevier Science Direct, Google Scholar and the Multidisciplinary Digital Publishing Institute (MDPI) database [19,20]. The selection of the articles was conducted based on the identified keywords “circular economy”, “CE”, “economic” “indicator”, “index”, “measurement”, “assessment”, “water”, and “wastewater”. The results of this step of research are presented in Section 3.1.
In the second step of the research, identified indicators, measures and indices have been analyzed and grouped according to the CE model for the water and wastewater sector, developed under the MonGOS project [14]. The objective of this step of research was to propose a set of economic indicators that could be used in water and wastewater management. At the beginning, the economic indicators were selected from the list of indicators analyzed in the first step of the research. Social and environmental indicators have been rejected as they are not the subject of the current research. Then, these indicators that are directly or indirectly related to the measurement of economic efficiency were analyzed and grouped in the following actions of the CE model in the water and wastewater sector: reduction, reclamation (removal), reuse, recycling, recovery and rethink [14]. The concept of the CE model framework in the water and wastewater sector is presented in Table 1. Finally, new economic indicators have been proposed for each action of this model. The round table discussion which included the consultation in the group of internal and external experts was used for this purpose. The research group consisted of 6 experts-three representatives of enterprises operating in the water and wastewater sector, and three specialists (scientists) dealing with economics and environmental technologies. The criterion for the selection of experts from enterprises was to have at least a master’s degree and a minimum of 10 years of experience in a managerial position in a company using water or/and dealing with wastewater treatment. In turn, the criterion for selecting scientific experts was to have a doctoral degree in the economic and environmental sciences, taking into account experience in the water and wastewater sector. The indicators were analyzed and discussed during three meetings with these experts: (1) consultation online with industry experts, (2) consultation online with scientific experts; (3) consultation online during joint meeting of the MonGOS project. The final results of this step of the research was the list of economic indicators that can be used for the evaluation of the level of the transformation toward the CE in water and wastewater sector. The results of this step of research are presented in Section 3.2.
The third step of the research includes the discussion of the possibility of the usage of the identified economic indicators at the microeconomic levels. The synthesis method, that is, formulating generalizations based on recognized partial theorems, was used to interpret the obtained results. Moreover, the desk research was used to compare obtained results from the perspective of previous studies and other authors. The findings and their implications, as well as future research directions, are discussed in Section 4.

3. Results

3.1. Inventory and Classification of CE Indicators

In recent years, several CE indicators have been developed by various organizations. The inventory of the groups of circularity indicators in the documents of international organizations is presented in Table 2. As a result, 10 documents proposing or discussing CE indicators at the macro (European and international monitoring framework) and micro (products, services and companies) levels were presented. There are also CE indicators proposed by individual authors. Therefore, to the listed documents, selected scientific papers presenting specific CE indicators were also analyzed (Table 3). In total, 742 indicators (provided by international organizations) and summary indicators and indexes (provided by other authors) were analyzed.
There are various methods of grouping the indicators into specific thematic groups, for example, according to the perspective of sustainability—economic, social and environmental indicators proposed by the Global Reporting Initiative (GRI) [21] or due to individual 17 Sustainable Development Goals (SDGs) proposed by United Nations (UN) [22]. A holistic picture of the level of transformation towards a CE in European countries is indicated by the CE monitoring framework, developed by the EC in 2018 [15]. It proposes four groups of indicators, divided according to the key areas of CE implementation in the EU, such as production and consumption, waste management, secondary raw materials and competitiveness and innovation. Other organizations group indicators according to specific industries, environmental problems, individual elements of the life cycle [23], or components of the environment [24]. Depending on the potential application, there are different goals with different scope with regard to the proposed specific indicators.
As can be seen from Table 2, there are various classifications of indicators related to the features of a circular economy, focusing on the assessment, improvement, monitoring and communication on the results of the CE [25]. However, there are no official or recognized indicators, methods or tools for measuring a company’s performance in the transition from a linear economic model to a more sustainable one, and there are no tools to support and track this transition [26]. Indeed, most of the CE indicators are in their early stages of development [27], and they cannot capture the overall performance of circular products and services [25]. However, many existing indicators can help measure performance in several areas (micro, meso, macro) that contribute directly or indirectly to the circular economy [28].
There are also interesting indicators developed by the individual authors. The summary of these indicators is presented in Table 3, taking into account the level of their measurement (micro, meso, macro). Most of these indicators can be grouped to the perspective of sustainability-economic, social and environmental. Most of the presented indicators focus on individual stages or all stages of life cycle, such as the Circularity Measurement Toolkit (CMT). They mainly measure the efficiency of materials use.
From the list of analyzed indicators, the CE-related indicators that can be used directly or indirectly for the circularity analysis in the water and wastewater management sector were selected. The conducted inventory shows that direct CE indicatos published by international organizations mainly focus on single indices for the water and wastewater sector not rotating the entire CE model. For example, the UN presented 231 indicators, including 11 water and 75 economic indicators, while the Organisation for Economic Cooperation and Development (OECD) published 153 indicators, including 17 water and 56 economic indicators.
CE-related indicators for the water and wastewater sector were published by the EC—water exploitation index, water productivity, price of water scarcit and water use (calculated as water abstraction minus returned water), the European Environment Agency (EEA)—water exploitation index, water productivity. Additionally, the World Business Council for Sustainable Development (WBCSD) presented the water circularity index (%), and the OECD presented a water productivity index. The European Investment Bank (EIB) proposed circular value recovery models: reuse/recycling of wastewater. However, despite the proposed CE indicators, there are no statistical data that would allow them to be calculated and reported. The proposed indicators refer to both the micro and macro levels of water management. However, none of the organizations proposed a set of indicators that could assess the level of the CE transformation in the water and wastewater sector.
On the other hand, the indicators published in scientific papers only take into account individual aspects of the resources (incl. water) management, as cost analysis without analysis of possible revenue for CE. The economy aspect is combined with others, e.g., social or environmental. Only the Eco-costs Value Ratio (EVR) is an indicator of the economic dimension. The authors propose to calculate all environmental effects in monetary terms based on the costs that should be incurred to reduce environmental pollution and materials depletion to “no effect level” [39]. However, the EVR does not take into account the income that a company or household may gain as a result of involvement in CE.
The revision of the available CE-related indicators shows that there is a lack of a set of economic indicators that could be used for measurement of the level of transformation towards CE in the water and wastewater sector. Therefore, the next sections provide a proposal for a set of CE -related economic indicators in mentioned sector of the economy.

3.2. CE Economic Indicators in the Water and Wastewater Sector

As part of the MonGOS project, the assumptions for the CE model in water and wastewater management was proposed and published in [14]. The assumptions for this model were developed on the basis of the “xR” models in waste management, as well as the EU waste hierarchy [42]. The CE model in water and wastewater management has been classified into groups of activities that fit into the assumptions of the CE, i.e., reduction, reclamation (removal), reuse, recycling, recovery and rethink [14]. In the current section, the economic indicators have been proposed for each action of this model. The selected economic indicators were assigned to three groups of the cash flow (income -revenues, expenses – costs, and investment financing) and to the specific actions of the of the CE model in water and wastewater sector (reclamation/removal), reuse, recycling, recovery) and landfilling. The proposed indicators are dedicated to water supply and sewage companies, i.e., supplying water to the public and wastewater treatment plants (WWTPs) and companies that use water in their production processes. The proposed CE economic indicators in the water and wastewater sector are presented in Table 4.
The first element of the model (reduce) includes revenues from less water consumption. It creates two levels of value added-lower charges for water abstraction from the water supply, but also less pressure on the environment (lower water consumption and then less amount of generated wastewater that need to be treated). Investments are related to the cost of equipment for the optimization of water usage.
In the second element of the CE model (reclamation/removal), the revenues come from the possible sale of water, the provision of wastewater collection and treatment services, to ensure the continuity of collective water supply of adequate quality and quantity, and collective wastewater disposal. The expenses are related to costs of water production and wastewater treatment services. The investments are related to equipment for water purification and wastewater treatment. In addition, there are also costs of water intake and abstraction, operation, maintenance and expansion of the water supply and sewage.
In the next level of the CE model (reuse), the revenues come from sales of non-drinking water, lower wastewater treatment services fees and reduced water abstraction from the waterworks. The expenses include the costs of non-drinking water production (costs of non-consumer water recovery). There are also costs of electricity production, water consumption, external services and employee remuneration, as well as investments in equipment for the wastewater treatment and water recovery. The economic added value of implementation of water reuse activities are lower annual water bills, an increase in additional business entities benefiting from improved wastewater treatment, and less waste landfilled. Analogous economic indicators are proposed for the next element of the CE model (recycling). However, in this case, due to the need for additional water purification (for human consumption), more energy and material costs will be incurred. On the other hand, higher revenues from sales of drinking water are expected.
In the next element of the CE model (recovery), the revenues are related not only to lower wastewater treatment services fees, but also the ability to sell electricity, fertilizers and other materials. Here, the expenses include costs of electricity, fertilizers and materials production, while investment are related to equipment needed for recovery of those resources.
It should be noted that the implementation of technological and organizational solutions in each of element of the presented CE levels can reduce the amount of landfilled waste and thus bring an economic benefit. In addition, emissions and environmental charges for landfilling are reduced. The proposed economic CE indicators selected can allow companies to identify both positive and negative trends in their activities. The measurement of these indicators can provide information about which actions are effective or created negative effects or regression at the CE economic level. The implementation of CE-related solutions is expected to increase in coming years, due to the tightening legal regulations on water and water-based waste, and EC recommendations for the transformation toward the CE model.
An important aspect of the future application of proposed indicators is the collection and processing of data needed for the reporting of these indicators. The proposed CE economic indicators are related to the information that is reported by the companies to demonstrate their revenues, costs and investment outlays. Therefore, the collecting of this economic data should not face significant barriers in the individual units.

4. Discussion

The transformation process towards the CE requires more rational use of resources and waste management practices in all sectors of the economy [43]. This also applies to the water and wastewater sector and its key elements, i.e., water, sewage, sewage sludge, other waste, and by-products arising from water purification and wastewater treatment [14]. In practice, the implementation of the CE assumptions in various sectors of the economy is often supported by the use of various methods of rational management of raw materials, products and resources, as well as sustainable waste management [44].
The process of transformation towards the circular economy in the water and wastewater sector [45] requires the involvement of all stakeholder groups, both experts working for innovative and pro-ecological solutions, and the society, which should reduce water waste in households. In addition, the implementation of circular economy principles in water and wastewater management is important for enterprises dependent on water (e.g., the cosmetics industry) and wastewater treatment plants, because their environmentally conscious decisions regarding the implementation of sustainable and circular solutions in the management of water and wastewater may accelerate the transformation process towards the CE. in the given country.
In the recent years, some significant progress has been made in the area of the assessment of circularity of products [46,47,48], companies [34,49,50], and regions [51,52]. The CE indicators are created to assess the progress of transformation towards CE at the micro, meso and macro levels. They are an important element of new business models for CE, which are systematically improved and introduced into the activities of enterprises, including those operating in the water and wastewater sector. The EC clearly indicates that the transition to the CE model brings economic benefits for those involved in the transformation process [10]. In order to assess the economic benefits of implementing CE solutions, specific financial data on the operation of the company and introduced changes must be reported. Therefore, the indicators developed in this research can be used by the enterprises to assess the level of transformation towards CE in the water and wastewater sector. The proposed indicators refer to the CE model for the sector developed in the MonGOS project [14], thus providing a broader perspective of the sector. In addition, they require reporting of information that is collected by the enterprise anyway, therefore its collection and processing should not pose a significant challenge to individual entities.
The added value of the presented economic indicators is the possibility of their application in various enterprises operating in the wastewater sector, i.e., supplying water to the public, WWTPs, and other companies (public and private) that use water in their production processes and create an innovations for the water and wastewater sector (e.g., Schwander [45], Veolia [53] or Outotec [54]). The proposed economic indicators could measure the CE-related activities in water and wastewater management, as minimization of water consumption, water and wastewater treatment, water reuse (for non-consumption purposes), water recycling (for consumption purposes) and the recovery of water, energy and raw materials produced in the water and wastewater treatment processes. The implementation of those activities may bring significant environmental benefits, resulting from the reduction of water consumption and the reduction of the impact of wastewater discharge on the quality of the aquatic environment. In the following years, further technological progress and new investments should be expected to reduce the consumption of water, raw materials and energy, in line with the CE model. Therefore, the proposed economic indicators can be widely applied in the sector and can complement new business models for CE.
Moreover, the usage of the proposed set of economic indicators at multiple levels would facilitate policy development, measuring economic performance, sector benchmarking, and improving business investment decisions. Such a framework should provide meaningful answers to decision-makers questions covering all relevant dimensions of the CE transition: resource consumption and material flows, economic parameters, financial flows and policy effectiveness. The presented set of economic indicators is flexible, allowing the adaptation of indicators and areas of interest to maintain effectiveness throughout the transition period. Further work on testing the developed indicators in the individual companies is undertaken as part of the MonGOS project.

5. Conclusions

Water and wastewater management is an important part of the CE model. The circular management of resources (as water, nutrients, energy) could generate financial benefits for companies operating in the water and wastewater sector. The financial benefits could be related to lower water consumption, the sale of drinking water, electricity, fertilizers, and lower fees for wastewater treatment services and taxes for waste landfilling. However, there are also unavoidable costs of the CE-related activities as investment outlays in new infrastructure. In the long run, there should be a reduction in average total costs that could bring further economic benefits.
The implementation of the CE solutions requires estimating the costs of such activities, both in terms of possible expenses and revenues. Therefore, the proposed set of economic CE indicators can be used by the companies not only to assess the transformation level but also to plan the future CE-related investments.

Author Contributions

Conceptualization, M.S. and R.K.; methodology, M.S.; investigation, M.S. and R.K.; resources, M.S. and R.K.; data curation, M.S. and R.K.; writing—original draft preparation, M.S. and R.K.; writing—review and editing, M.S. and R.K.; visualization, M.S. and R.K. All authors have read and agreed to the published version of the manuscript.

Funding

This work was funded by the Polish National Agency for Academic Exchange (NAWA) as the part of the project “Monitoring of water and sewage management in the context of the implementation of the circular economy assumptions” (MonGOS, mon-gos.eu).
Resources 10 00129 i001

Institutional Review Board Statement

Not applicable.

Informed Consent Statement

Not applicable.

Data Availability Statement

The datasets generated during and/or analysed during the current study are available from the corresponding author on reasonable request.

Conflicts of Interest

The authors declare no conflict of interest. The funders had no role in the design of the study; in the collection, analyses, or interpretation of data; in the writing of the manuscript, or in the decision to publish the results.

References

  1. European Commission. Communication from the Commission—Towards a Circular Economy: A Zero Waste Programme for Europe; COM 398; European Commission: Brussels, Belgium, 2014. [Google Scholar]
  2. European Commission. Communication from the Commission. Closing the Loop—An EU Action Plan for the Circular Economy; COM 614; European Commission: Brussels, Belgium, 2015. [Google Scholar]
  3. Rosenau-Tornow, D.; Buchholz, P.; Riemann, A.; Wagner, M. Assessing the long-term supply risks for mineral raw materials-a combined evaluation of past and future trends. Resour. Policy 2009, 34, 161–175. [Google Scholar] [CrossRef]
  4. Voulvoulis, N. Water reuse from a circular economy perspective and potential risks from an unregulated approach. Curr. Opin. Environ. Sci. Health 2018, 2, 32–45. [Google Scholar] [CrossRef]
  5. Jia, X.; Klemeš, J.J.; Alwi, S.R.W.; Varbanov, P.S. Regional Water Resources Assessment using Water Scarcity Pinch Analysis. Resour. Conserv. Recycl. 2020, 157, 104749. [Google Scholar] [CrossRef]
  6. Al-Jawad, J.Y.; Alsaffar, H.M.; Bertram, D.; Kalin, R.M. A comprehensive optimum integrated water resources management approach for multidisciplinary water resources management problems. J. Environ. Manag. 2019, 239, 211–224. [Google Scholar] [CrossRef]
  7. Lavrnić, S.; Zapater-Pereyra, M.; Mancini, M.L. Water Scarcity and Wastewater Reuse Standards in Southern Europe: Focus on Agriculture. Water. Air. Soil Pollut. 2017, 228, 251. [Google Scholar] [CrossRef]
  8. European Commission. Commission Staff Working Document—Leading the Way to a Global Circular Economy: State of Play and Outlook; SWD 100; European Commission: Brussels, Belgium, 2020. [Google Scholar]
  9. European Environment Agency. Water Scarcity and Drought; European Environment Agency: Copenhagen, Denmark, 2010. [Google Scholar]
  10. European Commission. Communication from the Commission. Circular Economy Action Plan for a Cleaner and More Competitive Europe; COM 98; European Commission: Brussels, Belgium, 2020. [Google Scholar]
  11. European Commission. Communication from the Commission: The European Green Deal; COM 640; European Commission: Brussels, Belgium, 2019. [Google Scholar]
  12. Smol, M. Circular economy approach in the water and wastewater sector. In Circular Economy and Sustainability; Elsevier: Amsterdam, The Netherlands, 2021; pp. 1–19. [Google Scholar]
  13. Tahir, S.; Steele, K.; Steichen, M.S.T.; Penning, P.; Martin, N. Water and Circular Economy: A White Paper. 2018. Available online: https://ceowatermandate.org/resources/water-and-circular-economy-2018/ (accessed on 10 October 2021).
  14. Smol, M.; Adam, C.; Preisner, M. Circular economy model framework in the European water and wastewater sector. J. Mater. Cycles Waste Manag. 2020, 22, 682–697. [Google Scholar] [CrossRef] [Green Version]
  15. European Commission. A Monitoring Framework for the Circular Economy; COM 29; European Commission: Brussels, Belgium, 2018. [Google Scholar]
  16. Smol, M. Inventory and Comparison of Performance Indicators in Circular Economy Roadmaps of the European Countries. Circ. Econ. Sustain. 2021. [Google Scholar] [CrossRef]
  17. Smol, M.; Marcinek, P.; Duda, J.; Szołdrowska, D. Importance of sustainable mineral resource management in implementing the circular economy (CE) model and the european green deal strategy. Resources 2020, 9, 55. [Google Scholar] [CrossRef]
  18. Barquet, K.; Järnberg, L.; Rosemarin, A.; Macura, B. Identifying barriers and opportunities for a circular phosphorus economy in the Baltic Sea region. Water Res. 2020, 171, 115433. [Google Scholar] [CrossRef] [PubMed]
  19. Smol, M. Inventory of Wastes Generated in Polish Sewage Sludge Incineration Plants and Their Possible Circular Management Directions. Resources 2020, 9, 91. [Google Scholar] [CrossRef]
  20. Smol, M.; Duda, J.; Czaplicka-Kotas, A.; Szołdrowska, D. Transformation towards circular economy (CE) in municipal waste management system: Model solutions for Poland. Sustainability 2020, 12, 4561. [Google Scholar] [CrossRef]
  21. Global Reporting Initiative. Performance Indicators; GRI: Amsterdam, The Netherlands, 2016. [Google Scholar]
  22. United Nations General Assembly. United Nations Resolution Adopted by the General Assembly on 25 September 2015. Transforming Our World: The 2030 Agenda for Sustainable Development; A/RES/70/1; United Nations: New York, NY, USA, 2015. [Google Scholar] [CrossRef]
  23. European Commission. Raw Materials Scoreboard; European Commission: Brussels, Belgium, 2016; ISBN 9789279616990. [Google Scholar]
  24. European Environment Agency (EEA). Digest of EEA indicators 2014. In EEA Technical Report; European Environment Agency; Publications Office of the European Union: Luxembourg, 2016. [Google Scholar]
  25. Janik, A.; Ryszko, A. Circular economy in companies: An analysis of selected indicators from a managerial perspective. Multidiscip. Asp. Prod. Eng. 2019, 2, 523–535. [Google Scholar] [CrossRef] [Green Version]
  26. McKinsey & Company. Europe’s Circular—Economy Opportunity; Mckinsey & Company: New York, NY, USA, 2015; pp. 1–7. [Google Scholar]
  27. Latawiec, A.; Agol, D. Sustainability Indicators in Practice; De Gruyter Open: Berlin, Germany; Warsaw, Poland, 2015; ISBN 9783110450491. [Google Scholar]
  28. Van Hoof, V.; Maarten, C.; Vercalsteren, A. Indicators for a Circular Economy. 2018. Available online: https://ce-center.vlaanderen-circulair.be/en/publications/publication/1-indicators-for-a-circular-economy (accessed on 14 October 2021).
  29. European Environment Agency (EEA). Circular Economy in Europe—Developing the Knowledge Base; European Environment Agency; Publications Office of the European Union: Luxembourg, 2016.
  30. European Commission. EU Resource Efficiency Scoreboard 2015; European Commission: Brussels, Belgium, 2016; ISBN 15525260. [Google Scholar]
  31. Organization for Economic Co-operation and Development (OECD). Green Growth Indicators 2014; OECD: Paris, France, 2014; ISBN 9789264202030. [Google Scholar]
  32. World Bank. The Little Green Data Book; World Bank: Washington, DC, USA, 2017; ISBN 9781464810343. [Google Scholar]
  33. WBCSD. Circular Transition Indicators V2.0. Metrics for Business, by Business. 2021. Available online: https://www.wbcsd.org/Programs/Circular-Economy/Factor-10/Metrics-Measurement/Resources/Circular-Transition-Indicators-v2.0-Metrics-for-business-by-business (accessed on 14 October 2021).
  34. Garza-Reyes, J.A.; Salomé Valls, A.; Peter Nadeem, S.; Anosike, A.; Kumar, V. A circularity measurement toolkit for manufacturing SMEs. Int. J. Prod. Res. 2019, 57, 7319–7343. [Google Scholar] [CrossRef]
  35. Santibanez Gonzalez, E.D.R.; Koh, L.; Leung, J. Towards a Circular Economy Production System: Trends and Challenges for Operations Management. Int. J. Prod. Res. 2019, 57, 7209–7218. [Google Scholar] [CrossRef]
  36. Gustavsson, J.; Svaren, S. Generating Design Improvements Using Circularity Indicators—A Case Study on How to Measure, Increase and Evaluate the Circularity of a Fully-Automated Coffee Machine. Master’s Thesis, Linköping University, Linköping, Sweden, 2021. [Google Scholar]
  37. Sartal, A.; Ozcelik, N.; Rodriguez, M. Bringing the circular economy closer to small and medium enterprises: Improving water circularity without damaging plant productivity. J. Clean. Prod. 2020, 256, 120363. [Google Scholar] [CrossRef]
  38. Franconi, E.; Bridgeland, B.; Webster, K. A New Dynamic 2—Effective Systems in a Circular Economy; Ellen MacArthur Foundation Publishing: Isle of Wight, UK, 2016; ISBN 978-0-9927784-4-6. [Google Scholar]
  39. Scheepens, A.E.; Vogtlander, J.G.; Brezet, J.C. Two life cycle assessment (LCA) based methods to analyse and design complex (regional) circular economy systems. Case: Making water tourism more sustainable. J. Clean. Prod. 2016, 114, 257–268. [Google Scholar] [CrossRef]
  40. Morris, J. Developing and exploring indicators of water sustainable development. Heliyon 2019, 5, e01778. [Google Scholar] [CrossRef] [Green Version]
  41. Di Maio, F.; Rem, P.C.; Baldé, K.; Polder, M. Measuring resource efficiency and circular economy: A market value approach. Resour. Conserv. Recycl. 2017, 122, 163–171. [Google Scholar] [CrossRef]
  42. European Union. Directive 2018/851 amending Directive 2008/98/EC on waste Framework. Off. J. Eur. Union 2018, L-150, 109–140. [Google Scholar]
  43. Marcinek, P.; Smol, M. Bioeconomy as one of the key areas of implementing a circular economy (CE) in Poland. Environ. Res. Eng. Manag. 2020, 76, 20–31. [Google Scholar] [CrossRef]
  44. Bianchini, A.; Rossi, J. Design, implementation and assessment of a more sustainable model to manage plastic waste at sport events. J. Clean. Prod. 2021, 281, 125345. [Google Scholar] [CrossRef]
  45. Ramm, K. Considerations Related to the Application of the EU Water Reuse Regulation to the Production of Snow from Reclaimed Water. Circ. Econ. Sustain. 2021. [Google Scholar] [CrossRef]
  46. Angioletti, C.M.; Despeisse, M.; Rocca, R. Product Circularity Assessment Methodology. IFIP Int. Fed. Inf. Process. 2017, 514, 411–418. [Google Scholar] [CrossRef] [Green Version]
  47. Niero, M.; Kalbar, P.P. Coupling material circularity indicators and life cycle based indicators: A proposal to advance the assessment of circular economy strategies at the product level. Resour. Conserv. Recycl. 2019, 140, 305–312. [Google Scholar] [CrossRef]
  48. Harris, S.; Martin, M.; Diener, D. Circularity for circularity’s sake? Scoping review of assessment methods for environmental performance in the circular economy. Sustain. Prod. Consum. 2021, 26, 172–186. [Google Scholar] [CrossRef]
  49. Otero, J.C. Circularity Assessment for Companies: Elements for a General Framework—Challenge Lab 2015: Sustainable urban development. Master’s Thesis, Chalmers University of Technology, Gothenburg, Sweden, 2015. [Google Scholar]
  50. Pauer, E.; Wohner, B.; Heinrich, V.; Tacker, M. Assessing the environmental sustainability of food packaging: An extended life cycle assessment including packaging-related food losses and waste and circularity assessment. Sustainability 2019, 11, 925. [Google Scholar] [CrossRef] [Green Version]
  51. Towa, E.; Zeller, V.; Achten, M.J.W. Assessing the circularity of regions: Stakes of trade of waste for treatment. J. Ind. Ecol. 2021, 25, 834–847. [Google Scholar] [CrossRef]
  52. Virtanen, M.; Manskinen, K.; Uusitalo, V.; Syvänne, J.; Cura, K. Regional material flow tools to promote circular economy. J. Clean. Prod. 2019, 235, 1020–1025. [Google Scholar] [CrossRef]
  53. Silano, V.; Barat Baviera, J.M.; Bolognesi, C.; Chesson, A.; Cocconcelli, P.S.; Crebelli, R.; Gott, D.M.; Grob, K.; Lambré, C.; Mengelers, M.; et al. Safety assessment of the process Veolia URRC used to recycle post-consumer PET into food contact materials. EFSA J. 2020, 18, e06125. [Google Scholar]
  54. Hermann, L.; Schaaf, T. Outotec (AshDec®) process for P fertilizers from sludge ash. Phosphorus Recover. Recycl. 2018, 15, 221–233. [Google Scholar] [CrossRef]
Figure 1. The research framework.
Resources 10 00129 g001
Table 1. CE model in the water and wastewater sector (own based on [14]).
Element of the CE ModelDescription
Reduction (removal)prevent wastewater generation in the first place by the reduction of water usage and pollution reduction at source
Removalapplication of effective technologies for the prevention of inclusion of hazardous pollutants into wastewater and removal of pollutants from water and sewage
Reusereuse of wastewater as an alternative source of water supply (non-potable usage)
Recyclingrecovery or reclamation of water from wastewater for potable usage
Recoveryrecovery of resources as nutrients and energy from water-based waste
Lanfillinglanfilling of waste
Rethinkrethinking how to use of resources to create a sustainable economy which is free of waste and emissions
Table 2. Groups of circularity indicators in the documents of international organizations [19,20,21,22,23,24,25,26,27,28].
ProgrammeThematic AreaNumber of All IndicatorsNumber of Water-Related IndicatorsNumber of Economc IndicatorsSource
EEA. Digest indicators1. Climate state and impact indicators
2. Air pollutant emissions,
3. Energy indicators
4. Industrial pollution indicators
5. Land and soil indicators
6. Marine indicators
7. Outlook indicators
8. Sustainable consumption and production
9. Streamlining European biodiversity indicators
10. Transport and environment reporting mechanism
11. Water indicators
12. Water resource efficiency indicators
13. Waste indicators
122376[24]
EEA. Circular economy in Europe1. Material input
2. Eco-design
3. Production
4. Consumption
5. Waste recycling
1800[29]
EC. Raw Materials Scoreboard1. Raw materials in the global context
2. Competitiveness and Innovation
3. Framework conditions for mining
4. Circular economy and recycling
5. Environmental and social sustainability
27110[23]
EC. Resource Efficiency Scoreboard1. Lead Indicator
2. Dashboard Indicators
3. Thematic indicator
3227[30]
EUROSTAT. Circular Economy indicators1. Production and consumption
2. Waste management
3. Secondary raw materials
4. Competitiveness and innovation
1002[15]
OECD. Green Growth indicators1. Environmental and resource productivity
2. Natural asset base
3. Environmental dimension of quality of life
4. Economic opportunities and policy responses
1531756[31]
Global reporting initiative (GRI)1. Environmental
2. Economic
3. Social
9139[21]
The World Bank. Little Green data book1. Economic
2. Agriculture
3. Forests and biodiversity
4. Oceans
5. Energy and emissions
6. Water and sanitation
7. Environmental and health
8. National accounting aggregates
4389[32]
UN. Sustainable Deve-lopment Goals1. No poverty
2. Zero hunger
3. Good health and well-being
4. Quality education
5. Gender equality
6. Clean water and sanitation
7. Affordable and clean energy
8. Decent work and economic growth
9. Industry, innovation and infrastructure
10. Reduce inequalities
11. Sustainable cities and communites
12. Responsible consumption and production
13. Climate action
14. Life below water
15. Life on land
16. Peace, justice and strong institutions
17. Partnership for the gols
2311175[22]
World Business Council for Sustainable Development (WBCSD)1. Close the Loop
2. Optimize the Loop
3. Value the Loop
910[33]
Table 3. Circularity indicators in scientific papers.
IndicatorLife Cycle StagesSustainability PillarsCircular LevelSource
Circularity Measurement Toolkit (CMT)Full life cycleEnvironmental and EconomicMicro[34,35,36]
Improved Water Circularity Index (WCI)Make, RecoverEnvironmental and EconomicMicro, Macro[37]
Material Circularity Indicator (MCI)Full life cycleEnvironmentalMicro, Macro[38]
Eco-costs Value Ratio (EVR)Full life cycleEconomicMicro, Macro[39]
Water Sustainable Development Index (WSDI)MakeEnvironmental and SocialMicro, Macro[40]
Value-Based Resource Efficiency (VRE)Full life cycleEnvironmental and EconomicMacro[41]
Table 4. Proposed CE economic indicators in the water and wastewater sector.
Element of CE ModelIncome (Revenues)Expenses (Costs)Investments (Investment Financing)
Unit [Euro/Year]
ReduceNet revenues from less water consumption-Investments in equipment for the optimization of water usage
Reclamation
(Removal)
Net revenues from sales of drinking water Costs of water productionInvestments in equipment for the water purification
Net revenues from sales of wastewater treatment servicesCosts of wastewater treatment services Investments in equipment for the wastewater treatment
ReuseNet revenues from sales of non-drinking water Costs of non-drinking water production (costs of non-consumer water recovery)Investments in equipment for the water reuse
Net revenues for lower wastewater treatment services fees
Net revenues from the reduced water abstraction from the waterworks
RecyclingNet revenues from sales of drinking waterCosts of drinking water production (costs of consumer water recovery) Investments in equipment for the water recycling
Net revenues for lower wastewater treatment services fees
Net revenues from the reduced water abstraction from the waterworks
RecoveryNet revenues from sales of electricity Costs of electricity productionInvestments in equipment for the energy recovery
Net revenues from the sale of fertilizers Costs of fertilizers production Investments in equipment for the nutrients recovery
Net revenues for lower wastewater treatment services fees Costs of materials productionInvestments in equipment for the materials recovery
Landfilling-fees for waste landfillingInvestments in infrastructure for waste landfilling
Publisher’s Note: MDPI stays neutral with regard to jurisdictional claims in published maps and institutional affiliations.

